Abstract
Coal mining, an important human activity, disturbs soil organic carbon (SOC) accumulation and decomposition, eventually affecting terrestrial carbon cycling and the sustainability of human society. However, changes of SOC content and their relation with influential factors in coal mining areas remained unclear. In the study, predictive models of SOC content were developed based on field sampling and Landsat images for different land-use types (grassland, forest, farmland, and bare land) of the largest coal mining area in China (i.e., Shendong). The established models were employed to estimate SOC content across the Shendong mining area during 1990–2020, followed by an investigation into the impacts of climate change and human disturbance on SOC content by a Geo-detector. Results showed that the models produced satisfactory results (R2 > 0.69, p < 0.05), demonstrating that SOC content over a large coal mining area can be effectively assessed using remote sensing techniques. Results revealed that average SOC content in the study area rose from 5.67 gC·kg−1 in 1990 to 9.23 gC·kg−1 in 2010 and then declined to 5.31 gC·Kg−1 in 2020. This could be attributed to the interaction between the disturbance of soil caused by coal mining and the improvement of eco-environment by land reclamation. Spatially, the SOC content of farmland was the highest, followed by grassland, and that of bare land was the lowest. SOC accumulation was inhibited by coal mining activities, with the effect of high-intensity mining being lower than that of moderate- and low-intensity mining activities. Land use was found to be the strongest individual influencing factor for SOC content changes, while the interaction between vegetation coverage and precipitation exerted the most significant influence on the variability of SOC content. Furthermore, the influence of mining intensity combined with precipitation was 10 times higher than that of mining intensity alone.
1. Introduction
Coal has been widely acknowledged as an important energy source for humankind, while coal-generated power accounts for over 60% of the total power in China [1]. However, coal mining destroys soil structure, induces changes in soil physicochemical properties, and alters the spatio-temporal distribution of soil organic carbon (SOC) [2,3]. Soil systems, the largest carbon pool in the terrestrial ecosystem, play an essential role in carbon sequestration and emission across the world [4,5]. SOC is an important component of global carbon cycling, and is also crucial for biogeochemical cycles and growth of plants and microorganisms [6,7,8]. The changes in SOC may lead to variation in greenhouse gas concentration and affect global climate [9,10], thereby impacting water resources, soil quality, food production, and the sustainable development of eco-environment and socio-economy [11]. Recently, there has been an ever-increasing demand for coal resources. The scale of coal mining has continuously expanded [12,13], which has resulted in severe disturbance to soil and notable changes in the SOC content. Therefore, it is essential to clearly understand the change process of SOC content in coal mining areas.
Previous studies have investigated SOC content changes in farmlands [14,15,16], forests [17,18,19], grasslands [20,21] wetlands [22,23,24] as well as their influential factors. They found that SOC content changes were primarily affected by climate, landform, and land-use types [25,26,27,28]. Coal mining areas contain a variety of ecosystems, while mining activities lead to disturbances to the ecosystems and SOC influential factors such as soil property and vegetation. The variation of SOC contents within the ecosystems thus becomes more complicated than areas without mining activities [29]. A thorough understanding of SOC content changes within coal mining areas is needed. However, few studies investigated SOC content in coal mining areas [30].
Furthermore, coal mining leads to surface disturbance and subsurface preferential runoff, as well as intensified soil erosion, and reduced vegetation coverage and biodiversity [31,32]. These changes, along with the local climatic variations (e.g., temperature and humidity) ultimately result in a lowered SOC accumulation and accelerated SOC decomposition [33,34,35,36]. Various reclamation measures have been implemented to restore SOC content to the level of periods without mining activities [37,38]. An in-depth understanding of SOC content changes and its relation with impacting factors provides a crucial reference to the development and implementation of the reclamation strategies. Previous studies have investigated SOC content changes and their influencing factors in opencast coal mines [39,40], mining subsidence areas [35,36,41], and areas with different reclamation measures [37,38]. Those studies were primarily undertaken on a local-scale and thus incapable of reflecting the spatial pattern of SOC changes over a large area in the context of intensive mining activities. Therefore, a large-scale study was needed to understand the SOC content changes and their relation with influential factors and to facilitate the land reclamation.
The methods employed to study the spatial distribution of SOC content primarily include profile estimation algorithm [42,43], model simulation [44,45], geostatistics [46,47,48] and remote sensing-based prediction models [49,50,51,52,53,54]. Field soil sampling is traditionally employed to study SOC content changes. However, it is labor and cost intensive, which present vast difficulty for an application of the method over a large area [55]. Meanwhile, the accuracy of profile estimation algorithm, model simulation and geostatistics is often challenged on areas with sparse sampling points [56,57,58,59]. In contrast, remote sensing techniques are able to reflect the spatial variability of SOC content in a real-time, efficient, and low-cost manner. Thus, it is presumably able to overcome the drawbacks of the abovementioned methods [50,56,59].
Several previous studies have explored the spatial variability of SOC content using remote sensing techniques. For example, Frazier and Cheng [50] studied SOC content changes in Palouse in eastern Washington State, USA using different Landsat-TM bands. Levine et al. [49] established a regression model between the normalized difference vegetation index (NDVI) and SOC content in Maine, USA, and demonstrated that the SOC content rose with the decrease of NDVI. Feng et al. [51] studied the relationship between surface SOC content and the pixel values of red, green, and blue bands of local aerial images in Georgia of southern USA. They found that high-resolution remote sensing images of bare soil could be used to model the spatial variability of surface SOC. So far, few SOC prediction models have been established for coal mining areas. In addition, the difference of SOC content for different land use types was seldom considered in contemporary prediction models [17,60].
In this study, the variation and driving mechanisms of SOC in coal mining areas were explored by remote sensing and field sampling in Shenfu Dongshen (Shendong) mining area in China. First, prediction models were established for different land-use types (grassland, forest land, farmland, and bare land) through field sampling and Landsat data. Afterwards, the spatial distribution of the SOC content in 1990–2020 was achieved based on Landsat data and prediction models, followed by an analysis of the spatial pattern of the SOC content and its relation with influencing factors including precipitation, temperature, mining intensity, and vegetation coverage.
2. Materials and Methods
2.1. Study Area
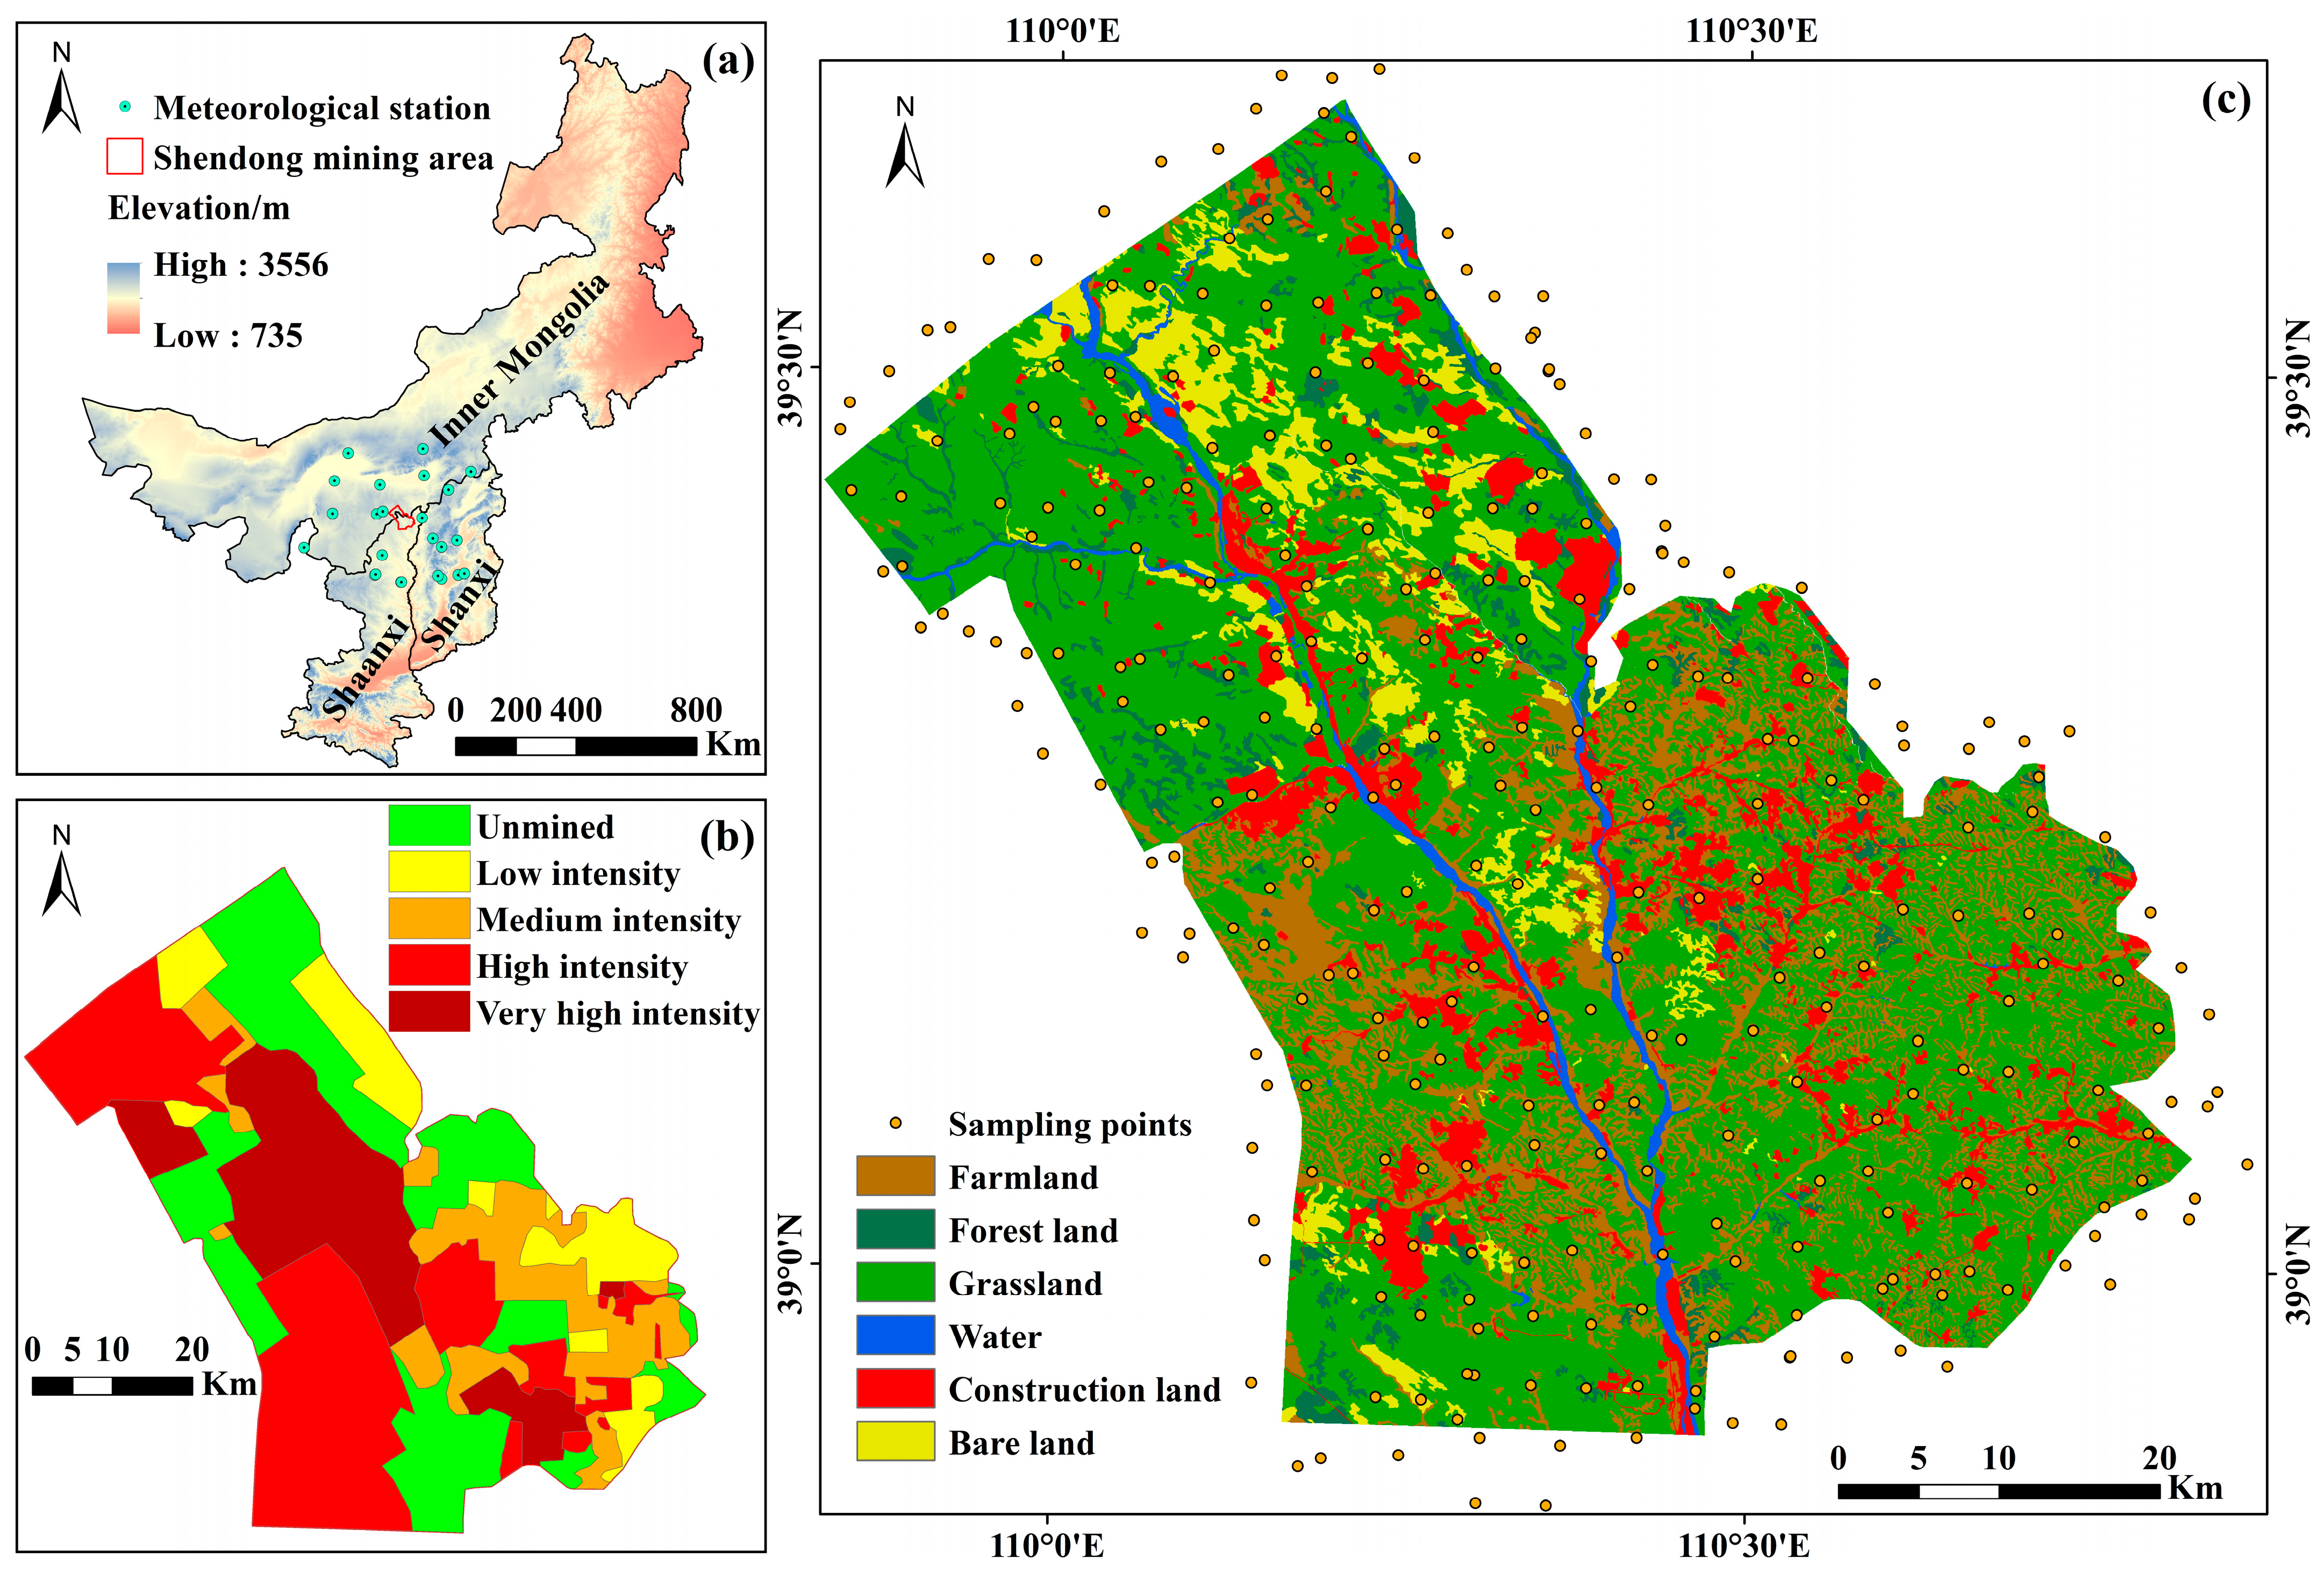
Shendong mining area (38°52′ N–39°41′ N, 109°51′ E–110°46′ E), located at the junction of Inner Mongolia, Shanxi and Shaanxi (Figure 1a), is the largest underground coal mining base in China. It has abundant coal reserves, with proved reserves of 2.3 × 10⁹ t. The mining area is located in the transitional zone between the Mu Us Desert and the Loess Plateau. It spans horizontally across 3355 km2 and vertically 945–1419 m above sea level. Gentle topography is commonly found in the western part of the study site, while hilly areas with fragmented and complex landforms dominate the east [61]. The study site is characterized by a typical arid desert plateau climate, with an average annual temperature and precipitation of 6.6 °C and 362 mm, respectively. The rainfall during July-September accounts for more than 70% of the annual precipitation, which is dominated by short-duration intensive rainstorms [62].
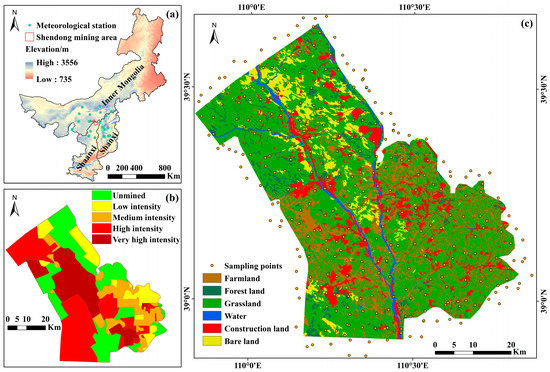
Figure 1.
Overview of the Shendong mining study area, including (a) the location and surrounding meteorological stations, (b) the classification of mining intensity, and (c) the distribution of sampling points and land cover of the study area in 2020.
Soil types in the study site mainly include loess, aeolian sandy soil, chestnut soil, and dark loessial soil. They are characterized by loose structure, poor erosion resistance, low fertility, and low pH. The study area is also a transitional zone between grasslands and forest-steppes, with sparse native vegetation covering less than 30% of the land surface [63]. Desert steppe, deciduous broad-leaved shrubs, and psammophytes are major vegetation types. The coal seam in the Shendong mining area has a simple structure, which is mainly exploited by the underground mining method. Since the end of the 20th century, the annual coal output of the Shendong area has gradually risen. In 2005, it became the largest coal production base in China by delivering 100 million t. In 2015, the output reached 7.55 × 10⁸ t, accounting for 20.13% of the coal production in China [63].
2.2. Data Acquisition and Processing
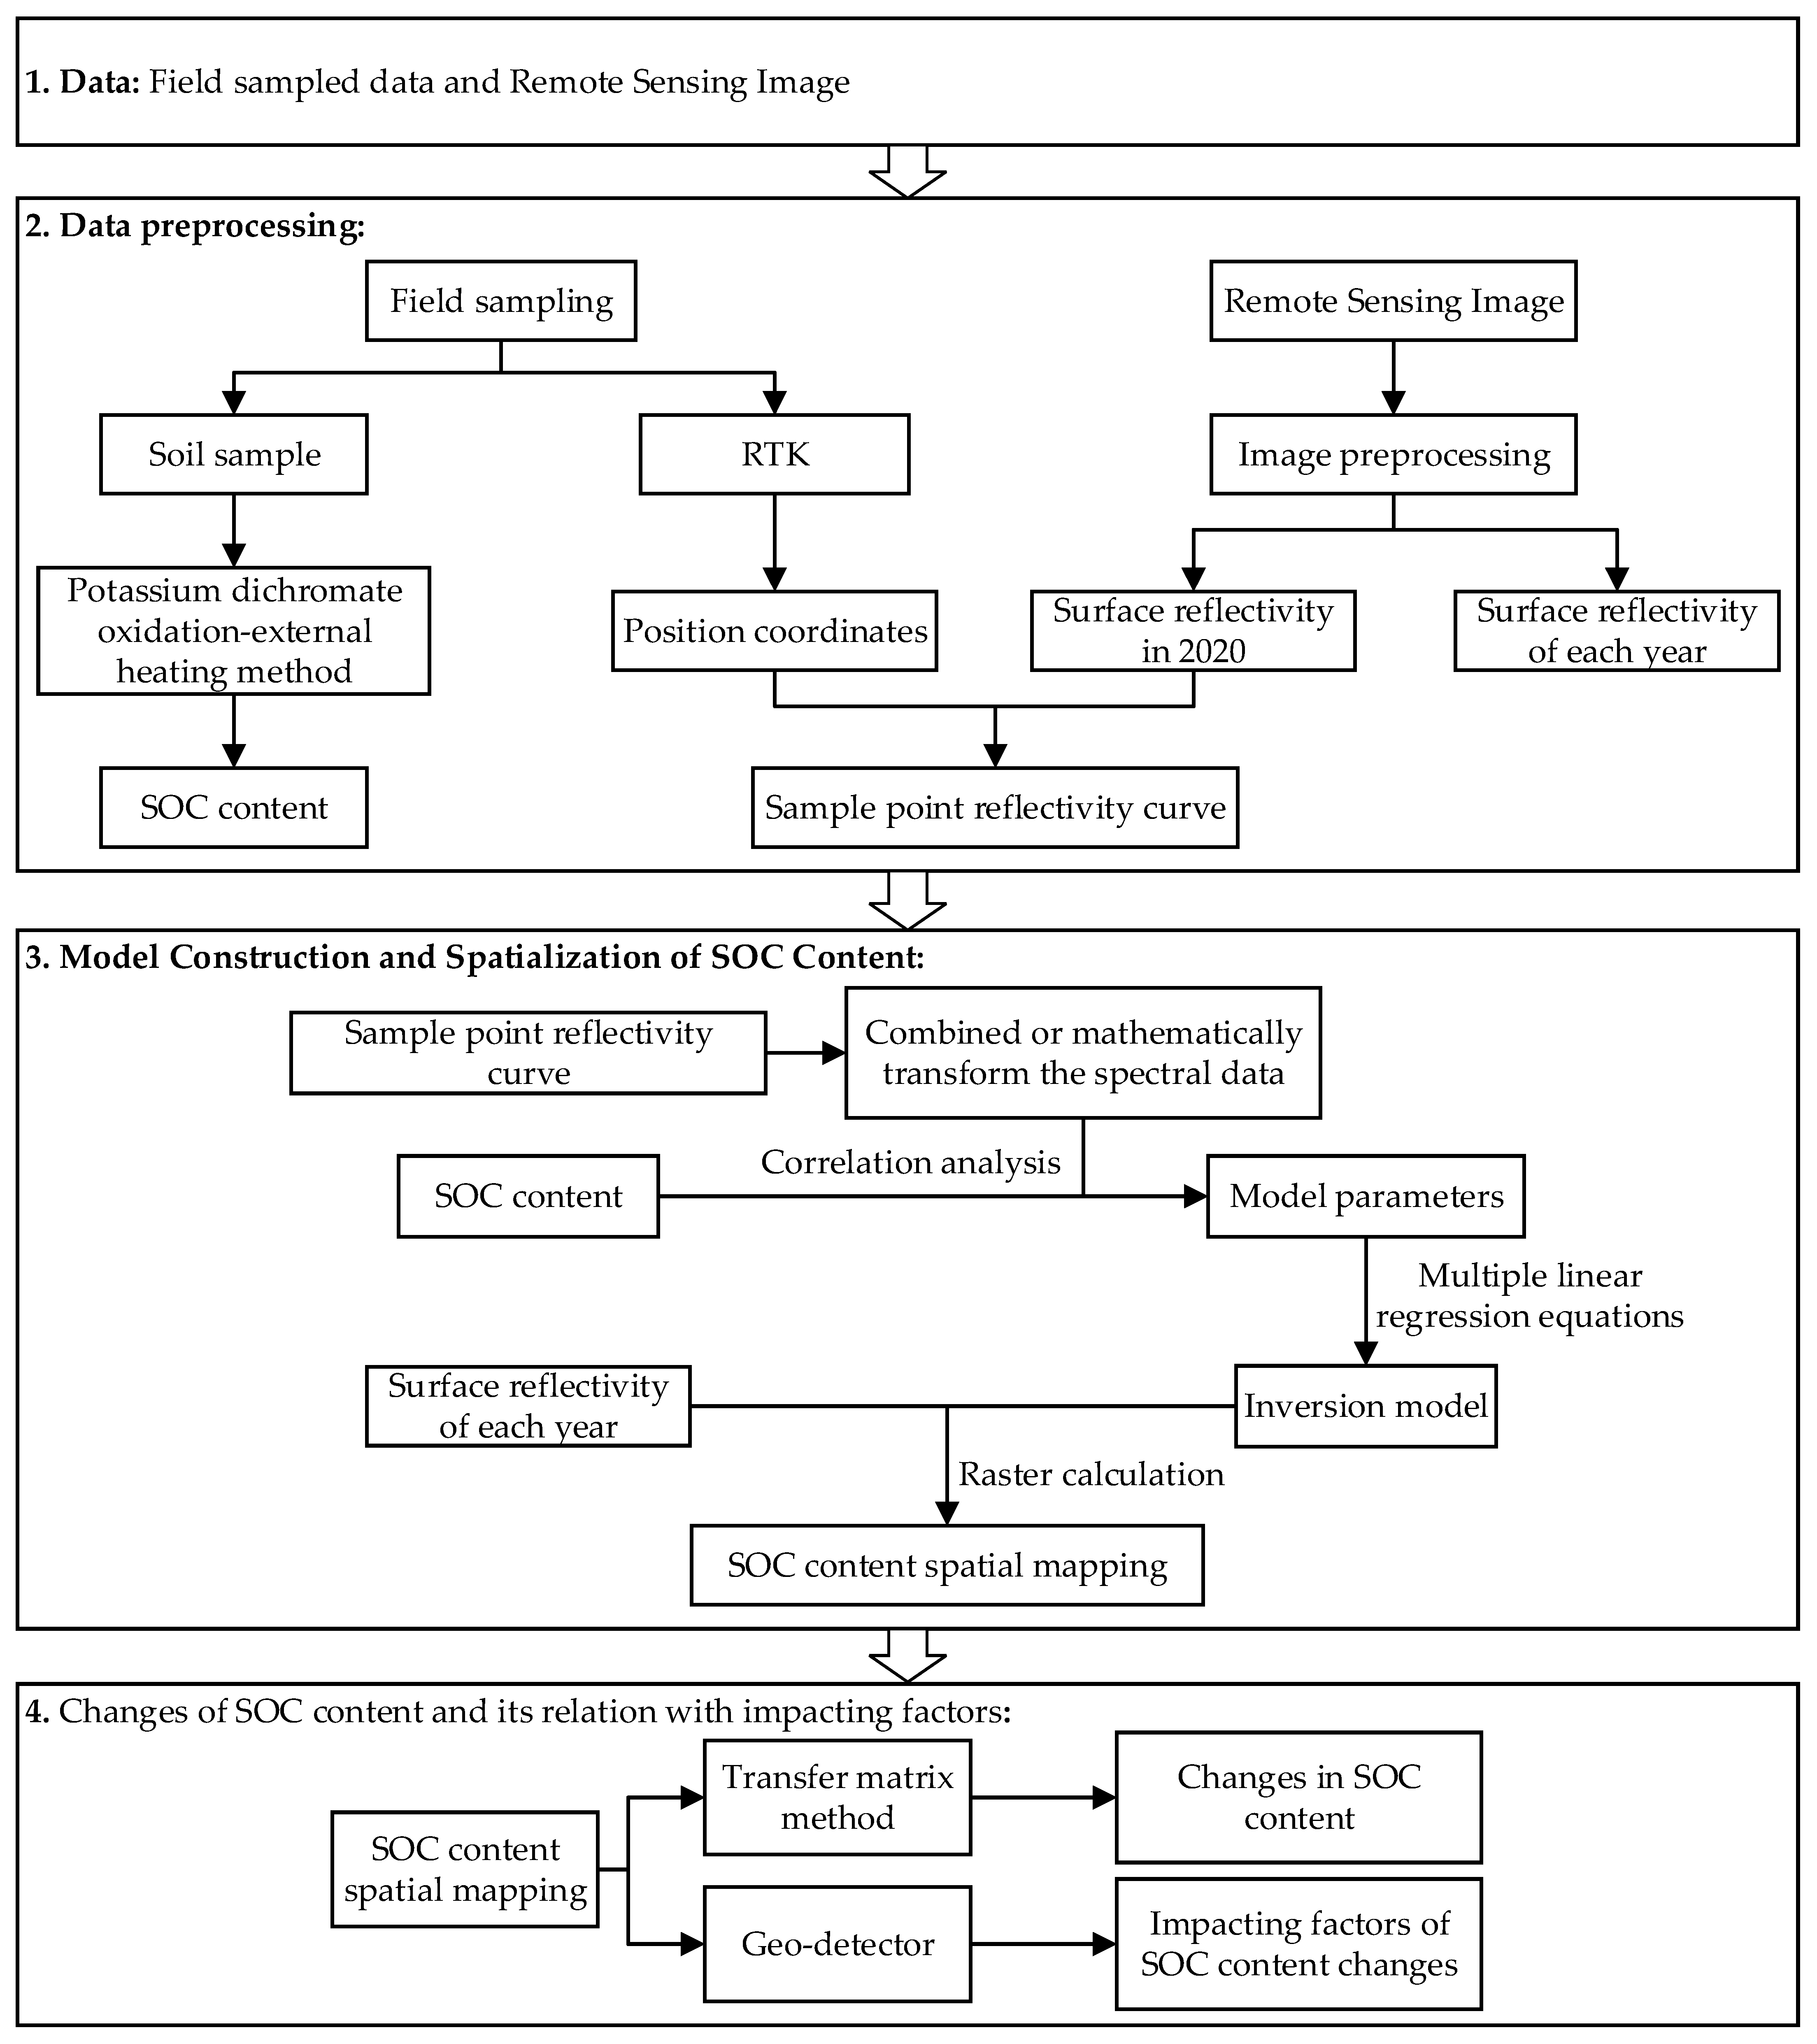
In the study, we firstly developed the SOC content prediction models based on field sampling and remote sensing images (Figure 2). The established models were then used to estimate the SOC content for the whole of Shendong coal mining area in 1990, 1995, 2000, 2005, 2010, 2015, and 2020. The changes in SOC content and their relations with different influential factors were also examined.
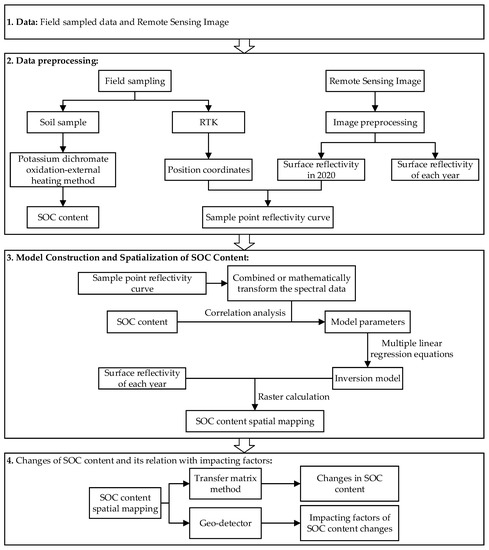
Figure 2.
The flowchart of the study.
2.2.1. Data Collection and Preprocessing
- (1)
- SOC content data
In October 2020, SOC field sampling was carried out. According to traffic, land-use, and by considering the uniformity of geographical distribution, a total of 300 field sampling were collected (Figure 1c), including 75 points in farmland, 54 points in forest land, 119 points in grassland, and 52 points in bare land. In order to ensure the accuracy of SOC content prediction in the study area, particularly the edge of the study area, the soil was sampled in some areas outside the study area. The location of each sampling point was determined by the global positioning system (GPS), while sampling time and soil surface condition were also recorded. To ensure soil sampling precision, composite samples (about 1 kg) were collected in ziplock bags, consisting of five soil samples in the surface layer (0–20 cm) within a 30 m × 30 m rectangle area using the diagonal sampling method. After drying in the shade, grinding, and sieving, the SOC content was measured by the potassium dichromate oxidation-external heating method [64].
- (2)
- Remote sensing images
In order to facilitate the development of SOC perdition models, remote sensing images with wide spectral range, enough bands and high resolution should be preferred. Meanwhile, a 30-year study period means that it was difficult to cover the whole period with the remote sensing data from a single sensor. Given the above, Landsat5 TM and Landsat8 OLI remote sensing images were selected in our study with the former being used for 1990–2010 and the latter being used for afterwards. The images were obtained from the official web-site of the United States Geological Survey (USGS) (https://earthexplorer.usgs.gov/ (accessed on 15 February 2021)). Owing to the fact that (1) the SOC content prediction model should be constructed according to the land use type and (2) the maximum value of Normalized Difference Vegetation Index (NDVI) in each year is required, a total of 21 images from July to September from 1990 to 2020 were selected (orbit No. 127-033, cloud cover <2%). Images were preprocessed using radiometric calibration, atmospheric correction, orthorectification, and cropping using ENVI 5.3.
- (3)
- Land use and vegetation coverage data
Land use data with a 30-m spatial resolution for 1990, 1995, 2000, 2005, 2010, 2015, and 2020 were obtained from the Data Center for Resources and Environmental Sciences, the Chinese Academy of Sciences (https://www.resdc.cn/ (accessed on 30 June 2021)). The data was derived based on Landsat imagery using the human visual interpretation method. The data have been acknowledged as the most accurate land use data production in China, and have been widely applied in the national land resource survey, hydrology and ecological research [65]. They were classified into six first-level classes according to the actual conditions in the study site.
The maximum NDVI (NDVImax) was derived based on the Landsat images to represent the spatial pattern of vegetation coverage. The NDVImax of the study area from 1990 to 2020 was calculated for 5-year intervals using Equation (1) based on the Landsat imagery from July to September of each year.
where, NIR is the reflection value in the near-infrared band, and R is the reflection value in the red band.
- Mining intensity data for the Shendong mining area
The Shendong coal mining area is dominated by the monoclinal structure with less fault development. The coal mining is dominated by an underground large-scale, high-intensity mechanized manner. Coal mining intensity can be determined by underground plane mining intensity and vertical mining intensity. In other words, the mining intensity mainly depends on the length and thickness of the coal seam being taken [66]. According to Fan et al. [66], the mining intensity in the Shendong mining area was classified into five levels: unmined, low-intensity mining, moderate-intensity mining, high-intensity mining, and extremely high-intensity mining (Figure 1b). The high-intensity mining area (28.9%) and unmined area (27.03%) accounted for the largest proportion, followed by extremely high-intensity mining, moderate-intensity mining, and low-intensity mining areas. The extremely high-intensity mining area was located between the Ulan Mulun River and the Kuye River, where 10-million-ton mines such as Daliuta and Huojitu were distributed. The high-intensity mining area was characterized by relatively continuous working faces, large coal mining height (1.3–4.5 m), and high coal output per unit area. In the moderate- and low-intensity mining areas, mechanized mining was not fully achieved. As a result, there were a small number of integrated coal mines with low capacity and relatively tattered working faces.
- (4)
- Meteorological and topographic data
We used the mean annual temperature and annual precipitation as covariates. Data on the temperature, precipitation, latitude, longitude, and altitude of the 24 meteorological stations around the Shendong mining area in 1990, 1995, 2000, 2005, 2010, 2015, and 2020 were obtained from the China Meteorological Data Network (http://data.cma.cn/ (accessed on 30 June 2021)) (Figure 1a). Mean annual temperature and annual precipitation were interpolated to continuous surfaces using kriging [67]. Cross-validation analysis was performed to verify the interpolation results, and the accuracy met the criteria of the optimal model [68] (for example, the correlation coefficient between measured precipitation and interpolation results in 2020 was 0.722).
In addition, Advanced Spaceborne Thermal Emission and Reflection Radiometer Global Digital Elevation Model (ASTER GDEM) data with a 30-m resolution were obtained from the Geospatial Data Cloud (https://www.gscloud.cn/ (accessed on 10 October 2020)), and a digital elevation model (DEM) of the study site was obtained through data coordinate transformation and clipping.
2.2.2. Establishment of Models of SOC Content
- (1)
- Band selection and analysis of SOC spectral properties
Based on the land-use status and field survey data, the atmospherically corrected images were subjected to analysis for SOC spectral curve to grasp the SOC spectral properties over the research site. In order to expand the difference between spectral properties, improve the correlation between SOC and reflectance data, while eliminating some noise that could not be eliminated in the preprocessing, we combined or mathematically transform the spectral data, including reciprocal (1/Bi), logarithmic (lg Bi), the logarithm of reciprocal (lg ), ratio (Bi/Bj), difference (Bi-Bj)), subtraction-addition (), and addition-subtraction (), where Bi, Bj represent the reflectivity of bands i and j (i, j = 2, 3, 4, 5, 6, 7. i ≠ j). Then, a correlation analysis was conducted between the SOC content of the soil samples and the spectral reflectivity or its mathematical transformation at each sampling point. The characteristic bands that were selected during modeling were extracted from the Landsat8 OLI image at each sampling point. Since both Landsat5 TM and Landsat8 OLI images needed to be used, it was necessary to select the common bands of the two images for modeling. The wavelength ranges of Band1–Band5 and Band7 bands in the Landsat5 TM image are similar to that of the Band2–Band7 bands in the Landsat8 OLI image, respectively. Therefore, only the characteristic bands (Band2–Band7) of Landsat8 OLI remote sensing images and their mathematical transformations were considered for modeling. When the constructed model was applied in periods with the Landsat5 TM image, the selected bands of Landsat 8 images were replaced by the corresponding bands of the Landsat5 TM image. The variables with higher correlation coefficient (R, Equation (2)) were selected as model covariates.
where and are the measured and mean value of the spectral reflectivity (mathematical transformation of reflectivity), and are the measured and mean value of the SOC content.
- (2)
- SOC content prediction models
For each land-use type, seventy percent of the sampling points were employed for training the model, while 30% were used for validation. The highly relevant spectral reflectivity (mathematical transformation form of reflectivity) were selected for modeling. The SOC remote sensing prediction models were fitted using multiple linear regression equations.
Finally, the model accuracy was assessed using the validation set, with the coefficient of determination R2 (Equation (3)) and the root mean square error (RMSE) (Equation (4)) being used as performance metrics.
where is the measured value, is the mean value, is the predicted value, and n is the number of samples.
2.2.3. Changes of SOC Content and Its Relation with Impacting Factors
- (1)
- Changes in SOC content
We used the SOC prediction model of each land use type to spatially map the SOC content in Shendong mining area. Therefore, vectors of mining areas and the SOC content maps were used to calculate the mean SOC content in mining areas with different mining intensities. According to the classification standard of SOC in the second general survey of soil in China [69], the SOC content was classified into 6 levels: I > 23.20 gC·kg−1, II = 17.40–23.20 gC·kg−1, III = 11.60–17.40 gC·kg−1, iv = 5.80–11.60 gC·kg−1, v = 3.48–5.80 gC·kg−1, and vi = 0.58–3.48 gC·kg−1.
Here, the changes in SOC content were studied using the transfer matrix method, which can describe the loss direction and source of SOC of each level within any two adjacent time periods in detail. In addition, the SOC content for the two time periods was mapped, resulting in a SOC content classification transformation map. Afterwards, the change process of SOC content was analyzed. The land-use transfer matrix used is given by the Equation (5):
where Mij is the area where the i-th level of SOC content of the previous year was transformed into the j-th level of SOC content of the following year, and n is the SOC content classification number in the study area.
- (2)
- Impacting factors of SOC content changes
Geo-detectors are powerful tools for detecting and analyzing spatial heterogeneity of specific variables [70]. The factor detector in a geo-detector is able to detect the explanatory power of the independent variable on the spatial heterogeneity of the dependent variable. The explanatory power is measured by the q value (Equation (6)), which ranges between [0,1]. The higher the value, the stronger the explanatory power of the independent variable on the dependent variable. The interaction detector can identify the interaction between different risk factors, i.e., whether the interaction between factors X1 and X2 will increase or decrease the explanatory power on the dependent variable, or whether these factors have an independent influence on Y.
The assessment involves to first calculate the q values of the two factors X1 and X2 for Y: q(X1) and q(X2), calculate the q value when they interact: q(X1∩X2), and then compare q(X1) and q(X2) with q(X1∩X2) > Max(q(X1), q(X2)). Furthermore, the correlations between the two factors includes q(X1∩X2) < Min(q(X1), q(X2)): non-linear weakening; Min(q(X1), q(X2)) < q(X1∩X2) < Max(q(X1),q(X2)): single-factor non-linear weakening; q(X1∩X2) > Max(q(X1), q(X2)): two-factor enhancement, q(X1∩X2) = q(X1) + q(X2): independent; and q(X1∩X2) > q(X1) + q(X2): non-linear enhancement.
where h = 1, …, L is the stratum of the variable Y or factor X, i.e., classification or partition; Nh and N are the number of units in the h layer and the whole area; and are the variance of the value in the h layer and the whole area, and SSW and SST are the sum of squares within and the sum of squares total, respectively.
The driving factors of the spatial heterogeneity of SOC content were explored using the geo-detector. Based on natural and human factors, six SOC influential factors were selected, including temperature, precipitation, elevation, NDVI, land use, and mining intensity. Since the geo-detector requires the input variables to be categorical, the factors were classified using equal-interval to divide the elevation, annual precipitation, and annual average temperature into nine categories. Moreover, NDVI was divided into eight levels (<0.3, 0.3–0.4, 0.4–0.5, 0.5–0.6, 0.6–0.7, 0.7–0.8, 0.8–0.9 and 0.9–1), and land-use type and mining intensity were classified according to their original categories.
3. Results
3.1. SOC of Soil Samples
The SOC content of the soils at sampling points ranged between 0.66 gC·kg−1 and 31.99 gC·kg−1, with an average of 6.03 gC·kg−1 and a standard deviation of 5.01 gC·kg−1. The mean SOC content was at its highest in the farmland, followed by grassland, while it reached the lowest in the bare land class (Table 1).

Table 1.
Statistical characteristics of SOC content at sampling points.
3.2. Established SOC Remote Sensing Prediction Models
Correlation analysis showed that 1/(B2 − B3), (B5 + B7)/(B2 − B3), and (B3 + B4)/(B5 − B6) had higher and significant correlations with the SOC content in the grassland (R > 0.5; p < 0.05), where B represents the corresponding bands of Landsat8 OLI data. In addition, both (B6 − B7)/(B1 + B7) and (B5 − B7)/(B1 + B2) had higher and significant correlations with the SOC content in forest class (R > 0.5; p < 0.05). Moreover, (B1 − B2)/(B1 + B2) and 1/(B3 − B7) revealed higher and significant correlations with the SOC content in the farmland (R > 0.5, p < 0.05). In the bare land, (B1 − B6)/(B1 + B2), (B1 + B3)/(B1 − B6), (B1 + B5)/(B2 − B4), and (B3 + B7)/(B2 − B6) were highly and significantly correlated with the SOC content (R > 0.5; p < 0.05). The SOC prediction models were established through linear regressions using the highly-correlated bands (Table 2).
Table 2.
SOC prediction models for different land-use types and precision.
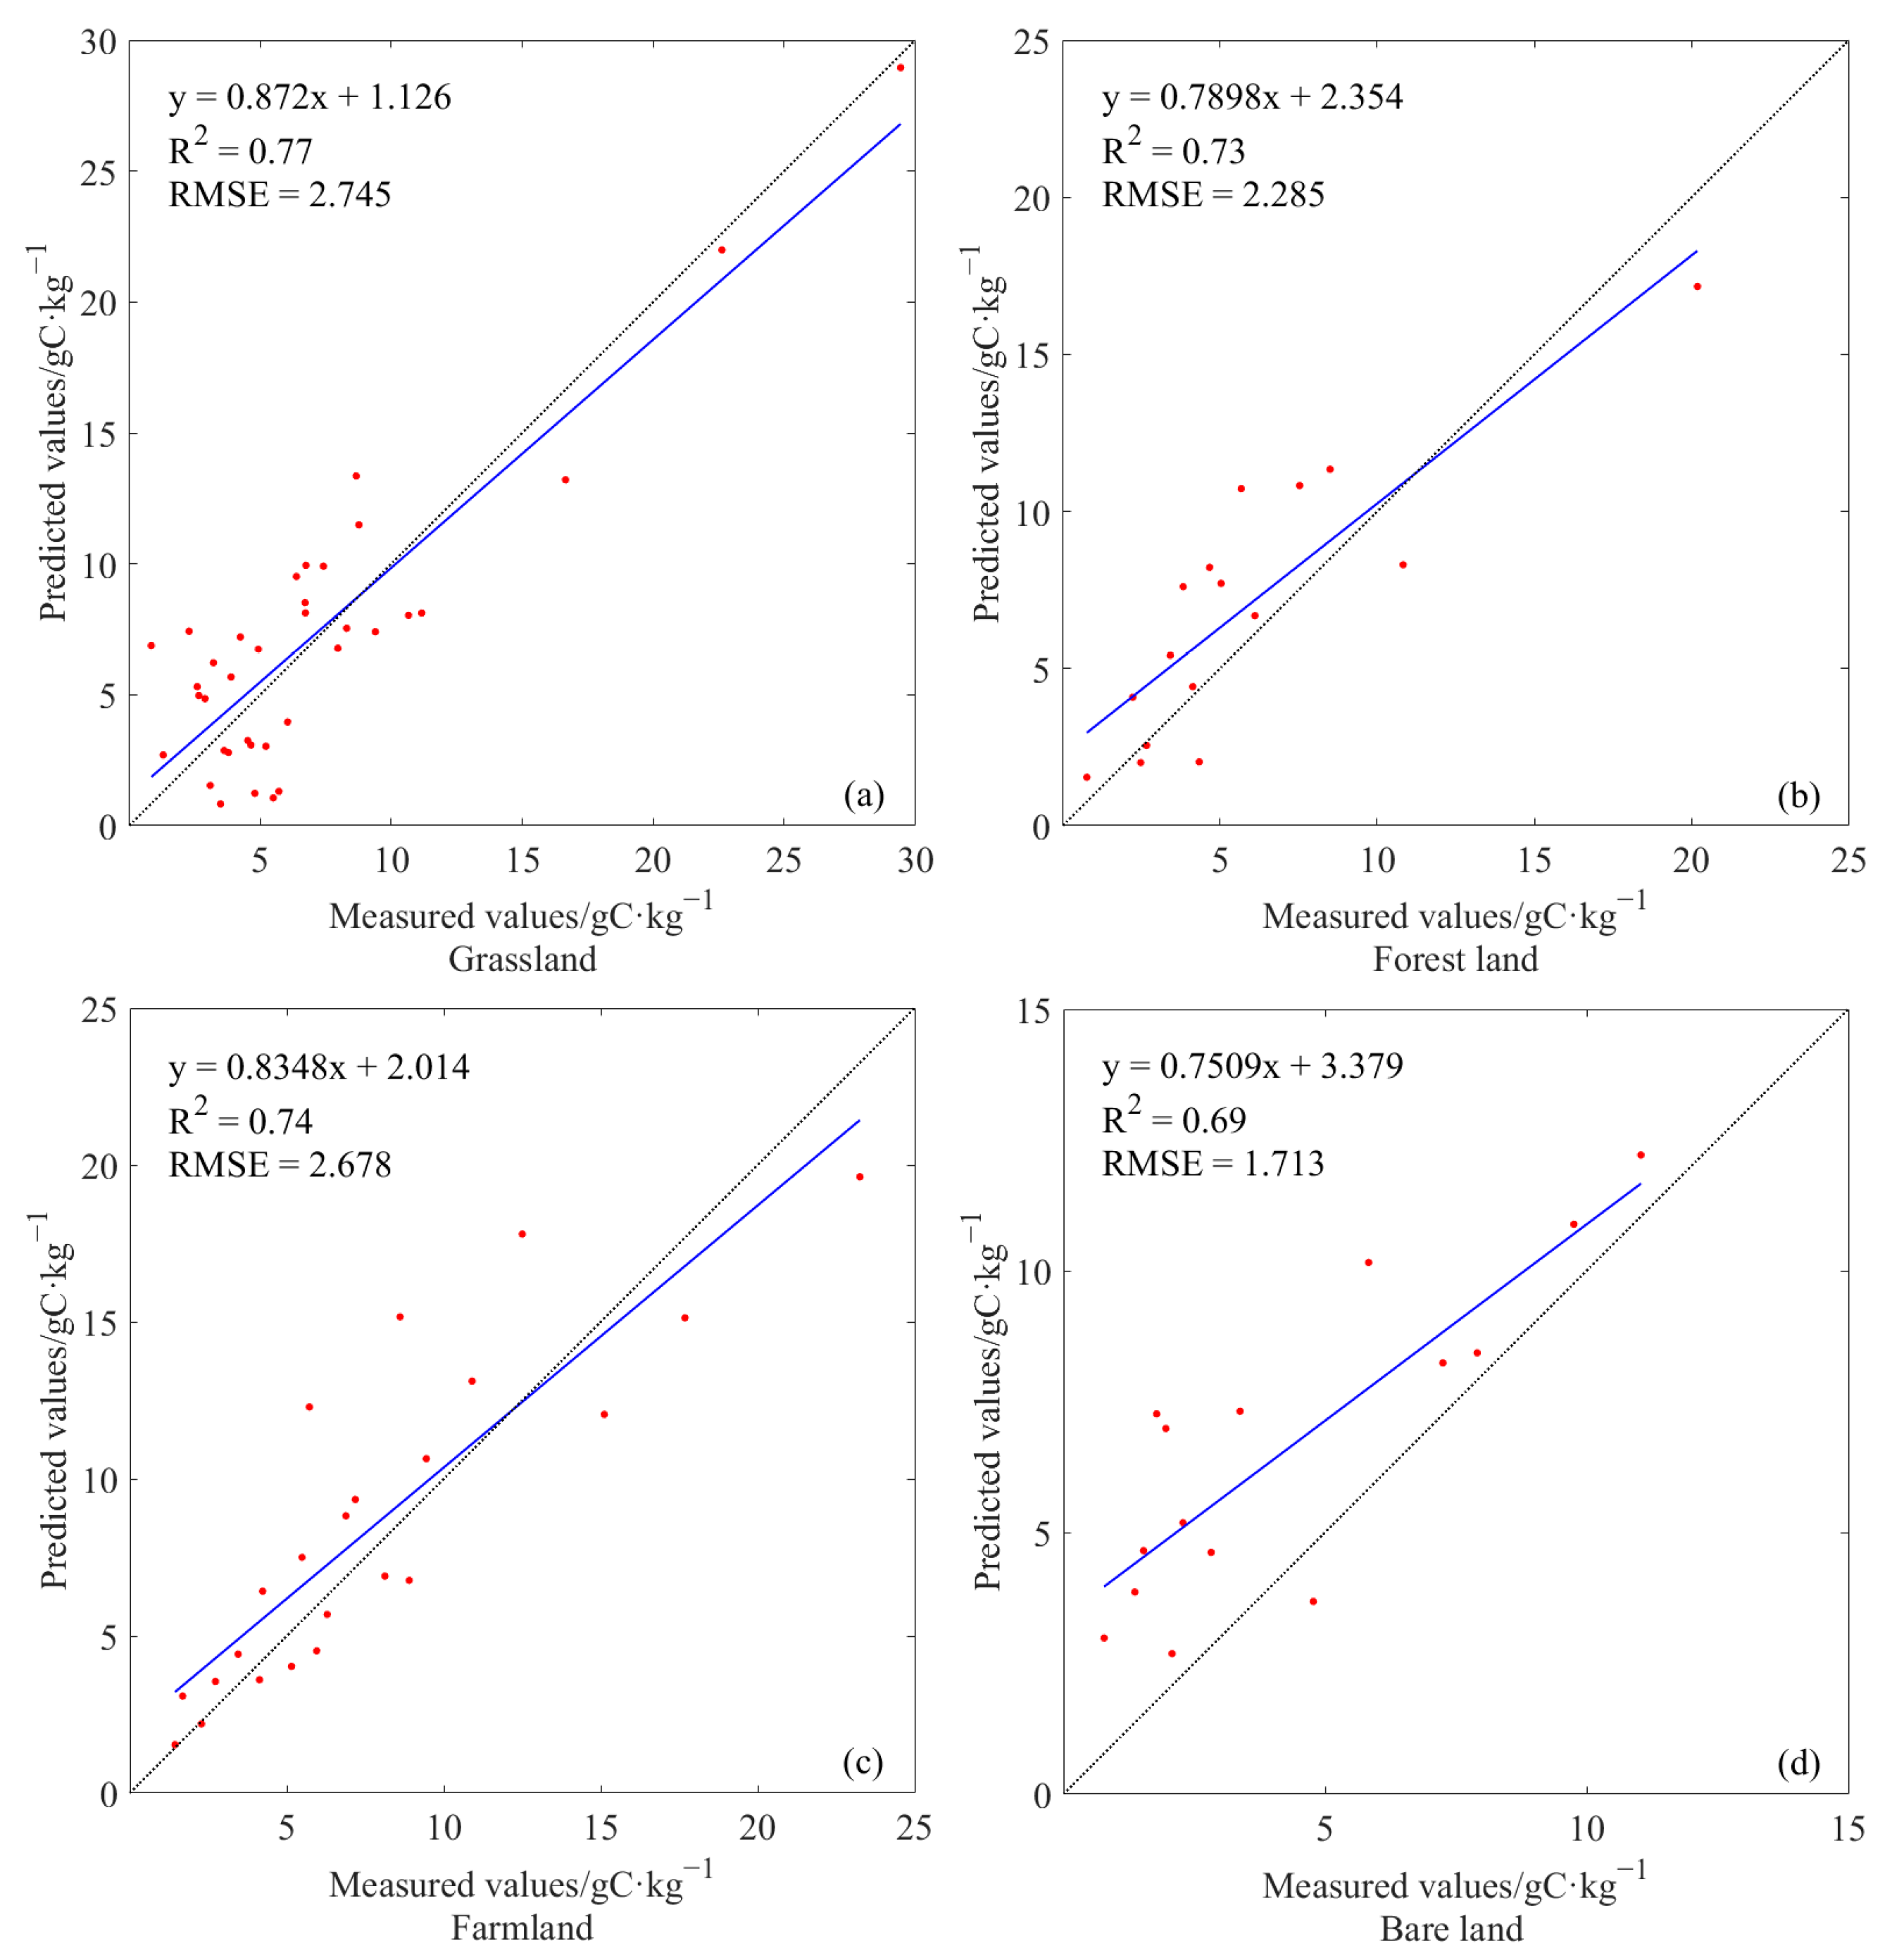
A validation of the prediction models demonstrated that R2 values for grassland, forest, and farmland were all significant and could reach above 0.73. Furthermore, the RMSEs were lower than 2.74 gC·kg−1, indicating that the models predict sufficiently accurate results. Both RMSE (1.71) and R2 (0.69) of the prediction model for bare land were slightly lower than that of other models (Figure 3).
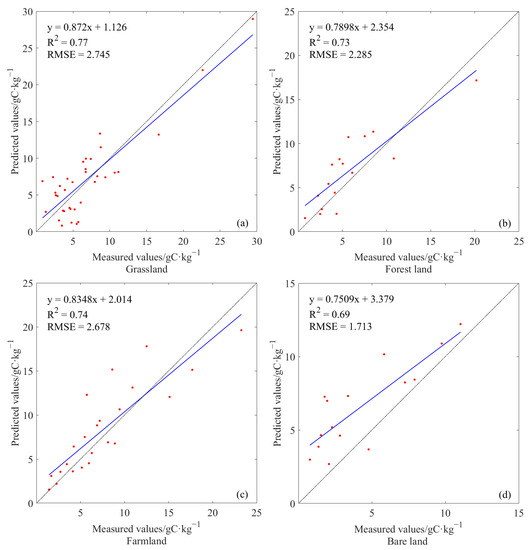
Figure 3.
Results of model validation including (a) grassland, (b) foresland, (c) farmland, and (d) bare land.
3.3. Changes of SOC in Shendong Mining Area
3.3.1. Spatial Patterns of SOC in Shendong Mining Area
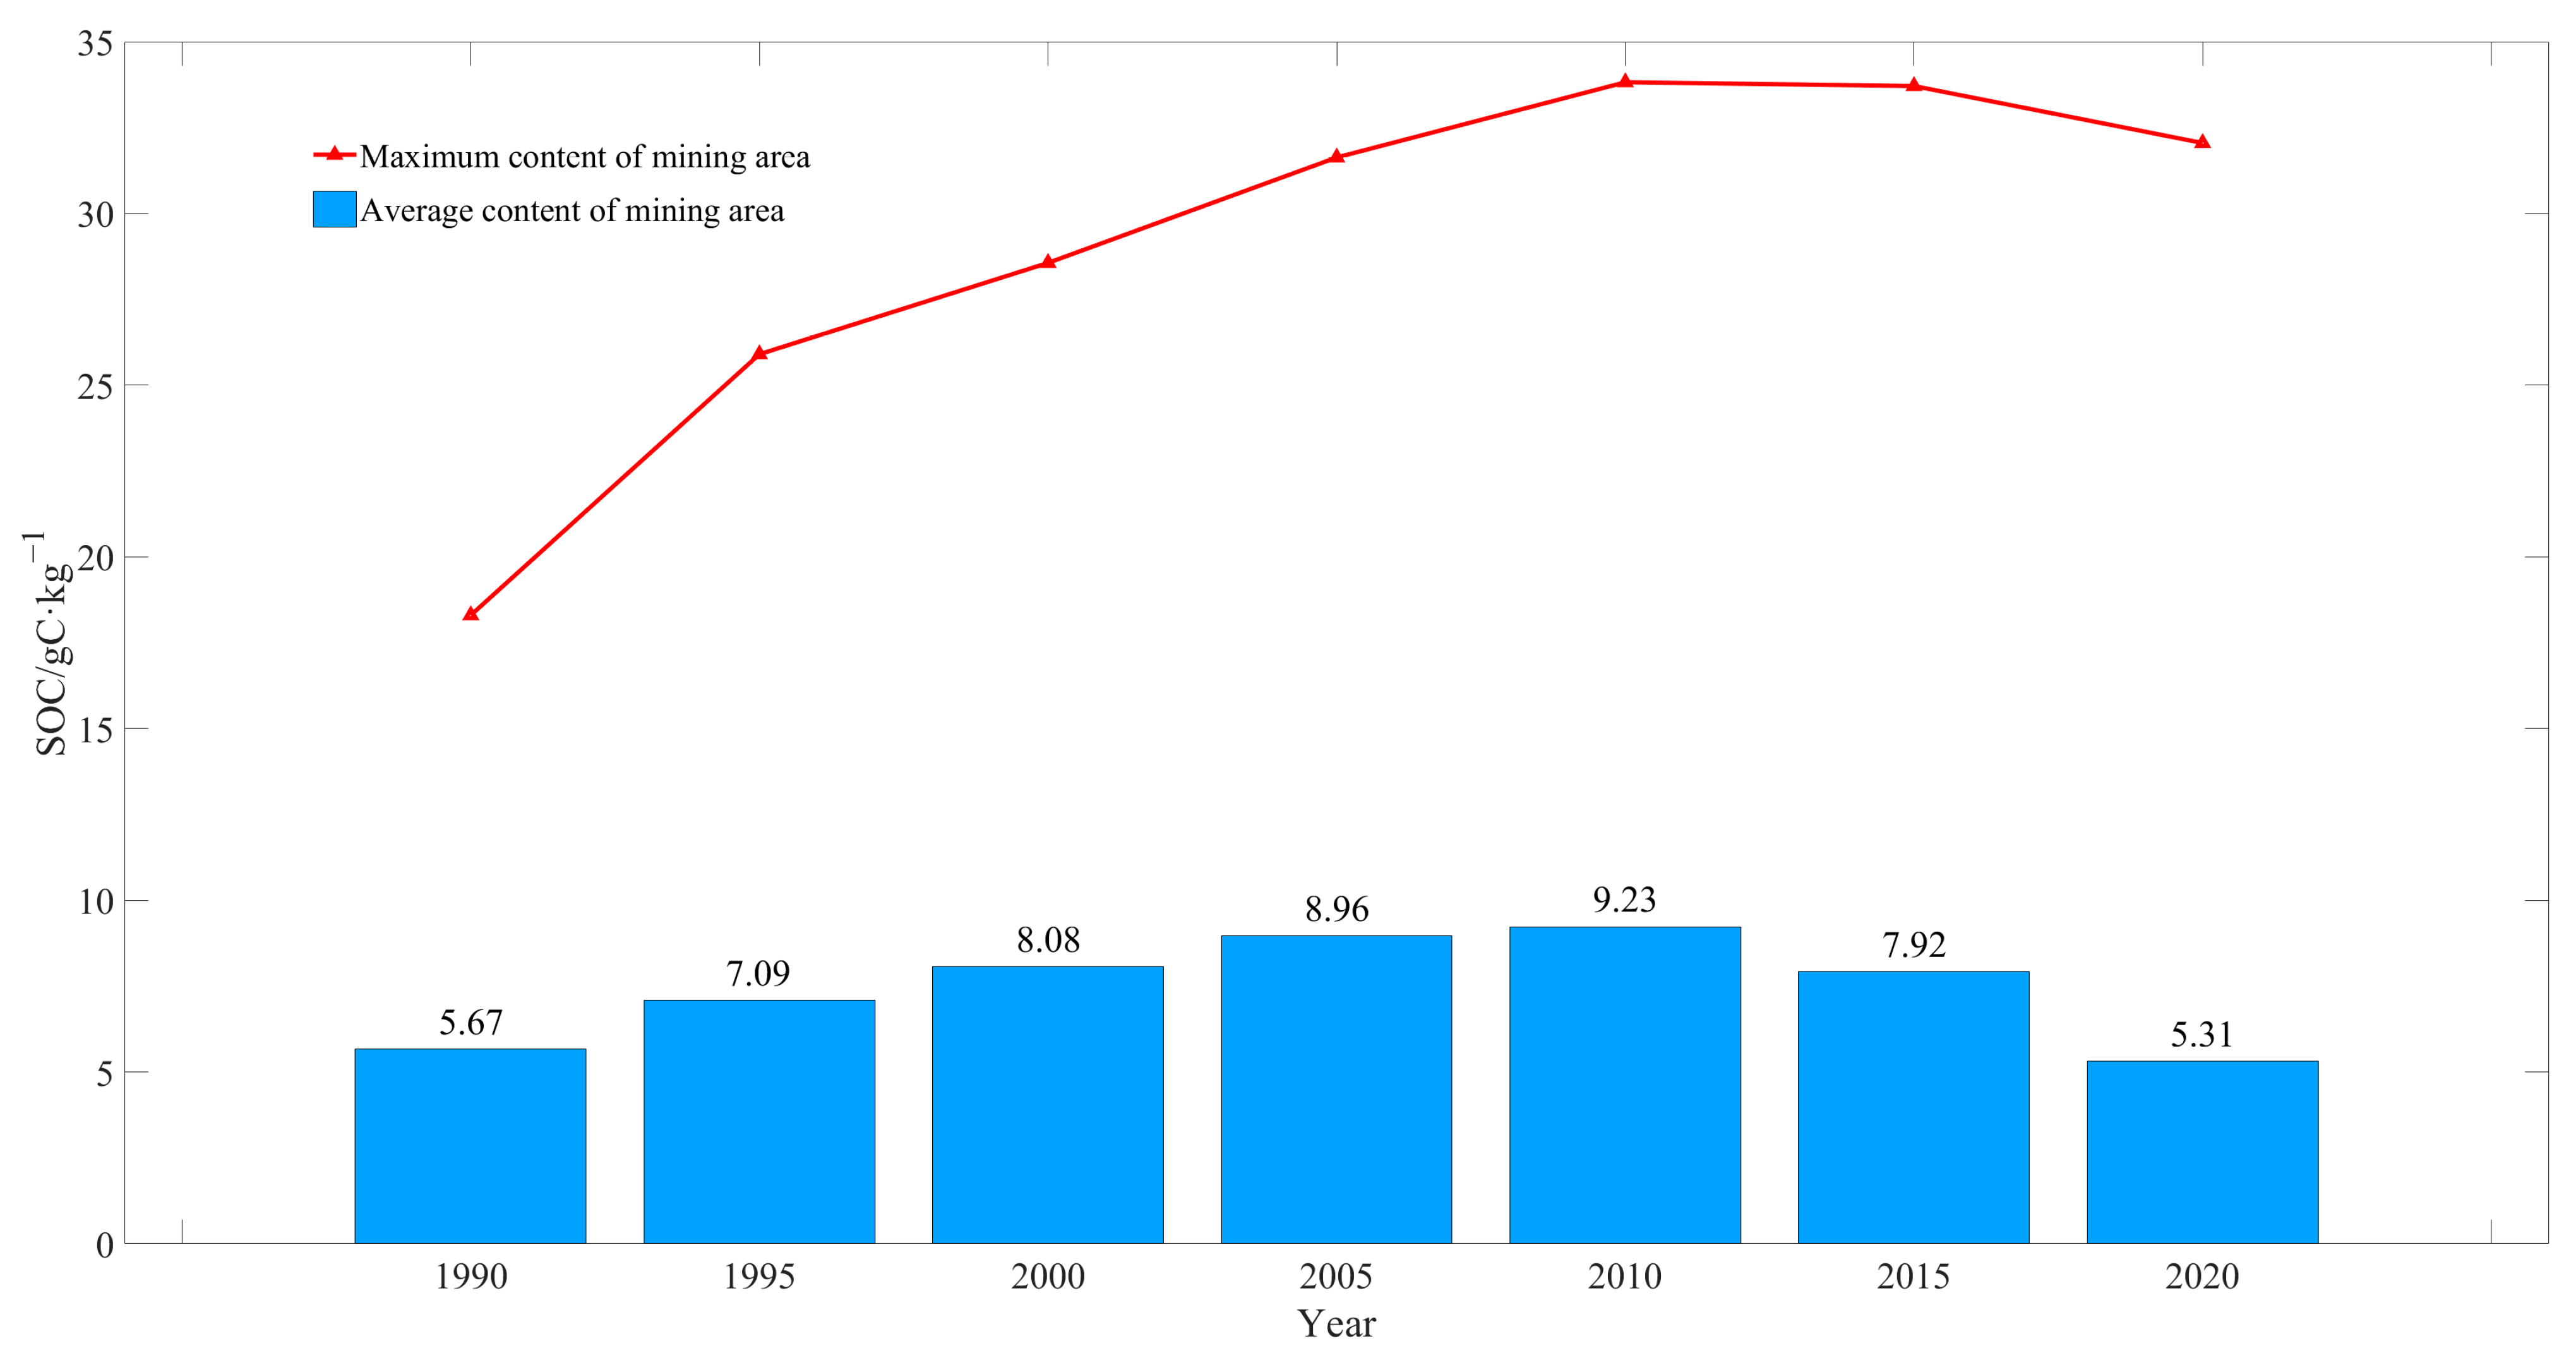
The mean SOC content continuously increased from 5.67 gC·kg−1 in 1990 to 9.23 gC·kg−1 in 2010 and declined to 7.92 gC·kg−1 in 2015 and to 5.31 gC·kg−1 in 2020. This showed an overall decreasing trend at a rate of 0.018 gC·kg−1/a (Figure 4).
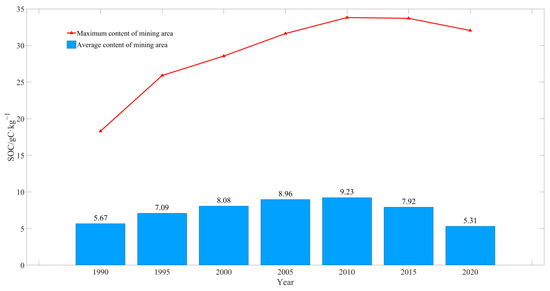
Figure 4.
Mean SOC content in Shendong mining area in 1990–2020.
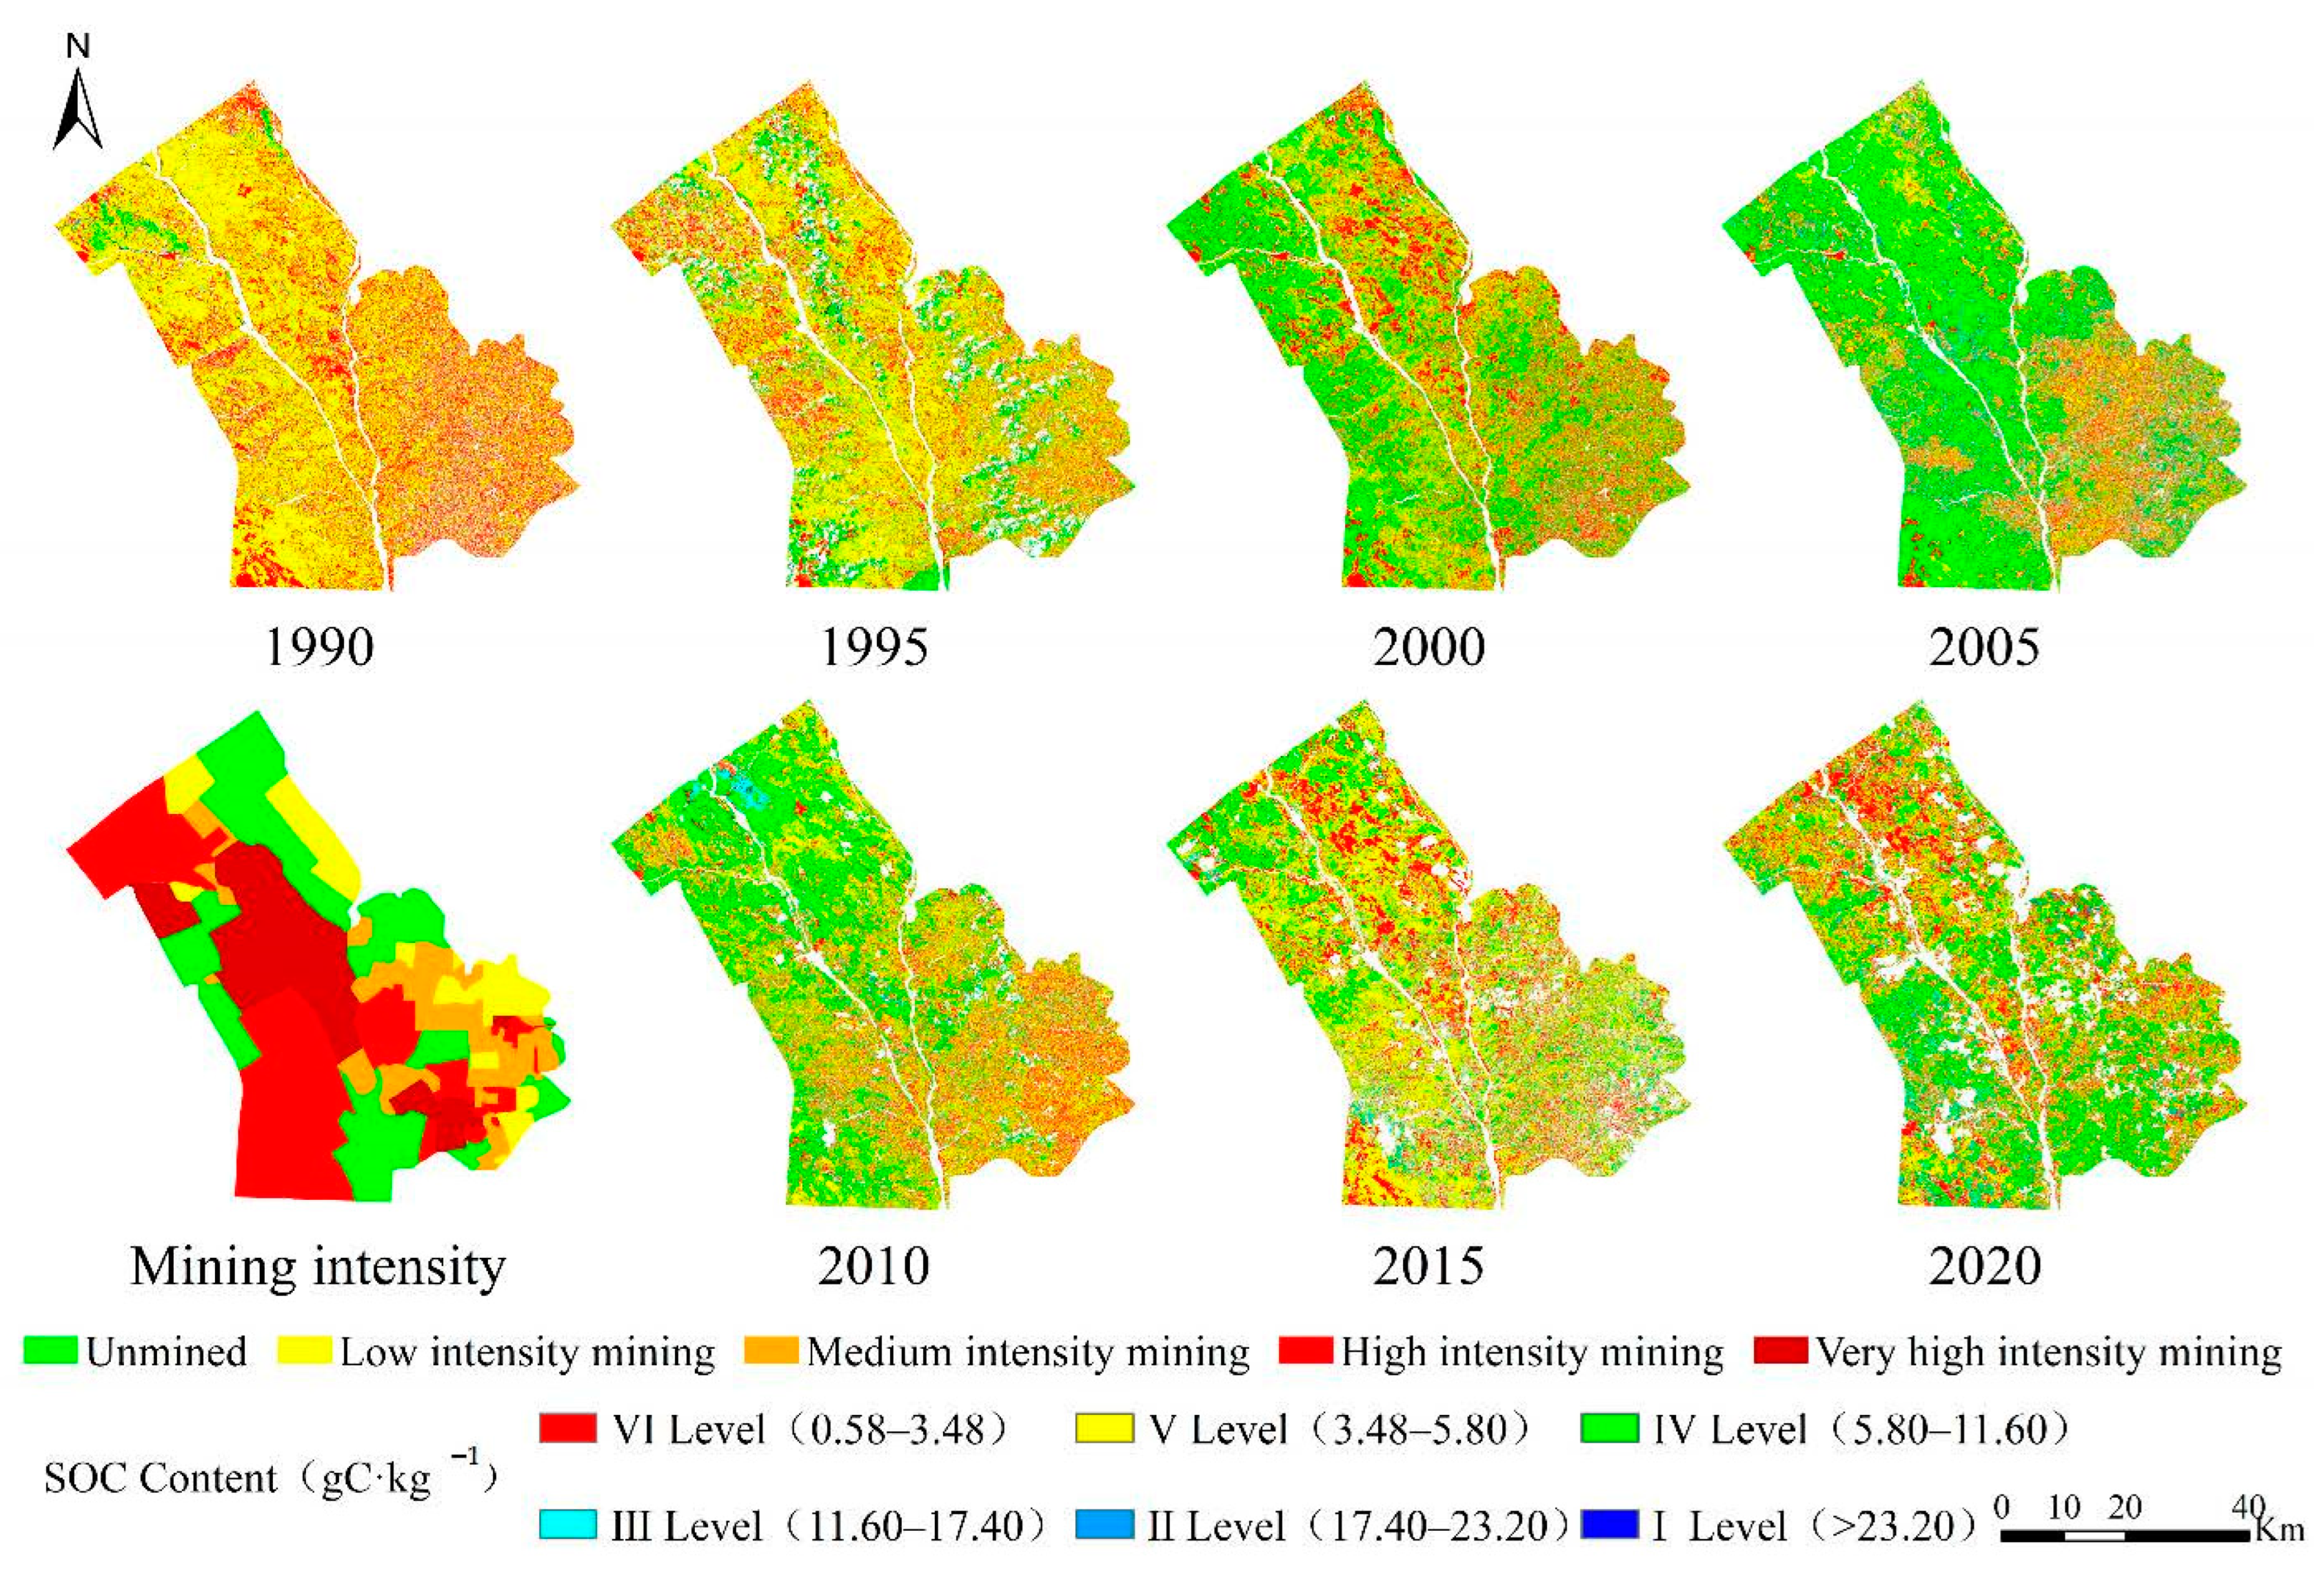
The spatial pattern of SOC content was roughly the same for each study period. That is, it was the lowest in the southeast and gradually rose from southeast to northwest (Figure 5). In 1990, the SOC content in the mining area was lower, mainly at level V. Compared to 1990, an increased SOC content was observed in 1995, and the area with increased content was located primarily in the south of the mining area. In 2000, the SOC content rose significantly, especially in the north. It continuously increased in 2005 and 2010 but did not increase significantly in the northwest, where there were dense regions of mining pits. In 2010, the SOC content in the mining area reached its historical peak, after which the local SOC content in the mining area declined in 2015. In 2020, the SOC content in the whole area significantly decreased compared with that in 2015, mainly in the dense region of pits. Compared with that in 1990, the increase in SOC content was not apparent in the northwest, but rather in the south. Overall, the local SOC content in the Shendong mining area was gradually increasing but did not increase in the dense region of pits.
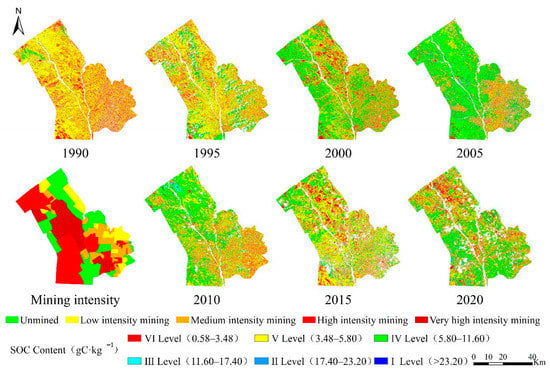
Figure 5.
Spatial distribution of SOC in Shendong mining area during 1990–2020 and mining intensity of the study area.
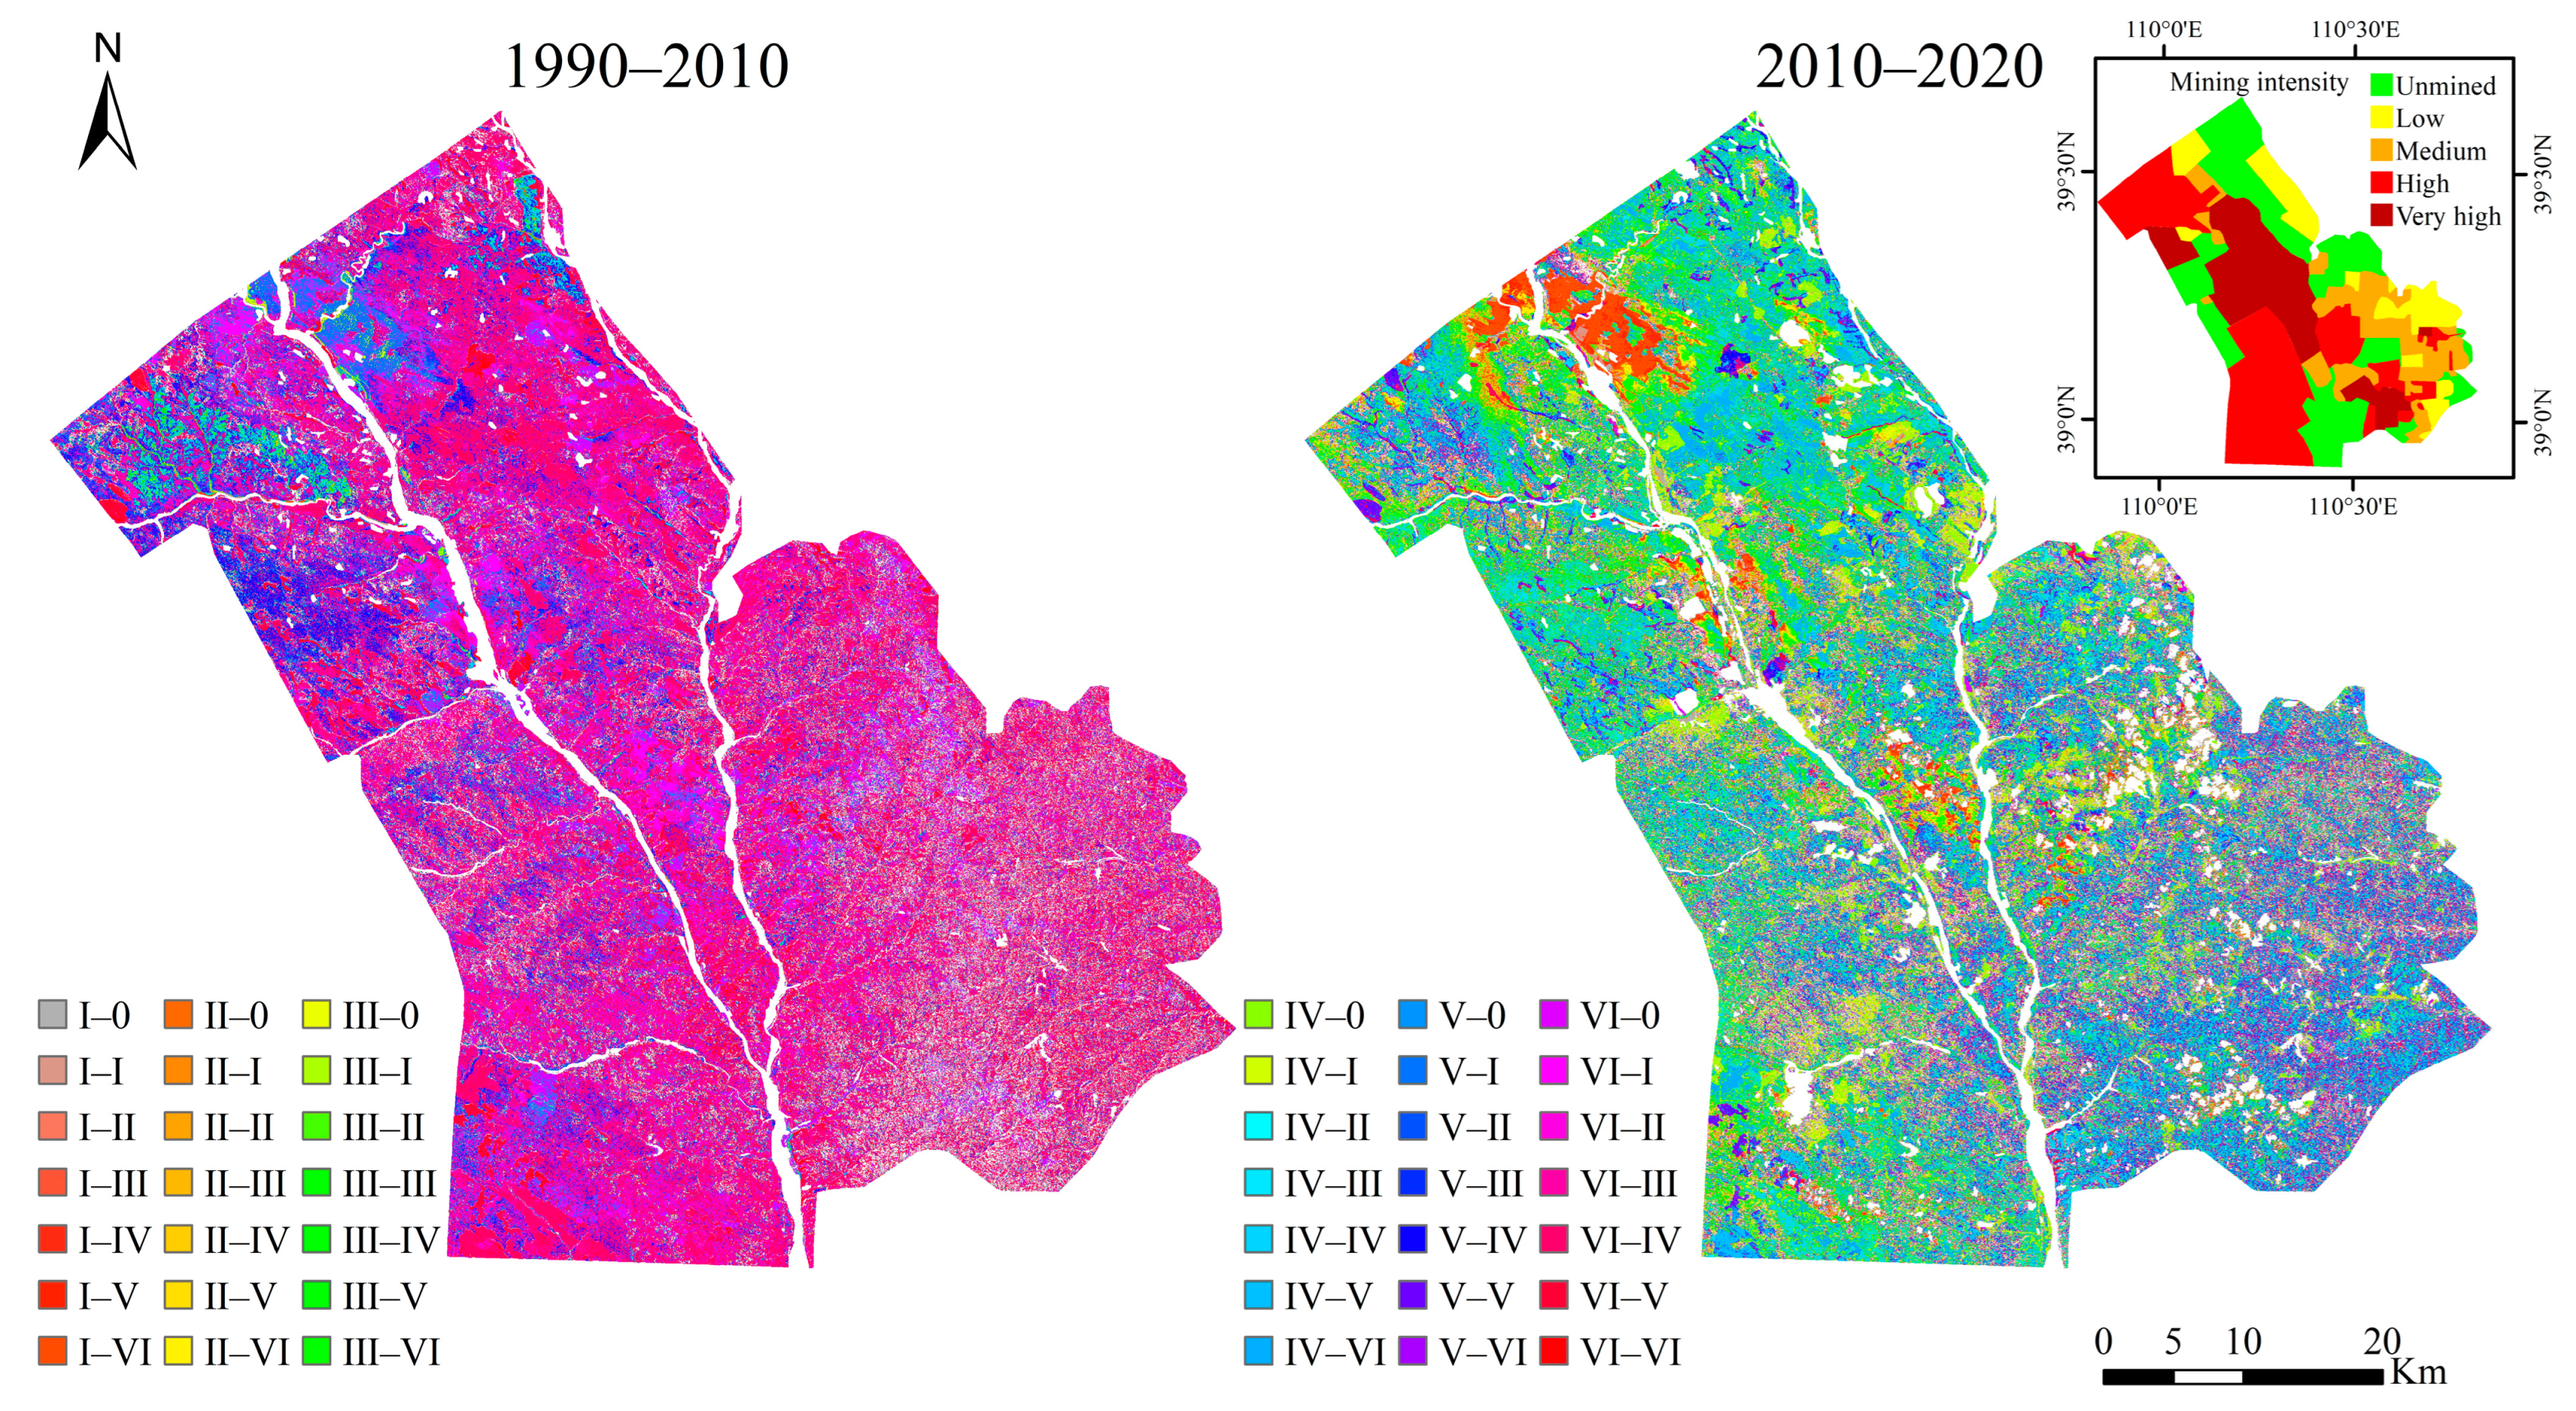
The results of the transfer matrix analysis (Figure 6, Table 3 and Table 4) revealed that the SOC content in the study area was initially low. In 1990, the SOC content was mainly at level VI, accounting for 67.6% of the site. In 2010 and 2020, SOC content was mainly at level IV, accounting for 45.28% and 33.84% of the area, respectively. More specifically, from 1990 to 2010, the overall trend in SOC content variation was from low to high. In 2010, the area with a SOC content of level VI accounted for 89.95% of the site, while the area with a level IV SOC content increased to 1097.04 km2. From 1990 to 2010, the area of SOC content change was 2652.4 km2, accounting for 88.15% of the total soil area. The area with the increased SOC content was 2092.1 km2, accounting for 70.8% of the total soil area. However, the SOC content continuously declined due to the increase in construction land and the massive exploitation of coal resources from 2010 to 2020. The area where the SOC content decreased was 78.09% of the total changed area and 50.9% of the total soil area. This decrease included a 214.69 km2 area where the SOC content dropped to 0 gC·kg−1, accounting for 14.27% of the area with decreased SOC content.

Figure 6.
SOC content transfer matrix in the Shendong mining area and mining intensity of the study area.
Table 3.
SOC prediction models for different land-use types and precision.
Table 4.
SOC prediction models for different land-use types and precision.
3.3.2. SOC Distribution under Different Mining Intensities
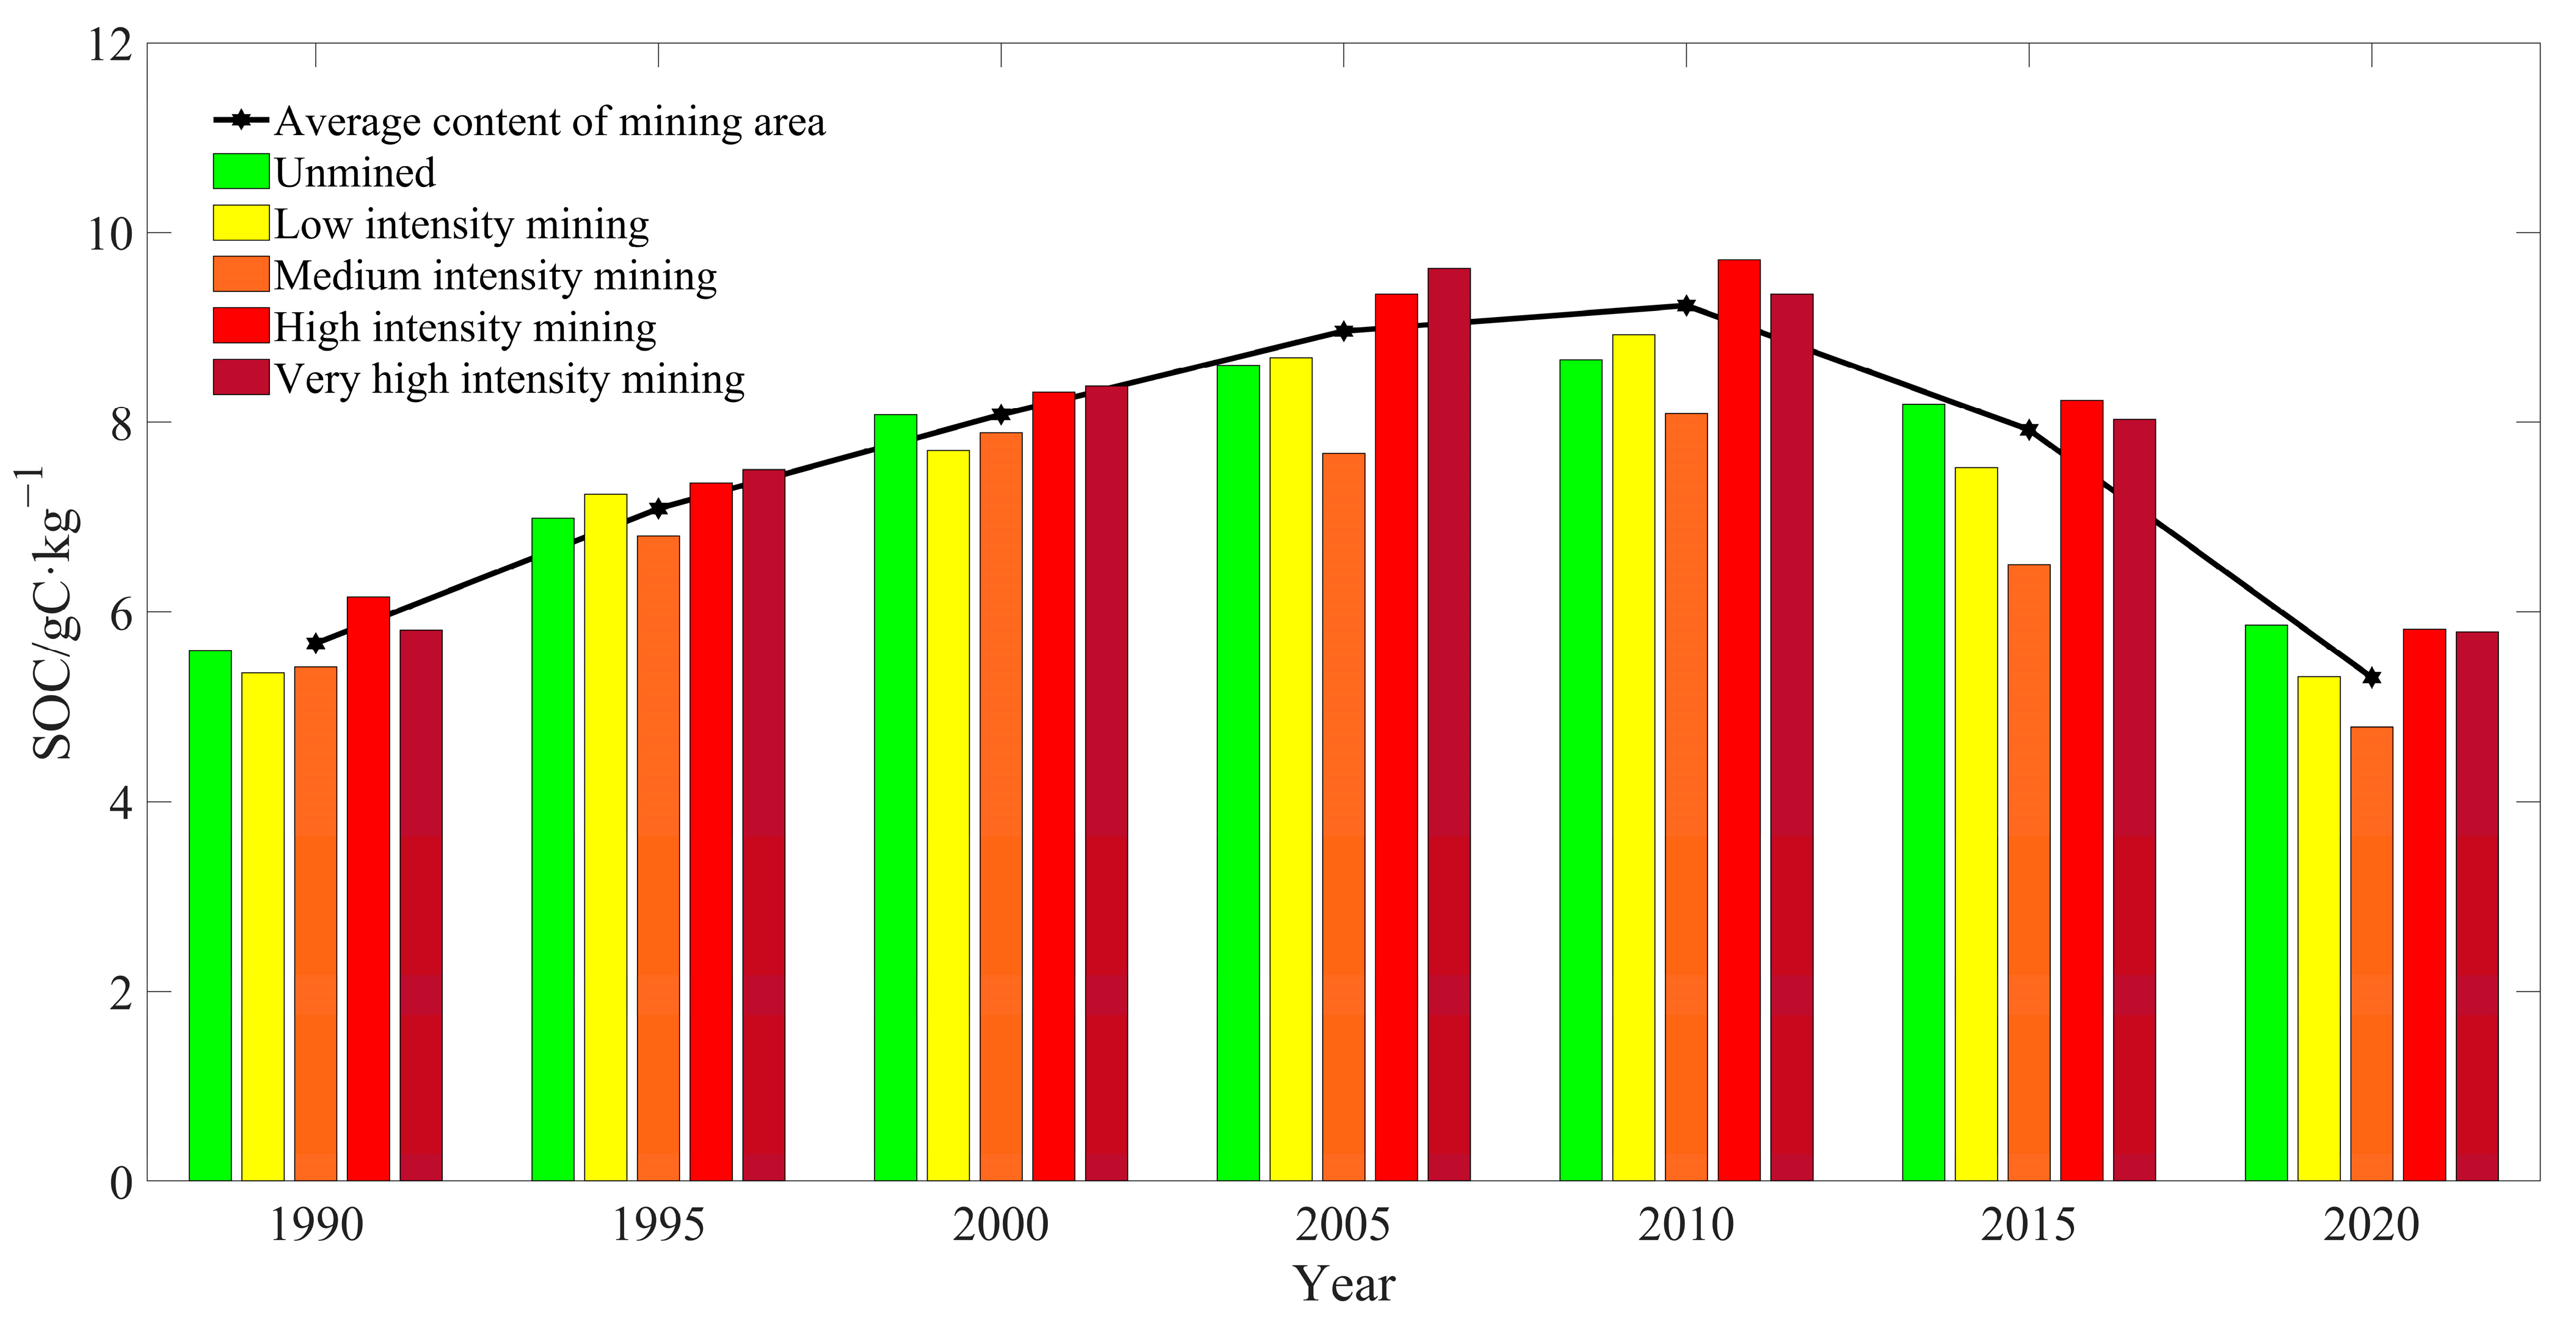
The mean SOC content was the highest in the high-intensity mining area. This was followed by the areas of extremely high-intensity mining, unmined, low-intensity mining, and moderate-intensity mining. In addition, the mean SOC content was on the rise in 1990–2010 in each mining area, except in moderate-intensity and extremely high-intensity mining areas. It declined in 2000–2005 in the moderate-intensity mining area and in 2005–2010 in the extremely high-intensity mining area. In 1990–2010, the mean SOC content in the mining area continuously rose, with significant differences in the SOC content among mining areas that were observed in 2005. The mean SOC content in the high-intensity and extremely high-intensity mining areas was significantly higher than in the mining area and other areas. Meanwhile, in other areas it was lower than the average in the mining area.
Furthermore, the mean SOC content in the moderate-intensity mining area displayed a decreasing trend, and reached a peak in the extremely high-intensity mining area. In 2010, the mean SOC content in the extremely high-intensity mining area declined (Figure 7). However, it was still at the average level of the mining area. The mean SOC content was still significantly higher in the high-intensity mining area than in the mining area and other areas. In 2010–2020, the mean SOC content in each mining area declined. The mean SOC content in unmined areas slowly increased from 1990–2005, but it remained unchanged in 2005–2015, whereas the mean SOC content in other areas experienced significant changes.
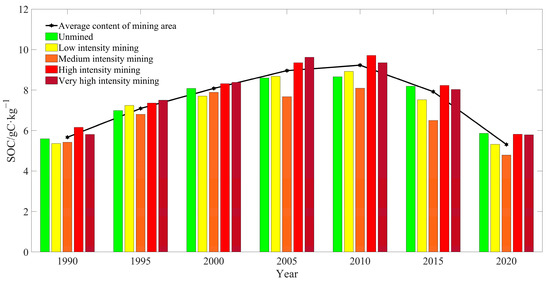
Figure 7.
SOC content transfer matrix in the Shendong mining area.
3.4. Influential Factors of SOC Changes
The geo-detector revealed that the explanatory power of land-use on the SOC content was the strongest (q = 0.165), followed by NDVI (q = 0.149), precipitation (q = 0.138), temperature (q = 0.115), elevation (q = 0.111), and mining intensity (q = 0.041), where all influential factors passed the significance test of 99% CI.
The statistical results of interaction detector (Table 5) showed that the interaction between the influential factors was stronger than that of a single factor. The interaction of NDVI with precipitation and elevation ranked first, with its interaction with precipitation being the mostly obvious (q = 0.555). The interaction of mining intensity with other factors was significantly improved, with the q value being 8 times that of a single factor. In particular, the q value of the mining intensity–precipitation interaction reached 0.408, which was lower than that of the NDVI-precipitation interaction and NDVI-elevation interaction, but 10 times that of a single factor.
Table 5.
Interaction q of influencing factors for SOC content.
4. Discussion
4.1. SOC Prediction Models of Coal Mining Area
So far, remote sensing techniques have been widely applied in the dynamic monitoring of physicochemical properties of regional soils [71,72,73], but there have been few studies on soil properties in coal mining areas, specifically at a large scale and within complex landscapes. Due to long-term mining of different intensities in coal mining areas, varying degrees of land surface subsidence have occurred, and land use has significantly changed through time. It resulted in the complex topography and land use distribution. It was expected that the remote sensing spectral information would be affected to a certain extent [17,60]. Different from the SOC prediction model that was solely constructed using image information, we incorporated some additional data during the development of our prediction models. Compared to other SOC remote sensing prediction models, the established models accounted for the impact of land-use types on SOC sensitive bands, and thereby improved the model precision. Several studies have confirmed that the use of ancillary data can improve the accuracy of soil prediction models [74,75].
The number and heterogeneity of the sample points are amongst the key factors that affect the performance of prediction models [76]. Here, we collected a large number of soil samples across sampling sites that covered different landscapes properties such as topography, altitude, soil types, and land use types. Although the constructed model takes the interference of land use types on spectral information into account, it does not fully consider the influence of soil types and soil properties on spectral information. This might be a reason for the low R2 of the prediction model across bare land type. The soil parent material and land-use type have a greater impact on the visible-near infrared spectrum of the soil [77]. Besides, we found that pulverized coal is also an important factor that affected the accuracy of SOC prediction in coal mining areas. The development and utilization of coal resources generates a large amount of dust, which makes the coal mine area seriously polluted by pulverized coal. As a result, the spectral reflectance of pulverized coal has a certain spectral response corresponding to the 4th and 5th bands of the TM imagery, which makes the original spectral curve subject to a certain degree of interference [78]. Therefore, soil types and soil attributes should be used as auxiliary data for remote sensing prediction modeling in future research. Besides, the interference of pulverized coal on spectral information should be fully considered.
4.2. Spatiotemporal Change Properties of SOC
The mean SOC content in the Shendong mining area slowly rose in 1990–2010, while it rapidly declined in 2010–2020, showing an overall decreasing trend at a rate of 0.018 gC·kg−1/a. In 1990, the study site had not yet been exploited, and the natural ecosystem was less disturbed by humans. Still, aeolian sandy soil was dominant due to the poor soil, thus the SOC content was not high. However, with coal mining and land reclamation, the SOC content continuously increased during 1990–2010, which was closely related to the mining area’s policy that gave equal importance to coal mining and the ecological management of the environment [63]. One may note that the area’s vegetation cover was still extremely sparse though it had not been exploited in 1990. During the mining period, vegetation restoration was adopted, which improved the vegetation coverage rate from 3–11% to more than 60% in the initial stage of development. The increase in vegetation is especially important for the accumulation of SOC.
The SOC content was spatially consistent in each period. That is, it gradually rose from southeast (with the lowest content) to northwest. A possible reason is that the land is flat in the northwest and locally covered with grassland and forest land, which can inhibit soil erosion and increase carbon sink to a certain extent. In contrast, the gully area is located in the southeast, which is more prone to soil erosion than the northwest in the mining area. This resulted in low SOC content [63].
The above analysis on the changes in SOC content under different mining intensities demonstrated that the different mining intensities impacted the changes in the SOC content across the study area. The SOC content was lower in low- and moderate-intensity mining areas, mainly because of mostly occurring small and medium-sized coal mines or small collieries with low productivity, great long-term destruction, and no advanced mining technology. Although technological advancements in coal integration and industrial structure in recent years have, to a certain extent, curbed the development of high-energy-consuming enterprises, the recovery from the local ecological impact caused by many years of industrial coal activity is a long-term process. In contrast, the SOC content in high- and extremely high-intensity mining areas was higher than in other mining areas. The main reason is that the vegetation in these areas has not been regularly damaged due to mining-induced geological disasters, such as collapse and groundwater subsidence. Mining with a super-large working face has also been confirmed in many studies to cause less damage to the environment, which reduces the range of uneven ground subsidence and stretching. It also causes spontaneous restoration of the surface vegetation to a large extent [62,63]. The mean SOC content was also higher in these areas. The catchment area is formed due to surface subsidence, and SOC will migrate to this area with soil erosion, which leads to higher SOC content [79,80]. This study did not consider the impact of topographical changes caused by coal mining on SOC content. We only classified the mining intensity in our large-scale study. However, the impact of coal mining on the redistribution of SOC remains unclear, thus further research on topographical changes is required in future studies.
4.3. Influential Factors of SOC Changes
SOC content is mainly affected by climate, topography, vegetation, land use and soil erosion [81]. In the coal mining area, SOC content is also affected by coal mining activities. Here, various influential factors were analyzed using geo-detectors.
The land-use type possessed the highest explanatory power for the spatial heterogeneity of SOC content, since there is a difference in carbon sequestration capacity of different land-use types. Furthermore, water supply and soil water retention vary due to the differences in evapotranspiration and sediment retention [25,82,83]. In the Shendong mining area, the cultivated land showed the highest average SOC content, followed by grassland, while the bare land showed the lowest value. This was different from previous studies [27,81,84]. We argue this to be related to people fertilizing the originally poor soil in order to increase the yield of crops. The soil itself in Shendong mining area is infertile, the native vegetation is sparse, and the coverage is less than 30% [63]. Therefore, SOC is difficult to reach high values under natural conditions. Although the cultivated land has been greatly disturbed, the SOC content is much higher than other land use types, which was apparently due to fertilization. The reason why the average SOC content of grassland was higher than that of forest may be due to the occurence of immature forests in the study area. Studies have shown that the soil organic carbon content of immature forests(10 years old) can be for example 32.25% lower than that of 30-year-old forest land [81].
Further, carbon sink capacity is relatively high in regions with high NDVI. These regions that facilitate the increase in SOC content through resisting rainfall erosion and other physical forms of erosion [85]. The surface subsidence caused by mining disturbs the vegetation root system and reduces the carbon sequestration capacity, which intensifies soil erosion and SOC mineralization [86,87,88]. In addition, precipitation and temperature have an important impact on the photosynthesis of plants, thereby affecting the accumulation of SOC. In the meantime, water and temperature have a huge impact on the activities of soil microorganisms, which control the rate of transformation and decomposition of plant residues that enter the soil by microorganisms, and thereby change both input and output of soil carbon [89]. Therefore, the explanatory power of temperature and precipitation for the spatial heterogeneity of SOC content was lower than that of NDVI. Furthermore, the difference in altitude affects the annual precipitation and temperature. In the meantime, high-altitude areas receive less human disturbance and are easier to accumulate SOC. In our study the effect of altitude on SOC was less than that of annual precipitation, which was in line with previous studies [90,91].
Mining intensity as an individual influencing factor had no apparent effect on the change of SOC content in our study site. Therefore, the focus should be on the optimization of land-use structures that aim to improve vegetation coverage. Further recommendations include that the direction and speed of vegetation succession should be artificially controlled. The forest structure in such areas should also be optimized by combining grasses as primary vegetation with shrubs as secondary vegetation type. In addition, scientific methods such as microbial reclamation should be used to reclaim the land subsidence in mining areas, while the greening of bare land should be enhanced.
The interaction between various factors that influence SOC content was higher than that of a single factor. The interaction between mining intensity and precipitation displayed the most significant effect on SOC content, with an explanatory power that was ×10 of a single factor. As mentioned above, mining intensity had no pronounced effect on the change in SOC content, which was also consistent with the result from the geo-detector. Moreover, the explanatory power of mining intensity on the change of SOC content was relatively low. It was found that the ground deformation caused by various mining intensities was different, which may be the main influential factor on SOC content.
Coal mining disturbs vegetation and soil, which may lead to a decrease in soil water retention capacity. This then intensifies erosion when precipitation increases. The SOC will then migrate [79,80], leading to a relatively high SOC content in the bottom of the collapsed basin caused by coal mining. This can also explain the high explanatory power of the interaction between mining intensity and precipitation, as observed in this study.
4.4. Implications
Our study has both scientific and practical implications. Firstly, changes in SOC and their relation with influential factors are globally important, given its close connection with global climate change. The coal mining area shows a typical example for areas with intensive human disturbance, which facilitated a comparison of the impacts of climate change and human activities. We found that the interaction between vegetation and precipitation dominated the SOC changes in the Shendong mining area, although intensive coal mining activities exerted negative effects on SOC accumulation. This implied that vegetation restoration is useful for the control of SOC loss induced by coal mining activities. This is particularly important given that the Loess Plateau has been projected to experience a warmer and wetter climate in the future [92]. Our findings are beneficial for an optimization of coal mining activities in the context of global climate change as well as land use planning to achieve a low SOC loss in areas with intensive human disturbances. Secondly, the model development in our study provides a useful reference for the establishment of SOC prediction models in other regions, particularly for areas with intensive human activities. The established models also provide a powerful tool for an effective assessment of SOC over a large area, which is then beneficial for an investigation of driving mechanisms of SOC changes, and thus the its conservation.
5. Conclusions
In order to explore changes of SOC content in Shendong mining area, this study established prediction models through an analysis of field measured SOC content and spectral information of Landsat images for different land use types including grassland, forest, farmland and bare land. The established models were validated to be reasonable with the R2 being higher than 0.69 and RMSE being no more than 2.74.
The SOC content of the Shendong mining area was found to increase from 5.67 gC·kg−1 in 1990 to 9.23 gC·kg−1 in 2010, and reduced to 7.92 gC·kg−1 in 2015 and 5.31 gC·kg−1 in 2020, which showed a declining trend at a rate of 0.018 gC·kg−1/a. Spatially, the SOC content reached a minimum in the southeast of the Shendong mining area and generally rose gradually from southeast to northwest.
Coal mining affects the spatial distribution of SOC in the Shendong mining area to a certain extent, the high-intensity mining area had the highest SOC content, followed by the extremely high-intensity mining area, unmined area, low-intensity mining area, and moderate-intensity mining area. In the high-intensity and extremely high-intensity mining areas, the inhibition of SOC accumulation reached the lowest level. In contrast, the inhibition peaked in the low- and moderate-intensity mining areas.
Although the coal mining intensity has an influence on the SOC content, SOC content changes were dominated by other factors. The geo-detector analysis demonstrated that the most influential factor on the SOC content was land use, followed by NDVI, precipitation, temperature, elevation, and mining intensity. The interaction between the various influential factors on SOC content was higher than that of a single factor, while the interaction between NDVI and precipitation had the strongest influence on SOC content. The influence of the interaction between mining intensity and other factors increased. The interaction of coal mining and precipitation has a greater impact on SOC content than coal mining has on SOC content. Our study provided an enhanced understanding of SOC content changes in mining areas and the results are beneficial for the conservation of terrestrial carbon storage, particularly for areas with intensive human activities.
Author Contributions
Conceptualization, P.L. and X.Y.; methodology, P.L. and X.Y.; visualization, J.H., N.W. and D.Z.; validation, L.K.; formal analysis, X.Y. and W.Y.; writing—original draft preparation, X.Y.; writing—review and editing, P.L., W.Y. and H.L. All authors have read and agreed to the published version of the manuscript.
Funding
This research was funded by National Natural Science Foundation of China, grant number 41977059, U2243211; by Key Laboratory of Coal Resources Exploration and Comprehensive Utilization, Ministry of Nature Resources of China, grant number KF2021-4; by Natural Science Basic Research Program of Shaanxi Province, grant number No.2022JQ-259.
Institutional Review Board Statement
Not applicable.
Informed Consent Statement
Not applicable.
Data Availability Statement
Data sharing is not applicable to this article.
Acknowledgments
Special thanks go to Fan for the mining intensity data of the Shendong mining area. United States Geological Survey, Data Centre for Resources and Environmental Sciences of Chinese Academy of Sciences, China Meteorological Data Network and Geospatial Data Cloud are acknowledged for providing remote sensing images, land use datasets, meteorological data and DEM data.
Conflicts of Interest
The authors declare no conflict of interest.
References
- Liu, P.; Gao, P.; Zhang, C. How to Promote Energy Transition with Market Design: A Review on China’s Electric Power Sector. Front. Energy Res. 2021, 9. [Google Scholar]
- Yuan, Y.; Zhao, Z.; Zhang, P.; Chen, L.; Hu, T.; Niu, S.; Bai, Z. Soil organic carbon and nitrogen pools in reclaimed mine soils under forest and cropland ecosystems in the Loess Plateau, China. Ecol. Eng. 2017, 102, 137–144. [Google Scholar] [CrossRef]
- Yu, Y.; Chen, S.-E.; Deng, K.-Z.; Wang, P.; Fan, H.-D. Subsidence Mechanism and Stability Assessment Methods for Partial Extraction Mines for Sustainable Development of Mining Cities—A Review. Sustainability 2018, 10, 113. [Google Scholar] [CrossRef] [Green Version]
- Miller, B.A.; Koszinski, S.; Wehrhan, M.; Sommer, M. Comparison of spatial association approaches for landscape mapping of soil organic carbon stocks. SOIL 2015, 1, 217–233. [Google Scholar] [CrossRef] [Green Version]
- Zhang, G.S.; Ni, Z.W. Winter tillage impacts on soil organic carbon, aggregation and CO2 emission in a rainfed vegetable cropping system of the mid–Yunnan plateau, China. Soil Tillage Res. 2017, 165, 294–301. [Google Scholar] [CrossRef]
- Batjes, N. Carbon and nitrogen stocks in the soils of Central and Eastern Europe. Soil Use Manag. 2002, 18, 324–329. [Google Scholar] [CrossRef]
- Derrien, M.; Yang, L.; Hur, J. Lipid biomarkers and spectroscopic indices for identifying organic matter sources in aquatic environments: A review. Water Res. 2017, 112, 58–71. [Google Scholar] [CrossRef]
- Berhe, A.A.; Barnes, R.T.; Six, J.; Marín-Spiotta, E. Role of soil erosion in biogeochemical cycling of essential elements: Carbon, nitrogen, and phosphorus. Annu. Rev. Earth Planet. Sci. 2018, 46, 521–548. [Google Scholar] [CrossRef]
- Smith, P. Land use change and soil organic carbon dynamics. Nutr. Cycl. Agroecosystems 2008, 81, 169–178. [Google Scholar] [CrossRef]
- Wang, L.; Okin, G.S.; Caylor, K.K.; Macko, S.A. Spatial heterogeneity and sources of soil carbon in southern African savannas. Geoderma 2009, 149, 402–408. [Google Scholar] [CrossRef]
- Zhao, Y.; Wang, M.; Hu, S.; Zhang, X.; Shi, X. Economics- and policy-driven organic carbon input enhancement dominates soil organic carbon accumulation in Chinese croplands. Proc. Natl. Acad. Sci. USA 2018, 115, 4045. [Google Scholar] [CrossRef] [PubMed] [Green Version]
- Haigh, M.; Reed, H.; Flege, A.; D’Aucourt, M.; Plamping, K.; Cullis, M.; Woodruffe, P.; Sawyer, S.; Panhuis, W.; Wilding, G. Effect of Planting Method on the Growth of Alnus glutinosa and Quercus petraea in Compacted Opencast Coal-Mine Spoils, South Wales. Land Degrad. Dev. 2015, 26, 227–236. [Google Scholar] [CrossRef]
- Chaudhuri, S.; Mcdonald, L.M.; Skousen, J.; Pena-Yewtukhiw, E.M. Soil Organic Carbon Molecular Properties: Effects of Time Since Reclamation in a Minesoil Chronosequence. Land Degrad. Dev. 2015, 26, 237–248. [Google Scholar] [CrossRef]
- Zhou, J.; Sun, X.; Jiao, J.; Liu, M.; Hu, F.; Li, H. Dynamic changes of bacterial community under the influence of bacterial-feeding nematodes grazing in prometryne contaminated soil. Appl. Soil Ecol. 2013, 64, 70–76. [Google Scholar] [CrossRef]
- Lal, R. Digging deeper: A holistic perspective of factors affecting soil organic carbon sequestration in agroecosystems. Glob. Change Biol. 2018, 24, 3285–3301. [Google Scholar] [CrossRef] [PubMed]
- Jian, J.; Du, X.; Reiter, M.S.; Stewart, R.D. A meta-analysis of global cropland soil carbon changes due to cover cropping. Soil Biol. Biochem. 2020, 143, 107735. [Google Scholar] [CrossRef]
- Li, D.; Niu, S.; Luo, Y. Global patterns of the dynamics of soil carbon and nitrogen stocks following afforestation: A meta-analysis. New Phytol. 2012, 195, 172–181. [Google Scholar] [CrossRef] [PubMed]
- Baldrian, P.; Kolarik, M.; Stursova, M.; Kopecky, J.; Valaskova, V.; Vetrovsky, T.; Zifcakova, L.; Snajdr, J.; Ridl, J.; Vlcek, C.; et al. Active and total microbial communities in forest soil are largely different and highly stratified during decomposition. ISME J. 2012, 6, 248–258. [Google Scholar] [CrossRef] [Green Version]
- Clemmensen, K.E.; Bahr, A.; Ovaskainen, O.; Dahlberg, A.; Ekblad, A.; Wallander, H.; Stenlid, J.; Finlay, R.D.; Wardle, D.A.; Lindahl, B.D. Roots and associated fungi drive long-term carbon sequestration in boreal forest. Science 2013, 339, 1615–1618. [Google Scholar] [CrossRef]
- Mcsherry, M.E.; Ritchie, M.E. Effects of grazing on grassland soil carbon: A global review. Glob. Change Biol. 2013, 19, 1347–1357. [Google Scholar] [CrossRef]
- Conant, R.T.; Cerri, C.; Osborne, B.B.; Paustian, K. Grassland management impacts on soil carbon stocks: A new synthesis. Ecol. Appl. 2017, 27, 662–668. [Google Scholar] [CrossRef] [PubMed] [Green Version]
- KöChy, M.; Hiederer, R.; Freibauer, A. Global distribution of soil organic carbon–Part 1: Masses and frequency distributions of SOC stocks for the tropics, permafrost regions, wetlands, and the world. SOIL 2015, 1, 351–365. [Google Scholar] [CrossRef] [Green Version]
- Leifeld, J.; Menichetti, L. The underappreciated potential of peatlands in global climate change mitigation strategies. Nat. Commun. 2018, 9, 1071. [Google Scholar] [CrossRef] [PubMed] [Green Version]
- Rogers, K.; Kelleway, J.J.; Saintilan, N.; Megonigal, J.P.; Adams, J.B.; Holmquist, J.R.; Lu, M.; Schile-Beers, L.; Zawadzki, A.; Mazumder, D. Wetland carbon storage controlled by millennial-scale variation in relative sea-level rise. Nature 2019, 567, 91–95. [Google Scholar] [CrossRef] [PubMed]
- Guo, L.B.; Gifford, R.M. Soil carbon stocks and land use change: A meta analysis. Glob. Change Biol. 2002, 8, 345–360. [Google Scholar] [CrossRef]
- Chen, L.; Gong, J.; Fu, B.; Huang, Z.; Huang, Y.; Gui, L. Effect of land use conversion on soil organic carbon sequestration in the loess hilly area, loess plateau of China. Ecol. Res. 2007, 22, 641–648. [Google Scholar] [CrossRef]
- Laganiere, J.; Angers, D.A.; Pare, D. Carbon accumulation in agricultural soils after afforestation: A meta-analysis. Glob. Change Biol. 2010, 16, 439–453. [Google Scholar] [CrossRef]
- Choudhury, B.U.; Mohapatra, K.P.; Das, A.; Das, P.T.; Nongkhlaw, L.; Fiyaz, R.A.; Ngachan, S.V.; Hazarika, S.; Rajkhowa, D.J.; Munda, G.C. Spatial variability in distribution of organic carbon stocks in the soils of North East India. Curr. Sci. 2013, 104, 604–614. [Google Scholar]
- Baumgartl, T.; Chan, J.; Bucka, F.; Pihlap, E. Soil organic carbon in rehabilitated coal mine soils as an indicator for soil health. In Proceedings of the 14th International Conference on Mine Closure, Ulaanbaatar, Mongolia, 17–19 August 2021. [Google Scholar]
- Xu, Z.; Zhang, Y.; Zhang, S.; Li, L.; Yu, M. Spatial prediction of soil organic carbon content in coal mining subsidence area based on GIS and partition Kriging. Trans. Chin. Soc. Agric. Eng. 2018, 34, 253–259. [Google Scholar]
- Ussiri, D.A.N.; Lal, R.; Jacinthe, P.A. Soil Properties and Carbon Sequestration of Afforested Pastures in Reclaimed Minesoils of Ohio. Soil Sci. Soc. Am. J. 2006, 70, 1797–1806. [Google Scholar] [CrossRef]
- Shrestha, R.K.; Lal, R. Carbon and nitrogen pools in reclaimed land under forest and pasture ecosystems in Ohio, USA. Geoderma 2010, 157, 196–205. [Google Scholar] [CrossRef]
- Bouwman, A.F.; Leemans, R. The role of forest soils in the global carbon cycle. Carbon Funct. For. Soils 1995, 23, 503–525. [Google Scholar]
- Izaurralde, R.C. Cycles of soil. Crop Sci. 2000, 40, 288. [Google Scholar] [CrossRef]
- De Baets, S.; Meersmans, J.; Vanacker, V.; Quine, T.A.; Van Oost, K. Spatial variability and change in soil organic carbon stocks in response to recovery following land abandonment and erosion in mountainous drylands. Soil Use Manag. 2013, 29, 65–76. [Google Scholar] [CrossRef]
- Marín-Spiotta, E.; Sharma, S. Carbon storage in successional and plantation forest soils: A tropical analysis. Glob. Ecol. Biogeogr. 2013, 22, 105–117. [Google Scholar] [CrossRef]
- Anderson, J.D.; Ingram, L.J.; Stahl, P.D. Influence of reclamation management practices on microbial biomass carbon and soil organic carbon accumulation in semiarid mined lands of Wyoming. Appl. Soil Ecol. 2008, 40, 387–397. [Google Scholar] [CrossRef]
- Yuan, Y.; Zhao, Z.Q.; Li, X.Z.; Wang, Y.Y.; Bai, Z.K. Characteristics of labile organic carbon fractions in reclaimed mine soils: Evidence from three reclaimed forests in the Pingshuo opencast coal mine, China. Sci. Total Environ. 2018, 613, 1196–1206. [Google Scholar] [CrossRef]
- Lal, R. Residue management, conservation tillage and soil restoration for mitigating greenhouse effect by CO2-enrichment. Soil Tillage Res. 1997, 43, 81–107. [Google Scholar] [CrossRef]
- Sencindiver, J.; Ammons, J. Minesoil genesis and classification. Reclam. Drastically Disturb. Lands 2000, 41, 595–613. [Google Scholar]
- Mcfee, W.W.; Kelly, J.M.; Bouwman, A.F.; Leemans, R. The Role of Forest Soils in the Global Carbon Cycle. In Carbon Forms and Functions in Forest Soils; John Wiley & Sons, Inc.: Hoboken, NJ, USA, 1995. [Google Scholar]
- Bolin, B.; Degens, E.T.; Duvigneaud, P.; Kempe, S. The global biogeochemical carbon cycle. In The Global Carbon Cycle; Princeton University Press: Princeton, NJ, USA, 1979. [Google Scholar]
- Bohn, H.L. Estimate of organic-carbon in world soils. Soil Sci. Soc. Am. J. 1982, 40, 468–470. [Google Scholar] [CrossRef]
- Parton, W.J. The Century Model; Springer: Berlin/Heidelberg, Germany, 1996. [Google Scholar]
- Coleman, K.; Jenkinson, D.S. RothC-26.3-A Model for the Turnover of Carbon in Soil; Springer: Berlin/Heidelberg, Germany, 1996. [Google Scholar]
- Campbell, J.B. Spatial variation of sand content and pH within single contiguous delineation of two soil mapping units. Soil Sci. Soc. Am. J. 1978, 42, 460–464. [Google Scholar] [CrossRef]
- Burgess, T.M.; Webster, R. Optimal interpolation and isar1thmic mapping of soil properties: I the semi-variogram and punctual krig1ng. J. Soil Sci. 1980, 31, 315–331. [Google Scholar] [CrossRef]
- Bergstrom, D.W.; Monreal, C.M.; Millette, J.A.; King, D.J. Spatial Dependence of Soil Enzyme Activities along a Slope. Soil Sci. Soc. Am. J. 1998, 62, 1302–1308. [Google Scholar] [CrossRef]
- Levine, E.R.; Knox, R.G.; Lawrence, W.T. Relationships between soil properties and vegetation at the Northern Experimental Forest, Howland, Maine. Remote Sens. Environ. 1994, 47, 231–241. [Google Scholar] [CrossRef]
- Frazier, B.E.; Cheng, Y. Remote sensing of soils in the eastern Palouse region with Landsat Thematic Mapper. Remote Sens. Environ. 1989, 28, 317–325. [Google Scholar] [CrossRef]
- Feng, C.; Kissel, D.E.; West, L.T.; Adkins, W. Field-Scale Mapping of Surface Soil Organic Carbon Using Remotely Sensed Imagery. Soil Sci. Soc. Am. J. 2000, 64, 746–753. [Google Scholar]
- Tripathi, A.; Tiwari, R.K. Utilisation of spaceborne C-band dual pol Sentinel-1 SAR data for simplified regression-based soil organic carbon estimation in Rupnagar, Punjab, India. Adv. Space Res. 2022, 69, 1786–1798. [Google Scholar] [CrossRef]
- Shafizadeh-Moghadam, H.; Minaei, F.; Talebi-khiyavi, H.; Xu, T.; Homaee, M. Synergetic use of multi-temporal Sentinel-1, Sentinel-2, NDVI, and topographic factors for estimating soil organic carbon. CATENA 2022, 212, 106077. [Google Scholar] [CrossRef]
- Wang, H.; Zhang, X.; Wu, W.; Liu, H. Prediction of Soil Organic Carbon under Different Land Use Types Using Sentinel-1/-2 Data in a Small Watershed. Remote Sens. 2021, 13, 1229. [Google Scholar] [CrossRef]
- Chang, C.W.; Laird, D.A.; Hurburgh, C.R. Influence of soil moisture on near-infrared reflectance spectroscopic measurement of soil properties. Soil Sci. 2005, 170, 244–255. [Google Scholar] [CrossRef] [Green Version]
- Dwivedi, R. Soil resources mapping: A remote sensing perspective. Remote Sens. Rev. 2001, 20, 89–122. [Google Scholar] [CrossRef]
- Jaber, S.M.; Lant, C.L.; Al-Qinna, M.I. Estimating spatial variations in soil organic carbon using satellite hyperspectral data and map algebra. Int. J. Remote Sens. 2011, 32, 5077–5103. [Google Scholar] [CrossRef]
- Heuvelink, G.; Webster, R. Modelling soil variation: Past, present, and future. Geoderma 2001, 100, 269–301. [Google Scholar] [CrossRef]
- Bhunia, G.S.; Kumar Shit, P.; Pourghasemi, H.R. Soil organic carbon mapping using remote sensing techniques and multivariate regression model. Geocarto Int. 2019, 34, 215–226. [Google Scholar] [CrossRef]
- Paul, K.I.; Polglase, P.J.; Nyakuengama, J.; Khanna, P. Change in soil carbon following afforestation. For. Ecol. Manag. 2002, 168, 241–257. [Google Scholar] [CrossRef]
- Xu, J.; Zhu, W.; Xu, J.; Wu, J.; Li, Y. High-intensity longwall mining-induced ground subsidence in Shendong coalfield, China. Int. J. Rock Mech. Min. Sci. 2021, 141, 104730. [Google Scholar] [CrossRef]
- Xiao, W.; Lv, X.; Zhao, Y.; Sun, H.; Li, J. Ecological resilience assessment of an arid coal mining area using index of entropy and linear weighted analysis: A case study of Shendong Coalfield, China. Ecol. Indic. 2020, 109, 105843. [Google Scholar] [CrossRef]
- Xiao, W.; Zhang, W.; Ye, Y.; Lv, X.; Yang, W. Is underground coal mining causing land degradation and significantly damaging ecosystems in semi-arid areas? A study from an Ecological Capital perspective. Land Degrad. Dev. 2020, 31, 1969–1989. [Google Scholar] [CrossRef]
- Nelson, D.W.; Sommers, L.E. A rapid and accurate method for estimating organic carbon in soil. Proc. Indiana Acad. Sci. 1975, 84, 456–462. [Google Scholar]
- Yang, J.; Huang, X. The 30 m annual land cover dataset and its dynamics in China from 1990 to 2019. Earth Syst. Sci. Data 2021, 13, 3907–3925. [Google Scholar] [CrossRef]
- Fan, L.; Ma, X.; Li, Y.; LI, C.; Yao, C.; Xiang, M.; Wu, B.; Peng, J. Geological disasters and control technology in high intensity mining area of western China. J. China Coal Soc. 2017, 42, 276–285. [Google Scholar]
- Tabios, G.Q., III; Salas, J.D. A comparative analysis of techniques for spatial interpolation of precipitation 1. JAWRA J. Am. Water Resour. Assoc. 1985, 21, 365–380. [Google Scholar] [CrossRef]
- Tang, G.; Yang, X. The Experiment Tutorial of Spatial Analysis with ArcGIS; Science Press: Beijing, China, 2006; Volume 196. [Google Scholar]
- N.S.S.O. (Ed.) Soils of China; China Agricultural Press: Beijing, China, 1998. [Google Scholar]
- Wang, J.; Xu, C. Geodetector: Principle and prospective. Acta Geogr. Sin. 2017, 72, 116–134. [Google Scholar]
- Hbirkou, C.; Pätzold, S.; Mahlein, A.-K.; Welp, G. Airborne hyperspectral imaging of spatial soil organic carbon heterogeneity at the field-scale. Geoderma 2012, 175, 21–28. [Google Scholar] [CrossRef]
- Vaudour, E.; Bel, L.; Gilliot, J.-M.; Coquet, Y.; Hadjar, D.; Cambier, P.; Michelin, J.; Houot, S. Potential of SPOT Multispectral Satellite Images for Mapping Topsoil Organic Carbon Content over Peri-Urban Croplands. Soil Sci. Soc. Am. J. 2013, 77, 2122–2139. [Google Scholar] [CrossRef]
- Zhang, Y.; Shen, H.; Gao, Q.; Zhao, L. Estimating soil organic carbon and pH in Jilin Province using Landsat and ancillary data. Soil Sci. Soc. Am. J. 2020, 84, 556–567. [Google Scholar] [CrossRef]
- Croft, H.; Kuhn, N.; Anderson, K. On the use of remote sensing techniques for monitoring spatio-temporal soil organic carbon dynamics in agricultural systems. Catena 2012, 94, 64–74. [Google Scholar] [CrossRef]
- Grinand, C.; Le Maire, G.; Vieilledent, G.; Razakamanarivo, H.; Razafimbelo, T.; Bernoux, M. Estimating temporal changes in soil carbon stocks at ecoregional scale in Madagascar using remote-sensing. Int. J. Appl. Earth Obs. Geoinf. 2017, 54, 1–14. [Google Scholar] [CrossRef]
- Guerschman, J.P.; Scarth, P.F.; McVicar, T.R.; Renzullo, L.J.; Malthus, T.J.; Stewart, J.B.; Rickards, J.E.; Trevithick, R. Assessing the effects of site heterogeneity and soil properties when unmixing photosynthetic vegetation, non-photosynthetic vegetation and bare soil fractions from Landsat and MODIS data. Remote Sens. Environ. 2015, 161, 12–26. [Google Scholar] [CrossRef]
- Wu, D.; Zhang, G. Influence of Parent Material and Land Use Type on Soil Spectral Inversion Model. Soils 2016, 48, 173–179. [Google Scholar]
- Ao, X.; Baodong, M.; Xingchun, L.; Lixin, W. Spectral testing and quantitative inversion for dust of iron tailings on leaf. Remote Sens. Nat. Resour. 2017, 29, 164–169. [Google Scholar]
- Stallard, R.F. Terrestrial sedimentation and the carbon cycle: Coupling weathering and erosion to carbon burial. Glob. Biogeochem. Cycles 1998, 12, 231–257. [Google Scholar] [CrossRef]
- Borrelli, P.; Robinson, D.A.; Fleischer, L.R.; Lugato, E.; Ballabio, C.; Alewell, C.; Meusburger, K.; Modugno, S.; Schütt, B.; Ferro, V. An assessment of the global impact of 21st century land use change on soil erosion. Nat. Commun. 2017, 8, 2013. [Google Scholar] [CrossRef] [PubMed] [Green Version]
- Xin, Z.; Qin, Y.; Yu, X. Spatial variability in soil organic carbon and its influencing factors in a hilly watershed of the Loess Plateau, China. Catena 2016, 137, 660–669. [Google Scholar] [CrossRef]
- Cambardella, C.A.; Elliott, E. Particulate soil organic-matter changes across a grassland cultivation sequence. Soil Sci. Soc. Am. J. 1992, 56, 777–783. [Google Scholar] [CrossRef]
- Göl, C. Effects of aspect and changes in land use on organic carbon and soil properties in Uludere catchment, semi-arid region: Turkey. Rend. Lincei 2017, 28, 463–469. [Google Scholar] [CrossRef]
- Lal, R. Forest soils and carbon sequestration. For. Ecol. Manag. 2005, 220, 242–258. [Google Scholar] [CrossRef]
- Gao, Y.; Zhu, B.; Zhou, P.; Tang, J.-L.; Wang, T.; Miao, C.-Y. Effects of vegetation cover on phosphorus loss from a hillslope cropland of purple soil under simulated rainfall: A case study in China. Nutr. Cycl. Agroecosystems 2009, 85, 263–273. [Google Scholar] [CrossRef]
- Shrestha, R.K.; Lal, R. Ecosystem carbon budgeting and soil carbon sequestration in reclaimed mine soil. Environ. Int. 2006, 32, 781–796. [Google Scholar] [CrossRef]
- Cheng, J.; Nie, X.; Liu, C. Spatial variation of soil organic carbon in coal-mining subsidence areas. J. China Coal Soc. 2014, 39, 2495–2500. [Google Scholar]
- Zhang, L.; Wang, J.; Bai, Z.; Lv, C. Effects of vegetation on runoff and soil erosion on reclaimed land in an opencast coal-mine dump in a loess area. Catena 2015, 128, 44–53. [Google Scholar] [CrossRef]
- Caddeo, A.; Marras, S.; Sallustio, L.; Spano, D.; Sirca, C. Soil organic carbon in Italian forests and agroecosystems: Estimating current stock and future changes with a spatial modelling approach. Agric. For. Meteorol. 2019, 278, 107654. [Google Scholar] [CrossRef]
- Longbottom, T.L.; Townsend-Small, A.; Owen, L.A.; Murari, M.K. Climatic and topographic controls on soil organic matter storage and dynamics in the Indian Himalaya: Potential carbon cycle–climate change feedbacks. Catena 2014, 119, 125–135. [Google Scholar] [CrossRef]
- Gabarrón-Galeote, M.A.; Trigalet, S.; van Wesemael, B. Soil organic carbon evolution after land abandonment along a precipitation gradient in southern Spain. Agric. Ecosyst. Environ. 2015, 199, 114–123. [Google Scholar] [CrossRef]
- Wang, L.; Chen, W. A CMIP5 multimodel projection of future temperature, precipitation, and climatological drought in China. Int. J. Climatol. 2014, 34, 2059–2078. [Google Scholar] [CrossRef]
Publisher’s Note: MDPI stays neutral with regard to jurisdictional claims in published maps and institutional affiliations. |
© 2022 by the authors. Licensee MDPI, Basel, Switzerland. This article is an open access article distributed under the terms and conditions of the Creative Commons Attribution (CC BY) license (https://creativecommons.org/licenses/by/4.0/).