1. Introduction
Ecotourism is the most unifying alternative strategy, and it is frequently viewed as a panacea capable of balancing economic development, environmental conservation, and community well-being [
1,
2]. According to Fang [
3], ecotourism is typically viewed as a sort of tourism aimed toward relatively undisturbed natural areas and territory protection instead of mass tourism in a built environment, highlighting the concept’s appeal. Sustainable tourist development aims to correct past tourism development models’ flaws. Because tourism is strongly tied to and dependent on a destination’s resources, tourism, whether mass or alternative, will harm the environment [
4]. However, well-managed ecotourism promotes an awareness of the effects of tourism on the natural, cultural, and human surroundings [
5]. Ecotourism is considered alternative tourism based on the above essential criteria. “Ecotourism” is defined as “responsible travel to natural places that protect the environment while also ensuring the well-being of local people” [
6]. According to [
7], ecotourism is defined as “tourism with obligations to natural areas, environmental protection, resident economic development, and the integration of interpretation and education to widen personal experience and knowledge” by the International Ecotourism Society.
Accounting for all the elements considered for ecotourism to be effective is no easy feat. Most ecotourism research has focused primarily on traditional marketing techniques. For instance, “the impact of using online marketing tactics on the Iranian ecotourism business” is being investigated [
8]. It is also crucial to cultivate ecotourism through digital marketing strategies and boost awareness through destination image development. According to [
9], digital marketing is a strategic process of promoting goods and services to a targeted market on the internet by encompassing critical marketing concepts through digital resources, which may include tools such as blogging, search engines, social media, and mobile applications. The activities in tourist locations are primarily influenced by how tourists perceive the destination. Destination image is defined by [
10] as the sum of beliefs, ideas, and impressions that a tourist holds about a destination.
Many previous researchers have looked at the relationship between digital marketing strategies and ecotourism behaviour; however, only a few have examined the intervening elements in this relationship [
11,
12]. Most ecotourism research has focused primarily on traditional marketing techniques. For instance, “the impact of using online marketing tactics on the Iranian ecotourism business” is being investigated [
8]. There are no intervening variables mentioned in the study, which focuses only on the internet marketing perspective. Destination image is one of the essential aspects of the current study and one of the novel additions to the body of knowledge as a mediating variable between digital marketing strategies and ecotourism behaviour. It is critical to improve and raise the destination’s image and awareness by relating findings from the study [
13] to plans for ecotourism behaviour development in the locations. The image of a destination is an essential component of ecotourism and significantly influences tourist growth.
It is also crucial to cultivate ecotourism through digital marketing strategies and boost awareness through destination image development. The activities in tourist locations are primarily influenced by how tourists perceive the destination. As a result, it is essential to market tourism to encourage people to visit these places while being environmentally responsible. There has not been much literature on digital marketing strategies to measure ecotourism behaviour. Most ecotourism research has focused primarily on traditional marketing strategies [
14]. The current study investigated the novel relationship between digital marketing strategies and ecotourism behaviour, as well as the theories that underpin it, including the Theory of Planned Behaviour (TPB). To better understand the complexities of human behaviour, the TPB has been utilized to analyse and anticipate human behaviour. The TPB expands on the TRA (theory of reasoned action) [
15].
The preceding work has not holistically explored the Theory of Planned Behaviour (TPB) in digital marketing strategies, destination image, and ecotourism behaviour. On the other hand, the TPB is employed in this study to determine if environmental attitudes, subjective norms, and perceived behavioural control influence ecotourism activity in natural regions. Furthermore, in the current study, the purpose is employed as the destination pictures, and the actual action is replaced with ecotourism behaviour.
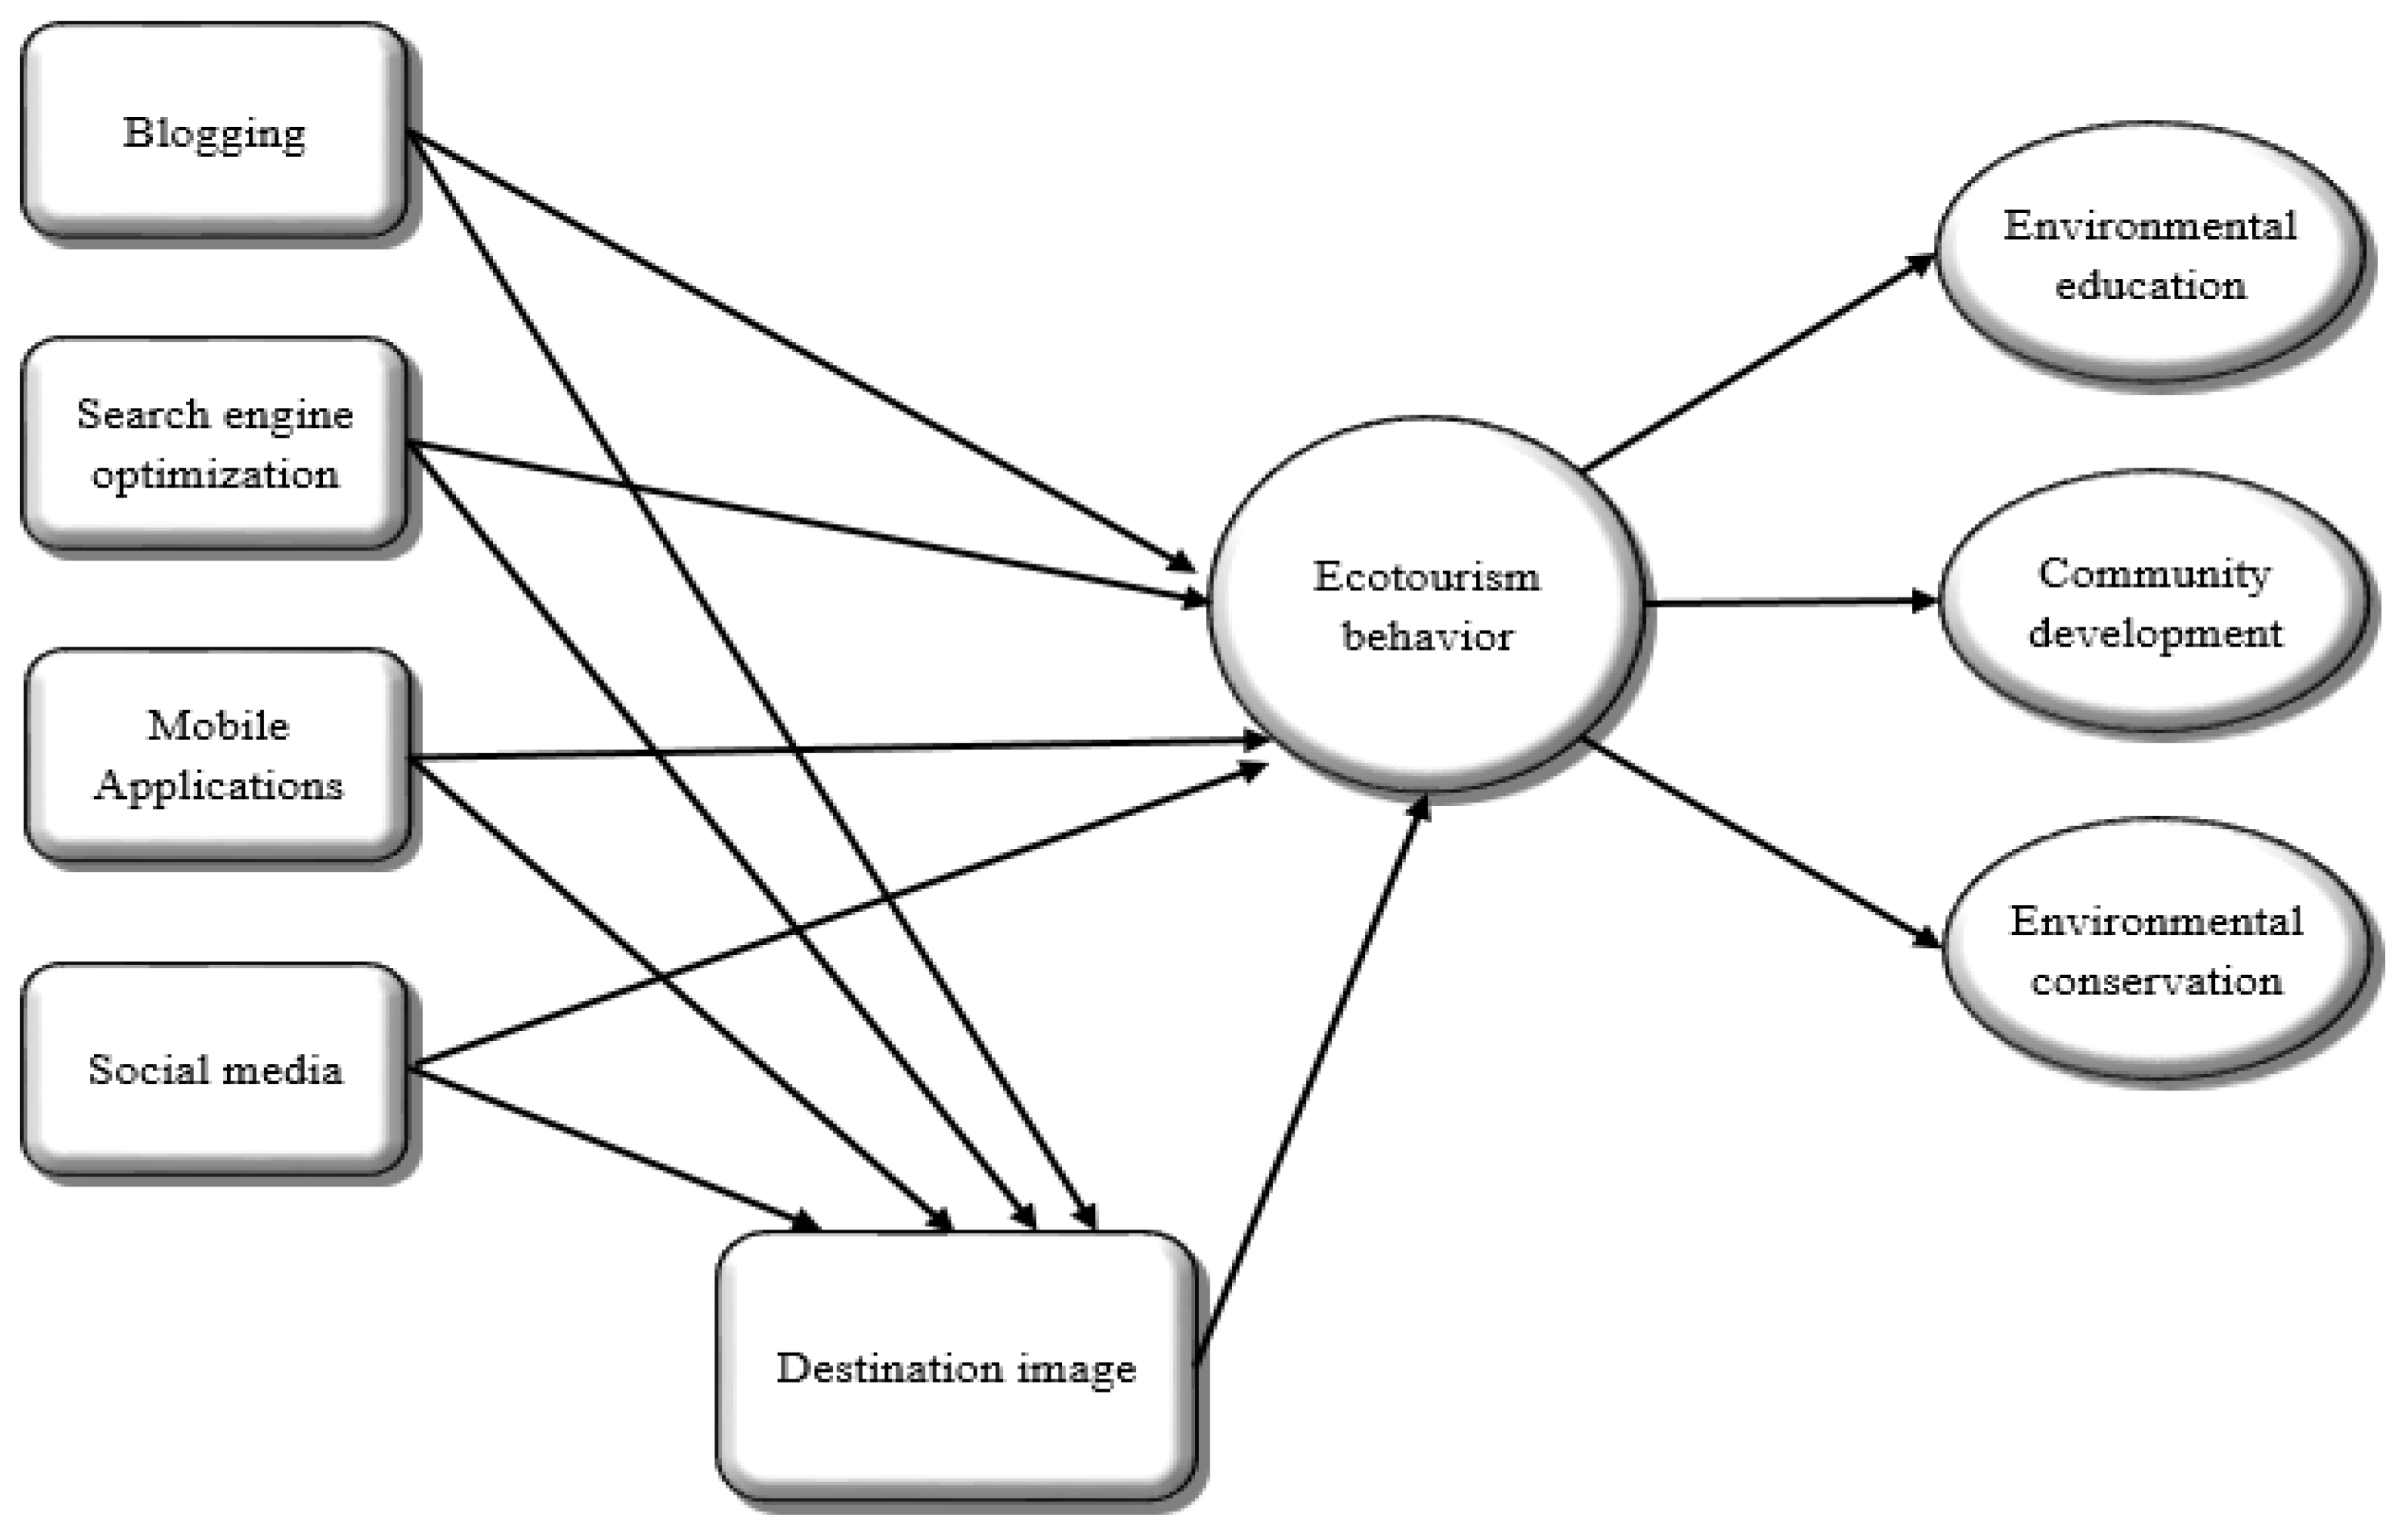
The current study aims to identify the relationship between digital marketing and ecotourism behaviour in the Pakistani tourism industry. Digital marketing strategies such as blogging, social media, mobile applications, and search engine optimisation are used for the current research; on the other hand, ecotourism behaviour is measured in three dimensions: environmental conservation, environmental education, and community development. The current study also analyses the destination image role as a mediating variable in the relationship between digital marketing strategies and ecotourism behaviour.
2. Conceptual and Theoretical Development
There has not been much research on how to combine ecotourism with internet marketing in the past. Most ecotourism research has solely looked at standard marketing methods [
16]. In many regions of the globe, the research has tended to employ online marketing techniques for ecotourism behaviour. However, in earlier research, ecotourism has been discussed on the internet and in online marketing, and the message of ecotourism behaviour development among tourists visiting natural conservation locations has been conveyed. Most online and internet marketing research does not consider more effective online marketing tactics.
For instance, the impacts of using online marketing strategies in the Iranian ecotourism tourist business were studied with no intervening variable between the dependent and independent variables [
8]. In addition, Varkaris and Neuhofer [
17] used social media to improve ecotourism in their model because social media plays a significant role in influencing modern tourists’ decision-making processes and developing ecotourism behaviour. However, the model did not use any intervening variable and strategy to promote ecotourism.
On the other hand, the current study developed the conceptual framework from the previous research and analysed some new relationships in the body of knowledge.
Figure 1 shows the conceptual framework developed from the previous literature.
To better understand the complexities of human behaviour, the TPB has been utilized to analyse and anticipate human behaviour. The TPB expands on the TRA (theory of reasoned action) [
15]. The TRA examines how behavioural intention, attitude, and subjective criteria influence human behaviour [
18]. Ajzen [
15] introduced a new component to his model (i.e., perceived behavioural control). Ajzen [
15] utilized the TPB to show how attitude, subjective norms, and perceived behavioural control influence behavioural intention, driving actual behaviour.
Many previous studies have used the TPB model to investigate environmental behaviour [
19], ecological behaviour [
20,
21], low carbon behaviour [
22,
23], and green consumption [
24,
25]. These findings support the TPB model’s ability to increase the explanatory and forecasting capacity of human behaviour. Like ordinary individual decision-making behaviour, tourist behaviour is impacted by contextual interpretations and is not fully independent. As a result, this study uses a destination image as a mediating variable in the link between digital marketing and ecotourism behaviour
However, theoretical development in the digital marketing and ecotourism behaviour relationship is vital in the previous literature. In this study, the TPB predicts and explains visitors’ ecotourism behaviour by considering environmental attitude, subjective norms, perceived behaviour control, and ecotourism behavioural intention. Attitude, subjective norms, and perceived behavioural control are among the digital marketing strategies used in this study. The linkage between ecotourism behaviour and destination image is missing from digital marketing strategies in the literature. On the other hand, the TPB is used in this study to see if environmental attitudes, subjective norms, and perceived behavioural control impact ecotourism behaviour in natural areas.
Furthermore, the intention is used as the destination image in the current study, and actual behaviour is replaced with the ecotourism behaviour in the current study. That is the theoretical contribution of the current study.
2.1. Hypotheses Development
To achieve the objectives outlined in
Section 1, multidisciplinary literature relating to this research has been reviewed, and the following hypotheses were developed.
2.1.1. Digital Marketing Strategies and Ecotourism
Thousands of individuals have started writing blogs about their travels. These blogs address all travel elements, such as applying for a visa, booking tickets/vehicles/accommodation, describing local lifestyles, explaining customs processes, advising on to-do activities in the locations, and providing travel advice [
26]. Travellers are increasingly considering online comments while making vacation selections due to the exponential increase in the popularity of blogging [
27]. However, an investigation of the impact of social media on dominant social media platforms, such as Facebook, Instagram, YouTube, LinkedIn, and Twitter [
28], has been undertaken on dominant social media platforms, such as Facebook, Instagram, YouTube, LinkedIn, and Twitter, while social media platforms have been mainly ignored [
29].
In addition, the current popularity and introduction of mobile applications may be traced back to the widespread use of cell phones, which have long helped regulate visitor experiences [
30]. Because mobile apps are more difficult to use in a ubiquitous usage environment due to time restrictions, lighting conditions, bandwidth, and other factors, user adoption of mobile applications is heavily reliant on the application’s adaptability to the specific usage context [
31]. Moreover, search engine marketing has become a burgeoning industry in the digital world for destinations to better understand their foreign clients and what type of ecotourism destination they should promote. Search engines have evolved into one of the essential methods for travellers to find and filter information and a critical channel for hospitality and tourist firms to reach out to potential customers [
32].
Hypothesis (H1). Blogging is positively related to ecotourism behaviour.
Hypothesis (H2). Search engine optimisation is positively related to ecotourism behaviour.
Hypothesis (H3). Mobile applications are positively related to ecotourism behaviour.
Hypothesis (H4). Social media is positively related to ecotourism behaviour.
National experiences, widely shared online blogs, are a significant data source for assessing tourist destinations’ performance and understanding travellers’ views, behaviours, and expectations [
33]. Regarding image inconsistency, travellers’ perceptions of a location have been out of sync with blogging sources [
34]. In addition, to build a successful search engine optimisation campaign, tourism marketers must grasp the dynamic nature of travel information search using search engines [
35]. SEO growth benefits tourism destinations because it increases efficiency and aids in re-engineering communications tactics. At the same time, the internet and online platforms have emerged as the most significant arena for destination branding and the first choice when individuals seek information about locations [
36].
Furthermore, mobile applications are an excellent method for travel-related businesses to develop long-term partnerships with visitors. Mobile applications enable travel-related businesses to deliver new, fascinating, and creative experiences for their customers in today’s business climate [
22]. Mobile apps assist customers and travellers in finding and understanding more about travel information, goods, and services in the destination. Travel managers frequently use mobile phones to develop marketing plans for providers [
37].
Additionally, for many businesses, social media is becoming a separate tourist marketing and communication strategy since marketers can directly connect with tourists and influence their decision-making processes by using social media platforms [
38]. Moreover, social media may play an important role in improving the quality of tourist destinations in terms of awareness and planning to safeguard environmental degradations, as well as in the creation of new destinations for tourists [
39].
Hypothesis (H5). Blogging is positively related to the destination image.
Hypothesis (H6). Search engine optimisation is positively related to the destination image.
Hypothesis (H7). Mobile applications are positively related to the destination image.
Hypothesis (H8). Social media is positively related to the destination image.
Hypothesis (H9). Destination image is positively related to ecotourism behaviour.
2.1.2. The Mediating Role of Destination Image between Digital Marketing Strategies and Ecotourism
Many individuals are becoming interested in the tourist community; personal travel evaluations and bloggers promote ecotourism [
40]. Ecotourism is viewed as a commodity that must be promoted through digital marketing strategies. We have only come across a few instances of tourist events being used to improve the image of ecotourism destinations since they are incompatible with natural sustainability. Other marketing strategies are required to improve the economic element, including social media marketing and tourism events [
41]. In addition, ecotourism draws visitors who wish to experience natural beauties and conserve them for future generations. Tourists are well aware of the benefits of utilising technology to obtain information about ecotourism. Because many ecotourism locations are remote from technological infrastructure, search engine optimisation is essential for marketing the destination’s image [
42].
According to data conducted by a full-service online travel agency, the mobile trend in the tourist sector is huge [
43]. Mobile applications help improve the image of a destination and promote ecotourism behaviour among visitors who are planning to come. To grasp the challenges local ecotourism destinations have in leveraging modern technology to bring their communities to the awareness of potential tourists necessitates a thorough understanding of how travellers interact with mobile applications [
44]. In addition to this, social media is becoming increasingly important in tourism, including destination suitability, ecotourism promotion, and focusing on the best practices for interacting with travellers via social media channels (social sharing of holiday experiences) for environmental awareness and protection [
45].
Hypothesis (H10). Destination image mediates the relationship between blogging and ecotourism behaviour.
Hypothesis (H11). Destination image mediates the relationship between search engine optimization.
Hypothesis (H12). Destination image mediates the relationship between mobile applications and ecotourism behaviour.
Hypothesis (H13). Destination image mediates the relationship between social media and ecotourism behaviour.
4. Data Analysis and Results
Data analysis aims to identify answers to the research questions presented in chapter one. To test all assumptions, this part is based on statistical analysis. Because this is quantitative research, statistical analysis is performed using SPSS 21, and SEM uses clever PLS 3.2. This statistical technique is trustworthy and widely utilised in social science studies. The link between independent, mediating, and dependent factors has been examined in this study based on causal relationships among variables. The data is acquired over a set period, making it a cross-sectional study. A cross-sectional study is appropriate in this case since the researcher investigated the link using causal relationships [
62].
4.1. Sample Characteristics
The demographic information of the respondents for the current research is as follows. Items such as digital marketing medium, region, gender, and age are among the sample characteristics. The current study focuses on gathering information from visitors visiting three distinct areas of Pakistan. The proportion of visitors who utilise different digital marketing channels is: Facebook (153%), YouTube (74%), Instagram (44%), Twitter (32%), Blogging (22%), Mobile Applications (25%), and Search Engine Optimization (SEO) (34%).
The Naran and Kaghan region received 157 tourists (40%), whereas the Gilgit Baltistan region received 154 tourists (40%) and the Galyat region received 76 tourists (20%). Furthermore, male visitors comprised 287 (72.8%) of all visitors, while female visitors comprised 97 (27.2 %). Tourists aged 18-24 accounted for 243 (62.3%), 25-29 accounted for 43 (11.6%), 30-35 accounted for 44 (11.9%), and those aged 36 and over accounted for 54 (13.3 %). The visitors who employed digital marketing tactics for travel in Pakistan’s northern territories were sampled for the study. The findings above show that data acquired from digital marketing users.
4.2. KMO and Bartlett’s Test
Data reduction techniques were applied to investigate the subsets of questions, usually called dimensions. Prior scientific studies are featured because numerous variables are used to characterise objects [
63]. Generally, exploratory factor analysis (EFA) consists of two stages. Stage one analyses common variations through principal component analysis (PCA). Stage two is rotated component analysis, which identifies components that cause latent construct variation. The present study used EFA to test common method bias using the single-factor method.
KMO and Bartlett’s test is used to verify if data is adequate for the factor analysis. Once verified, the researcher’s data adequacy for factor analysis moves to the next step.
Table 1 shows the results of the principal component analysis and the Kaiser–Meyer–Olkin measure of sampling adequacy (KMO), which indicates the suitability of data for dimension reduction analysis (EFA). The KMO measures sampling adequacy, which indicates the proportion of variance in a latent construct that underlying factors might cause. The KMO value was 0.943, and Bartlett’s test showed a
p value of 0.0000; this indicates the suitability of data for factor analysis.
4.3. Common Method Bias
CMB (Common Method Bias) is a vital issue when it comes to the validity of a link between variables. CMB can be caused for various reasons, including the common rate effect, consistency theme, social desirability, acquiescence biases, standard scale format, item social desirability, and scale length [
64]. To test the presence of common technique bias in the data, the one-factor Standard Technique Variance methodology was utilised, with the variance evaluated being linked to the data collecting method rather than the constructs investigated. Common Method Variance is the name given to this variation (CMV). Much research, particularly that used surveys, questionnaires, or interviews, regarded CMV as a serious concern related to data processing [
65].
The one-factor technique of CMV is one of the most used statistical approaches for detecting common method bias in data. In exploratory factor analysis, all of the measurement items’ loadings are combined into a single factor, and the unrotated component matrix is analysed to identify the variance created by the single factor. The current study used a questionnaire designed by combining the works of other writers to collect data from people visiting Pakistani tourism sites (i.e., some of the items were adopted and some were adapted). As a result, there may be a common method bias. CMV is used to validate the question items across all constructs in the investigation, with just one component retrieved to assess the variance created by the questions in the current inquiry’s single construct. A common variation of less than 50% suggests no common method bias in the data, the value is 40.653.
Table 2 is explaining the total variance explained using single factor analysis.
4.4. Evaluation of PLS Path Model Results
The current study used smart PLS 3.0 to conduct variance-based structural equation modelling. There are two types of models: measurement and structural. The PLS method is used in the measurement model to handle convergent and discriminant validity, while the structural model addresses hypothesis testing to accept or reject the hypothesis.
4.5. Assessment and Goodness of Measurement Model
All verified constructs validated by confirmatory factor analysis are explored further in the measurement model to see if all confirmed constructs significantly contribute to the model presented in this study. Since reflective measurement methods are used, the study examines internal consistency reliability, convergent validity, and discriminant validity. Each examination is given considerable thought. The measuring model is depicted in
Figure 2.
4.6. Construct Validity
Construct validity refers to how a test decides what it takes to measure or purports to measure [
66]. There are two approaches to assessing concept validity: convergent validity and discriminant validity [
67]. According to the authors, convergent validity relates to how closely the measures of the same conceptions are related. In contrast, discriminant validity refers to how distinct one thinking is from another. Brown [
66] defines construct validity as “the capacity of the selected measures to depict the scenario’s components accurately.”
4.7. Convergent Validity
Hair et al. [
68] define convergent validity as the association between measures of the same idea and is concerned with construct loadings and Average Variance Extracted (AVE). Higher outer loading on a construct indicates that the associated indicators or items used to gauge the same concept share many similarities [
67]. The outside loading (standardised) indication should be 0.700 or higher since it represents how severely all of the building pieces are loaded. Any exterior loading with a value less than 0.7 is recommended to remove. The items, however, can be preserved if the construct’s Average Variance Extraction value is more than 0.50 [
67].
Table 3 displays the results of the initial measurement model.
The Average Variance Extracted (AVE) for the construct should be 0.5 or more, suggesting that the constructs, on average, describe more than the portion of the variation in their indicators. If the AVE is less than 0.5, the measurement items are more likely to include errors.
“The grand mean value of the squared loadings of the indicators associated with the notion”, according to the average variance extraction criterion. The average variance extraction for each component is shown in
Table 3. As said before, a hidden variable with an average variance extraction value of 0.5 or above may, on average, describe more than half of the variation in its indicators. As a result, it was deemed adequate [
67]. The variance values for all constructs demonstrate convergent validity whenever the Average Variance Extracted is more than 0.50. The present investigation’s initial finding showed a low Average Variance Extraction result. However, after deleting the items with low factor loading, the constructs’ Average Variance Extraction met the required criterion of 0.50.
The researchers then calculated the construct reliabilities of the variables; the construct reliability values for each variable are shown in
Table 3. The construct dependability cut-off value is 0.70 or above [
69,
70].
Table 4 indicates that the excellent dependability of all constructions varies from 0.823 to 0.943. Ecotourism had a composite reliability of 0.943, mobile apps had a reliability of 0.887, social media had a reliability of 0.907, blogging had a reliability of 0.823, search engine optimisation had a reliability of 0.874, and destination image had a dependability of 0.915. This demonstrates that fair composite reliability values produce convergent validity.
4.8. Discriminant Validity
The extent to which an instrument has a truly distinct notion from all others is discriminant validity [
67]. The amount to which similar concepts have unique values is discriminant validity. It indicates that a construct is one-of-a-kind and that its logic is mirrored in the model. Discriminant validity is proven when the square root of the Average Variance Extraction surpasses the value of interconstruct correlations. In this study, two criteria were employed to assess the discriminant validity of the components. Cross-loadings and the Fornell–Larcker criterion were utilised [
67,
71]. According to the Fornell–Larcker criterion, the square root of the Average Variance Extraction of each latent construct is more essential than the latent interconstruct correlation with other latent variables in the model [
67]
In contrast, cross-loadings on the pointers’ outer loading on the linked build are more significant than loadings on additional structures.
Table 4 explains the Fornell–Larcker criterion for discriminant validity, and
Table 5 shows cross-loadings for all constructs. As shown in
Table 4 of the Fornell-Lacker criterion, the square root of the Average Variance Extraction of each latent construct is greater than the latent interconstruct correlation with another latent variable in the model. In
Table 4 on cross-loadings, the outer loading of the indicators on the linked construct is greater than the other construct loadings. These tests have revealed that the discriminant validity of all constructs is adequate.
4.9. Assessment of te hStructural Model
Once the measurement of the exterior models has been demonstrated to be reliable and valid, the structural or inner models are reviewed. The procedure would include analysing the model’s prediction skills and the linkages among the components [
67]. In other words, a structural model evaluation is carried out to put the postulated relationship inside the inner model to the test. The measuring model in this study is depicted in
Figure 2, which contains the independent, dependent, and mediating variables. The postulated relations among constructs in the recent analyses are defined by three criteria, Coefficient of Determination (R
2) of endogenous constructs, Effect Size (ƒ
2), and Path Coefficients.
4.10. Coefficient of Determination (R2)
The R
2 score reflects how well the appropriate model explains the variation in the dependent variables—the higher the R2 value, the better the structural model in forecasting the future. The primary purpose of PLS-SEM is to enhance the R2, since the goal is to explain the endogenous latent variable. According to J. F. Hair et al. [
67], the range of R2 is 0 to 1, with values of 0.75, 0.50, and 0.25 indicating considerable, moderate, and modest predictive accuracy, respectively.
Table 6 displays the R2 values for endogenous constructs.
The current research results show that the R2 value for destination image is 0.556, which is strong, and for ecotourism, it is 0.472, which is moderate.
4.11. Effect Size (f2)
Furthermore, the R
2 values of every endogenic component and the effect size of a predictor latent construct at the structural level were studied to assess model fitness in the current work. In this investigation, the effect size (f
2) determines if the missing construct substantially impacts the endogenous components. To calculate effect magnitude, multiply R2 by the amount of variation in the endogenous latent variable that remains unexplained. Cohen (1988) defined small, moderate, and significant effects as two values of 0.02–0.14, 0.15–0.34, and greater than 0.35.
Table 7 shows the two values for each path.
Table 7 below presents the ƒ2 value for each path. The effect size varies from a minimum of 0.003 for blogging and destination images to a high of 0.238 for social media destination images.
4.12. Path Coefficients
PLS-SEM uses the path coefficient to evaluate the strength and significance of anticipated links between latent components. Structural model connections are calculated using standardised values between −1 and +1, with coefficients closer to +1 suggesting a robust positive association and coefficients closer to −1 indicating a strong negative relationship.
4.13. Hypothesis Testing
OLS beta coefficients are another name for these path coefficients (Ordinary Least Square). The bootstrapping approach is used to compute the empirical t-value for the route coefficients to test the significance of anticipated connections. As a result, the significance is crucial, as it would want managerial attention.
Table 8 summarises the findings of hypothesis testing. This study model may investigate the relationship between blogging, mobile applications, search engine optimisation, social media, destination image, and ecotourism.
Figure 3 shows the results of the structural model.
The current study offered four primary hypotheses to analyse the link between the variables. According to the hypothesis, the path coefficient for blogging (ecotourism) was reported as a t-value of 4.057, more than the threshold value of 1.96. The p-value was reported as 0.000, which is significant at any value less than 0.05. Hypothesis (H1) was accepted, and blogging has a positive influence on ecotourism. In addition, the path coefficient for search engine optimisation ecotourism was 0.084, and the t-value was 1.476, which is less than the threshold value of 1.96, and the p-value was 0.140, which is not significant at any value less than 0.05. Hypothesis (H2) was shown to be not significant, and SEO has no positive influence on ecotourism according to the findings of this study. In addition to this, the path coefficient for mobile applications ecotourism was 0.313, and the t-value was 0.226, which is less than the threshold value of 1.96, and the p-values were 0.821, which is more than 0.05. Hypothesis (H3) was also rejected, and mobile applications impact ecotourism. On the other hand, a value less than 0.05 is considered significant for the path coefficient for social media (ecotourism was 0.182, and the t-value was reported as 2.850, which is larger than the threshold value of 1.96, and the p-value was 0.004). This study indicated that Hypothesis (H4) was correct, and social media positively influenced ecotourism.
The study’s empirical data rejected Hypothesis (H5), and blogging did not positively affect destination image. The structural model’s findings are shown in
Table 9, which shows that the path coefficient for blogging → destination Image is 0.048, the t-value is 1.004 and the
p-value is 1.004, all of which are higher than the threshold level. In addition to this, for search engine optimisation → destination image, the path coefficient was 0.084, the t-value was 1.991, and the
p-value was 0.047, which was less than the 0.05 significance threshold. Hypothesis (H6) was accepted based on the outcomes of this study, and search engine optimisation had a positive impact on destination image. In addition, the path coefficient for mobile applications → destination image was 0.248, with a t-value of 4.684 and a
p-value of 0.000, which is less than the significance threshold of 0.05. The study’s empirical findings revealed that Hypothesis (H7) was accepted, and mobile applications positively impacted destination image.
Furthermore, the path coefficient for social media → destination image was 0.479, and the t-value was 7.820, which is more than the threshold value of 1.96, and the
p-value was 0.000, which is regarded as significant at any value less than 0.05. The study’s empirical findings supported Hypothesis (H8), suggesting that social media positively influences destination image. In addition, the path coefficient for destination image → ecotourism was 0.345, and the t-value was 5.245, which is larger than the threshold value of 1.96, and the
p-value was 0.000, which is regarded as significant at any value less than 0.05. Hypothesis (H9) was accepted based on the outcomes of this study, and destination image had a positive influence on ecotourism.
Table 8 illustrates the details of the direct relationship.
4.14. Analysis of the Effect of Mediator
All indirect effects were calculated in the second phase, and their significance was determined via bootstrapping. All mediators were computed at stage two of the analysis to analyse the study’s indirect effects. The indirect route coefficient for blogging → destination image → ecotourism was 0.016. To determine the relevance of the indirect path, the researchers used 1000 rounds of bootstrapping. The indirect path’s t-value was 0.961, with a
p-value of 0.337, and the route coefficient was 0.016. However, the upper and lower confidence bounds are zero, suggesting that the indirect path was significant but with zero confidence limits. This violates the third condition set out by [
72]. Hypothesis (H10) was ruled out consequently. In addition, the relationship between search engine optimisation and ecotourism ”demonstrated the immediate effect without inserting the destination image into the model”.
Table 9 shows the results of the mediation analysis. The indirect route coefficient for search engine optimization → destination image → ecotourism is 0.028. To determine the relevance of the indirect path, the researchers used 1000 rounds of bootstrapping. According to the findings, the indirect technique has a value of 1.903 and a
p-value of 0.057. This illustrates the insignificance of the indirect path. Finally, the indirect path coefficient for mobile applications → destination image → ecotourism is 0.085. To determine the relevance of the indirect path, the researchers used 1000 rounds of bootstrapping. According to the findings, the indirect path’s t-value was 3.237, with a
p-value of 0.001. This emphasises the significance of the other path. According to Hypothesis (H13), “destination image impacts the relationship between social media and ecotourism.” The indirect path coefficient for social media → destination Image → ecotourism is 0.165. To determine the relevance of the indirect path, the researcher used 1000 rounds of bootstrapping. According to the findings, the indirect path’s t-value was 4.580, with a
p-value of 0.000. This emphasises the significance of the indirect path.
5. Conclusions
This research provides theoretical implications for understanding digital marketing and ecotourism behaviour. The researchers are primarily interested in researching the indicators of tourism destination growth with digital marketing to tourists at tourism destinations [
73]. Previous studies have neglected the digital marketing strategies for conserving the natural environment, community development, and educational opportunities connected to natural places with the destination image. Few academics have concentrated their efforts on conserving natural areas using digital marketing strategies [
19]. The current study used the concept of the Theory of Planned Behaviour and empirically tested the relationship between digital marketing strategies and ecotourism behaviour based on the conservation of natural areas, community development, and environmental education.
The current study employed a digital marketing approach to improve ecotourism behaviour among visitors to tourist locations [
72]. Several organisations have adopted digital marketing strategies (blogs, mobile applications, search engine optimisation, and social media) [
74]. However, previous research has revealed little evidence of the TPB theoretical development being applied in digital marketing strategies. The use of digital marketing strategies to replace attitudes toward subjective norms and perceived behavioural control is one of the study’s contributions. Digital marketing strategies are employed as the control behaviour mechanism as a theoretical complement to planned behaviour implementation. The second contribution of the current study is destination image, which is used as the intention that leads to actual behaviour. The third development of the current study in the TPB is that behaviour is employed as ecotourism behaviour.
6. Practical Implications
Furthermore, northern areas of Pakistan are economically underdeveloped and have a limited number of resources. As tourism grows, the community becomes more active in extracting natural resources, resulting in deforestation in most natural regions. Digital marketing strategies can create awareness and education to protect natural areas. The use of digital media in environmental education conveys the message of responsible behaviour, which leads to the long-term growth of visitors visiting the northern areas and the local population. Social media and blogging are extensively utilised to spread information on ecotourism, offering a fantastic opportunity for locals to use these platforms to promote the local natural environment, destination image, and cultural values to tourists. This also benefits the local community economically and sends a message to tourists about responsible behaviour.
Moreover, the tourist sector may use these findings to attract customers and raise awareness of the relevance of ecotourism behaviour. They may utilise digital marketing to protect the environment and encourage sustainable ecotourism behaviour. All players in the Pakistani tourism sector, including departments, private tour operators, and the hotel industry, are critical in raising knowledge about tourists’ destination image and behaviour in these tourist destinations. They can express a message about destination image, such as how pollution, rubbish, and waste can degrade the natural beauty of these locations. Tourists can be educated about these essential habits using digital means.


 ,
, 


