Article

Study on Interparticle Interaction Force Model to Correct Saturation Density of Real Cryogenic Fluid for LBM Simulation

1
School of Energy and Environment, Southeast University, Nanjing 210096, China
2
State Key Laboratory of Technologies in Space Cryogenic Propellants-SEU Research Center, Nanjing 210096, China
3
State Key Laboratory of Technologies in Space Cryogenic Propellants, Beijing 100028, China
*
Author to whom correspondence should be addressed.
These authors contributed equally to this work.
Sustainability 2022, 14(12), 7414; https://doi.org/10.3390/su14127414
Submission received: 8 May 2022 / Revised: 28 May 2022 / Accepted: 7 June 2022 / Published: 17 June 2022

Abstract

:
Cryogenic liquefaction energy storage is an important form of storage for sustainable energy liquid hydrogen and other gases. The weighting parameter A in the parameter-adjusted two-phase LBM model is important for the deviation of simulation results. The aim of this paper is to discover the appropriate parameter to eliminate the deviation, and to solve the problem of large deviation between the theoretical solution and the simulated value that is caused by using different equations of state in LBM simulation. The modified PT equation of state, which is suitable for cryogenic fluids, is combined with the parameter-adjustable two-phase model to simulate the saturation density at different temperatures. Four typical cryogenic fluids—nitrogen, hydrogen, oxygen, and helium—are exploratively simulated to find the suitable parameters to eliminate errors by analyzing the results with theoretical solutions. This is an efficient solution to the deviation between the simulated value and the theoretical solutions, which is caused by the different equation of state in LBM. The optimal A-value of the model based on the PT equation of state was obtained as −0.21, while droplets and bubbles were set into the calculation region, and an inverse relationship between the interface density gradient and temperature was analyzed. The analysis and comparison of the simulation results under the optimal value and the experimental values have laid an important foundation for the phase change simulation of the real cryogenic fluids at the mesoscopic scale.

1. Introduction

Many energy projects (such as liquid hydrogen systems, air liquefied energy storage systems, and large-scale superconducting devices, etc.) will involve multiphase flow and phase transition problems of cryogenic fluids. The evaporation and condensation in cryogenic fluids under the condition of large temperature difference between a cryogenic fluid and its environment (or a small amount of impurities inside) are of great interest and are subject to much research nowadays. The Lattice Boltzmann Method (LBM) developed in the last decade or so is an approach to modeling and simulation of multiphase flow and phase change procedure. Due to its obvious computational advantages and effectiveness in dealing with boundaries, LBM has been used in heat and mass transfer theory study. Initially, LBM was mainly applied to the simulation of hydrodynamics, such as cylindrical winding flow in single-phase flow, driving cavity flow simulation [1,2,3,4].
The main methods currently used in the simulation studies of phase change processes are computational fluid dynamics (CFD) and the particle Boltzmann method (LBM). Although CFD is widely used to simulate one- and two-phase fluid flow states under different conditions, limited success has been achieved in problems involving moving interfaces and high-density ratios [4,5,6,7]. With the development of LBM, it was gradually applied to the multiphase flow simulation. The Lattice Boltzmann Model (LBM) is among the most popular numerical techniques used to model multiphase systems in complex geometries because of its kinetic nature, allowing an easy incorporation of complex physics at a mesoscale, and a straightforward representation of fluid flows in irregular geometries, as well as time-evolving interfaces [8]. Grunau et al. [9] added a two-phase interaction term to the collision term of the model to effect the gradient difference between the two-phase interface and the corresponding surface tension, and the model approach is called the color model. This model is also called the pseudo-potential model [10]. Swift et al. [11] started directly from the free energy theory and constructed the free energy function as an equilibrium state distribution function, and subsequently introduced a thermodynamic pressure tensor which built the total energy of the system conserved. This type of model is called the free energy model. Both of the above-mentioned models use the phase separation method, which generates the phase interface and the corresponding surface tension. Many experts later introduced a lot of large density models based on the above two models [12,13]. Kupershtokh et al. [14] investigated the use of various equations of state (EOSs) in the single-component multiphase Lattice Boltzmann Model, and obtained the correct coexistence curve, especially its low-density part. The Lattice Boltzmann Model for incompressible flow in porous media and the Brinkman–Forchheimer equation are used to simulate the problem. The effect of Reynolds and Prandtl numbers on flow field and temperature distribution is studied at different porosities [15]. Kabdenova et al. [8] incorporated a crossover equation of state into the pseudopotential multiphase Lattice Boltzmann Model (LBM) to improve the prediction of thermodynamic properties of fluids and their flow in near-critical and supercritical regions. Studies were performed to study heat transfer and pressure drop during CO2 flow in the near-critical region [16,17,18,19]. A modified phase transition LB model, combined with a multicomponent LB method, was applied to simulate co-existing boiling and condensation phenomena involving a multicomponent fluid (i.e., water and non-condensable gas) in a confined space [20]. In several studies (e.g., [21,22,23,24,25,26]), the LBM was successfully used to investigate complex phenomena such as melting, gas diffusivity, phase change, and two-phase and three-phase flow in porous media. Therefore, the typical non-ideal gas equation of state vdW equation is introduced into the model to find the optimal A-value to simulate the saturation density value, which is known for higher accuracy in the critical region, and is expected to extend the model’s application area and improve the simulation accuracy for fluid flows around the critical point.
However, there is very little research literature on the LBM simulation of phase transition processes of real substances. There are two reasons for this, the imperfection of the underlying LBM theory for multiphase and phase transitions and the neglect of the thermodynamic properties of real fluids in the model, which hinder the development of LBM concerning the thermodynamic process simulation of real substances. The thermodynamic properties or equation of states of fluids are prerequisites for studying the thermodynamic processes of fluids. The modified PT equation of state which is suitable for strongly polar fluids and cryogenic fluids is introduced into the LBM model to simulate the saturated gas–liquid densities of nitrogen, hydrogen, oxygen, and helium. The appropriate parameters for cryogenic fluids to minimize the deviation of the simulated values and Maxwell theoretical solutions are calculated. Finally, the optimal values of A are obtained to correct the interparticle interaction force equation of the parameter-adjustable two-phase model to the study gas–liquid phase equilibrium of cryogenic fluids for LBM simulation.

2. Method

The error in calculating real cryogenic fluid saturation density for LBM simulation derives from the difficulty in accurately calculating the interparticle force function. To obtain a saturation density consistent with the real cryogenic fluid, the form of the particle force function can be improved and corrected. In the standard evolution equation of the LBGK model [27], the interparticle interaction force is introduced to achieve the phase transition and gas–liquid phase separation. Zhang et al. [28] and Yuan et al. [29] proposed to introduce the equation of state into the pseudo-potential function. So, the effective density function does not have to take a specific function and can be consistent with the thermodynamics-related theory. The pseudo-potential function affects the interparticle interaction force F(x), which Yuan et al. equated approximately as [29]:
F ( x )   c 2 b D φ ( x ) ( 2 α G ) φ ( x )
where c denotes the lattice velocity, b is the discrete velocity direction, D is the number of dimensions, (c2·b)/D = c0, and for the D2Q9 model, c0 = 6. φ(x) is the effective density, and the effective density is expressed as:
φ ( ρ ) = ( P c s 2 ρ ) β G
where α and β are given in the literature [27], and α = 1/4 and β = 3/2 in the D2Q9 model. Zhang et al. [28] avoided finding the effective density directly, so F(x) was again reduced to the spatial gradient of a scalar function in the literature [28] as:
F ( x )   U ( x )
According to Equation (1), the interparticle force can be found as:
F ( x )   c 0 α G ( φ ( x ) ) 2
Equation (2) is introduced into Equation (4) and the model parameters of D2Q9 are introduced as α = 1/4, β = 3/2, and c0 = 6; the following can be derived:
U ( x ) = P ( ρ , T ) c s 2 ρ
To eliminate the error between the calculated saturation density solution and Maxwell’s theoretical solution, and to increase the temperature range that can be simulated, in this paper, two particle interaction forces that were proposed by Yuan et al. [29] and Zhang et al. [28] were investigated. The parameter weighting is used to propose a new mode of action, that is, the parameter-adjustable two-phase model. The expression of the interaction force is given by:
F ( x ) = A U ( x ) ( 1 A ) 3 G φ ( x ) φ ( x )
When A = 1, the expression is the interparticle force Equation (3) proposed by Zhang et al. [28]. When A = 0, the expression is the interparticle force form Equation (1) proposed by Yuan et al. [29].
The modified PT non-ideal gas equation of state is used to find the most suitable value of A to minimize the deviation between the theoretical and simulation solutions. Here again, the D2Q9 model is chosen, the computational region is a 101 × 101 square grid region with periodic boundary conditions all around, a 1% perturbation is given to all regions at the initial moment to make the phase transition happen, and the relaxation time τ = 1. For the equation of state, the values of the parameter constants [29] are taken as a = 9/49, b = 2/21, R = 1, and the units used in the calculations are all lattice units. With the parameter values, Tc = 4/7 and ρc = 7/2 can be obtained.
Figure 1 and Figure 2 show the comparison of the simulation results obtained based on different values of A models of the modified PT equation of state and the Maxwell theoretical solution. The horizontal coordinate is the dimensionless value of density, the vertical coordinate is still the dimensionless value of temperature, and the A-values are taken as 0 and 1, respectively. It can be seen from the figure that when A = 0, the simulation result is larger than that of Maxwell’s theoretical solution, and the maximum error is 15% in the gas phase. When A = 1, the simulation result is smaller than Maxwell’s theoretical solution, and the maximum error with the theoretical solution is 40% in the gas phase. According to the optimal value of the A-value range, after a series of simulation solutions, it is concluded that when A = 0.55, the error between the simulation results and Maxwell’s theoretical solution is 1.5%, which is the smallest. Through the simulation of the non-ideal gas modified PT equation of state, it can be seen that the model is applicable to different equations of state, and when different equations of state are simulated, the optimal A will only be consistent with Maxwell’s theoretical solution, so it has a certain universality.

3. Simulation of Real Cryogenic Fluid

In this section, to simulate the gas–liquid phase transition processes of the cryogenic fluid nitrogen, hydrogen, oxygen, and helium, the suitable equation of state is selected according to the thermodynamic properties of the fluids, i.e., a modified PT equation of state (Equation (7)) [30] which is suitable for cryogenic and quantum fluids (for most cryogenic fluids).
P = R T v b a φ ( T ) v ( v + b ) + c ( v b )
When the parameter-adjustable two-phase model combined with the modified PT equation of state is used for simulation and A takes the optimal value, the calculation results are consistent with Maxwell’s theoretical solution and the error is the smallest. The units used in the simulation are all lattice units and are converted to real physical units by Equation (5). The values of the parameters of the modified PT equation of state are defined by the values of the parameters for the cubic equation of state from the literature [29]: a = 2/49, b = 2/21, c = 0, and R = 1. The D2Q9 model is chosen, and the computational area is a 101 × 101 square grid area with periodic boundary conditions. The square grid region is surrounded by periodic boundary conditions, and a 1% perturbation is given at the initial moment of all the regions to make the phase change happen.
The critical parameter values in the lattice units for different fluids are calculated and converted to critical parameter values in real units for comparison with each other. The critical values under the real physical units and the lattice units are shown in Table 1.

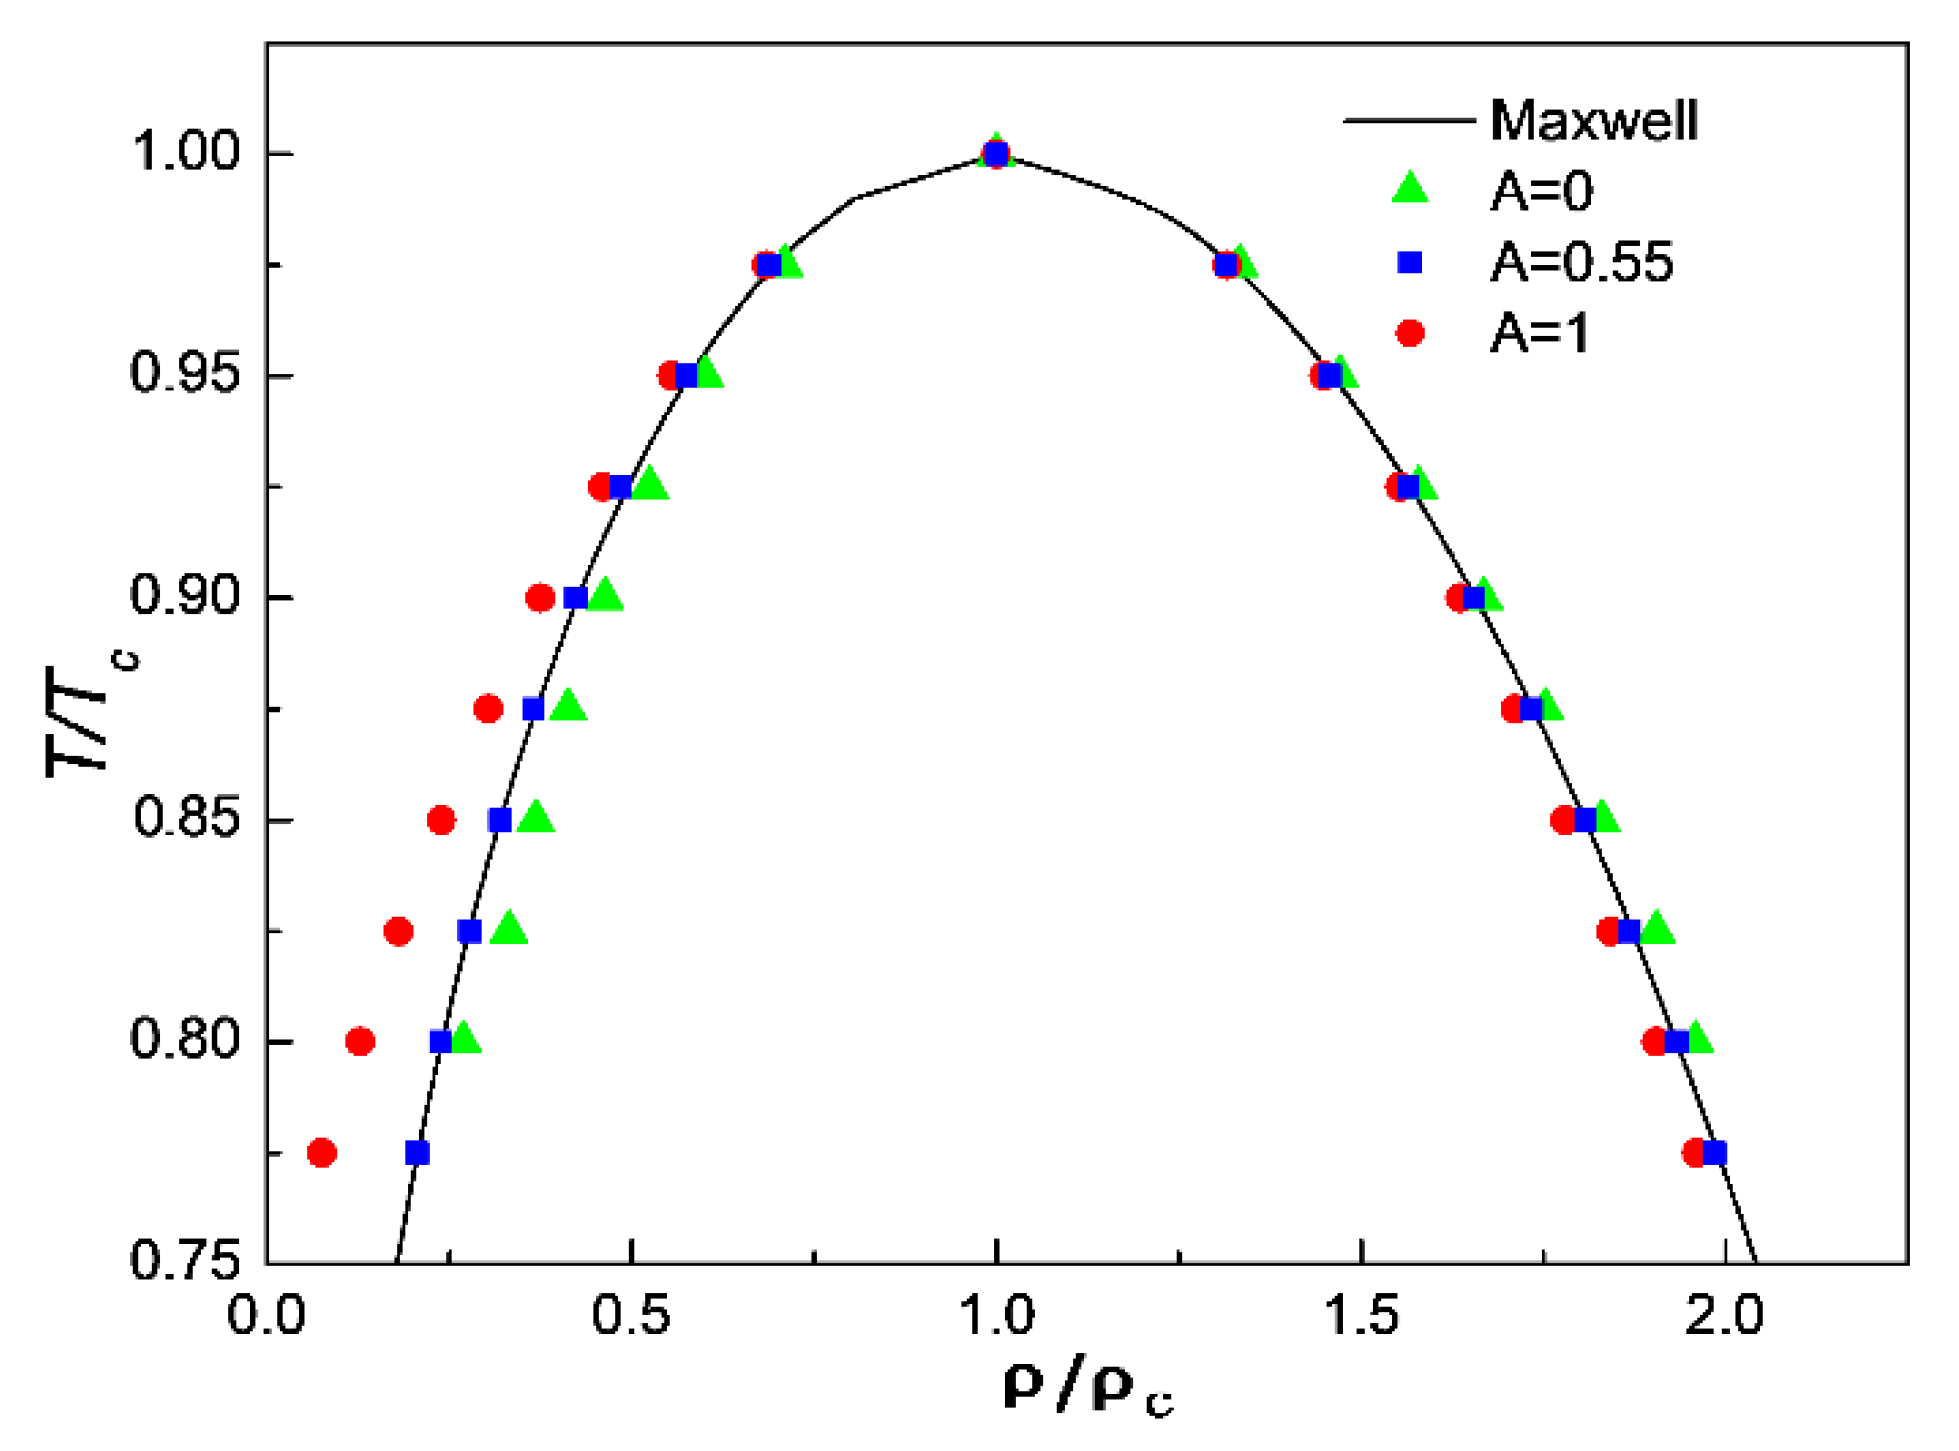
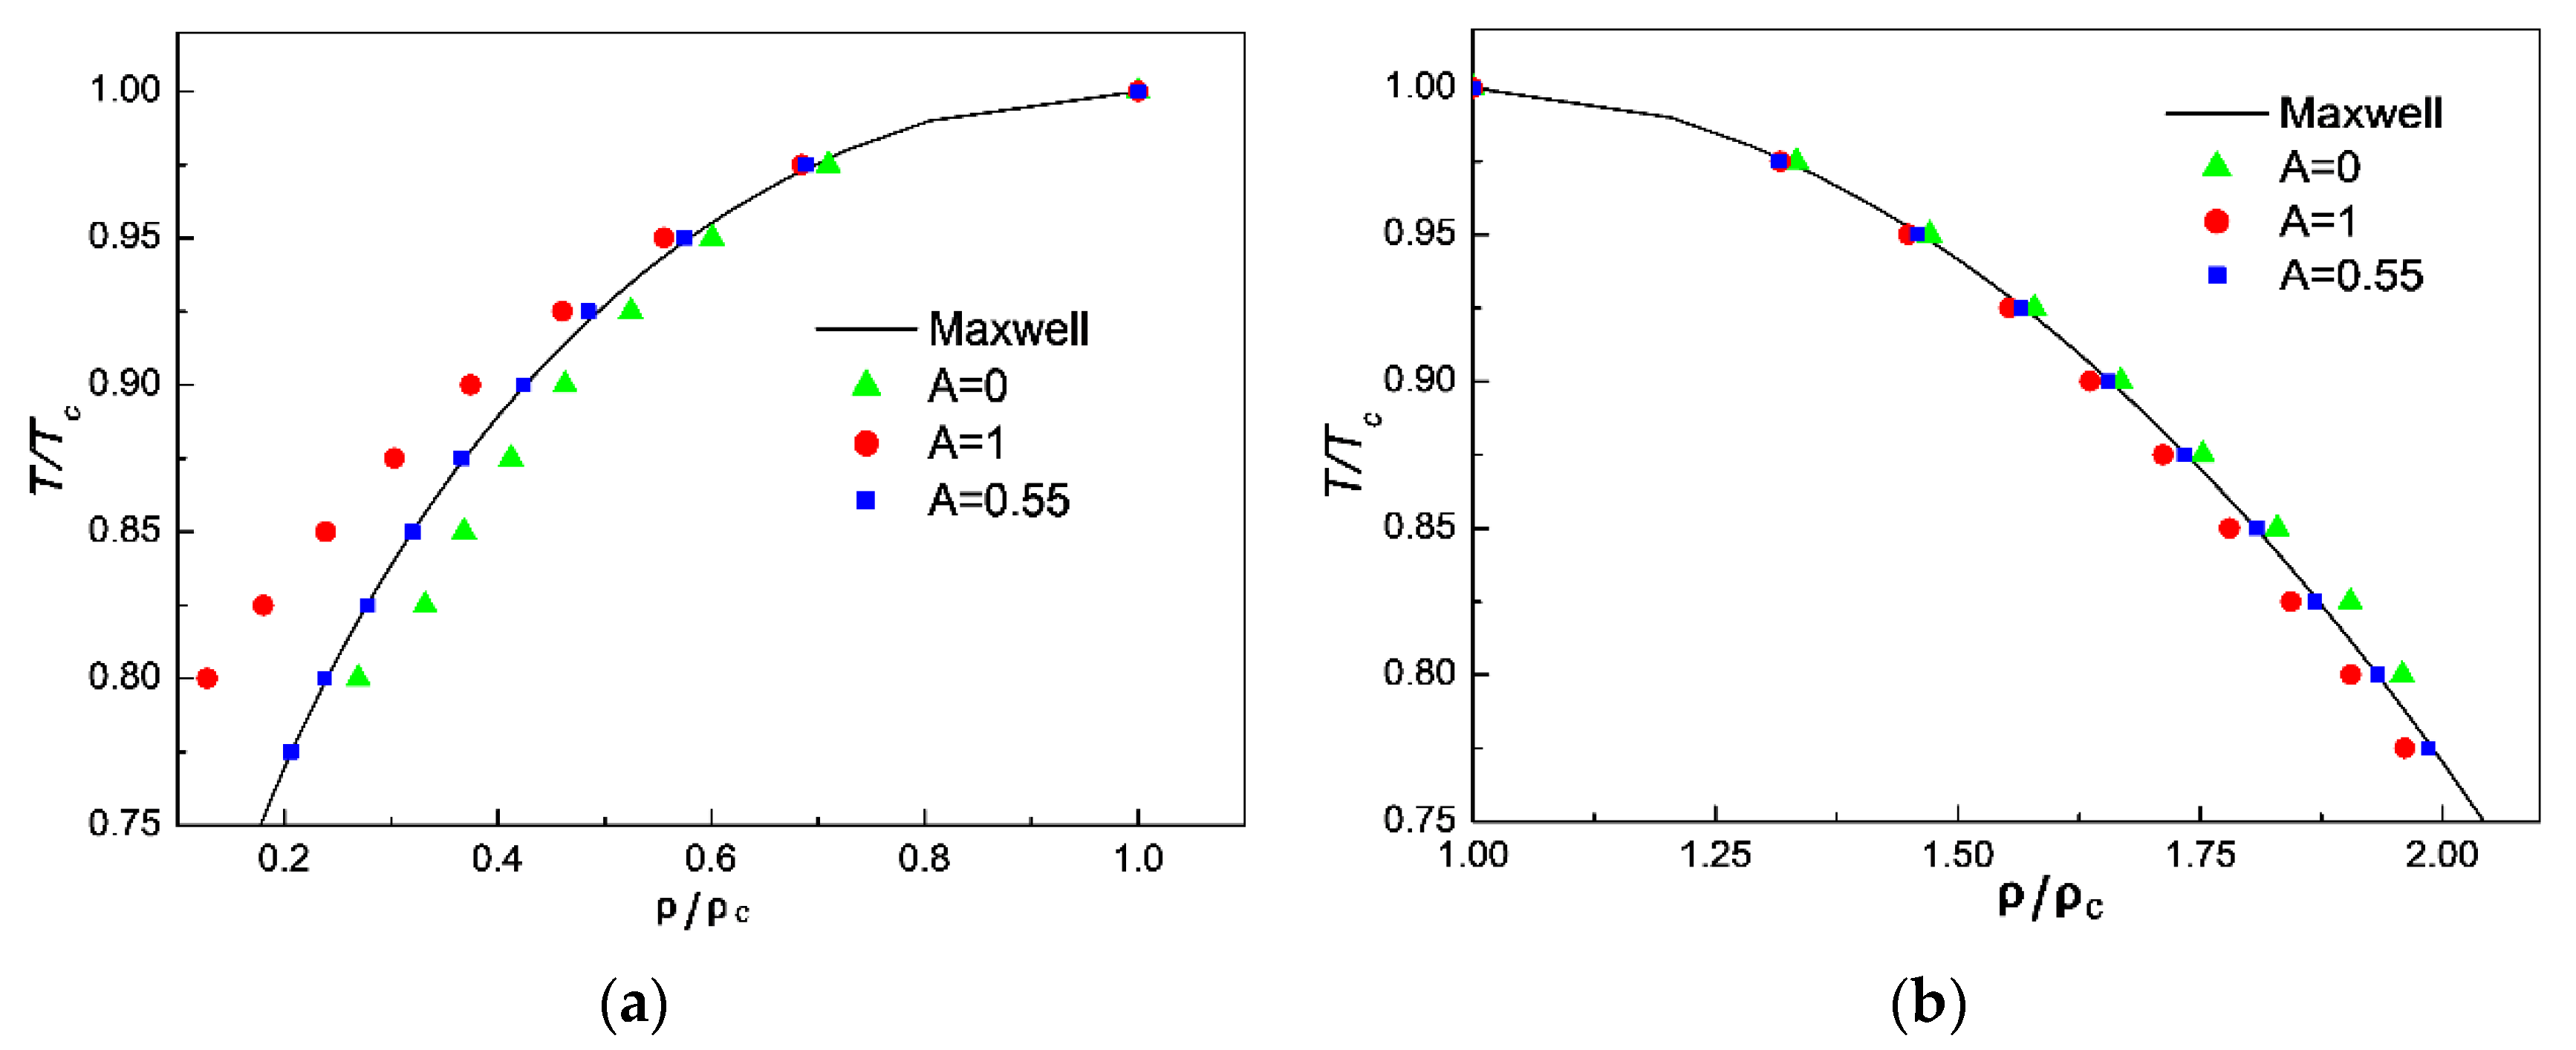
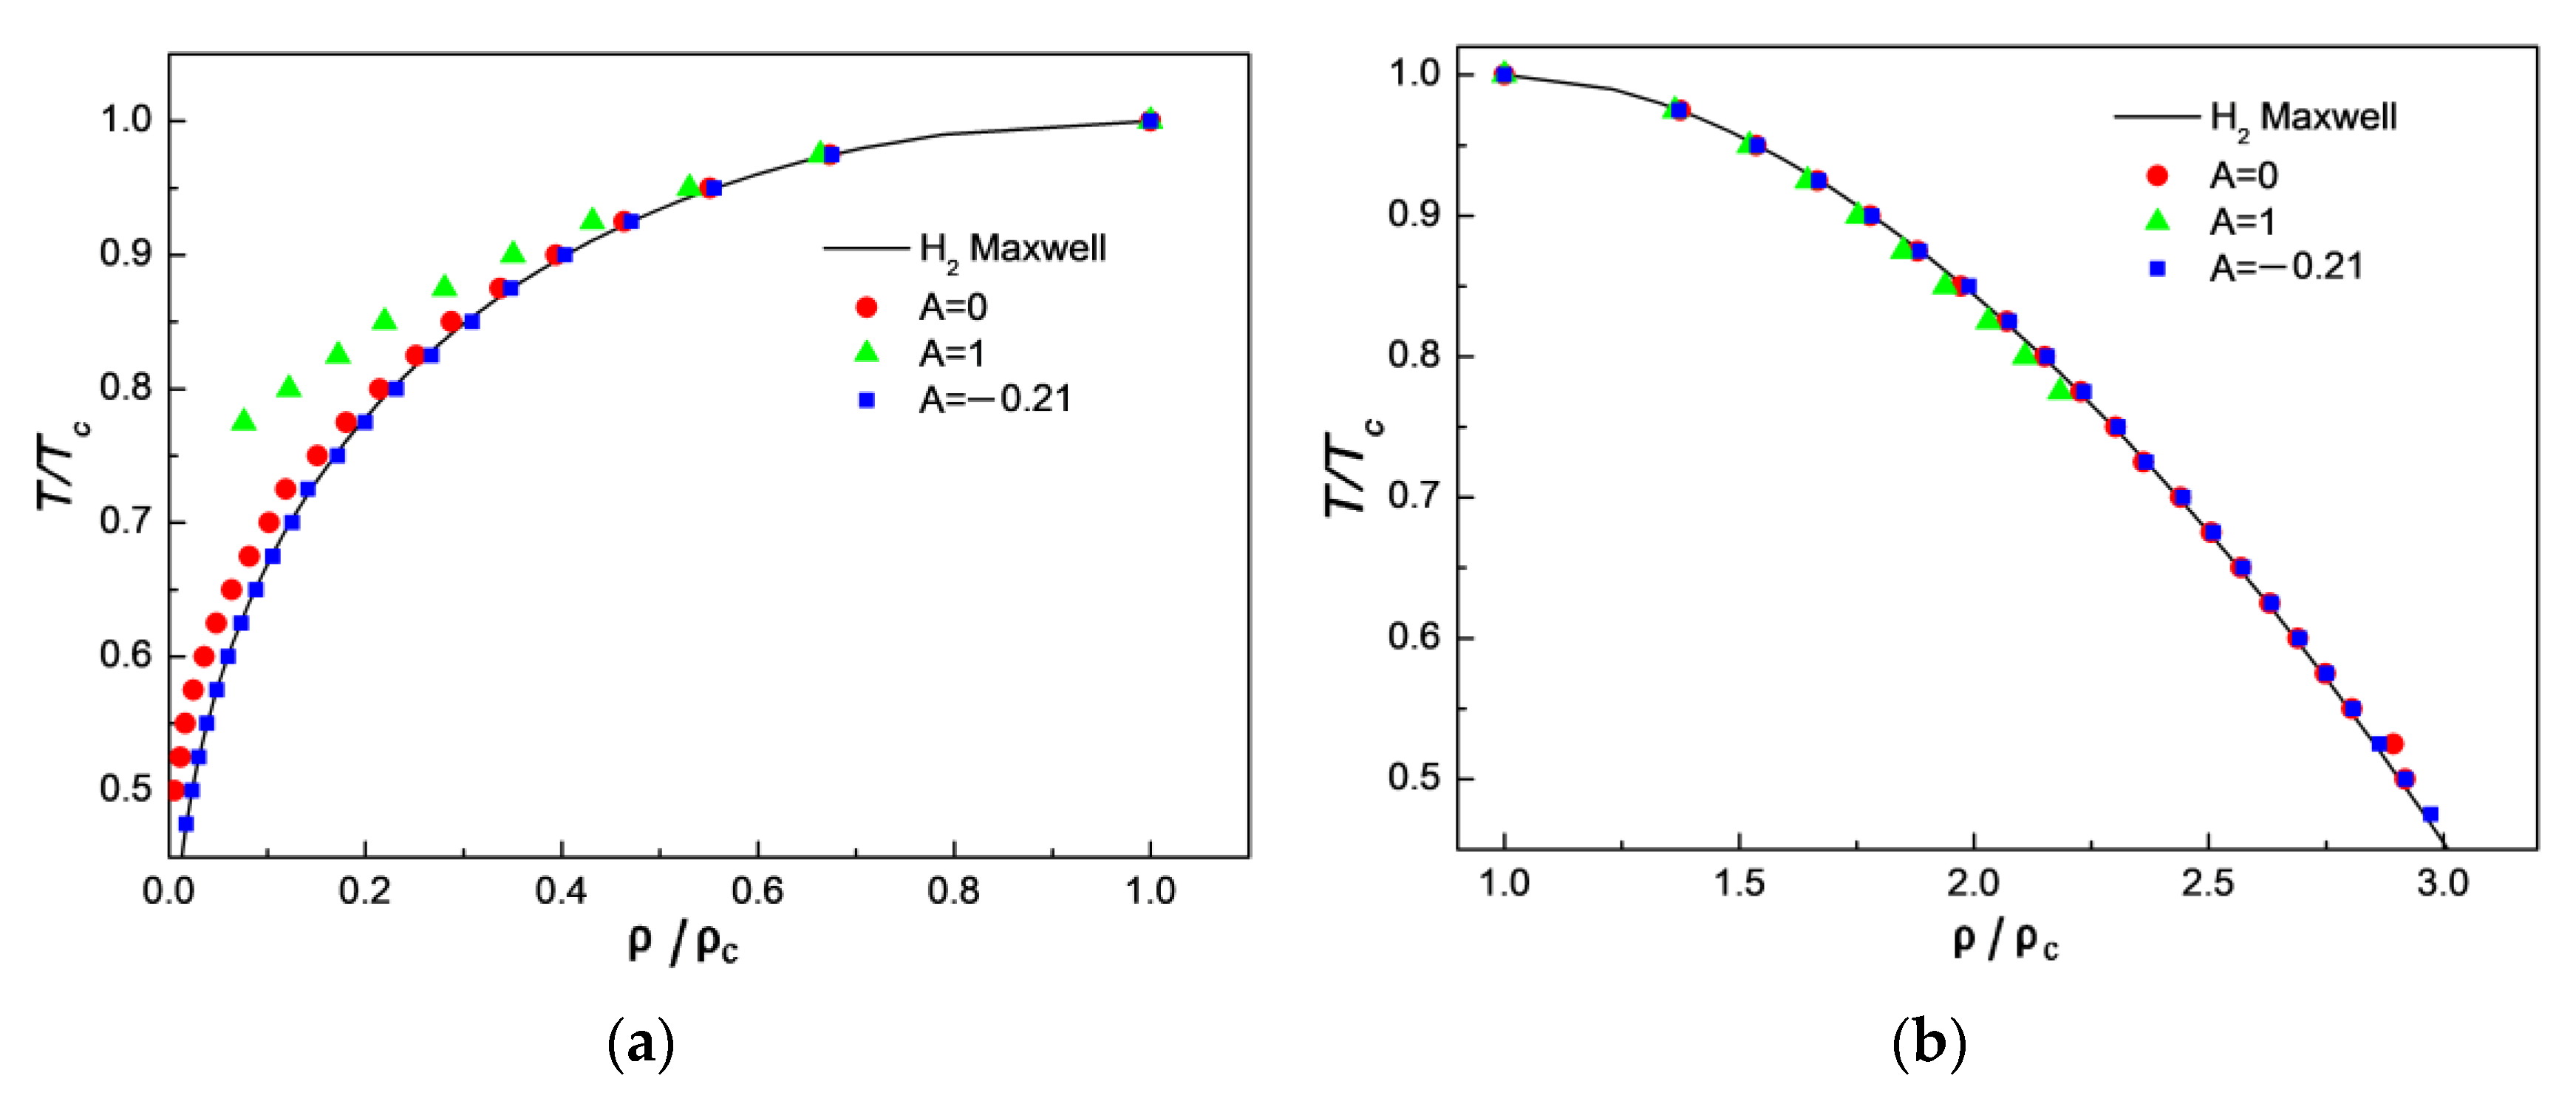
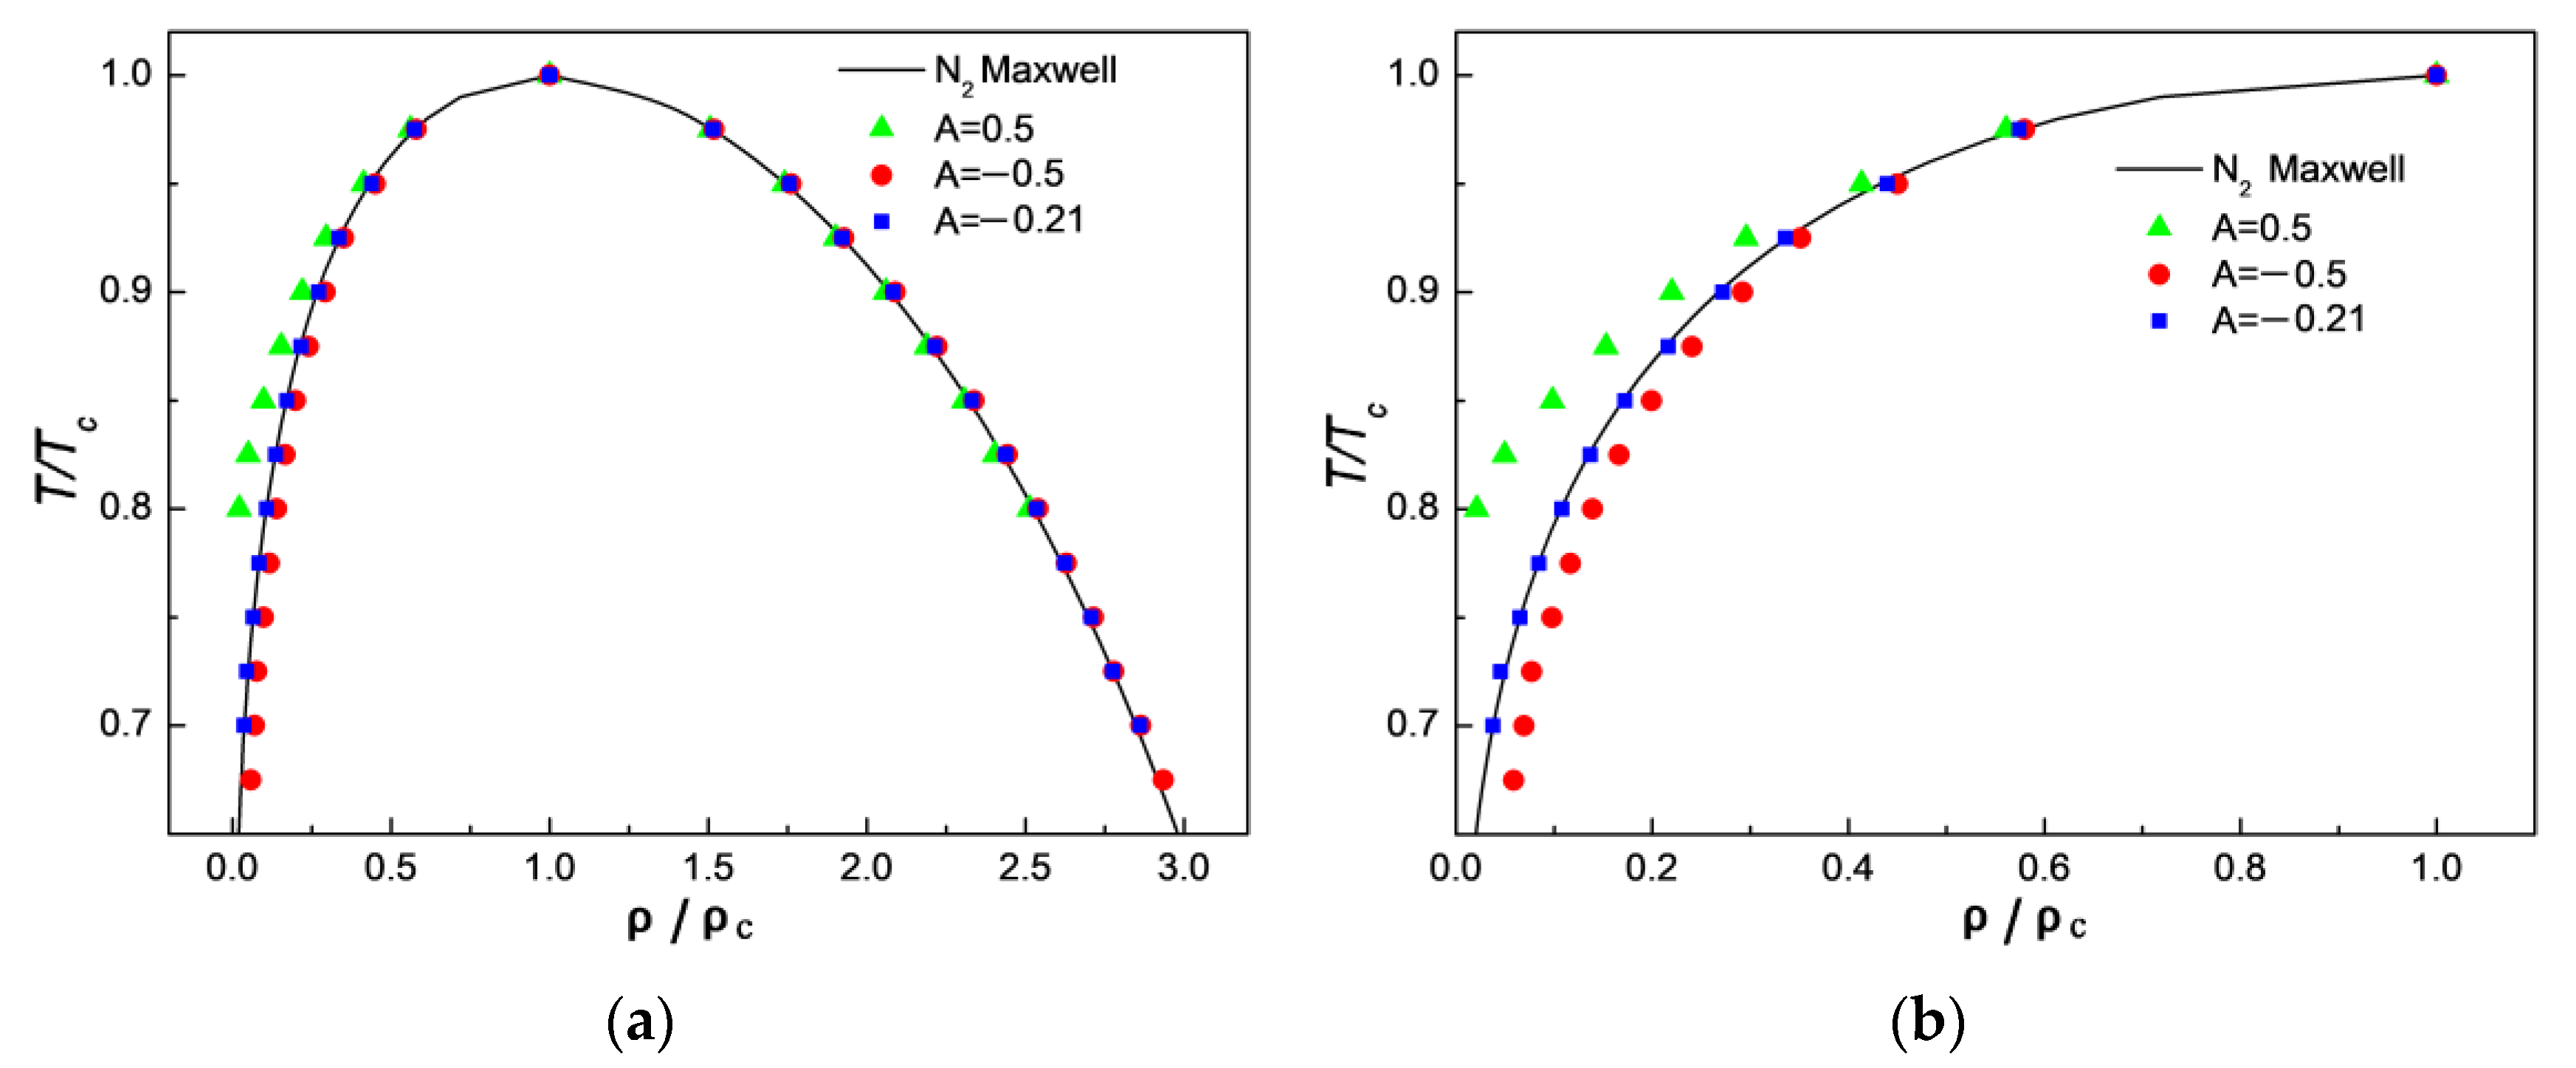
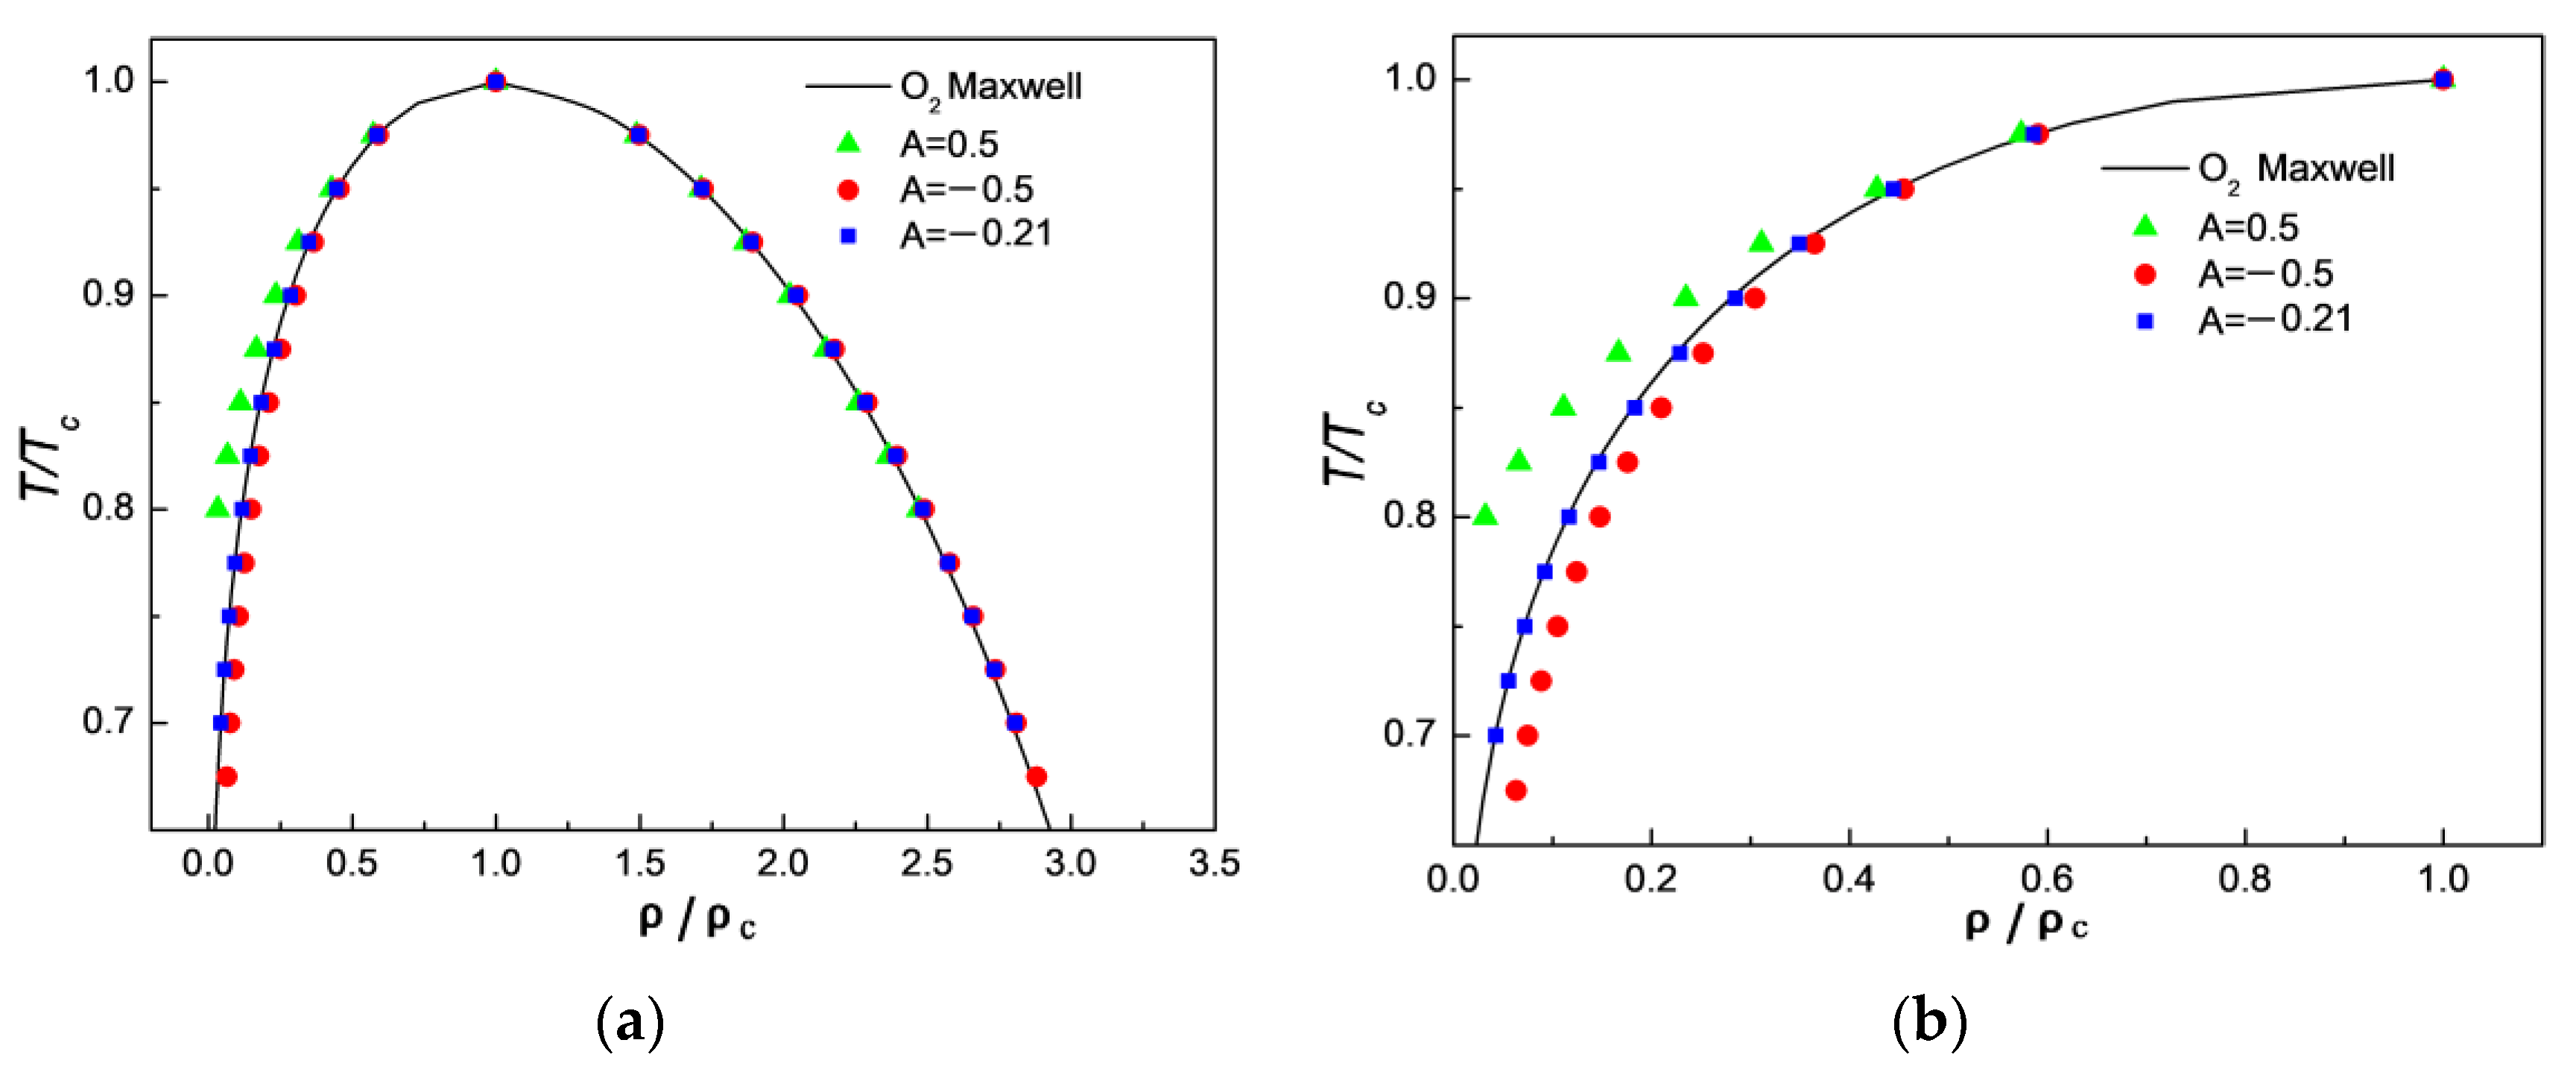
3.1. Comparison of Simulation Results with Maxwell’s Theoretical Solution

The PT equation of state is introduced into the LBM model to simulate the phase transition process of the four cryogenic fluids. After 50,000 iterations, the saturation density of hydrogen under the PT equation of state and Maxwell’s theoretical solution is given in Figure 3, where the vertical coordinate is the temperature range and the horizontal coordinate is the dimensionless value of density, which is the ratio of density to critical density.
The maximum error is 77.32% at A = 0 and 61.11% at A = 1. The larger the value of A in the liquid phase, the smaller the result compared to the Maxwell theoretical solution. However, compared to the deviation on the gas-phase line, the deviation at the liquid phase is small, and the maximum deviation occurring at A = 1 is 2.15%. When A = 0, the maximum deviation is only 1.08%, but the deviation between the simulation results and the theoretical solution increases as the temperature decreases, regardless of whether it is at the gas-phase line or at the liquid phase, and the maximum deviation is often found at the lowest temperature. In terms of temperature range, when A = 1, the temperature range is from 1.0Tc to 0.75Tc, and when A = 0, the range is up to 0.5Tc, so the value of A under the PT equation of state will also affect the range of temperature that can be selected. A too low temperature will lead to numerical instability, which makes it impossible to simulate the results.
Kupershtokh et al. [14] propose a new scheme which allows us to obtain a large density ratio (up to 109 in the stationary case) and to reproduce the coexistence curve with high accuracy. The spurious currents at the vapor–liquid interface are also greatly reduced. Motivated by the numerical simulation work of Kupershtokh et al. [14], Kabdenova et al. [8], and Mehrizi et al. [15], and in order to test the stability and predictive power of the model, we tried to find a numerical simulation method suitable for studying low-temperature two-phase fluids and their phase transition processes and a one-component phase transition model with adjustable parameters that can be based on the equation of state. The results are then compared qualitatively with experimental data under similar physical conditions. Here, using the above laws, the value of A is selected and a series of simulations are carried out to conclude that when A = −0.21, the simulation results and Maxwell’s theoretical solution are in the best agreement. As shown in Figure 3 and Figure 4 (the blue square points), the calculation is effected when A = −0.21, and the temperature range is 1.0Tc to 0.45Tc, which greatly increases the temperature range of the original force model. When A = −0.21, the deviation in the gas-phase region is stabilized at about 1%, so that can be considered as the optimal value of A.
Modeling carbon dioxide (CO2) properties in these regions, i.e., thermodynamic properties of fluids and their flow in near-critical and supercritical regions, is of increasing interest for industrial processes such as CO2 storage and heat transfer, where CO2 is used as a working fluid. Despite the importance of accurately modeling near-critical and supercritical fluids, popular classical cubic equations of state are not accurate [8]. Therefore, improving the accuracy of simulation calculation is the focus of current research. The saturation density of helium under the PT equation of state and Maxwell’s theoretical solution are given in Figure 5. The deviations from the theoretical solution can be seen on the gas-phase and liquid-phase branches in Figure 5 when A = −0.5 or A = 1. The maximum deviation from the theoretical solution is 57.76%. Compared with the error at the gas-phase line, the deviation at the liquid phase is very small; it is only about 1.5%, and is the same as the previous simulation results. The deviation in the gas-phase region is stable at about 1% when A = 0.21, so that can be considered as the optimal A-value. The temperature range at the optimal value −0.21 is 1.0Tc to 0.65Tc. A new method to consider the action of body forces was developed—the exact difference method [14]. The largest deviations of the specific volume at the coexistence curve from theoretical values for van der Waals EOS are lower than 0.4% (for TTc). Although the accuracy of this model is lower than that of Kupershtokh’s model [14], the parameters proposed in this model are suitable for the analysis of phase transitions with a variety of gases.
The use of CO2 in various applications has been studied extensively in previous investigations [8,16,19]. However, the model in the above literature is suitable for the simulation of three-phase phase transition of single-component CO2 gas with higher accuracy, but has a narrower applicability and cannot be extended to common gases such as hydrogen, helium, nitrogen, and oxygen. Therefore, this work also analyzes the comparison of simulation calculation results for nitrogen and oxygen on top of the original basis. For the analysis of the phase transition processes of nitrogen and oxygen, the saturation densities of nitrogen and oxygen with the modified PT equation of state and the parameter-adjustable two-phase model comparing with Maxwell’s theoretical solution are given in Figure 6 and Figure 7. As with the simulation results of hydrogen and helium, when A = −0.21, the simulation results and Maxwell’s theoretical solution are in the best agreement. In terms of temperature range, the temperature takes the range from 1.0Tc to 0.8Tc when A = 0.5, while the range for A = −0.5 goes all the way to 0.65Tc, and the temperature range is 1.0Tc to 0.7Tc when the optimal value of A is taken as −0.21.
By comparing the simulation results of the saturation density of four cryogenic fluids with Maxwell’s theoretical solution, it can be seen that the deviation between the simulation results of saturation density and Maxwell’s theoretical solution is mainly in the gas phase, and is not obvious in the liquid phase. This deviation increases as the temperature decreases, and as the A-value decreases, the temperature range for which the simulation is applicable increases gradually. The optimal value selected in this paper is a small value of A. When A = −0.21, the simulation results of four low-temperature working fluids satisfy the Maxwell theoretical solution. Therefore, it can be considered that, when simulating different cryogenic fluids, the phase transition model based on the modified PT equation of state corresponds to one optimal value of A, and this model has certain universality for the simulation of cryogenic fluids.

3.2. Interface Density Gradient Simulation

Through the above phase change simulation, we found that, when using the PT equation of state for low-temperature fluids to carry out the simulation, taking A=−0.21 to make the simulation curve satisfy Maxwell’s principle and using the force model at A = −0.21 to simulate the interfacial density gradient at different temperatures for the four fluid masses, the simulation gives the calculation area a saturated bubble or droplet with a radius of 30 lu. When the saturated bubble is set, it is surrounded by the saturated liquid at that temperature, and when the saturated droplet is set, it is surrounded by the saturated gas at that temperature. After 3000 iterations, the simulation results converge to a steady state and the interfacial gradients of the four cryogenic fluid masses at three different temperatures are obtained.
As shown in Figure 8, when the bubbles are in the saturated liquid, the density values between the saturated gas and liquid phases will draw closer and closer as the temperature decreases, and the interfacial density gradient will gradually increase, with the corresponding thickness between the gas–liquid interface becoming thicker and thicker. Conversely, when the temperature increases, the thickness of the interface becomes thinner and thinner. When the droplet is in the saturated gas, the temperature is inversely related to the interface thickness. The larger the temperature, the thinner the interface thickness, and the smaller the temperature, the thicker the interface. The interfacial thickness is also different in different fluid workings, which is related to the nature of the fluid. It is also known that the gas phase inside the bubble and the gas phase outside the droplet have the same density, and the liquid phase inside the droplet and the liquid phase outside the bubble have the same density after the calculation reaches stability in the same fluid work, indicating that the simulation conforms to the physical rules. Due to the inverse relationship between temperature and interface thickness, and the inverse relationship between temperature and density gradient being able to be seen, this situation is also basically consistent with the basic interface theory [28,29].

3.3. Comparison of Simulation Results with Experimental Results

The below-mentioned LBM model was used to simulate the phase transition of four real cryogenic fluids (Figure 9), but it was always compared with Maxwell’s theoretical solution, which was limited to the lattice units. It can be seen from the figure that the simulation results of the four working substances have large errors with the experimental data, mainly in the liquid-phase branch, in which the maximum error is 11.92% for hydrogen, 21.33% for helium, 9.86% for nitrogen, and 9.45% for oxygen. In the gas-phase branch, they agree well with the experimental value in the applicable temperature range both for hydrogen and helium. The applicable temperature range reaches the same position as the experimental value for both hydrogen and helium, but in the simulation for nitrogen and oxygen, only a temperature limit of 0.7Tc can be reached, and any lower temperature will lead to unstable values. However, the reason why there are such big deviations with the experimental values and such good agreement with Maxwell’s theoretical solution is the equation of state itself. Moreover, parameters a and b are taken to make the simulation stable, but not from large number of simulations. It is hoped that the equation of state in the LBM model can be improved in future research, so that the equation of state can be consistent with the experimental values, and the applicability of LBM in the study of cryogenic fluid multiphase flow or phase transition problems can be expanded.

4. Conclusions

In this paper, the modified PT equation of state suitable for cryogenic fluids is combined with a parameter-adjustable two-phase model to study the thermodynamic properties of saturated cryogenic fluids, and the saturation density of four typical real cryogenic fluids—nitrogen, hydrogen, oxygen, and helium—is simulated. The simulation results are compared with Maxwell’s theoretical solution, and the optimal value of A in the model is −0.21. The LBM model was successfully applied for the calculation of the thermodynamic properties of the real cryogenic fluid, which led to a very meaningful exploration to reveal the mechanism of the phenomenon of phase transition of cryogenic fluid. This model also has certain limitations, parameters a and b are used in the empirical values of the literature, so there are still deviations with the real density curve. The present study is limited to single-component gases; future studies might consider the molecular interaction forces in the phase change process of such multi-component gases to gain a deeper understanding of the phase change, going deeper into the microscopic mechanism and simulating the generation process of mixed liquids and solids.

Author Contributions

Writing—original draft preparation, W.L.; methodology, Y.W. and F.L.; investigation, Z.S.; writing—review and editing, H.Q. and X.Z. All authors have read and agreed to the published version of the manuscript.

Funding

This work is supported by the National Key Research and Development Program of China (Grant No. 2020YFB1506203).

Institutional Review Board Statement

Not applicable.

Informed Consent Statement

Not applicable.

Data Availability Statement

Not applicable.

Conflicts of Interest

The authors declare no conflict of interest.

References

  1. Krastev, V.; Falcucci, G. Simulating Engineering Flows through Complex Porous Media via the Lattice Boltzmann Method. Energies 2018, 11, 715. [Google Scholar] [CrossRef] [Green Version]
  2. Honari, S.; Hosseininia, E.S. Particulate Modeling of Sand Production Using Coupled DEM-LBM. Energies 2021, 14, 906. [Google Scholar] [CrossRef]
  3. Liang, W.; Xun, Q.; Shu, Z.; Lu, F.; Qian, H. Numerical Simulation of Erosion Characteristics for Solid-Air Particles in Liquid Hydrogen Elbow Pipe. Sustainability 2021, 13, 13303. [Google Scholar] [CrossRef]
  4. Che Zain, M.S.; Yeoh, J.X.; Lee, S.Y.; Shaari, K. Physicochemical Properties of Choline Chloride-Based Natural Deep Eutectic Solvents (NaDES) and Their Applicability for Extracting Oil Palm Flavonoids. Sustainability 2021, 13, 12981. [Google Scholar] [CrossRef]
  5. Zhu, Q.; Yan, J. A moving-domain CFD solver in FEniCS with applications to tidal turbine simulations in turbulent flows. Comput. Math. Appl. 2019, 81, 532–546. [Google Scholar] [CrossRef]
  6. Nguyen, G.T.; Chan, E.L.; Tsuji, T.; Tanaka, T.; Washino, K. Interface control for resolved CFD-DEM with capillary interactions. Adv. Powder Technol. 2021, 32, 1410–1425. [Google Scholar] [CrossRef]
  7. Kaya, U.; Gopireddy, S.; Urbanetz, N.; Nopens, I.; Verwaeren, J. Predicting the hydrodynamic properties of a bioreactor: Conditional density estimation as a surrogate model for CFD simulations. Chem. Eng. Res. Des. 2022, 182, 342–359. [Google Scholar] [CrossRef]
  8. Kabdenova, B.; Rojas-Solórzano, L.R.; Monaco, E. Lattice boltzmann simulation of near/supercritical CO2 flow featuring a crossover formulation of the equation of state. Comput. Fluids 2020, 216, 104820. [Google Scholar] [CrossRef]
  9. Grunau, D.; Chen, S.; Eggert, K. A lattice Boltzmann model for multiphase fluid flows. Phys. Fluids A Fluid Dyn. 1993, 5, 2557–2562. [Google Scholar] [CrossRef] [Green Version]
  10. Shan, X.; Chen, H. Lattice Boltzmann model for simulating flows with multiple phases and components. Phys. Rev. E 1993, 47, 1815. [Google Scholar] [CrossRef] [PubMed] [Green Version]
  11. Swift, M.; Osborn, W.; Yeomans, J. Lattice Boltzmann simulation of nonideal fluids. Phys. Rev. Lett. 1995, 75, 830–833. [Google Scholar] [CrossRef] [PubMed] [Green Version]
  12. Inamuro, T.; Ogata, T.; Tajima, S.; Konishi, N. A lattice Boltzmann method for incompressible two-phase flows with large density differences. J. Comput. Phys. 2004, 198, 628–644. [Google Scholar] [CrossRef]
  13. Lee, T.; Lin, C. A stable discretization of the lattice Boltzmann equation for simulation of in compressible two-phase flows at high density ratio. J. Comput. Phys. 2005, 206, 16–47. [Google Scholar] [CrossRef]
  14. Kupershtokh, A.L.; Medvedev, D.A.; Karpov, D.I. On equations of state in a lattice Boltzmann method. Comput. Math. Appl. 2009, 58, 965–974. [Google Scholar] [CrossRef] [Green Version]
  15. Mehrizi, A.A.; Sedighi, K.; Afrouzi, H.H.; Aghili, A.L. Lattice boltzmann simulation of forced convection in vented cavity filled by porous medium with obstruction. World Appl. Sci. J. 2012, 16, 31–36. [Google Scholar]
  16. Li, J.W.; Li, Z.; Yuan, W.J.; Lei, X.M.; Torres, S.A.G.; Cherubini, C.; Scheuermann, A.; Li, L. Numerical investigation of liquid and supercritical CO2 flow behaviors through 3d self-affine rough fractures. Fuel 2019, 251, 669–682. [Google Scholar] [CrossRef]
  17. Huang, J.; Feng, X.; Yin, X. Lattice boltzmann simulation of pressure-driven two-phase flows in capillary tube and porous medium. Comput. Fluids 2017, 155, 134–145. [Google Scholar] [CrossRef]
  18. Zhu, W.B.; Wang, M.; Chen, H. Study on multicomponent pseudo-potential model with large density ratio and heat transfer. Int. Commun. Heat Mass Transf. 2017, 87, 183–191. [Google Scholar] [CrossRef]
  19. Tian, Z.W.; Xing, H.L.; Tan, Y.L.; Gu, S.; Golding, S.D. Reactive transport LBM model for CO2 injection in fractured reservoirs. Comput. Geosci. 2016, 86, 15–22. [Google Scholar] [CrossRef] [Green Version]
  20. Zhang, D.; Li, S.; Ren, W.; Li, Y.; Mei, N. Co-existing boiling and condensation phase changes of a multicomponent fluid in a confined micro-space analysed by a modified LBM. Int. J. Therm. Sci. 2021, 170, 107147. [Google Scholar] [CrossRef]
  21. Jourabiana, M.; Darzi, A.A.; Akbari, O.A.; Toghrai, D. The enthalpy-based lattice Boltzmann method (LBM) for simulation of NePCM melting in inclined elliptical annulus. Phys. A Stat. Mech. Its Appl. 2020, 548, 123887. [Google Scholar] [CrossRef]
  22. Feng, S.J.; Chen, H.; Zheng, Q.T.; Chen, H.X. Fractal analytical solution of gas diffusivity in heterogeneous porous media over the entire saturation range. Int. J. Heat Mass Transf. 2022, 188, 122652. [Google Scholar] [CrossRef]
  23. Liu, C.; Qian, R.S.; Liu, Z.Y.; Liu, G.J.; Zhang, Y.S. Multi-scale modelling of thermal conductivity of phase change material/recycled cement paste incorporated cement-based composite material. Mater. Des. 2020, 191, 108646. [Google Scholar] [CrossRef]
  24. Jiang, F.; Yang, J.H.; Boek, E.; Tsuji, T. Investigation of viscous coupling effects in three-phase flow by lattice Boltzmann direct simulation and machine learning technique. Adv. Water Resour. 2021, 147, 103797. [Google Scholar] [CrossRef]
  25. Xu, R.; Prodanović, M.; Landry, C.J. Study of subcritical and supercritical gas adsorption behavior in different nanopore systems in shale using lattice Boltzmann method. Int. J. Coal Geol. 2019, 212, 103263. [Google Scholar] [CrossRef]
  26. Delavar, M.A.; Wang, J. Lattice Boltzmann Method in Modeling Biofilm Formation, Growth and Detachment. Sustainability 2021, 13, 7968. [Google Scholar] [CrossRef]
  27. Qian, Y.; Humieres, D.; Lallemand, P. Lattice BGK models for Navier-Stokes equation. Europhys. Lett. 1992, 17, 479–484. [Google Scholar] [CrossRef]
  28. Zhang, R.; Chen, H. Lattice Boltzmann method for simulations of liquid-vapor thermal flows. Phys. Rev. E 2003, 67, 066711. [Google Scholar] [CrossRef] [Green Version]
  29. Yuan, P.; Schaefer, L. Equations of state in a lattice Boltzmann model. Phys. Fluids 2006, 18, 042101. [Google Scholar] [CrossRef]
  30. Chen, G.; Yang, Y. Study on Equition of State for Cryogenic Fluids. Chin. J. Low Temp. Phys. 1996, 18, 70–75. [Google Scholar]
Figure 1. Saturation Density of Models with Different A-Values Based on modified PT Equation of State.
Sustainability 14 07414 g001
Figure 2. Saturation Density of Models with Different A-Values Based on modified PT Equation of State: Saturated gas-phase branch (a) and liquid-phase branch (b).
Sustainability 14 07414 g002
Figure 3. Hydrogen saturation density with different A-values compared with Maxwell’s theoretical solutions.
Sustainability 14 07414 g003
Figure 4. Hydrogen saturation density with different A-values. (a) Gas-phase branch; (b) liquid-phase branch.
Sustainability 14 07414 g004
Figure 5. Helium saturation density with different A-values. (a) Compared with Maxwell’s theoretical solution; (b) gas-phase branch.
Sustainability 14 07414 g005
Figure 6. Nitrogen saturation density with different A-values. (a) Compared with Maxwell’s theoretical solution; (b) gas-phase branch.
Sustainability 14 07414 g006
Figure 7. Oxygen saturation density with different A-values. (a) Compared with Maxwell’s theoretical solution; (b) gas-phase branch.
Sustainability 14 07414 g007
Figure 8. Interfacial density gradients of bubbles and droplets at different temperatures for different fluid services. (a) Hydrogen; (b) helium; (c) nitrogen; (d) oxygen.
Sustainability 14 07414 g008aSustainability 14 07414 g008b
Figure 9. Comparison of saturation density curves and experimental data for four cryogenic fluids. (a) Hydrogen; (b) helium; (c) nitrogen; (d) oxygen.
Sustainability 14 07414 g009
Table 1. Critical values under real physical units and lattice units for different fluid working substances.
Crogenic Fluid Working MassCritical ParametersLattice UnitsReal Units
H2 T c   ( K ) 0.086 32.94   K
P c   ( atm ) 0.079 12.99   atm
ρ c   ( mol / L ) 2.728 15.56   mol / L
O2 T c   ( K ) 0.084 154.58   K
P c   ( atm ) 0.075 50.12   atm
ρ c   ( mol / L ) 2.718 13.63   mol / L
N2 T c   ( K ) 0.081 126.26   K
P c   ( atm ) 0.070 33.49   atm
ρ c   ( mol / L ) 2.699 11.21   mol / L
He T c   ( K ) 0.086 5.19   K
P c   ( atm ) 2.726 2.25   atm
ρ c   ( mol / L ) 0.078 17.39   mol / L
Publisher’s Note: MDPI stays neutral with regard to jurisdictional claims in published maps and institutional affiliations.

