Article

Theoretical Study on the Effect of Parallel Air Chambers Embedded in Rockwool Panels on the Energy Consumption of a Low-Energy High School

1
Department of Civil Engineering and Building Services, Faculty of Civil Engineering, Politehnica University of Timisoara, 300006 Timișoara, Romania
2
Boros Cons, Ltd., Str. Gheorghe Pitut No. 2, Block Z2, Flat 5, 415200 Beiuș, Romania
*
Author to whom correspondence should be addressed.
Sustainability 2022, 14(12), 7425; https://doi.org/10.3390/su14127425
Submission received: 26 April 2022 / Revised: 14 June 2022 / Accepted: 15 June 2022 / Published: 17 June 2022
(This article belongs to the Section Sustainable Engineering and Science)

Abstract

:
In the construction industry, sustainability is evaluated, not only in terms of harmful emissions generated during the operation phase, but also in terms of the embodied emissions belonging to building materials and technical equipment. As a consequence, the implementation of highly efficient building materials has become crucial. The objective of this study is to investigate an insulation system based on parallel air chambers embodied in rockwool panels, and to correlate the implications of its implementation compared to an existing insulation system. The analysis was conducted on the first administrative/public building completed in Romania, according to passive house standards. The study begins with experimental investigations of insulation systems under laboratory conditions. Thus, the influence of air layers on the thermal properties of existing rockwool panels was assessed. On the basis of the experimental results, the theoretical energy demand of the high school building and life cycle analysis are determined using simulation software for both insulation solutions: existing insulation composed of solid rockwool panels, and rockwool panels with embedded air layers. The thickness of the insulating air layers is optimized, and with the help of Rayleigh–Bénard equations for each of the five climate zones that were further determined. Taken together, it is expected to achieve a better insulation system by maintaining constant embedded emissions. In conclusion, assuming a 50-year life cycle for the high school building, the insulation system composed of rockwool with embedded air layers brings about a reduction in the total energy consumption of approximately 9.82%, compared to the case of a standard insulation system based on solid rockwool panels without additional air layers.

1. Introduction

The impact of human activities on the environment is becoming more and more intense. Resource consumption and harmful gas emissions exceed the absorption capacity of the environment [1]. Worldwide, the building and construction industry is responsible for approximately 60% of resource consumption, 35% of energy consumption, and approximately 35% of greenhouse gas emissions [2].
Although the high environmental impact of the construction sector should be a warning sign, it also provides great energy savings potential. The early phases of building planning offer a good opportunity to reduce the long-term environmental impact of the building industry, as the most important and crucial decisions are made at this stage [3].
The most important interface between the indoor and outdoor environment is the thermal envelope of a building. The exterior envelope acts as a thermal barrier that greatly influences the indoor thermal conditions and the overall energy consumption of the building during both the construction and the operation phase [4]. Therefore, one of the methods used to reduce the energy demand and associated emissions of a building is to optimize the thermal insulation of the exterior envelope.
In recent years, the requirement to reduce heat losses has led to an increase in insulation thicknesses. The growing requirements regarding minimum insulation properties also imply additional concerns about embodied energy and the harmful emissions generated during the building materials manufacturing process [5]. In Romania, an east European country with a temperate climate, the methodology regarding energy efficiency in the building sector [6,7,8] imposes increasing demands on envelope insulation properties, from the first instance of its use in 2006, to its current usage. Since 2006, the maximum thermal transmittance of thermal envelope elements has decreased by approximatively 40.0% to 50.0%. The increase in thermal performance according to official requirements is presented comparatively in Table 1. The second column contains the thermal transmittance values specified by the National Methodology regarding the assessment of the energy performance of buildings (Mc001/2006); the third column contains the thermal transmittances according to Order 2641/2017 regarding amendments and additions of the Mc001/2006, and the last column presents the performance values stated in the National Methodology correlated with European Standards, which is expected to enter into force.
As the transmission reduction must be primarily ensured by the performance of the insulation system, it is expected that the embedded emissions generated by the production of insulation systems will increase.
According to previous studies, 80% of the total operational energy used in conventional buildings can be attributed to the operating stage; the rest is attributed to the energy embodied in the building materials, and the construction, refurbishment, and demolition stages. Therefore, reducing the embedded emissions of the building materials is not an area that should be neglected. Regarding the thermal envelope, various methods can be adopted to optimize the embedded emissions of, for example, advanced insulation materials, additional insulation layers, or improved structure design [2].
An apparently simple and efficient insulation method, which was also used by our ancestors, was the use of insulating air layers. The aim was to improve an already effective insulation system while maintaining the embedded emissions of the building. Currently, multiple envelope elements that contain air can be found in existing buildings such as hollow walls [9,10], multiple glazed windows [11,12], Trombe walls [13,14], solar chimneys [15,16], double skin facades [14,15,16], or ventilated photovoltaic facades [17,18].
In all cases, the air layer can perform several different functions according to its configurations and regulatory measures. First, the air layer can work in an open-ended approach by saving ventilation energy; for example, the air layer involved inside Trombe walls, solar chimneys, and double skin or ventilated facades.
In this case, the non-stationary air layer/layers can perform multiple functions, such as the supply and preheating of fresh air, space heating, natural ventilation, and passive cooling [19]. On the other hand, the air layer can be operated as additional insulation layers in a closed mode, e.g., in hollow bricks or multiple glazed windows. Air layers significantly improve the thermal performance of the building elements: in general, the thermal performance of air, under specific thermodynamical conditions, exceeds the vast majority of common building materials.
A large amount of previously available literature is focused on the thermal performance of unventilated air layers in building envelopes [20,21,22,23]. However, due to the diversity of climate zones and different architectural requirements, more comprehensive research is required to determine the influence of the design of the air layer on their thermal properties.
The following investigations are based on theoretical knowledge, to which there are multiple types of heat transfer patterns in unventilated air layers (pure conduction, radiation, laminar, and turbulent convection) and two potential dividing points for the heat transfer type. The first divides pure conductive flux from convective flux, and the second divides the laminar regime from the turbulent regime.
In practice, when the thickness of the air layer is sufficiently narrow, or when the temperature difference is limited, the air movement is very weak and can be neglected. In this case, heat transfer is mainly influenced by conduction. When the temperature difference increases or when the thickness is greater, the heat transfer changes from heat conduction to laminar convection, and then to turbulent convection. Meanwhile, radiative heat transfer is slightly influenced by air movement and is mainly influenced by temperature gradient and the nature of building materials.
The aim of this work is to evaluate the effect of an innovative multilayer air–rockwool insulation system compared to existing insulation systems based on solid rockwool panels. The idea of the study was to maintain the rockwool volume constant, i.e., constant embodied energy, by improving the thermal performance in the best possible way under certain conditions (climate and building architecture).
After the experimental determination of thermal conductivity under laboratory conditions, theoretical calculations are performed on a low-energy high school building built in Salonta, Romania. Furthermore, the optimal insulation design is determined in the case of all national climate zones. The calculation was performed assuming that the new insulation system is placed on the exterior walls and the upper slab toward an unheated attic space.

2. Materials and Methods

The efficiency of the insulation system with parallel air chambers (ISPA) was compared to the efficiency of the existing insulation system (EIS) of an energy-efficient high school building located in Salonta, Romania. Salonta is a small city located in the northwestern part of Romania, at the border with Hungary, at a latitude of 46.8053° and a longitude of 21.6490°. The city is located on the Western Plain of Romania, with a continental climate. The average annual temperatures range between 10 and 12 °C, with moderate precipitations of 500–700 mm/year.
The high school is one of the first public buildings in Romania to be built according to Passive House requirements, general concepts, and details of Passive House standards. The construction began in October 2014 when, due to the inadequate sizes of the existing buildings, the local parish decided to build new facilities to provide learning, eating, and accommodation spaces for students. The architecture of the school building, shown in Figure 1, was designed to meet the local site requirements; that is, a central area with old classic buildings.
The building has a built-up area of 4000 m2 displayed on four levels. Figure 2 and Figure 3 show the ground floor plan and the facades of the high school. To assess the energy consumption and to understand the behavior of the building materials over time, a complex monitoring system has been developed and installed on the building components (foundations, heating ventilation, and air conditioning—HVAC, plumbing and electrical systems, thermal envelope, and roof elements). The system consists of 660 measurement elements, i.e., multiple temperature, humidity, CO2, air flow, and electric consumption meters, all connected to several data acquisition stations. The monitoring system is designed to determine and to store real-time data.
The simulations conducted in this study were conducted under the assumption that the interior temperatures of the school building are determined according to the National Standard SR-1907-2. The interior temperatures of the school building are presented independently, depending on the destination of the room, in Table 2.
The insulation of the two components of the envelope; that is, the exterior walls and the slab between the upper level and the unheated attic space, consists of rockwool panels having thicknesses of 15 cm on the exterior wall, and 25 cm on the upper slab.
Theoretical calculations were performed for both the existing building and the building under the assumption that the insulation panels related to the exterior walls and the upper slab are replaced with the experimental insulation panels. Due to the higher compression strengths, the ISPA was not used to insulate elements in contact with the ground (foundation and ground floor slab).
Figure 4 presents the geometry of the insulation panel according to the experimental insulation system with parallel air chambers (ISPA). The insulation panel was designed to ensure thermal and mechanical resistances. The air layers are surrounded by a perimetral solid section designed to ensure a solid supporting area for the anchoring system. The exterior dimensions of the insulating panel are maintained constant to standard rockwool panels, 600 × 1200 mm. The thickness is the only variable dimension, which is larger, due to the additional air layers. The new insulation panel consists of two types of layers:
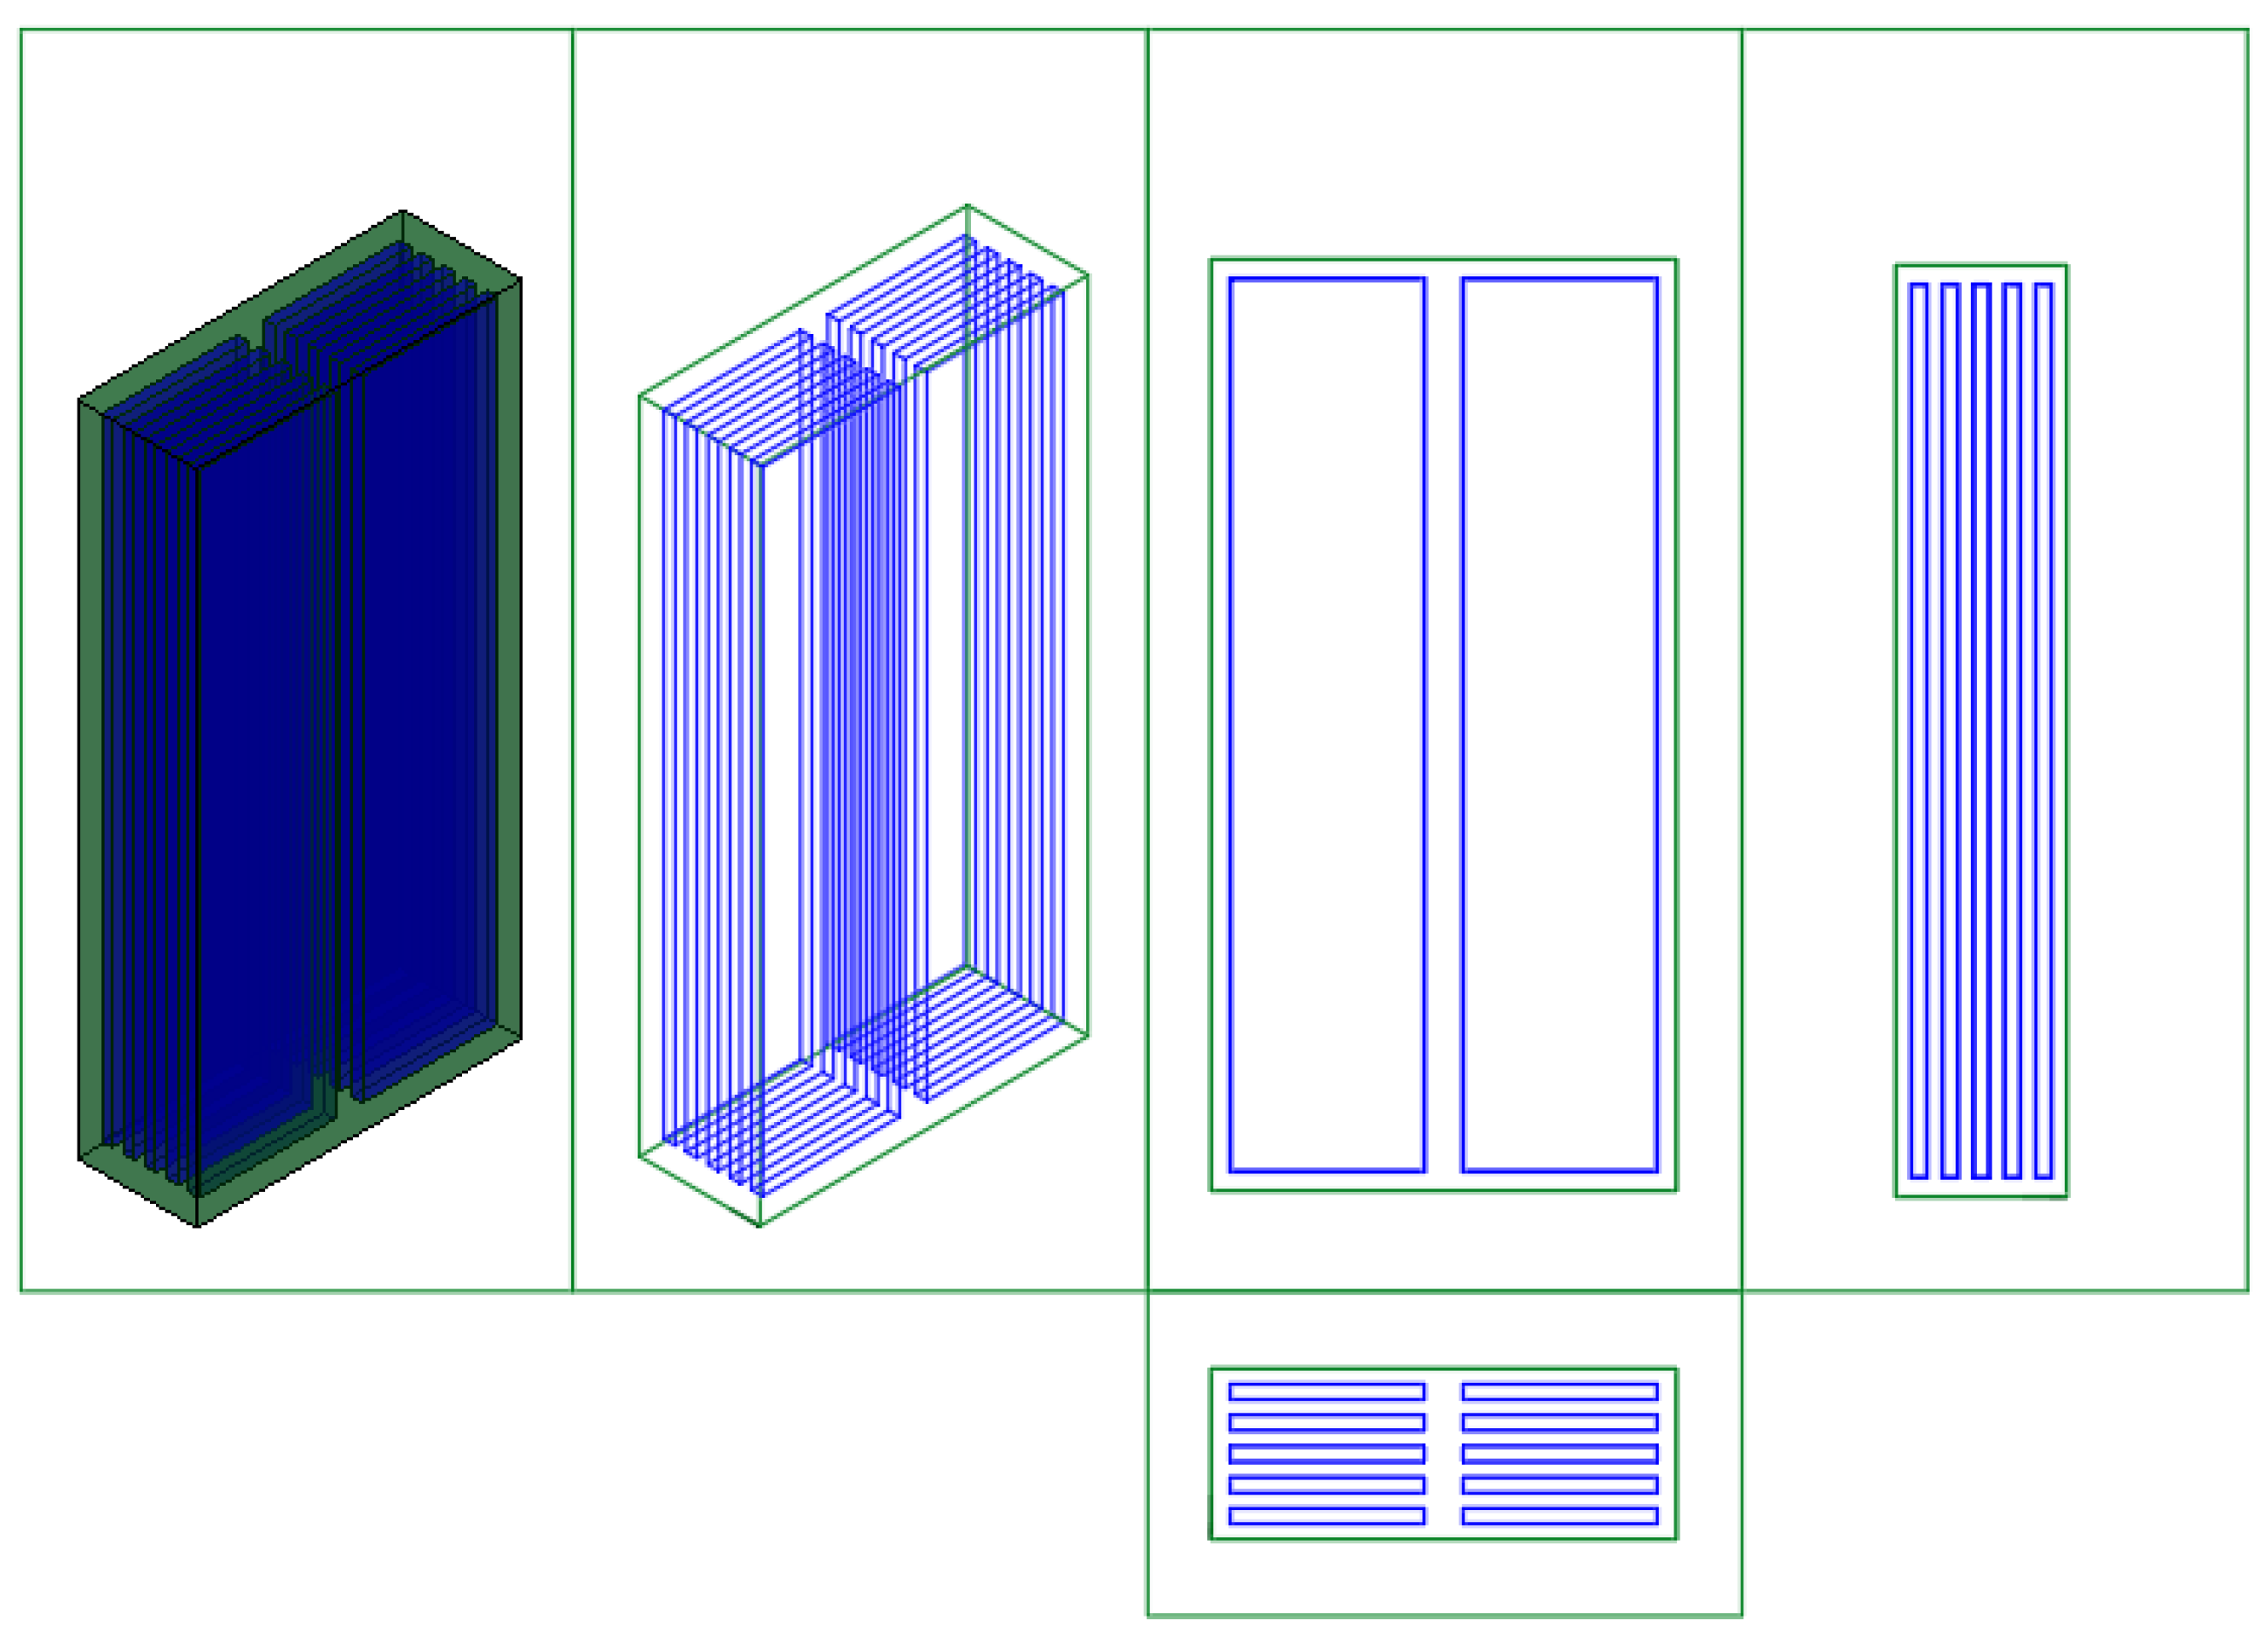
  • Solid rockwool layers having a thickness of 23.0 mm (exterior walls) and 30.0 mm (upper slab);
  • Air layers that consist of two air cavities surrounded by a solid perimetral frame and that are separated by an intermediary section of solid material having a width of 5 cm.
The thicknesses were chosen so that the thermal exchange is not affected by the convection phenomenon. For the vertical air layer comprised within the wall insulation, the movement of the air is affected mainly by the buoyancy force. As long as the Rayleigh number (Ra) is not greater than 1.5 × 10³ for the vertical air layers and 1.2 × 10³ for the horizontal ones, the isotherms and streamlines remain parallel and uniformly distributed. Thus, the natural convection of air is negligible.
Therefore, it is appreciated that, in the case of the upper slab, the thermal flow is not affected by a change in natural air convection caused by the change in the direction of heat between summer and winter. In other words, as long as the temperature flow is determined by an insignificant convection phenomenon, it is not important if the building finds itself in a winter period with a colder exterior environment (bottom-heated) or a hotter exterior environment (bottom-cooled).
In addition to adjusting the thickness of the air layers, the intermediate solid layers also act as a fire barrier, preventing flame spread between the different wall layers. Standard insulation panels do not require any other fire protection due to the intrinsic fire-resistant properties of rockwool [24,25].
IPSA was previously analyzed [6] to predict the impact of air gaps on possible moisture accumulation using hydrothermal calculation software [26]. Overall, the results suggest that the water content of the insulation system is not influenced by the air layers, being slightly affected only by the variation between the water content during the warmer months (August–September) and the colder winter months (November–February).
The thermal conductivity of the experimental insulation system was determined under laboratory conditions. Measurements were made using a thermal conductivity test tool that is in accordance with the international technical and quality norms presented in Figure 5.
The thermal conductivity test tool used for laboratory investigations is a guarded hot plate device designed according to ISO 8302, EN 1946-, EN 12664, EN 12667, EN 12939, ASTM C177, and DIN 52612. The device measures the thermal conductivity (λ-value) of insulation materials and other products according to the applicable standards [27].
The stationary thermal conditions required for the tests are achieved by means of three protective heating rings and one thermostatic heating ring (used for heating or cooling), separated by an individually controlled gap. Because thermal exchanges are measured only by a central area consisting of a square (500 mm × 500 mm), the device does not require a thermostatically controlled measurement chamber. The adjacent outer material is only needed to ensure a surrounding ring for the testing zone. According to the producer, the purpose of the surrounding ring is to facilitate the parallelism of the isothermal lines in the central measuring area. The parallelism of the isothermal lines ensures that the heat exchange between the plates is one-dimensional, and that it is not affected by other external temperature influences. The operating principle of the device, along with the isothermal lines, is shown in Figure 6.
The different manufacturing stages of the test sample are shown in Figure 7. Note that the ratio of rockwool to air of the real-sized ISPA panels was determined, reproduced, and scaled according to the dimensions of the central measuring ring of the test tool.
In order to be more accurate in cutting, the entire ISPA probe consists of several overlapping solid rockwool layers, each of which has a thickness of 20 mm. The layer overlapping was performed according to EN13162 [28] by the sensor plates of the measuring device [25]. Subsequently, the air–rockwool ratio of the actual-sized insulation panels was determined and scaled to match the diameter of the central measuring ring.

3. Results

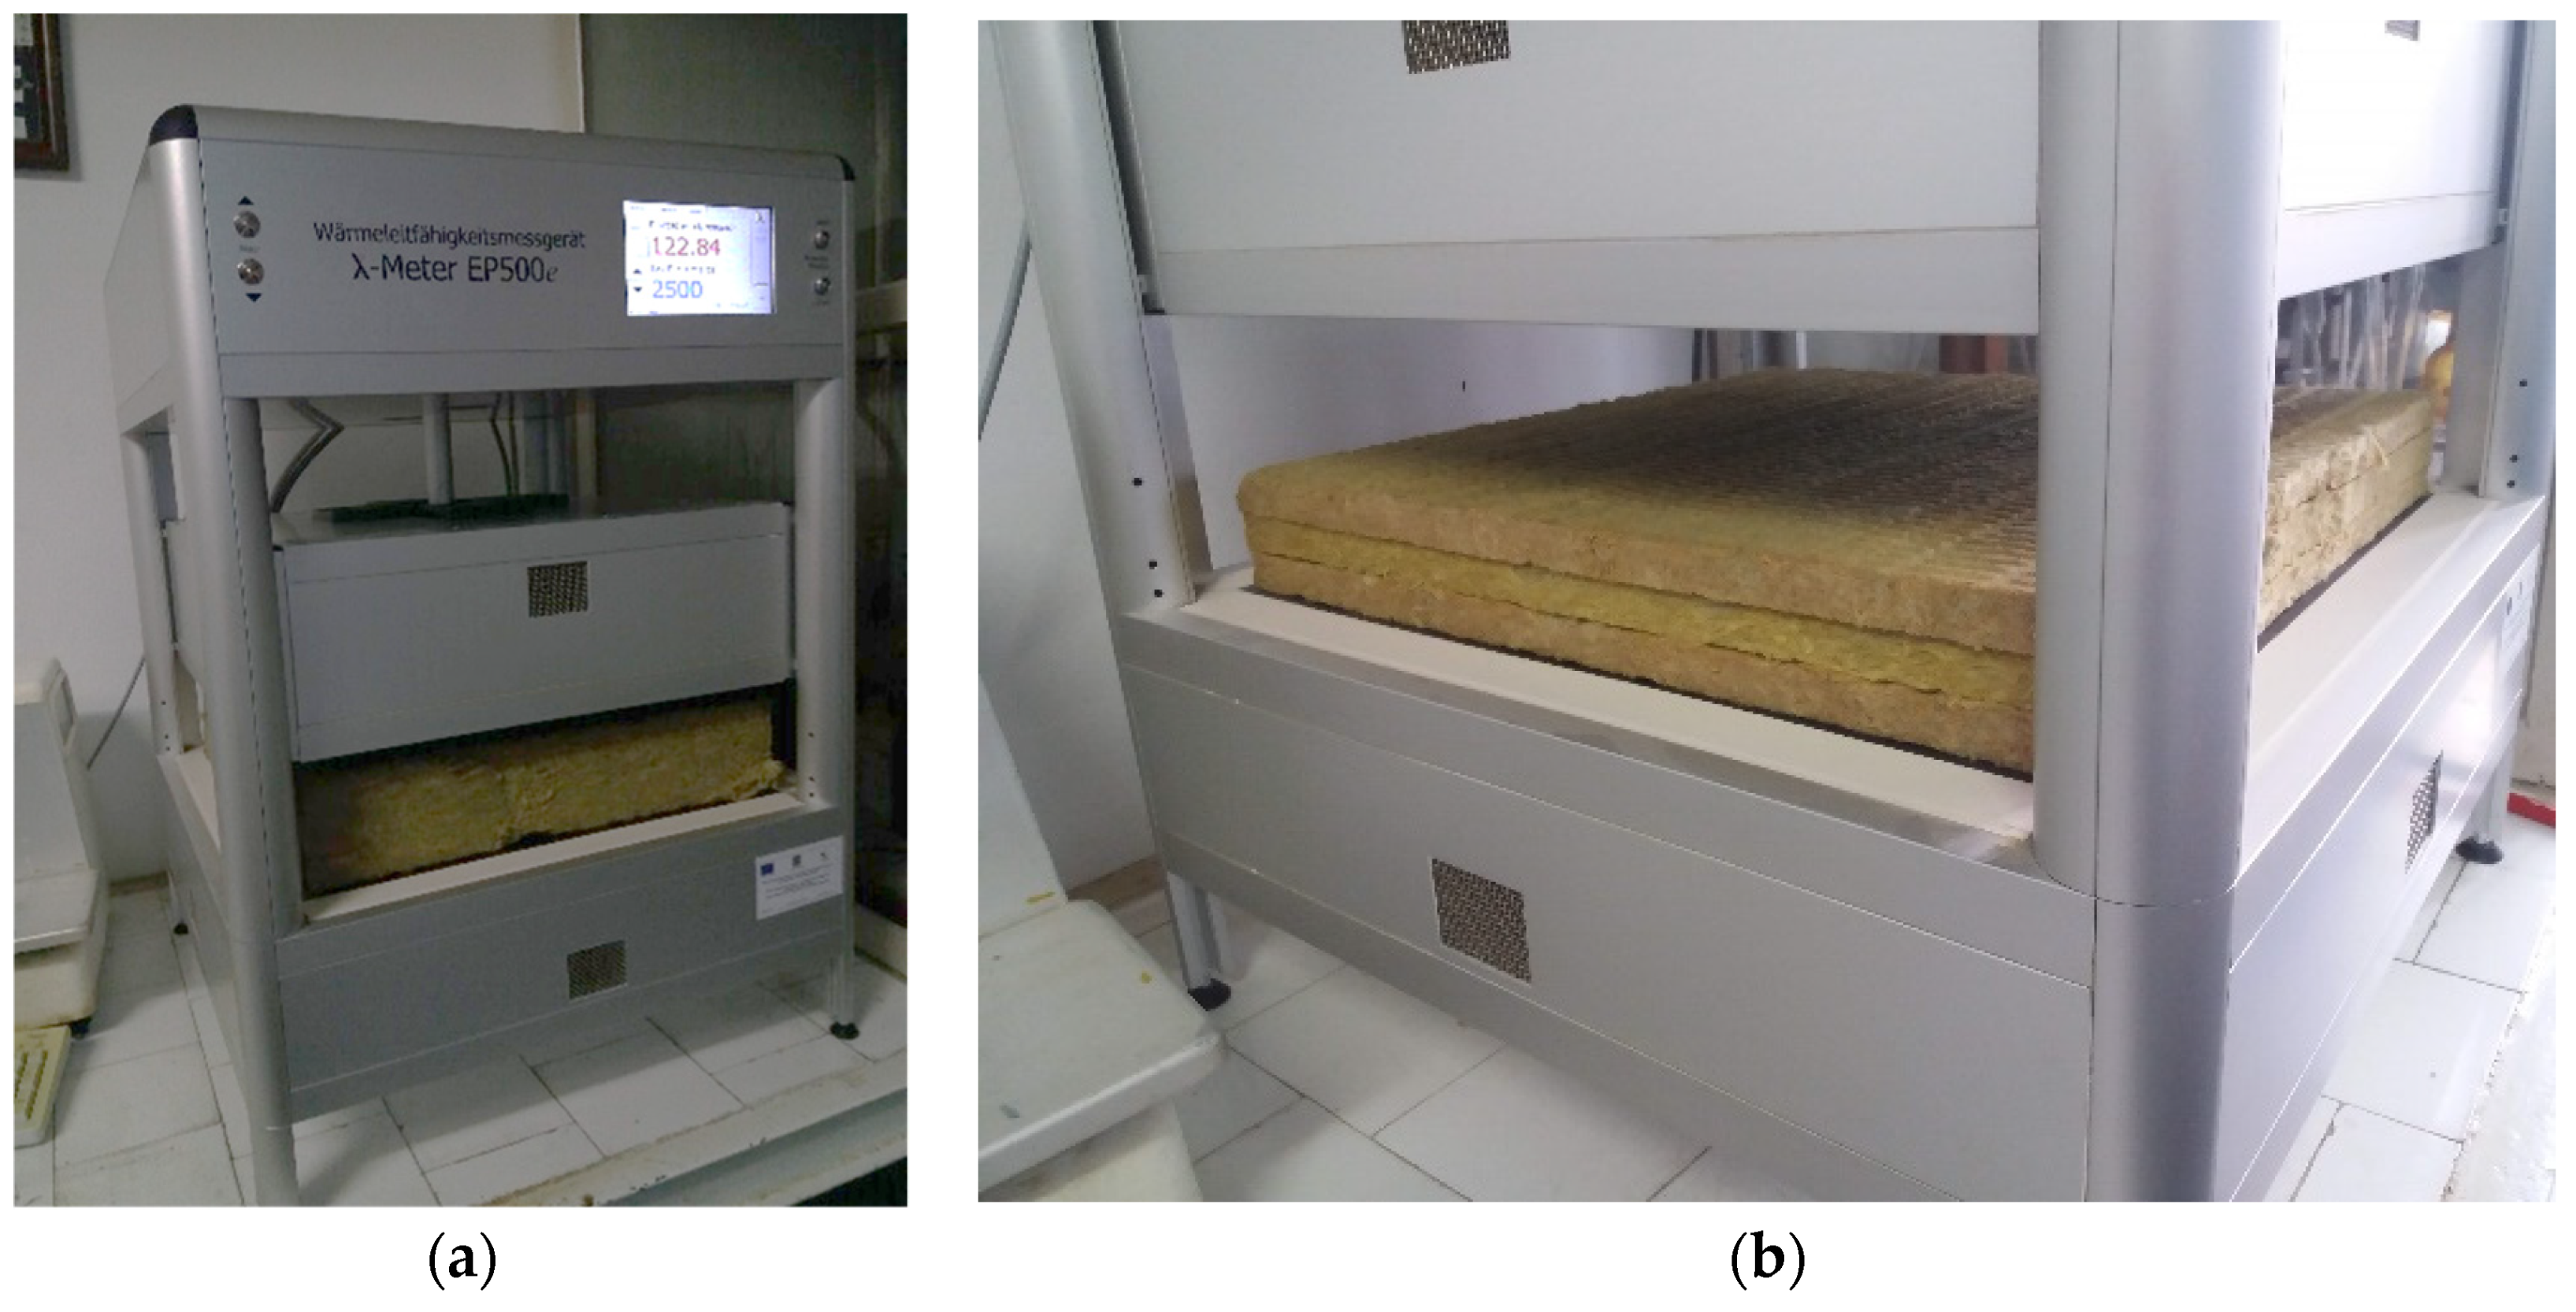
3.1. Laboratory Investigations on Insulation Systems

The results provided by the measuring device in the case of the two insulating samples meet the requirements ISO 8301 and EN 1946-2, although they had different thicknesses (10 cm solid probe; 6 cm probe with air cavities). The device determines the thermal conductivity (λ) by assessing the thickness of the sample thickness (d), the temperature difference (ΔT), and the heat flux (Q). The heat flux is determined according to the equivalent electrical power of the measured heating (P = U∙I). The thermal conductivity is determined corresponding to the measurement area, A, and the one-dimensional thermal conduction, following Equation (1):
λ = U I d A Δ T ,   W / ( m · K )
where:
U—electrical potential difference, V
I—electrical intensity, V/m
d—sample thickness, m
A—sample area, m2
ΔT—temperature difference, °C
Table 3 shows the average thermal conductivity of the insulating probes measured during the laboratory tests, as well as the thicknesses of the panels.
The thermal conductivity, 0.03907 W/(m∙K), measured according to the existing insulation panel (solid rockwool), was slightly higher (+2.81%) than the thermal conductivity provided by the manufacturer [4], that is, 0.038 W/(m∙K). As expected, the measured thermal conductivity of the rockwool panel with air layers was 6.9% higher than the thermal conductivity of the standard insulation, i.e., 0.04196 W/(m∙K). The increase in conductivity was expected to be compensated by an increase in the overall thickness caused by the air layers.

3.2. Evaluation of Thermal Properties

The performance of ISPA was evaluated, considering the difference in the emissions generated by the studied building in both insulation cases (EIS and ISPA). Theoretical calculations were performed considering the variation of the insulation material placed on the upper slab, and at the level of the exterior walls.
Table 4 shows the height (h), width (b), and thicknesses (dins) of the insulation panels. The volume of each layer was closely monitored to take into account the energy savings generated during the production stage. Emissions were estimated on the basis of the sheer amount of total insulation volume.
In the case of the existing insulation system, the building design team set the thickness of the insulation on the exterior wall to 15 cm, and on the upper slab, to 25 cm. By considering a relative constant rockwool volume, the thicknesses of the panels according to the ISPA design were increased to 23.5 cm for the exterior walls, and to 58.65 cm for the upper slab. The last two columns contained the insulation volume per square unit of envelope, and the thermal resistance of the insulation system (R), determined according to the thermal conductivity (λ) previously measured in laboratory tests.
As shown in Table 4, for ISPA, the insulation properties of the wall increased by almost 30%, from 3.839 (m2∙K)/W to 5.243 m2∙K/W, and for the upper slab, from 6.399 m2∙K/W to 8.817 m2∙K/W. This increase in thermal properties was achieved by using a relatively constant level of insulation material; the volume difference between the EIS and ISPA was 4.81% (2.08 × 10⁻¹ cm3/m2 to 2.05 × 10⁻¹ cm3/m2) for the wall insulation system, and −5.8% (from 3.47 × 10⁻¹ cm3/m2 to 3.45 × 10⁻¹ cm3/m2) for the upper slab. Taken together, these results indicate that improved thermal insulation properties are achieved by using a nearly constant insulating material.

3.3. Temperature Gradient Inside the Cross-Section of the Envelope Elements

The variation of the cumulative thermal flux (convection, conduction, and radiation) was determined for the high school building to confirm the thermodynamic Equations (1)–(11). The temperature variation throughout the envelope layers was determined and replicated with the help of design software.
Following this, several simulations conducted for the different stratifications and climate zones, and the following results were drawn when simulating the thermal performances of the ISPA:
  • The inner surface temperature of the envelope element was determined at 17.42 °C;
  • The outer surface temperature was mainly affected by the exterior temperature. This was determined at −7.10 °C for the upper slab, and −14.95 °C for the exterior walls;
  • The temperature of the concrete layer fluctuated between 17.7 °C and 17.4 °C in the case of the upper slab; in case of the exterior walls, the temperature of the AAC masonry fluctuated between 7.5 °C and 17.4 °C;
  • We considered that the mean exterior humidity of the air, measured during the winter season in Salonta was 68%, and that the interior humidity of the air was kept at a constant 50%. The temperature of the dew point for a relative humidity of between 50 and 65% was assessed according to the national standards as being between 7.0 °C and 10.1 °C. In the case of both the slab and the exterior walls, the dew point was placed outside the structural layers of the wall.
The graphical representation of the temperature variation across the square section of the envelope elements is presented in Figure 8.
Table 5 shows the variation of the medium temperature between the inside and outside boundaries of the air layers, and between the different boundaries of the rockwool layers. As expected, the temperature drop was significantly higher for the rockwool layers, since they are not affected by the convective heat flux. The high school building is located in the second climate zone; here, the temperature drop across the air layers was between 2.59 and 2.56 °C for the walls, and between 1.333 and 1.267 °C for the upper slab. This varied due to the thickness of the interposed air layers.
According to previous thermodynamic calculations, the temperature gradient of the exterior walls was determined for a critique interval of 20–30 mm and 25–35 mm for the upper slab. Further thickness increases involved an increase in thermal flux as a result of a significant increase in convective flux, and narrower thicknesses involved an increase in thermal flux as a result of an increase in conductive flux.

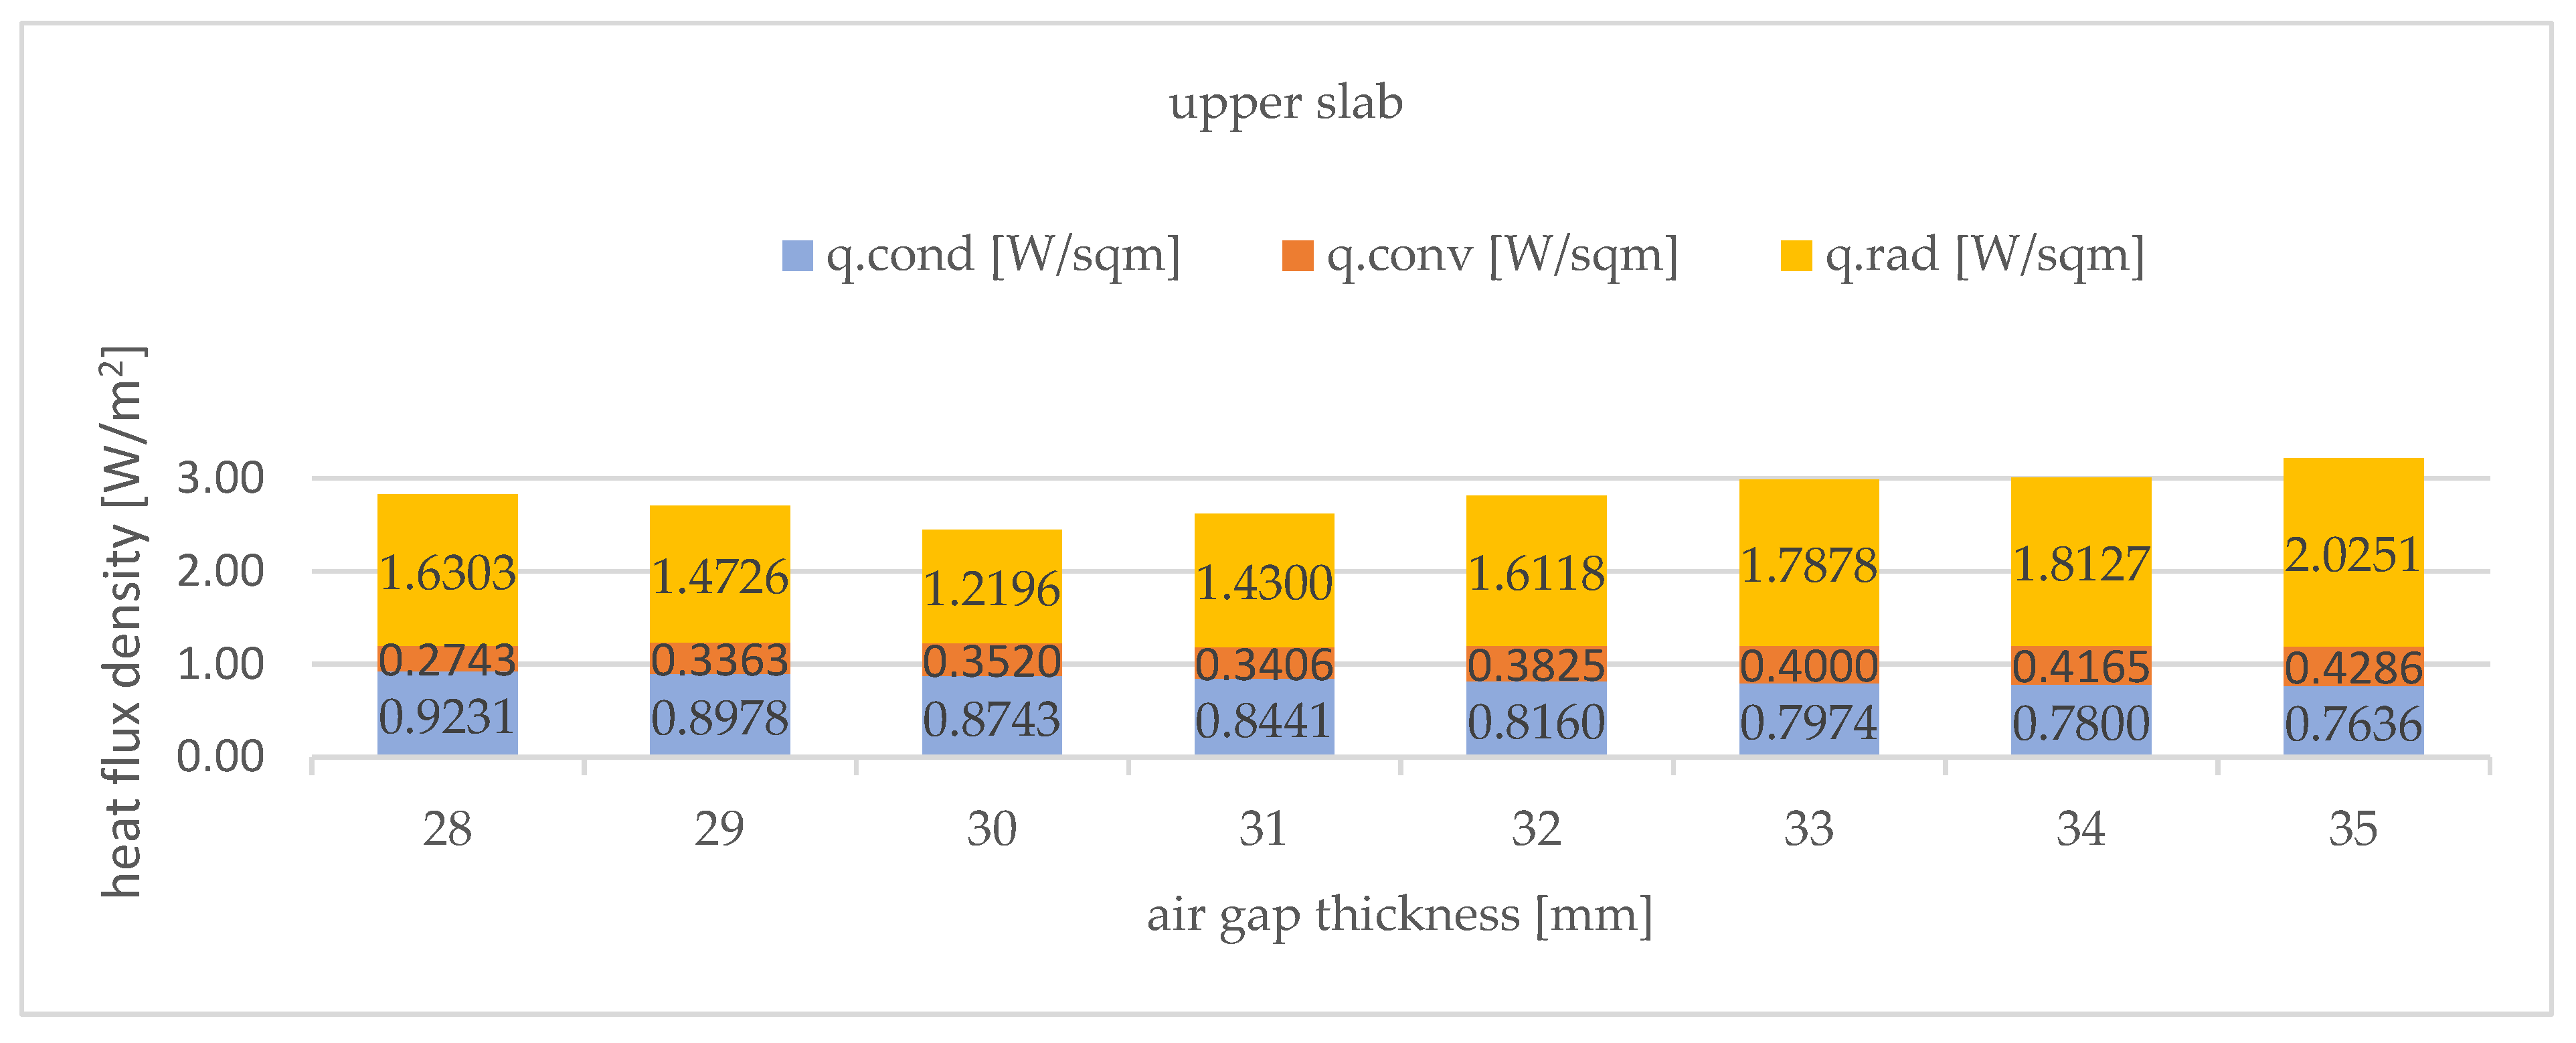
3.4. Heat Flux Density Analysis

The multiple layers of the new insulation system allowed heat to be transferred in a coupled process composed of conduction, convection, and heat radiation. However, the three heat transfer mechanisms were independently affected by the adjacent surface temperatures, the geometry of the air layers (height and depth), and the thermal properties of the building materials.
Insulating gas layers, as standard building materials, are also affected in addition to radiation by a conductive–convective thermodynamic effect. This phenomenon was simulated using the Rayleigh–Bénard relation independently for the vertical displacement of air layers (exterior walls) and for the horizontal ones (upper slab).
The insulation thickness of the air layer was optimized independently for each of the five national climate zones according to the coupled heat transfer mechanism composed of conduction and convection [20]. These two mechanisms, that is, conduction and convection, are seemingly opposite, i.e., by increasing the gap thickness, the conduction (qcond) is reduced while the convection is increased (qconv).
According to previous studies [20,21,22,23], multimodal conductive–convective heat transfer across a vertical air cavity (exterior wall insulation) and horizontal bottom-heated cavities (upper slab) are defined by the Fourier law according to Equation (2):
q c o n d = λ a i r Δ T G a p t G a p = λ R W Δ T R W t R W
where λair and λRW are the thermal conductivities of the air and rockwool layers, ΔTGap and ΔTRW are the temperature differences between the sides of the related layers, and tGap and tRW are the thicknesses of the air and the rockwool layer, respectively. In the case of conductive heat flow, the transferred heat decreases with increasing thickness.
Thus, the convection flux, determined according to Equation (3), was commensurately affected by the increase in the thickness of the air gap, due to the promotion of Bernard cells (convective cells) [22,23]:
q c o n d = h Δ T G a p
The convection coefficient h is determined according to Equation (9), based on the material properties and on the Nusselt number. For vertical air layers, the Nusselt number is determined according to the Rayleigh number in Equations (4)–(7) [22]:
N u = 1.0   if   R a < 1.7 × 10 3
N u = 0.059 R a 0.4   if   1.7 × 10 3 < R a < 7.0 × 10 3
N u = 0.021 R a 0.25   if   7.0 × 10 3 < R a < 3.2 × 10 4
N u = 0.061 R a 0.33   if   R a > 3.2 × 10 4
where   R a = g β ( T 1 T 2 ) t G a p 3 P r v 2 .
These correlations are defined by the Rayleigh number of airflow, where ν, β, α, and g are the kinematic viscosity, the compressibility module, the thermal diffusivity, and the gravitational acceleration, respectively. Because the bulk convection motion implies a larger distance scale than heat conduction, which is limited to neighboring molecules, free convection correlations also include the heat conduction mechanism [22]. The dimensionless Prandtl number of air, Pr, is calculated as being the mean temperature (T1 + T2)/2, where T1 and T2 represent the temperatures of the air layer determined on the outer and inner surfaces.
In the case of the vertical air layers of the wall insulation, the convective heat transfer coefficient (h) and the Nu are defined by Equations (9) and (10). These correlations are defined by the Prandtl number of the air (Pr = ν/α):
h = N u λ a i r t G a p
N u = 0.42 R a 1 4 P r 0.012 ( H t G a p ) 0.3
The factor (H/tGap)−0.3 takes into account the effect of convective cells on convection mechanisms, and decreases the Nusselt number. Because the previous equations are valid for (H/tGap) ratios of up to 40, we assumed that the reduction achievable in our case to be no greater than this, even though, in the case of the studied rockwool panels, the ratio is equal to 50. The factor (H/tGap)−0.3 considers the effect of convective cells on the convection mechanisms, and decreases the Nusselt number.
Simultaneously, with the conduction–convection mechanism, the radiation effect is another heat transfer mechanism that affects the thermal flow through the air layers. The radiation effect is determined according to Equations (10) and (11) based on the emissivity ε and on the temperature difference T1 and T2, but also on the Stefan–Boltzmann constant, σ.
The heat flux transferred by infrared thermal radiation was determined according to Equation (11). The radiation heat flux was estimated using the grey body model, in which the infrared emissivity εef was considered according to Equation (12). In the present case, the emissivity’s ε1 and ε2 had the same value, that is, the emissivity of simple mineral rockwool:
q r a d = ε e f σ ( T 1 4 T 2 4 )
where:
ε e f = 1 1 ε 1 + 1 ε 2 1
The variations in heat flux density were determined for the school building (second national climate zone), and are presented in Figure 9 for the exterior walls, and in Figure 10 for the upper slab facing the unheated attic space. As expected, and as confirmed also in the following sections by the thermodynamic evaluations regarding the conductive–convective effect, the total thermal flux had a convex variation. The heat flux densities were minimum at an air layer thickness of 23 mm for the exterior walls, and 31.5 mm for the upper slab.
In case of the outer walls, the thicknesses smaller than the optimum (19–22 mm), the growth of the total thermal flow was caused both by the increase in the convective heat flux density, from 0.7388 W/m2 to 0.9937 W/m2, but also by the increase in the conductive heat flux density, from 0.9329 W/m2 to 1.3996 W/m2. Within this section, the radiative heat flow decreased from 2.4106 W/m2 to 1.8387 W/m2. On the right side of the optimal thickness (from 23 to 29 mm), both the radiation and convective flux experienced constant growth. This increase was reflected by the increase in the total heat flux density, from 4.082 W/m2 for 23 mm, to 4.868 W/m2 for 29 mm. The variation in the density of the heat flux according to the thickness of the air layer in the case of the exterior wall of the high school building is presented in Figure 9.
Taking the radiation component of the total heat flux density, it can be noticed that, in the case of the walls, the radiation component represented between 43.45% and 69.69% of the total heat flux density. For the optimum thickness, the radiation (2.4106 W/m2) represented 59.05% of the total heat flux (4.0823 W/m2).
The variation in the heat flux density according to the thickness of the air layer in the case of the upper slab of the high school building is presented in Figure 10.
The variation tendencies were kept for the upper slab as well. Here, though, the fluctuation of heat flux densities were smaller than in case of the outer walls, because of the smaller temperature gradient between the indoor and unheated space temperatures. The total heat flux density had a growing tendency, from the minimum determined value (2.4459 W/m2 for tGap = 30 mm) to 2.8277 W/m2 for tGap = 28 mm and 3.2173 W/m2 for tGap = 35 mm. In the case of the upper slab, the radiative component represented a percentage value that was between 57.66 and 62.94% of the total heat flux density. For tGap=30 mm, of the optimal thickness for the upper slab towards the unheated attic space, radiation represented 49.86% of the total heat flux density (2.4459 W/m2).

3.5. Embedded Emissions during the Produciton Stage of Insulation Systems

The present study does not include the study of the additional emissions generated by a more complex manufacturing process needed by ISPA. To evaluate the emissions generated during the production stage of each insulation system, the total amount of rockwool used to insulate the building was determined and is shown in Table 6. Total CO2 emissions are estimated based on the total insulation volume of the solid insulation material and the Global Warming Potential (GWP) of rockwool obtained from previous research [29]. According to this, the GWP of rockwool varied between 0.9 and 1.08 (kg CO2eq)/kg.
As expected, the emissions saved during the manufacturing process were negligible: −0.83% for the walls and −0.54% for the upper slab. Although from the very beginning of the research, the intention was to keep a constant level of solid rockwool by increasing the thermal performances as much as possible, the leading savings are expected to occur during the operation phase.
Due to the higher compressive forces, the slab on the ground was insulated with XPS panels, i.e., 25 cm thick extruded polystyrene plates. Due to this, Table 6 includes embedded emissions according to the insulation material used for the exterior walls and the upper slab only.

3.6. Energy Consumption during the Operating Phase

The energy consumption during the operating phase of the highly efficient building was theoretically determined to correlate with the savings caused by the IPSA during both the operation and manufacturing phases.
The energy consumption of the high school building was theoretically determined using software that was regulated and certified at the national level, according to European Standards [30,31]. The software was developed to determine the energy generated during operation, and to perform the economic analysis of the rehabilitation methods of existing buildings according to European and National Standards.
After the completed calculation, the energy consumption of the building was transposed into equivalent carbon dioxide emissions according to the most recent official data provided by the European Environment Agency (EEA). According to the EEA, electricity production at the national level in 2016 produced 0.2958 kgCO2/kWh [32]. Figure 11 shows the fluctuation of harmful emissions generated by electricity production in Romania between 1992 and 2016. According to the graph, the carbon footprint of electricity production was almost 22% smaller in 2016 than in 1992, when the measurement started. However, to meet international commitments to reduce emitted pollutants, in addition to energy production efficiency, the construction industry must continue to strive to reduce energy demand during the operating stage.
The energy consumption according to the operating phase of the building insulated with both the EIS and the ISPA is theoretically determined and presented in Table 7. To validate the accuracy of the theoretically calculated consumptions, the real-time measurements performed by the design team are presented, along with column 1.
According to theoretical estimates, during the building operation phase, the emissions generated in the case of the ISPA, 21.05 kWh/(m2∙year), are nearly 9.9% lower than those generated in the case of the EIS, 21.24 kWh/(m2∙year). Nevertheless, by comparing the EIS consumption, the theoretically determined values exceeded the real-time measurements by 9.0%.
Inaccuracies in real-time measurements are likely to be caused by a lack of complete operational capacity of the building during the first monitoring period. In other words, the emissions generated are expected to increase in the near future, due to the more intensive use of the building. It was estimated that the overall increase in energy consumption would soon exceed 30% of the real-time measurements.
The value recorded by the counting meters for 21 months of use, 130,485.00 kWh, was assigned to the electricity consumption of the HVAC systems and of different kitchen appliances.
The consumption measurements for the kitchen were reordered over a 10 month period, and are expected to increase as the use of the building increases. Kitchen facilities were selected to meet the main objectives; namely, the provision of the necessary premises for study and accommodation, while reducing energy consumption and harmful emissions. The energy consumption of the kitchen was measured individually for the two power sources, as follows:
  • Electric power source. Electric energy consumed by the kitchen facilities was measured to increase to 0.272 kWh/(m2∙month). Because the kitchen was fully operational for only 10 months of the measurement period, it was estimated that the consumption would increase by no more than 0.25 kWh/(m2∙month).
  • Gas power source. During the first 10 months of operation, gas consumption was 118 m3/month, i.e., an annual consumption of 4.2 kWh/year or 0.35 kWh/(m2∙month). As the rate of use increased, the average energy consumption of the kitchen was expected to increase by 0.2 kWh/(m2∙month).
  • Since the accommodation rooms were only used periodically, the heating systems did not operate continuously on the upper level. However, without continuous heating sources, the average interior temperature of the accommodation rooms was only provided by ventilation systems at 17 °C.
  • A more intense use of accommodation rooms was estimated to increase inconsequential energy consumption due to higher internal heat gains. In return, a more intense use of accommodation rooms was expected to increase the consumption of electrical energy from household appliances by 0.2 kWh/month, resulting in 2.4 kWh/(m2∙year).
Taking into account all of the evaluated consumptions, the increase in energy consumption was estimated to be approximately 30%; that is, a total energy consumption of 30.84 kWh/(m2∙year). Table 8 presents the real-time measurements and the estimated increase according to the building designers.

3.7. Temperature Gradient within the Envelope Elements Determined According to Each of the Five National Climate Zones

Temperature variation throughout the envelope layers was determined for the five national climate zones, and was reproduced with the help of design software. The calculation was concluded as follows:
  • The inner surface temperature of the envelope element was between 17.2 °C and 17.9 °C, depending on the temperature difference between the interior and exterior environments. The specific climate zone in which the simulation was performed had little to no effect on the interior surface temperature in the case of highly efficient envelope elements: the maximum temperature difference between the interior temperatures of the surface elements did not exceed 0.5 °C (2.9%).
  • The outer surface temperature was affected mainly by the exterior temperature. This ranged between −6.7 °C and 15.2 °C for the upper slab, and from −14.8 °C to −24.6 °C for the exterior walls.
  • The temperature of the concrete layer fluctuated between 17.7 °C and 17.4 °C in the case of the upper slab, and in the case of the exterior walls, the temperature of the AAC masonry fluctuated between 7.5 °C and 17.4 °C.
Table 9 and Table 10 show the drop in medium temperature between the air layers and between the rockwool layers in the case of all the climatic zones at a national level. As expected, the temperature drop was significantly higher for rockwool layers, since they were not affected by the convective heat flux. The high school building is located in the second climate zone; here, the temperature drop across the air layers was between 2.59 and 2.56 °C in the case of the walls, and 1.333–1.267 °C in the case of the upper slab. This varied due to the thickness of the interposed air layers. If we look at all of the climate zones, we notice that the temperature gradient over the rockwool layers was between 2.42 and 3.44 °C. The variation was mainly affected by thickness and external temperature.

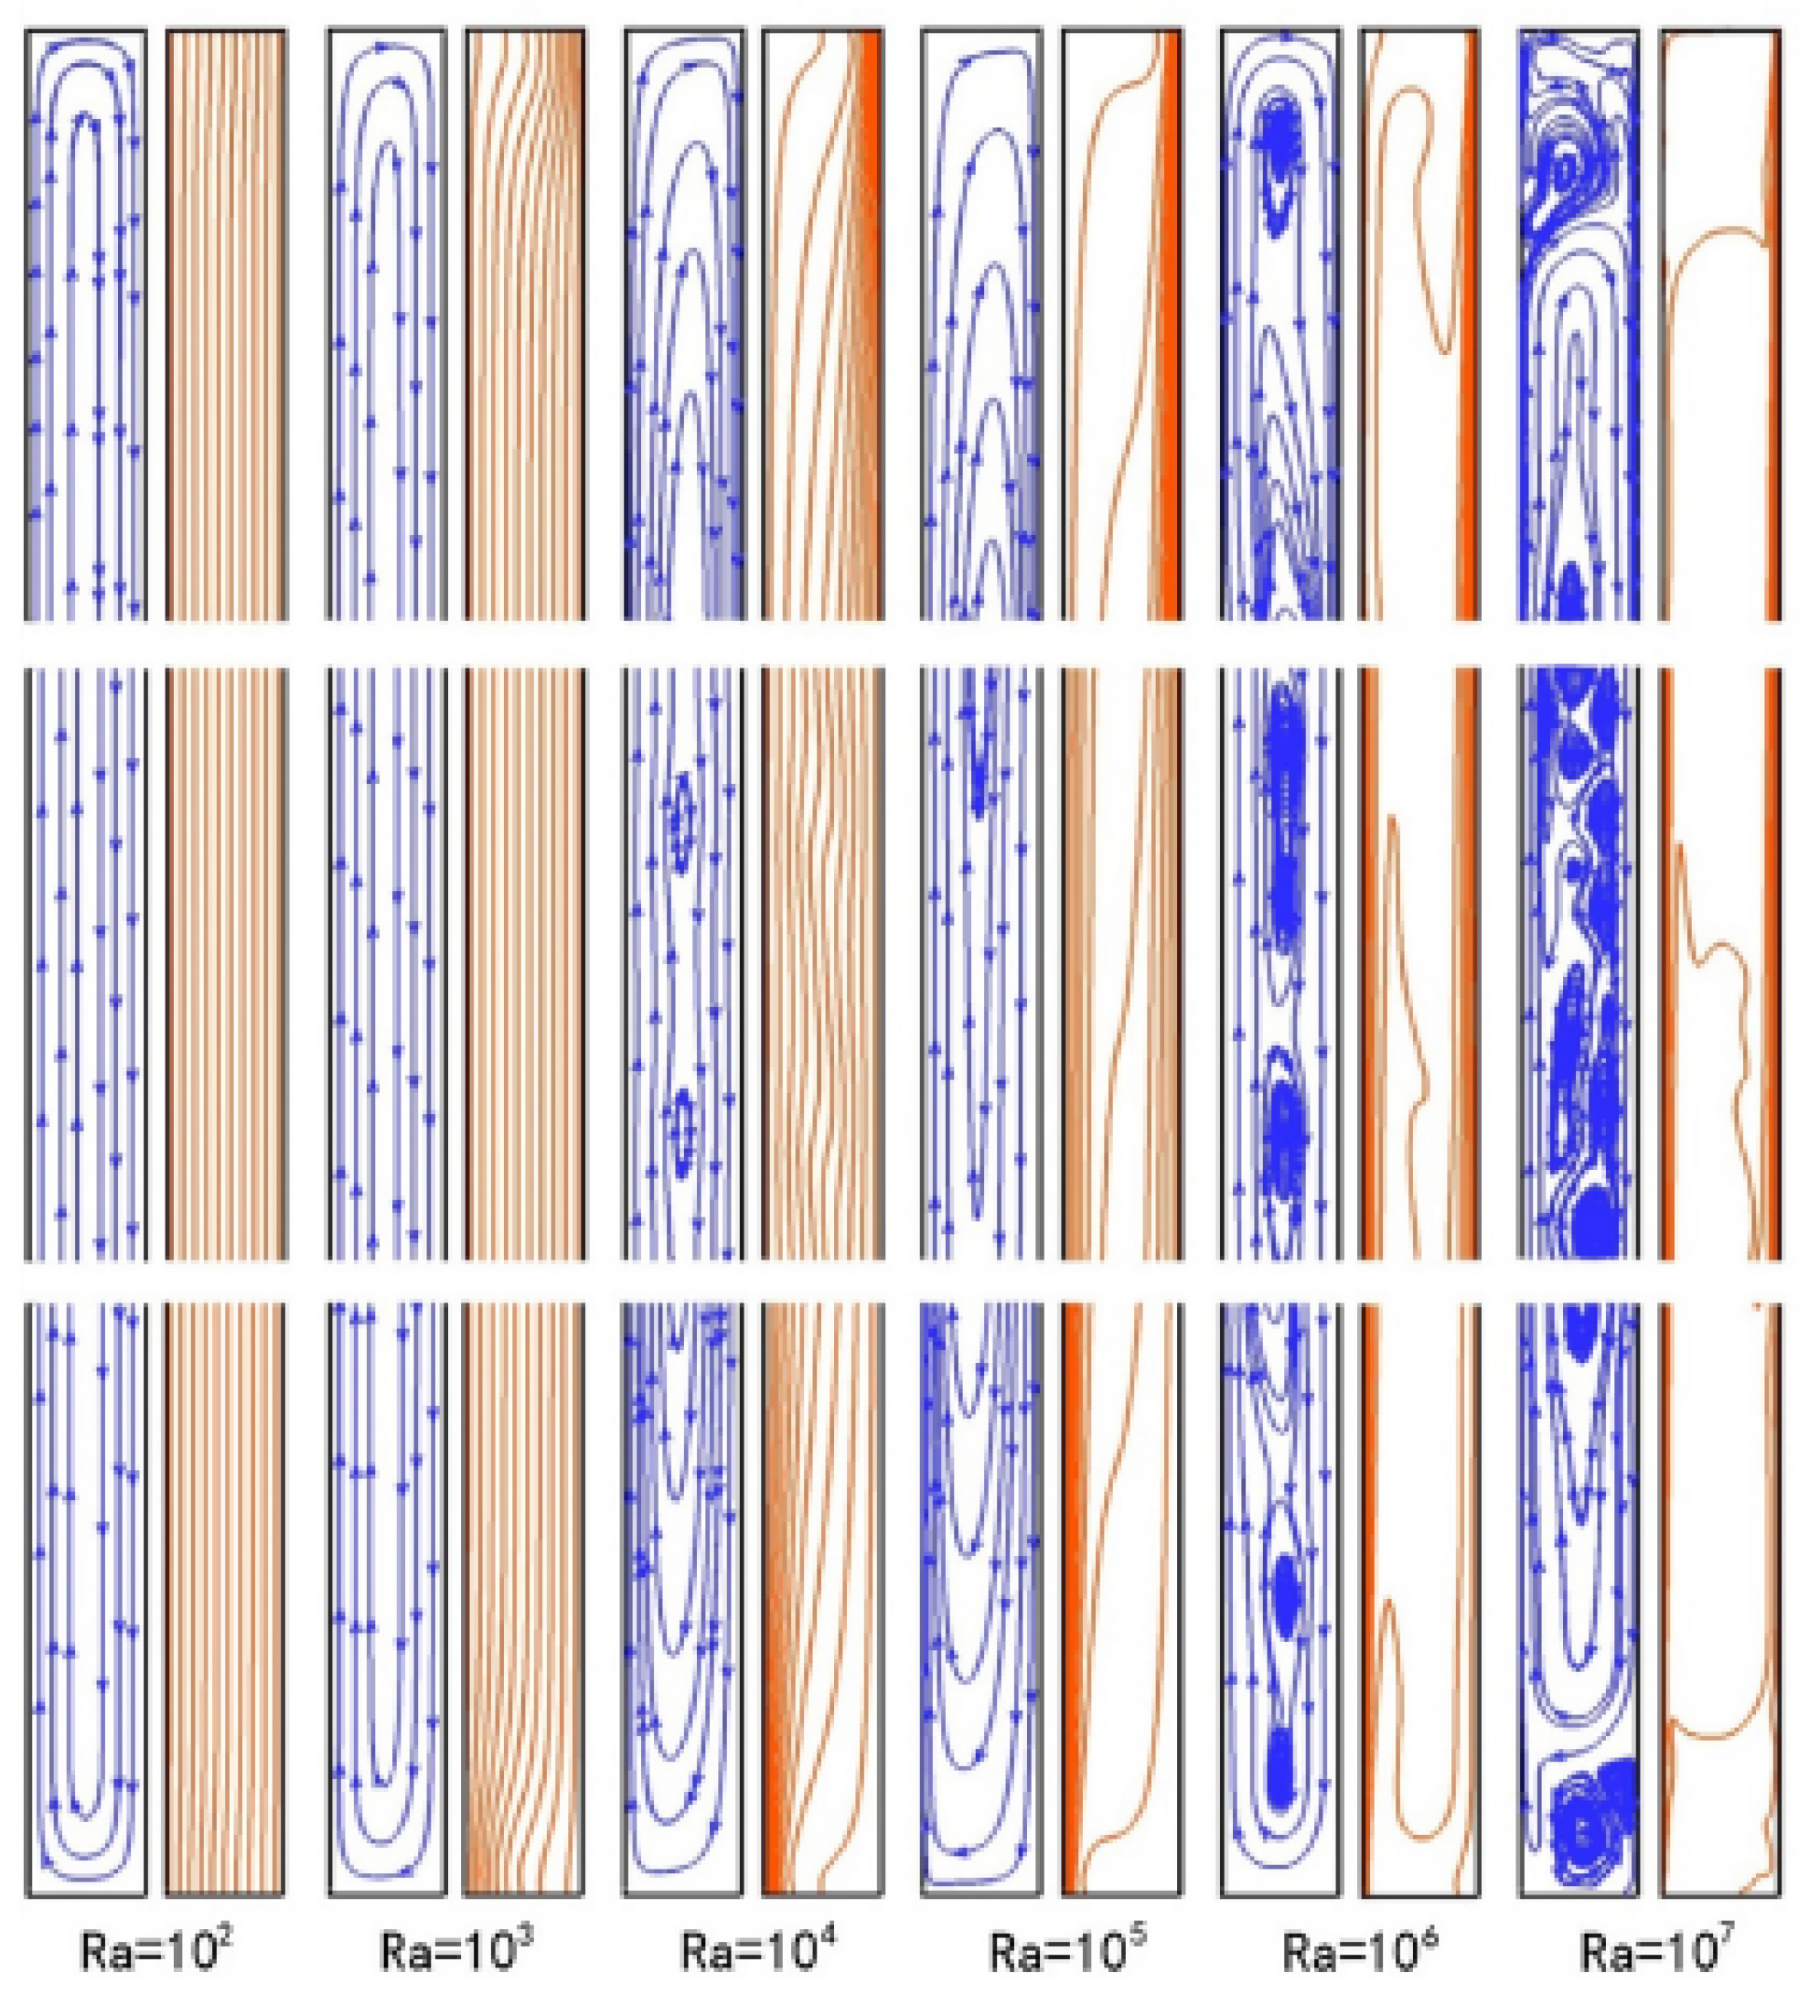
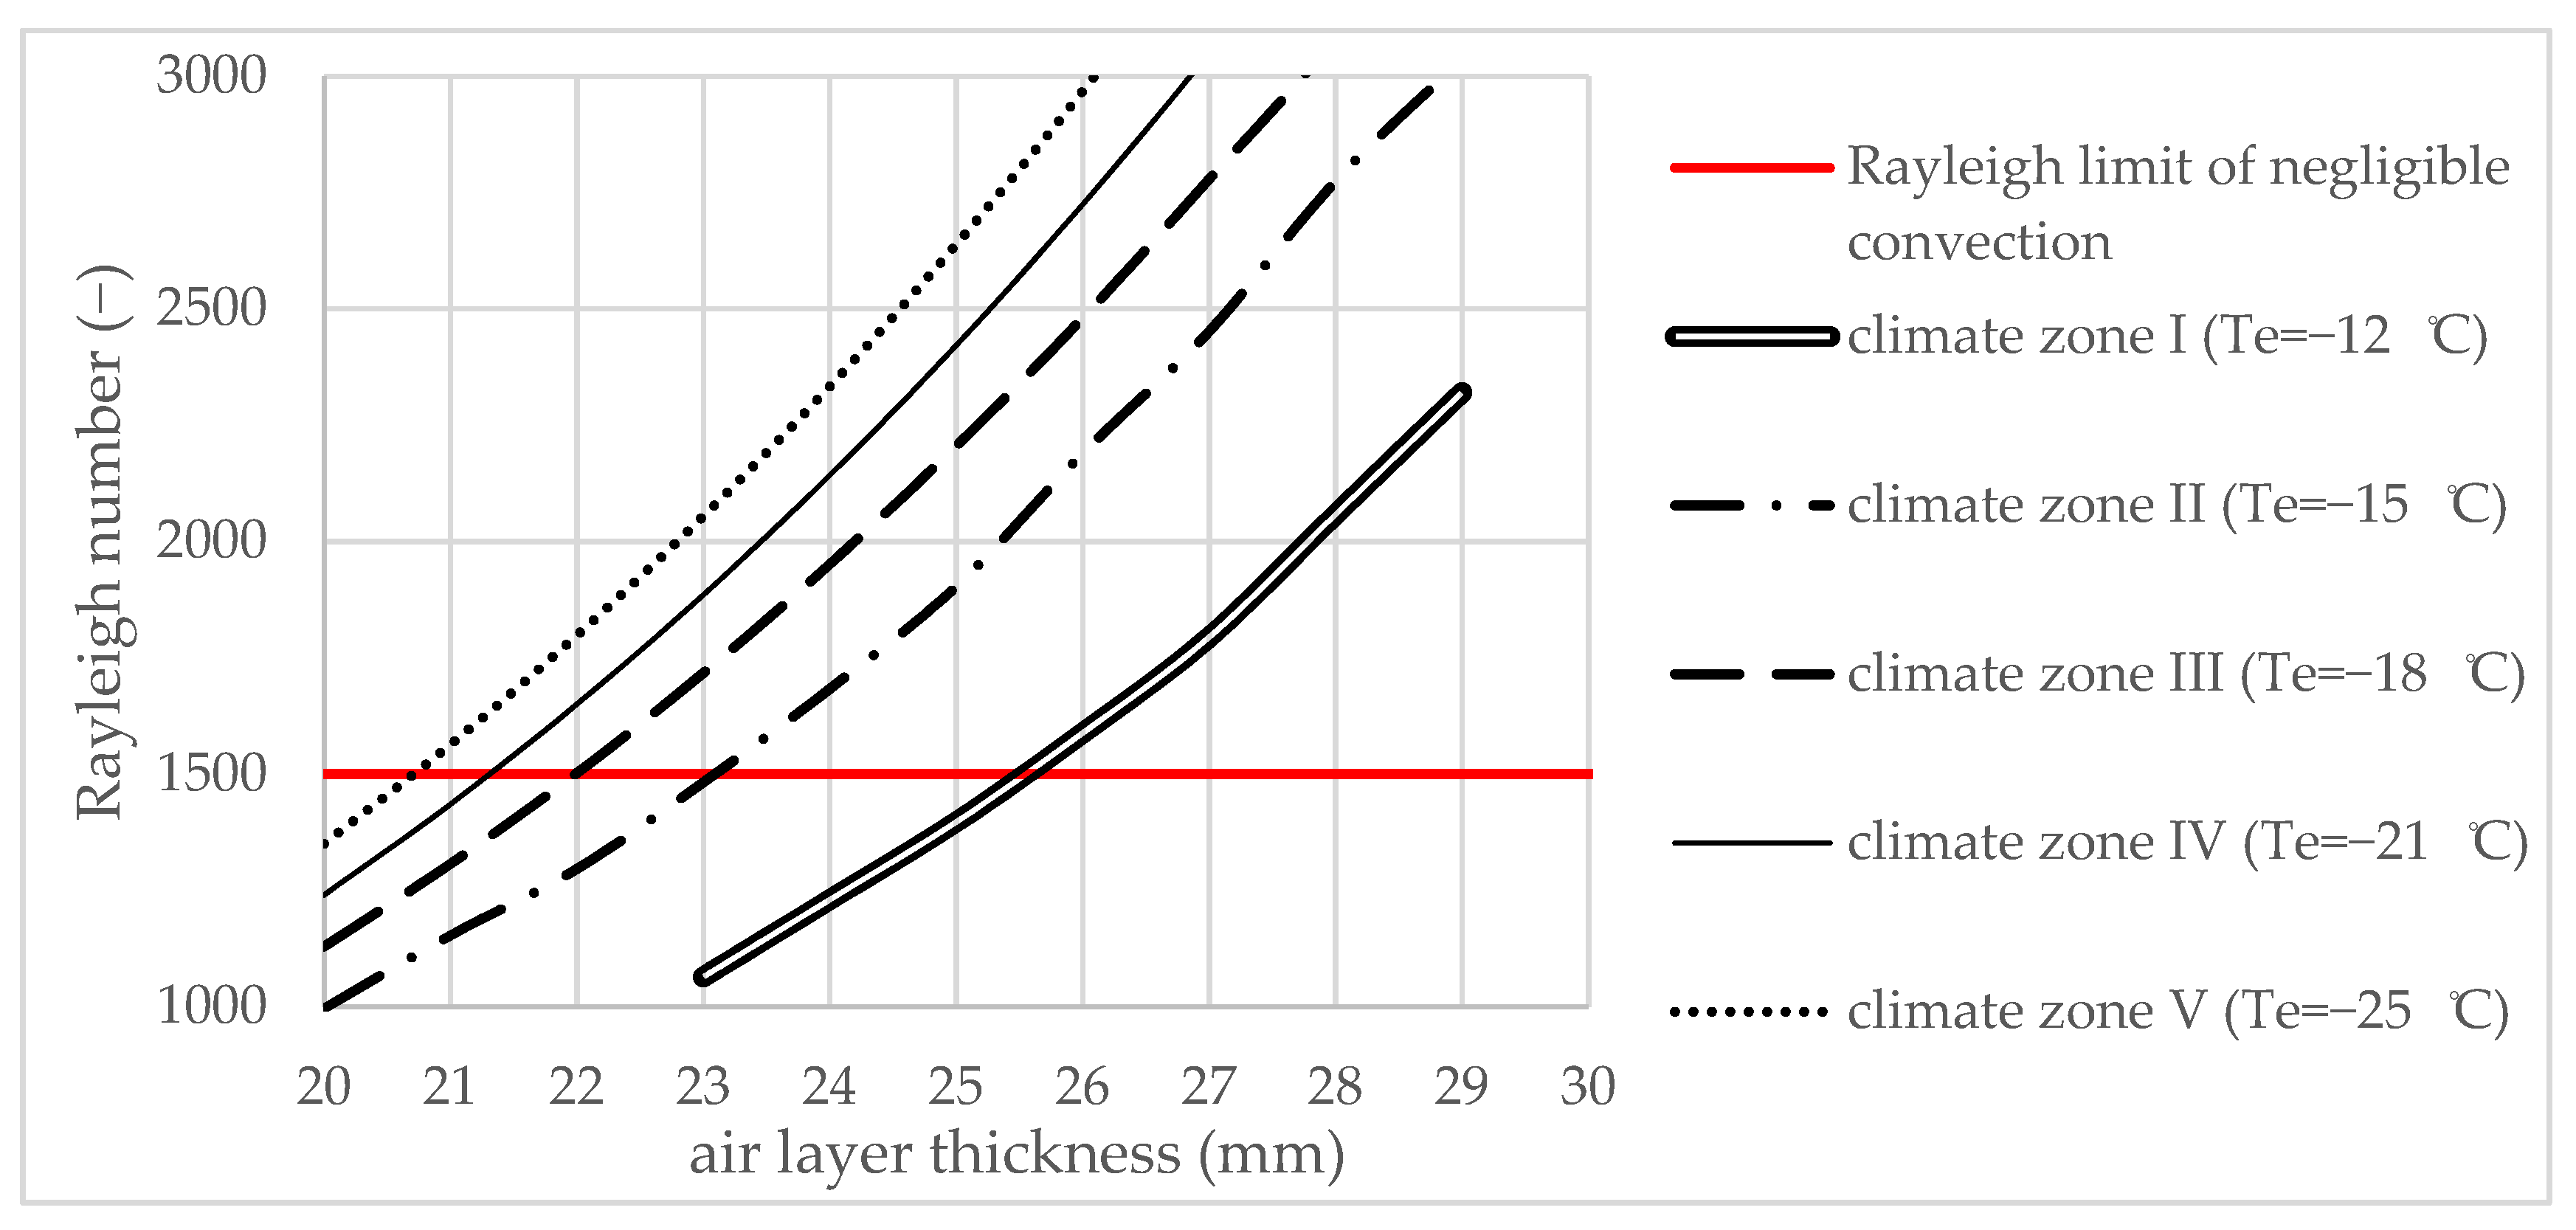
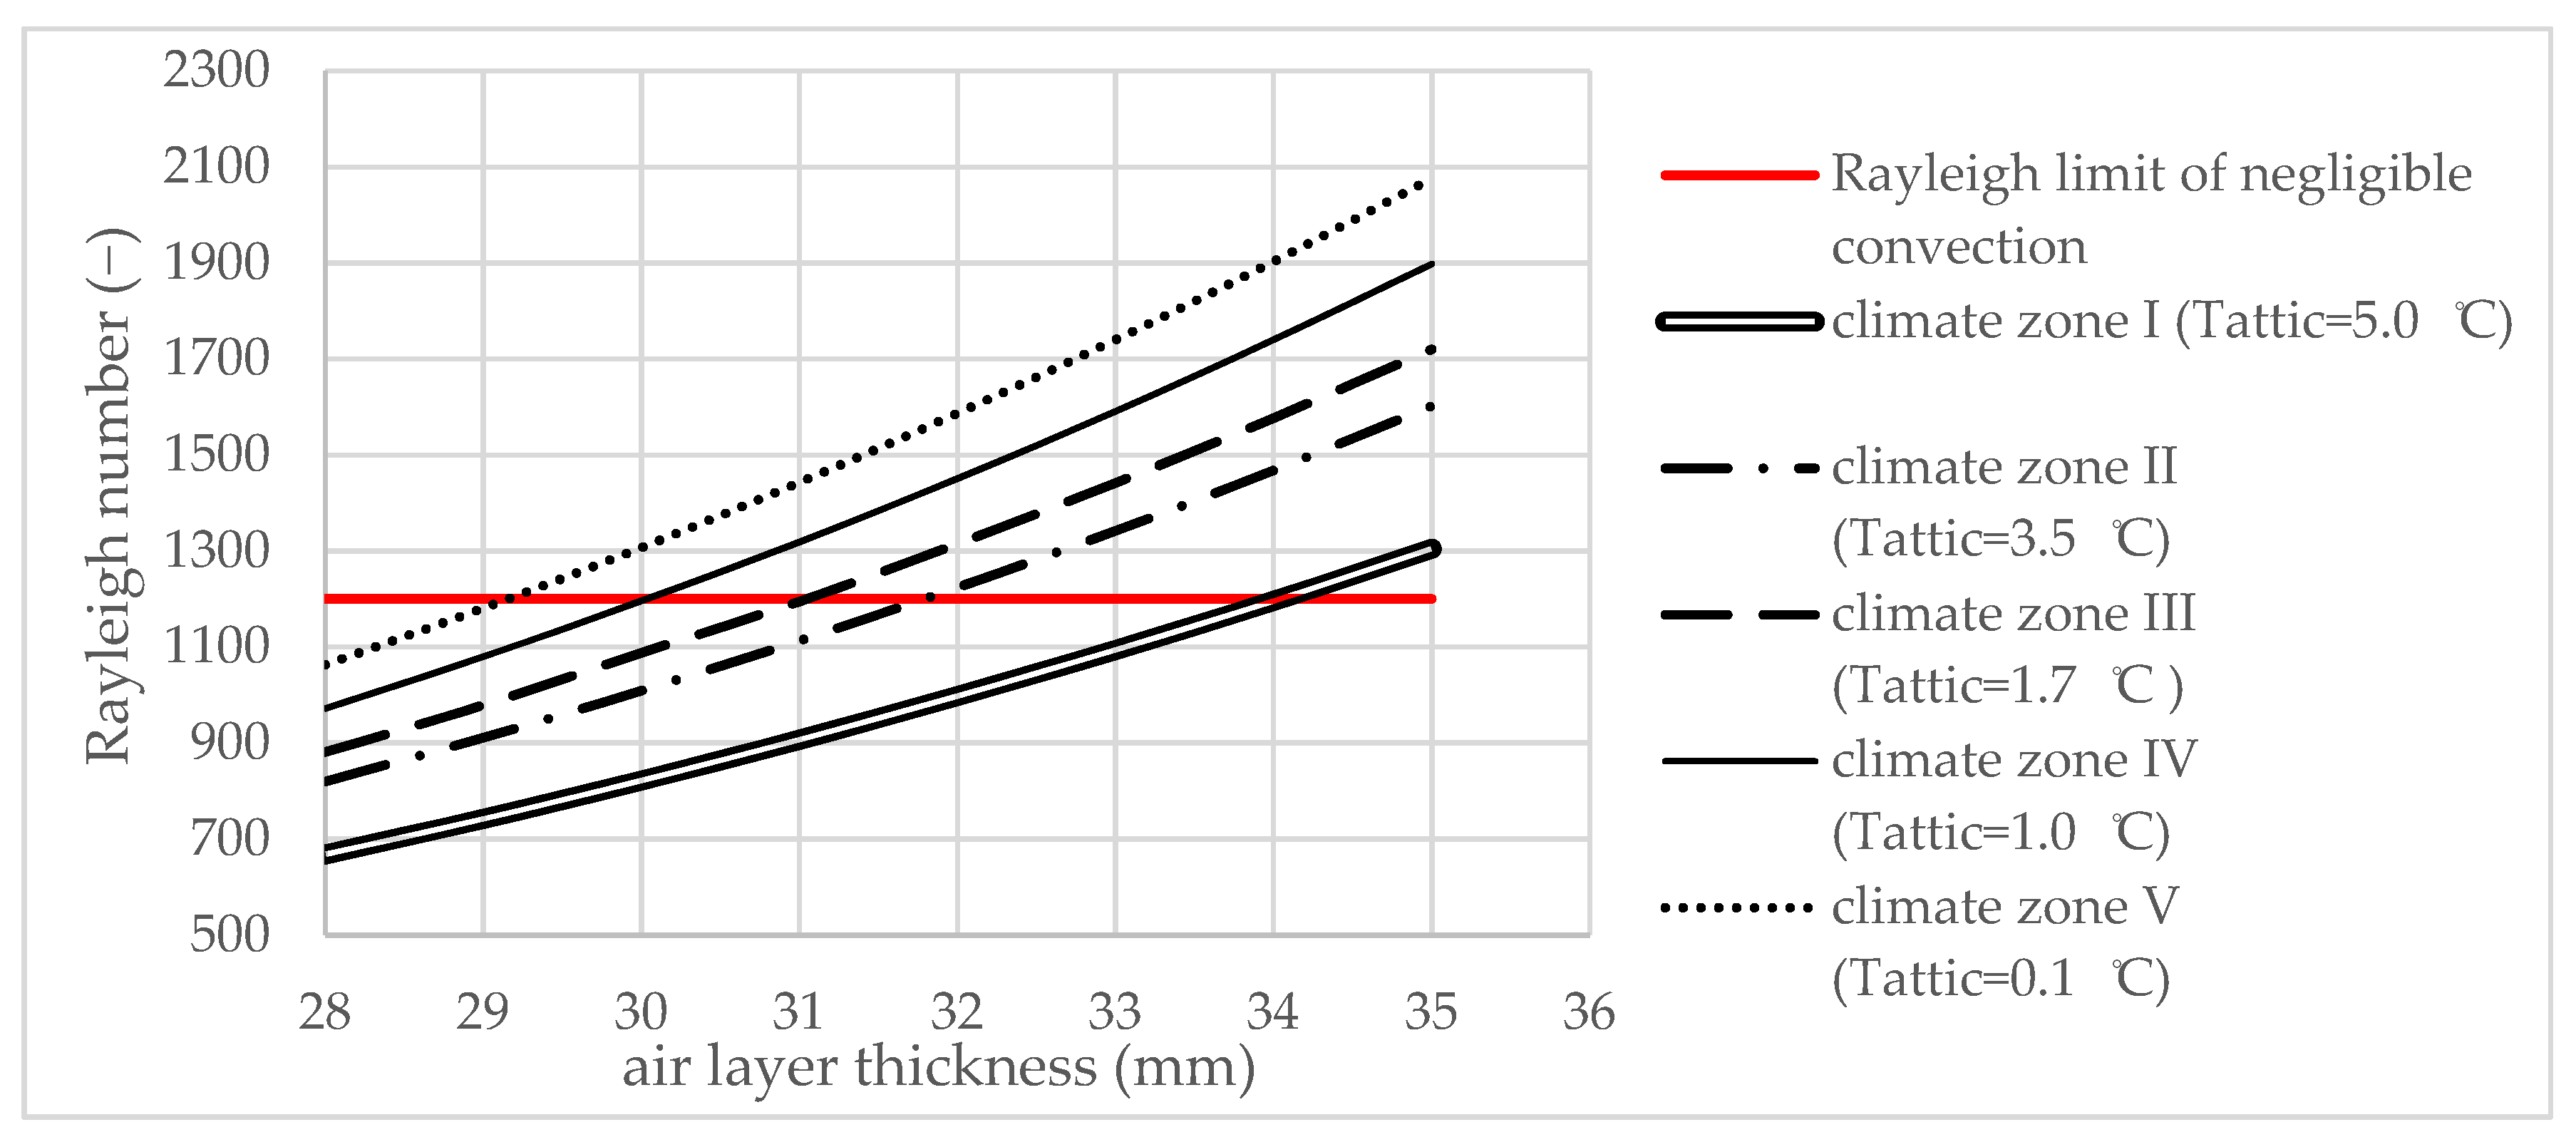
3.8. Confirmation of Optimum Air Layer Thicknesses according to the Rayleigh and Nusselt Numbers

As previously determined by Equations (1)–(11), the conduction heat flux throughout was influenced, in addition to radiation, by the coupled conduction–convection mechanism. In the case of air layers, the conduction decreases as the air thickness increases. On the contrary, the convection flux in the air layer increases with increasing the thickness of the air layer, because the natural convection is promoted. In summary, the ratio between the buoyancy ratio and the thermal diffusivity is also represented by the dimensionless Rayleigh and Nusselt numbers [22].
Previous studies on the relationship between the magnitude of natural convection and the Rayleigh number can be summarized as the following main ideas.
  • When the Rayleigh number exceeds 102, the streamlines and isotherms show parallel distributions, indicating that the heat flux caused by the convection mechanism is negligible.
  • The airflow pattern has a pure conductive character when Ra < 1.2 × 10³ in the case of horizontal displacement of the air layer, and when Ra < 1.5 × 10³, in the case of vertical displacement of the air layer.
  • When the Rayleigh number exceeds 1.2 × 10³ in the case of horizontal air layers, and 1.5 × 10³ in the case of vertical air layers, the airflow gains a laminar aspect.
  • The laminar flow is noticeable when Ra overcomes 3.5 × 10⁴ for the slab, and 1.4 × 10⁵ for the walls.
In other words, the optimal thickness of the air chamber is encountered (a minimum heat flux density composed of conductive, convective, and radiation) when the following assumptions are simultaneously met [20,21,22,23]:
  • Nu ≤ 1.0;
  • Ra ≤ 1200 for the upper slab (horizontal air chamber);
  • Ra ≤ 1500 for the exterior walls (vertical air chambers).
To illustrate the velocity profile of the air layer under different Rayleigh numbers, Figure 12 shows the variation of isotherms in vertical air layers [23].
The conclusion of studies [20,21,22,23] is that, by increasing the insulation thickness or by lowering the temperature difference between the indoor and outdoor environments, the optimal thickness of the air layers increases.
The optimum thicknesses for the air insulation layers are determined using the coupled heat flux equations of the conductive, convective, and radiation effects. According to simulations and numerical calculations, the thickness is mainly influenced by the following two aspects:
  • The ratio between the height and the thickness of the air layer;
  • The temperature difference between the interior and exterior temperatures. The calculations comprised in this work were performed according to the conventional interior temperatures of school buildings, and according to the conventional exterior temperatures of the five climate zones in Romania.
The following graphs presented in Figure 13 and Figure 14 show the variation of the Rayleigh number according to the five climate zones to be encountered in Romania. The comparison between the climate zones was made to emphasize the importance of choosing the thicknesses of the air layers according to local specificities. It can be noticed that as we move from a warmer climate (zone I) to a colder one (zone V), the restraint imposed by the Rayleigh number tends to decrease the optimal air layer thickness. In all of the cases studied, it is important to note that the Nu is between 0.76 and 0.85, which is far enough from the boundary 1.0, which is the limit between pure conduction and laminar convection.
According to Equations (1)–(11), the convective effect is considerably greater in the case of horizontal insulation placed on the upper slab, than in the case of vertical air layers placed on the insulation of the exterior walls. With regard to the previous equations, a horizontal air layer would also imply smaller air layer thicknesses compared to the vertical air layers. Nevertheless, smaller temperature gradients between exterior temperature, i.e., the unheated attic space and the interior temperature, allow larger thicknesses for the insulating air layers.
The red horizontal line marks the upper limit between conductive and convective heat flow, as presented in previous studies [20,21,22,23]. For the vertical air layers, the upper limit between pure conductive heat exchange and heat exchange that is also affected by the conductive–convective mechanism is represented in Figure 13 by the horizontal red asymptote at 1500.
Due to the increased convective effect, for the horizontal air layers presented in Figure 14, the limit of pure conduction is set, according to previous studies, at 1200 [20,21,22,23].
Table 11 contains the different Nusselt and Rayleigh numbers identified for each national climate zone, where the minimum heat flux density was determined. The previous values established in the literature in relation to the optimum air layer thickness, i.e., Ra < 1500 for vertical air layers, and Ra < 1200 for horizontal air layers, are confirmed by the calculations made in the current work. Therefore, the values determined in accordance with the Rayleigh–Bernard equation were between 1490 and 1498, depending on the different climate zones. Meanwhile, the Nusselt number was determined to be between 0.767–0.809 in the case of the vertical air layers, and between 0.803 and 0.845 in the case of the horizontal air layers.
In both cases (the vertical and horizontal air layers), the Rayleigh number set the boundary, which when exceeded, would lead to a significant increase in the conductive flux; the Nusselt number reached no more than 84.5% of the previously set Nusselt number (≤1.0), while the Rayleigh number reached 98.42% of the previously set Rayleigh number (≤1200).
In correlation with previous studies, the optimal thickness of the air layer was between 20.5 and 23.5 mm for the Romanian climate zones. However, the optimal thickness decreased once the temperature gradient between the interior and exterior temperature increased.
The temperatures of the unheated attic space were determined using a thermal balance calculation according to the exterior temperature of each climatic zone. Table 12 shows the optimal thickness of the air layers according to the insulation panels displaced on the upper slab. As expected, due to a higher exterior temperature of the attic space, the optimal thicknesses of the horizontal air layers were larger than the thicknesses of the vertical layers.
If the air layer was smaller than the indicated values in Table 11, the heat transferred by conduction would be higher; however, for larger thicknesses, the reduction in the total heat transfer would be negligible, due to the counterbalance between the lower conduction and the higher convection.

4. Discussion

The purpose of the study was to analyze under laboratory conditions the thermal properties of an experimental insulation system based on parallel air layers (ISPA) embodied in rockwool panels. The impact of its use on the energy demand and on harmful emissions was calculated via the comparison of the energy demand of a highly efficient energy building with the energy demands of the same building under the hypothesis that it is insulated with the experimental insulation system. Furthermore, the second important factor to consider was the variation in embedded emissions attributed to the insulation system.
Given the entire life cycle of school buildings (50 years), the experimental insulation system significantly reduced the total energy demand while keeping constant the embedded emissions of an already highly efficient insulation system.
In recent years, energy consumption in the building operation phase has been considerably reduced. The present study follows the current trend of reducing the environmental impact of the building industry by improving the thermal performance of the thermal envelopes [31,32,33,34,35,36,37,38]. However, the experimental insulation system not only significantly reduces the harmful emissions generated during the operation phase, but also maintains a relative constant level of generated emissions during the manufacturing stage.
The tendency to reduce harmful emissions by improving the thermal performance of building materials has been shown to reduce the embodied GWP of existing buildings [31,32,33,34,35,36,37,38]. This trend has also been followed by the air layer-based insulation system.
Based on theoretical knowledge [22,23,24,25,26] of air behavior as an insulating layer, optimal air thicknesses were determined for both vertical and horizontal orientations. The optimal air thickness was calculated and enhanced for each of the five climates of the country. The optimal thickness of the vertical layers was between 20.5 and 23.5 mm, and for horizontal layers, it was between 29.0 and 30.3 mm. Earlier studies identified an optimal thickness of between 20 and 30 mm, depending on the temperature difference between the indoor and outdoor environments. The results of the study underline that the optimal air layer thickness is indirectly proportional to the temperature gradient of the adjacent surfaces.
The test results show that, as expected, the combined thermal conductivity of the experimental system is slightly higher, due to the additional air layers, at 0.04196 W/(m∙K) compared to the thermal conductivity of solid rockwool, at 0.03907 W/(m∙K). However, the thermal properties of the experimental system were improved by approximately 27% because of the greater thickness caused by the additional air layers. Thus, the thermal resistance was improved from 3.839 to 5.243 m2∙K/W for the exterior walls, and from 6.399 to 8.817 m2∙K/W for the upper slab. Improvements in energy demand during the operation phase were achieved with similar embedded emissions. The difference between the solid rockwool contents of the two insulation systems was not greater than 0.66% (606.63 m3—EIS volume; 602.38 m3—ISPA volume).
The practical improvements of the study stand out when we compare the experimental insulation system with a standard insulation system of a high school building built to passive standards. When comparing the two systems, energy consumption during the operation stage is reduced from 81,725 kWh/year to 73,675 kWh/year, along with an insignificant increase in embedded emissions that are attributed to insulation material.
The improved thermal insulating performance of the experimental system led to a reduction in energy demand, which results in emission savings of approximately 9.82% for each operating year. To conclude, the environmental effects of the thermal insulation system with parallel air layers had a positive effect on the final emissions caused by the construction industry, both during the construction and during the operation life stages.
Taken together, the first results are promising, but there is still work to be done to study the actual size of the insulation panels with air layers under laboratory conditions. Another important issue to investigate is the influence of air layers on air tightness, the thermal bridge effect, and additional emissions generated by a more complex manufacturing phase. Another aspect to consider is the negative impact of the new insulation system on the total thickness of the envelope, and therefore, on the landfill.

5. Conclusions

Following recent research tendencies [33,34,35,36,37,38,39,40,41,42] on the reduction in embedded emissions contained in building materials, in this study, the thermal properties of an experimental insulation system based on parallel air layers embodied in rockwool panels were analyzed under laboratory conditions. The conclusions of the findings are as follows:
(1)
A significant positive correlation was found between the limits established by previous research using the Rayleigh equation and the thermal flux variation inside the air layers determined for the second climate zone of Romania. In other words, the optimum insulation thickness is reached when the Rayleigh number approaches but succeeds the 1200 limit for vertical air layers, and 1500 for horizontal air layers. These values overlap the minimum heat flow measured for the high school building, i.e., 0.0695 W/(m∙K) for the upper slab and 1.695 W/(m∙K) for the exterior walls.
(2)
As expected, the test results show a slightly higher combined thermal conductivity of the ISPA, compared to the existing insulation system, with approximately 6.9%, from 0.03907 W/(m∙K) to 0.04196 W/(m∙K).
(3)
The thermal resistance of the exterior walls is improved, from 3.839 to 5.243 (m2∙K)/W, and in the case of the upper slab, from 6.399 to 8.817 m2∙K/W. Improvements in thermal properties were achieved with similar insulation consumption; that is, 606.63 m3 in the case of the existing insulation system, and 602.38 m3 in the case of the experimental system. Consequently, the embedded CO2 emissions generated during the manufacturing stage are also similar; that is, 14,010.79 kgCO2eq for the existing insulation and 13,914.97 kgCO2eq for the experimental insulation system.
(4)
Compared to the standard rockwool-based insulation system of a high school building built to passive house standards, by using the insulation system based on parallel air layers, energy consumption is reduced by approximately 11%, from 81.725 kWh/year to 73.675 kWh/year.
(5)
The energy savings resulting from the use of the experimental insulation system are achieved with similar volumes and emissions of insulating material generated during the manufacturing stage. Taking into account the embedded emission of rockwool material, the experimental system generates approximately 0.69% less CO2. However, the more complex manufacturing process is expected to produce additional emissions.
(6)
The improvements in thermal performance are undeniable, but it should be remembered that the use of the new insulating system (with parallel air layers) requires an increase in insulation thicknesses of between 35 and 40%, compared to the standard insulation system.
The most important limitation lies in the fact that the additional emissions caused by the higher complexity level of the manufacturing method have been neglected. However, at this early stage of the investigation, the preliminary data show that energy demand is improved significantly during the operation phase. The considerable savings should cover the additional emissions caused by the manufacturing methods, and should significantly reduce the final environmental impact of the building.
Although the results of all early studies are promising, more research is needed to study real-sized insulation panels under laboratory conditions, and to quantify the influence of additional air layers on the thermal bridge effect. Other important aspects to investigate are the additional emissions generated during the manufacturing phase of the new insulation system, and the possibility of further reducing the radiation heat flux density, as it represents a significant percentage of the total heat flux.
Taken together, these results indicate that the environmental effects of the thermal insulation system with parallel air layers reduce the overall embedded emissions from the building industry.

Author Contributions

Conceptualization, R.C.E. and S.B.; methodology, R.C.E. and S.B.; software, R.C.E.; validation, I.B., R.C.E., S.B. and D.D.; formal analysis, R.C.E. and I.B.; investigation, R.C.; resources, I.B., R.C. and D.D.; data curation, R.C.E.; writing—original draft preparation, R.C.E. and S.B.; writing—review and editing, R.C.E., S.B. and D.D; visualization, S.B.; supervision, D.D.; project administration, D.D.; funding acquisition, R.C.E. and D.D. All authors have read and agreed to the published version of the manuscript.

Funding

This research was funded by a grant of the Romanian Ministry of Research, Innovation and Digitalization, project number PFE 26/30.12.2021, PERFORM-CDI@UPT100—The increasing of the performance of the Polytechnic University of Timișoara by strengthening the research, development and technological transfer capacity in the field of “Energy, Environment and Climate Change” at the beginning of the second century of its existence, within Program 1—Development of the national system of Research and Development, Subprogram 1.2—Institutional Performance—Institutional Development Projects—Excellence Funding Projects in RDI, PNCDI III.

Institutional Review Board Statement

Not applicable.

Conflicts of Interest

The authors declare no conflict of interest.

References

  1. Roman, K. Carbon footprint of thermal insulation materials in building. Energy Effic. 2017, 10, 1511–1528. [Google Scholar]
  2. Muhammad, M.; Muzaffar, A.; Hassan, R. Assessment of embodied energy and environmental impact of sustainable building materials and technologies for residential sector. Eng. Proc. 2021, 12, 62. [Google Scholar]
  3. Friederike, S.; Johannes, G.; René, T.; Stefan, A.; Philip, L. LCA of buildings in Germany: Proposal for a future benchmark based on existing databases. Energy Build. 2019, 194, 342–350. [Google Scholar]
  4. Mateja, D.; Jernej, M.; Roman, K. Embodied global warming potential of different thermal insulation materials for industrial products. J. Eng. Appl. Sci. 2018, 13, 2242–2249. [Google Scholar]
  5. Galan-Marin, C.; Rivera-Gomez, C.; Garcia-Martinez, A. Use of natural-fiber bio-composites in construction versus traditional solutions: Operational and embodied energy assessment. Materials 2016, 9, 465. [Google Scholar] [CrossRef]
  6. Ministerul Dezvoltării Regionale și Administrației Publice. Methodology for Calculating the Thermal Performances of Buildings. Mc001/2006. Available online: https://aaecr.ro/wp-content/uploads/2020/01/Metodologie-de-calcul.pdf (accessed on 14 June 2022).
  7. Ministerul Dezvoltării Regionale și Administrației Publice. Order 2641/2017 Concerning the Modification and Addition of the Methodology for Calculation for Calculating of the Thermal Performances of Buildings, Mc001/2006, Aproved by Order of the Minister no. 157/2007. Available online: https://aaecr.ro/wp-content/uploads/2017/04/normele-privind-calculul-performantei-energetice-a-cladirilor.pdf (accessed on 14 June 2022).
  8. Ministerul Dezvoltării Regionale și Administrației Publice. The National Methodology According to the European Standards Including nZEB Buildings. Available online: https://oer.ro/wp-content/uploads/3.-REHVA-OAER-C%c4%83t%c4%83lin-LUNGU.pdf (accessed on 14 June 2022).
  9. Ene, R.C.; Brata, S.; Boros, I.; Dan, D. Effect of inserted parallel air chambers in rockwool and polystyren insulation panels. J. Environ. Prot. Ecol. 2020, 21, 202–210. [Google Scholar]
  10. Al-Hazmy, M.M. Analysis of coupled natural convection–conduction effects on the heat transport through hollow building blocks. Energy Build. 2006, 38, 515–521. [Google Scholar] [CrossRef]
  11. Boukendil, M.; Abdelbaki, A.; Zrikem, Z. Detailed numerical simulation of coupled heat transfer by conduction, natural convection and radiation through double honeycomb walls. Build. Simul. 2012, 5, 337–344. [Google Scholar] [CrossRef]
  12. Arıcı, M.; Karabay, H. Determination of optimum thickness of double-glazed windows for the climatic regions of Turkey. Energy Build. 2010, 42, 1773–1778. [Google Scholar] [CrossRef]
  13. Arıcı, M.; Karabay, H.; Kan, M. Flow and heat transfer in double, triple and quadruple pane windows. Energy Build. 2015, 86, 394–402. [Google Scholar] [CrossRef]
  14. Sun, W.; Ji, J.; Luo, C.; He, W. Performance of PV-Trombe wall in winter correlated with south façade design. Appl. Energy 2011, 88, 224–231. [Google Scholar] [CrossRef]
  15. Hu, Z.; He, W.; Ji, J.; Hu, D.; Lv, S.; Chen, H.; Shen, Z. Comparative study on the annual performance of three types of building integrated photovoltaic (BIPV) Trombe wall system. Appl. Energy 2017, 194, 81–93. [Google Scholar] [CrossRef]
  16. Suárez-López, M.J.; Blanco-Marigorta, A.M.; Gutiérrez-Trashorras, A.J.; Pistono-Favero, J.; Blanco-Marigorta, E. Numerical simulation and exergetic analysis of building ventilation solar chimneys. Energy Convers. Manag. 2015, 96, 1–11. [Google Scholar] [CrossRef]
  17. Harris, D.J.; Helwig, N. Solar chimney and building ventilation. Appl. Energy 2007, 84, 135–146. [Google Scholar] [CrossRef]
  18. Peng, J.; Curcija, D.C.; Lu, L.; Selkowitz, S.E.; Yang, H.; Zhang, W. Numerical investigation of the energy saving potential of a semi-transparent photovoltaic double-skin facade in a cool-summer Mediterranean climate. Appl. Energy 2016, 165, 345–356. [Google Scholar] [CrossRef]
  19. Han, J.; Lu, L.; Yang, H. Numerical evaluation of the mixed convective heat transfer in a double-pane window integrated with see-through a-Si PV cells with low-e coatings. Appl. Energy 2010, 87, 3431–3437. [Google Scholar] [CrossRef]
  20. Wang, M.; Peng, J.; Li, N.; Yang, H.; Wang, C.; Li, X.; Lu, T. Comparison of energy performance between PV double skin facades and PV insulating glass units. Appl. Energy 2017, 194, 148–160. [Google Scholar] [CrossRef]
  21. Cheng, Y.; Gao, M.; Dong, J.; Jia, J.; Zhao, X.; Li, G. Investigation on the daylight and overall energy performance of semi-transparent photovoltaic facades in cold climatic regions of China. Appl. Energy 2018, 232, 517–526. [Google Scholar] [CrossRef]
  22. Zhang, T.; Tan, Y.; Yang, H.; Zhang, X. The application of air layers in building envelopes: A review. Appl. Energy 2016, 165, 707–734. [Google Scholar] [CrossRef]
  23. Juanicó, L.E.; González, A.D. Thermal insulators with multiple air gaps: Performance, cost and embodied impacts. J. Build. Eng. 2017, 12, 188–195. [Google Scholar] [CrossRef]
  24. Zhang, T.; Yang, H. Heat transfer pattern judgment and thermal performance enhancement of insulation air layers in building envelopes. Appl. Energy 2019, 250, 834–845. [Google Scholar] [CrossRef]
  25. Juanico, L.E. Thermal insulation of roofs by using multiple air gaps separated by insulating layers of low infrared emissivity. Constr. Build. Mater. 2020, 230, 116931. [Google Scholar] [CrossRef]
  26. Zhang, T.; Yang, H. Optimal thickness determination of insulating air layers in building envelopes. Energy Procedia 2018, 152, 444–449. [Google Scholar] [CrossRef]
  27. Building Physics. Available online: https://www.lambda-messtechnik.de/en/thermal-conductivity-test-tool-ep500e/lambda-meter-ep500-characteristics (accessed on 2 February 2020).
  28. European Committee for Standardization (CEN). EN13162. Thermal Insulation Products for Buildings—Factory-Made Mineral Wool (MW) Products. Available online: https://www.en-standard.eu/bs-en-13162-2012-a1-2015-thermal-insulation-products-for-buildings-factory-made-mineral-wool-mw-products-specification/?gclid=CjwKCAjwqauVBhBGEiwAXOepkZeYAELORVN8YHALj9EDZQy9bM4hPQAY4EBL88qJc8N6vcqrmN19DxoC7m4QAvD_BwE (accessed on 14 June 2022).
  29. WUFI, Frauenhofer IBP. Available online: https://wufi.de/en/software/what-is-wufi/ (accessed on 15 February 2020).
  30. Test Tool ep500e. Available online: http://www.lambda-messtechnik.de/en/thermal-conductivity-test-tool-ep500e/lambda-meter-ep500-characteristics.html (accessed on 15 February 2020).
  31. Boros, I.; Nagy-György, T.; Dan, D. Energy efficient school building concept and constructive solutions. Int. Rev. Appl. Sci. Eng. 2015, 6, 101–110. [Google Scholar] [CrossRef] [Green Version]
  32. Brata, S.; Ene, R.C.; Dan, D.; Boros, I. Life Cycle Assessment, an Integrated Vision to Energy Efficiency in the Building Industry. In Book Environmental and Human Impact of Buildings; Moga, L., Șoimoșan, T.M., Eds.; Springer Tracts in Civil Engineering; Springer: Berlin/Heidelberg, Germany, 2021; pp. 313–340. [Google Scholar]
  33. Parlamentul României. Legea 372/2005—National Regulation on Energy Efficiency in the Construction Industry. Available online: https://legislatie.just.ro/Public/DetaliiDocument/66970 (accessed on 14 June 2022).
  34. Directive EC 91/2002 of the European Parliament and of the Council Adopted on 16.12.2002 on the Energy Performance of Buildings. Available online: https://eur-lex.europa.eu/LexUriServ/LexUriServ.do?uri=OJ:L:2003:001:0065:0071:EN:PDF (accessed on 14 June 2022).
  35. European Environmental Agency. Overview of Electricity Production and Use in Europe. Available online: https://www.eea.europa.eu/data-and-maps/indicators/overview-of-the-electricity-production-2/assessment-4 (accessed on 1 February 2020).
  36. Azari, R.; Abbasabadi, N. Embodied energy of buildings: A review of data, methods, challenges, and research trends. Energy Build. 2018, 168, 225–235. [Google Scholar] [CrossRef]
  37. Dixit, M.K.; Culp, C.H.; Fernández-Solís, J.L. System boundary for embodied energy in buildings: A conceptual model for definition. Renew. Sustain. Energy Rev. 2013, 21, 153–164. [Google Scholar] [CrossRef]
  38. Owerczuk, J. Towards Modern Technology and Traditional Form—Evolution of the Form of Energy-Efficient Houses in Poland over the Last Decades. Multidiscip. Digit. Publ. Inst. Proc. 2020, 51, 30. [Google Scholar]
  39. Kamara, J.M.; Heidrich, O.; Tafaro, V.E.; Maltese, S.; Dejaco, M.C.; Re Cecconi, F. Change Factors and the Adaptability of Buildings. Sustainability 2020, 12, 6585. [Google Scholar] [CrossRef]
  40. Musarat, M.A.; Alaloul, W.S.; Liew, M.S.; Maqsoom, A.; Qureshi, A.H. The Effect of Inflation Rate on CO2 Emission: A Framework for Malaysian Construction Industry. Sustainability 2021, 13, 1562. [Google Scholar] [CrossRef]
  41. Atanas Petrovski, A.; Pauwels, E.; González, A.G. Implementing Regenerative Design Principles: A Refurbishment Case Study of the First Regenerative Building in Spain. Sustainability 2021, 13, 2411. [Google Scholar] [CrossRef]
  42. Asociația de Standardizare din România. SR1907-2; Heatying Systems. Calculation of the Heating Demand. Indoor Calculation Temperatures. 2014. Available online: https://kupdf.net/download/sr-1907-2-2014_58a49bc86454a7120bb1e8fb_pdf (accessed on 14 June 2022).
Figure 1. Overview of the area and the high school building: (a) North and west facades; (b) South and west facades.
Sustainability 14 07425 g001
Figure 2. Ground floor Reprinted/adapted with permission from [9].
Sustainability 14 07425 g002
Figure 3. High school building facades.
Sustainability 14 07425 g003
Figure 4. Displacement of air layers within the insulation panel.
Sustainability 14 07425 g004
Figure 5. Rockwool with additional air layers during laboratory tests. (a) Front view; (b) Side view.
Sustainability 14 07425 g005
Figure 6. Temperature field of a test sample according to a λ-Meter EP500e. Reprinted/adapted with permission from Ref [27] 2020. www.lambda-messtechnik.de.
Sustainability 14 07425 g006
Figure 7. Preparation and testing of the rockwool probes: (a) Sample outline according to equivalent dimensions; (b) Sample cutting of equivalent air layers; (c) Overview of ISPA sample; (d) Test bench.
Sustainability 14 07425 g007
Figure 8. Variation in temperature through the cross-section elements of the envelope: (a) Upper slab, with the outer surface of the slab facing an unheated attic space; the ceramic tiles are presented only for a better graphic representation of the attic space; (b) Exterior wall.
Sustainability 14 07425 g008
Figure 9. Variation of the components of the heat flux density according to the exterior walls of the high school building.
Sustainability 14 07425 g009
Figure 10. Variation of the components of the heat flux density according to the upper slab toward the unheated attic space of the high school building.
Sustainability 14 07425 g010
Figure 11. The fluctuation of carbon dioxide emissions during the production of electric energy in Romania Reprinted/adapted with permission from [32].
Sustainability 14 07425 g011
Figure 12. Variation of the heat flux nature according to the thickness of vertical air layers in accordance. Reprinted/adapted with permission from [23].
Sustainability 14 07425 g012
Figure 13. Variation of the Rayleigh number according to the thickness of vertical air layers in accordance with Romanian climate zones.
Sustainability 14 07425 g013
Figure 14. Variation of the Rayleigh number according to the thickness of horizontal air layers in accordance with Romanian climate zones.
Sustainability 14 07425 g014
Table 1. Thermal transmittances of envelope elements according to national technical regulations.
Envelope ElementMc001/2006Order 2641/2017National Methodology (Including nZEB 1)
Thermal Transmittance U′max, W/(m2∙K)
Exterior walls0.800.570.33
Upper slab0.340.220.17
Slab on the ground0.950.400.20
Glazing2.561.451.10
Ground facing walls0.910.710.29
1 Nearly zero energy building.
Table 2. Interior temperatures of school buildings in Romania [9].
Room DestinationInterior Design Temperature
°C
Classroom18.0
Offices20.0
Laboratories18.0
Libraries, reading rooms20.0
Halls, corridors, stairwells18.0
Wind fang12.0
Toilets15.0
Medical offices22.0
Cafeteria18.0
Kitchen15.0
Car garage15.0
Table 3. Results measured according to laboratory tests.
Building MaterialMean Thermal Conductivity λ, W/(m∙K)
W/(m∙K)
Solid rockwool panel (d = 100 mm)0.03907
Rockwool panel with air layers (d ≤ 25 mm)0.04196
Table 4. Rockwool volume and thermal properties of insulation placed on the exterior walls and on the upper slab.
Insulation SystemLayerdins
(mm)
Volume per Unit Envelope Area (cm3/m2)R (m2∙K/W)
DescriptionAmounts in Cross-Section
Exterior walls
EIS (150 mm)solid11500.2083.839
ISPA
(235 mm)
solid layers6200.1675.243
supporting frame5230.040
Upper slab
EIS (250 mm)solid12500.3476.399
ISPA
(586.5 mm)
solid layers12200.3338.817
supporting frame1131.00.012
Table 5. Temperature within the envelope elements—high school building.
Climate ZoneEnvelope ElementLayerAir Layer Thickness, mm
20253035
IIExterior wallsAir layer0.991.051.09-
Rockwool2.592.612.56-
Upper slabAir layer-0.740.800.80
Rockwool-1.331.381.27
Table 6. Emissions generated according to rockwool manufacturing.
Envelope ElementAssessment UnitEISISPA
-Density of Solid Insulation Material (kg/m3)22
-Rockwool GWP (kg CO2eq/kg)(kgCO2eq/kg)1.05
Outer wallsVolume per unit envelope area(cm3/m2)0.2080.2074
Insulated aream21453
Insulation volumem3302.71300.19
Weight of the insulation systemkg6659.586604.09
Embedded CO2 emissionskgCO2eq6992.566934.29
Upper slabEmbedded CO2 emissionskgCO2eq0.3470.345
Surface areacm3/m2875
Insulation volumem3303.82302.19
Weight of the insulation systemkg6684.036648.27
Embedded CO2 emissionskgCO2eq7018.236980.68
Table 7. Emissions generated during the operation phase.
Generated Emissions during Operation Phase
Type of InsulationEISEISISPA
Determination TypeReal Time MeasurementTheoretically Determined
Energy consumptionkWh/m2∙year21.2423.3521.05
kWh/year74,340.0081,725.0073,675.00
CO2 emissionskgCO2eq/m2∙year6.296.916.22
kgCO2eq/year22,007.0024,193.3021,793.00
Table 8. Total energy consumption.
UnitReal-Time MeasurementsEstimated Increase Value
Total energy consumption, kWh/(m2∙year)74,340.00107,940.00
Embedded emissions during the operating stage, (kg CO2eq)/ m2∙year78,057.00113,337.00
Area, m23500.003500.00
Annual consumption, kWh/(m2∙year)21.2430.84
Annual consumption of the kitchen—electric energy, kWh/(m2∙year)3.263.51
Monthly consumption of the kitchen—gas consumption, m3/month118.00120.20
Yearly consumption of the kitchen—gas consumption, kWh/(m2∙year)4.204.55
Accommodation rooms, kWh/(m2∙year)0 12.40
1 The zero value according to the real-time measurements of the accommodation rooms was due to the non-use of the rooms during the monitoring period.
Table 9. Temperature variation—exterior walls (°C).
LayerClimate ZoneAir Layer Thickness, mm
202530
Air layerI0.840.930.86
Rockwool2.422.342.42
Air layerII0.991.051.09
Rockwool2.592.612.56
Air layerIII1.020.861.17
Rockwool2.872.882.76
Air layerIV1.121.101.23
Rockwool3.153.123.04
Air layerV1.221.231.23
Rockwool2.923.473.44
Table 10. Temperature variation—upper slab (°C).
LayerClimate ZoneAir Layer Thickness, mm
253035
Air layerI0.780.800.80
Rockwool1.351.291.25
Air layerII0.740.800.80
Rockwool1.331.381.27
Air layerIII0.920.980.98
Rockwool1.481.471.42
Air layerIV0.941.011.00
Rockwool1.621.601.55
Air layerV0.951.011.01
Rockwool1.731.721.67
Table 11. Optimal thickness according to different Romanian climate zones in the case of vertical air layers.
Exterior Walls
Climate ZoneTemperature [°C]Nu
-
Ra
-
Optimal Thickness mm
Exterior (Te)Interior (Ti)
I−12.018.40.809149823.5
II−15.018.40.798148223.0
III−18.018.40.789149822.0
IV−21.018.40.787149221.5
V−25.018.40.767149020.5
Table 12. Optimal thickness according to the Romanian climate zones in the case of horizontal air layers.
Upper Slab
Climate ZoneTemperature [°C]Nu
-
Ra
-
Optimal Thickness
mm
Exterior (Te)Unheated Attic (Tattc)Interior (Ti)
I−12.0−6.818.40.845119630.3
II−15.0−7.218.40.826118730.0
III−18.0−10.618.40.821119529.8
IV−21.0−12.518.40.813119629.5
V−25.0−15.118.40.803118129.0
Publisher’s Note: MDPI stays neutral with regard to jurisdictional claims in published maps and institutional affiliations.

