Article

Beyond Traditional Energy Sector Coupling: Conserving and Efficient Use of Local Resources

Energy Economy Group (EEG), Technische Universität Wien, Gusshausstraße 25-29, E370-3, 1040 Vienna, Austria
*
Author to whom correspondence should be addressed.
Sustainability 2022, 14(12), 7445; https://doi.org/10.3390/su14127445
Submission received: 11 April 2022 / Revised: 31 May 2022 / Accepted: 15 June 2022 / Published: 17 June 2022
(This article belongs to the Topic Distributed Energy Systems and Resources)

Abstract

:
Decentralisation and sector coupling are becoming increasingly crucial for the decarbonisation of the energy system. Resources such as waste and water have high energy recovery potential and are required as inputs for various conversion technologies; however, waste and water have not yet been considered in sector coupling approaches but only in separate examinations. In this work, an open-source sector coupling optimisation model considering all of these resources and their utilisation is developed and applied in a test-bed in an Israeli city. Our investigations include an impact assessment of energy recovery and resource utilisation in the transition to a hydrogen economy, with regard to the inclusion of greywater and consideration of emissions. Additionally, sensitivity analyses are performed in order to assess the complexity level of energy recovery. The results demonstrate that waste and water energy recovery can provide high contributions to energy generation. Furthermore, greywater use can be vital to cover the water demands in scarcity periods, thus saving potable water and enabling the use of technology. Regarding the transition to hydrogen technologies, resource energy recovery and management have an even higher effect than in the original setup. However, without appropriate resource management, a reduction in emissions cannot be achieved. Furthermore, the sensitivity analyses indicate the existence of complex relationships between energy recovery technologies and other energy system operations.

1. Introduction

The increasing trend towards decentralisation in energy systems requires additional generation technology options due to the lower-rated power of decentralised generation units. Many resources used in everyday life are associated with high energy recovery potential. In particular, waste and water treatment may have an impact on the operations of energy systems. Resource treatment of waste and water can be considered in sector coupling applications, but resource use should not lead to a negative impact on the environment. To achieve the sustainability and efficiency of resource utilisation in energy systems, the sustainable development goals of the United Nations are leading guidelines to be considered [1]. Of these 17 goals, the goals of sustainable water management, energy availability, and sustainable consumption and production patterns are the most important for achieving sustainability in the whole resource extraction and utilisation process. By considering these aspects, sustainable resource treatment and implementation in the entire energy system can help to reach the goals of the Paris Climate Agreement [2] in order to reduce global CO2 emissions.
Sector coupling is seen as a critical action for sustainability in energy systems by reducing emissions in sectors that are more difficult to decarbonise. Sustainability can be achieved by decreasing the amount of wasted energy and resources in technological operations and through resource utilisation. Such reductions are expected to lead to an overall increased energy system efficiency [3]. Waste contributions to other energy sectors include incineration for electricity and heat generation, as well as anaerobic digestion for biogas generation [4]; however, the waste must be collected and processed for efficient use. The inclusion of water into the energy system can be considered from multiple perspectives. For many electricity generation processes, water is required as an additional input; for example, hydro power plants, cooling in thermal power plants, and electrolysis are processes requiring water. Furthermore, electricity is needed for water treatment processes, such as in sewage treatment plants [5]. In addition, energy can be recovered from water treatment processes, for example, through the further processing of sewage sludge by combustion and anaerobic digestion [6]. The recovery of water from sewage is another important aspect from the perspective of resource sustainability.
To investigate the energy recovery potential of waste and water, a case study considering the inclusion of resource utilisation in the energy system was carried out. Therefore, a test-bed in a small city in Israel was set up, where waste and water conversion technologies are implemented. This test-bed considers the resource supply and an energy demand in the city. Previously mentioned decentralised energy recovery technologies for waste and water were implemented in the test-bed. Emphasis is also placed on the interactions of waste and water with other decentralised energy systems conversion technologies, such as power-to-heat or gas conversion technologies. In an extension of the test-bed, the impact of resource utilisation in the same city due to the transition from gas to hydrogen is investigated. However, the overall goal of the case study is sustainable resource utilisation and treatment. For the investigations in the test-bed, a linear optimisation model for the considered energy system is set up, in which conversion and energy recovery technologies for waste and water are implemented. Technologies requiring additional water input are modelled accordingly. By performing this optimisation, the optimal operations in the energy system, considering efficient resource utilisation, can be determined.
The core objective of this paper is to investigate the energy recovery potential and resource utilisation of waste and water in the energy system. In this context, we mainly focus on the energy system technological operations and on the impact of energy recovery on these operations. Water is considered as a limited resource. Therefore, water scarcity investigations and greywater use are further core objectives. Furthermore, the impact of resource utilisation on CO2 emissions is examined. This results in the following research questions:
  • What are the energy recovery and resource utilisation potentials of waste and wastewater treatment in a holistically considered energy system, and how do they affect the operation of other energy system technologies?
  • What is the impact of water as a limited resource, and what benefits to energy system operations emerge through greywater use?
  • Which CO2 emissions are generated by the use of energy recovery technologies combined with conventional technologies, and can a transition to a hydrogen-based energy system lead to emission reductions?
All of our investigations were carried out in the defined test-bed, with additional consideration of the transition to a hydrogen economy.
The remainder of this paper is organized as follows: In Section 2, the state-of-the-art on the topic is presented. The method applied in the investigations is described in Section 3. Furthermore, the results regarding energy recovery potential, greywater use, and impact on CO2 emissions are presented in Section 4. Building upon this, the potential of and barriers to energy recovery and greywater use and the transition to a hydrogen economy are discussed in Section 5. The final conclusions of the investigations are presented in Section 6.

2. State-of-the-Art

To set up the test-bed appropriately, a review of the existing work on energy recovery in the literature was performed. Section 2.1 presents the existing work on resource recovery and utilisation, while Section 2.2 gives an overview of papers investigating greywater use. The state-of-the-art on sector coupling is presented in Section 2.3. Finally, Section 2.4 concludes the chapter with a presentation of the progress beyond the state-of-the-art.

2.1. Waste, Water Energy Recovery, and Resource Utilisation

Both waste and water have a high potential for energy recovery. Various investigations, such as Thormark [7], Moya et al. [8], and Giugliano et al. [9], have highlighted the potential of energy and material recovery from waste treatment. Dlamini et al. [10] and Milutinović et al. [11] described waste energy recovery processes, such as incineration and anaerobic digestion, as conversion technologies to prevent environmentally harmful land-filling. The results in Yi et al. [12] and Chen [13] have demonstrated that waste energy recovery may lead to increased CO2 emissions, while Yaman et al. [14] have outlined the potential for greenhouse gas reductions. Such contradictions highlight the complexity of energy recovery utilisation, and show that the implementation of waste and sludge energy recovery is dependent on the considered energy system. Regarding water energy recovery, sewage sludge, as a by-product of sewage treatment, has a similar energy recovery potential to waste, as the resource can be incinerated or digested into biogas, as has been investigated by Peccia and Westerhoff [15]. Hong et al. [16] have shown that sludge treatment could reduce the overall environmental impact of sludge, whereas Wang and Nakakubo [17] have found that the energy recovery options are dependent on the design of the sewage treatment system. Furthermore, Singh et al. [18] have found that sludge energy recovery has a positive impact on energy demand and land use. However, the moisture content of sludge can lower the efficiency of sludge energy recovery, as reported by Quan et al. [19]. It must be considered that, as with waste treatment, sewage and sludge treatment leads to CO2 emissions, as reported by Masuda et al. [20]. Not only can energy be recovered through sewage treatment, but also potable water, as has been mentioned by Verstraete et al. [21]. As waste and sludge energy recovery is a widely considered topic, different real-life case studies have been set up in various publications. Amulen et al. [22] have designed an energy recovery facility in Uganda, while Medina-Mijangos and Seguí-Amórtegui [23] have analysed the economic impact of an energy recovery facility in Spain. The investigations in the mentioned literature have emphasised the importance of considering waste and sewage treatment in energy system analyses.
For an efficient treatment of waste and water, preliminary resource management, considering concepts such as those of Kan [24], Vasanthi et al. [25], and Hasan et al. [26], are mandatory for resource utilisation. Waste management should focus on prevention and operation, including the treatment and disposal of resources, as reported by Tseng et al. [27]. Zhang et al. [28] have declared that future waste management developments should promote a transition from linear to circular management. However, according to Khan et al. [29], successful waste management implementations are associated with challenges such as the improvement of waste collection. According to Corsten et al. [30], waste management can contribute to CO2 emission reductions by implementing high-quality recycling and ensuring the energy efficiency of waste treatment processes. Water management concepts aim to treat water in all processes as a valuable and limited commodity. According to Sharafatmandrad and Mashizi [31], the overall goal of water management is a sustainable balance between demand and resource availability. The investigations of Willis et al. [32] and Zhang et al. [33] have highlighted the importance of water management and conservation to address critical water issues regarding scarcity and sustainability. Aivazidou [34] has introduced a potential water management framework, while Lee et al. [35] have emphasised that such frameworks are dependent on national water policies. However, not only energy recovery implementation but also resource utilisation must be considered in holistic energy system analyses.

2.2. Greywater Utilisation

The efficient resource utilisation of water can be achieved through the implementation of greywater, which is defined as wastewater from baths and laundries. Kitchen and toilet wastewater is excluded due to their higher contamination [36,37,38]. According to Sudarsan et al. [39], greywater is becoming increasingly important due to the depletion of natural water sources. Early concepts by Christova-Boal et al. [40] and Al-Jayyousi [41] in Australia and Jordan have identified greywater as an option for sustainable water use. The latter highlighted its potential in arid regions. A similar study has been carried out by Mandal et al. [42] in India, where greywater has emerged as a feasible solution to overcome scarcity problems. Furthermore, Knutsson and Knutsson [43] have developed a simulation model for water and energy-saving that underlined the importance of greywater implementation. However, Khajvand et al. [44] have found that greywater utilisation is dependent on the status of greywater within national frameworks. Due to increasing water scarcity in many countries in the world, Santasmasas et al. [45] have reported that potable water should only be used for purposes where the highest water quality is required. Couto et al. [46] have carried out a study in a Brazilian airport, where the use of greywater was sufficient to cover non-potable water demands, highlighting the potable water-saving potential. Furthermore, the studies of Ángel López Zavala et al. [47] and Zhang et al. [48] have described rainwater harvesting as an additional opportunity to generate greywater. However, this is associated with uncertainty, due to a dependence on statistical rainfall data. Furthermore, rainwater harvesting is less cost- and energy-effective than greywater recycling, as found by Stang et al. [49].
Greywater use has additional benefits besides water saving. A further benefit of greywater use is a load reduction at sewage treatment plants, as reported by Ahmad and EL-Dessouky [50]. However, Radingoana et al. [51] have also identified potential environmental and health risks if greywater is not used with caution. Anuja et al. [52] have reported that greywater utilisation is highly dependent on quality standards. A particular awareness of greywater as a resource is, therefore, required, as declared in the studies of Mourad et al. [53] and Soong et al. [54]. However, according to Cureau and Ghisi [55] and Al-Husseini et al. [56], greywater is still the most viable strategy for water-saving and reduction of potable water consumption.

2.3. Sector Coupling

To include waste and water energy recovery in the energy system, sector coupling concepts must be implemented. Much of the existing literature in the field already focuses on sector coupling, such as the study of Wietschel et al. [57], in which general perspectives of technology use in sector coupling have been investigated. Fridgen et al. [58] have described sector coupling as a purposeful interaction of energy sectors to increase the flexibility of energy demand and supply. Brauner [59] and Edtmayer et al. [60] have emphasised that a further advantage of sector coupling is the effect of peak load shaving. Moreover, sector coupling implementations require the interaction of many different sectors and conversion technologies for efficient operations, according to Mokhtara et al. [61] and Gea-Bermúdez et al. [62].
Resource utilisation and treatment play fundamental roles in sector coupling concepts. Waste can be integrated into the energy system in the form of energy recovery processes, such as incineration and anaerobic digestion [8,10,11]. The implementation of waste in sector coupling has a direct effect on energy infrastructure planning, as reported by Arnaudo et al. [63]. However, Puttachai et al. [64] have found that there is no consistent conclusion on the effect of waste-to-energy on other energy system operations yet. According to Ohnishi et al. [65], waste utilisation in the energy system is important for promoting the transition to low-carbon cities. For the affordable implementation of waste into sector coupling, the income from the output must be maximised, as stated by Thabit et al. [66]. Energy recovery from sewage treatment can also be integrated into sector coupling approaches. Schäfer et al. [67] have investigated the impact of sewage treatment plant inclusion, and concluded that the water sector should be included in sector coupling due to the energy recovery potential of sewage treatment. Furthermore, the energy demand of sewage treatment plants should be considered in this context, according to Mitsdoerffer [68]. Due to the variety of opportunities for sewage treatment implementation in sector coupling, Neugebauer et al. [69] have provided an overview of the energy recovery potentials of sewage treatment plants. According to Michailos et al. [70], the generated profits are dependent on the techno-economic environment. Wastewater can be coupled with the thermal energy supply, as stated by Lichtenwoehrer et al. [71]. Additional energy recovery from sewage treatment can be gained through sludge combustion and anaerobic digestion, as reported by Mills et al. [72]. Sayegh et al. [73] and Ni et al. [74] have identified further potential for heat recovery from sewage, while Sarkar et al. [75] and Hadad et al. [76] have found potential in using microturbines for sewage flow energy recovery. However, processes in other energy sectors require water as an additional input, which should also be considered in sector coupling, as reported by Nouri et al. [77].
To date, various sector coupling optimisation models have been developed, and some of them have been declared as open-source. Rinaldi et al. [78] have described the development of an open-source framework for the investigation of heat pumps and retrofitting impact. Certain developments, such as the models proposed in Bernath et al. [79] and Hörsch et al. [80], have a major focus on one sector and only partly consider the interaction with other sectors. Other models, such as that of Robinius et al. [81], put the major focus on sector interactions. With the open-source “Dieterpy” framework proposed in Gaete-Morales et al. [82], capacity expansion investigations for sector coupling can be performed. Hilpert et al. [83] have presented the open energy modelling framework “OEMOF”, which provides technological operation analyses in multiple energy sectors.

2.4. Novelties and Progress beyond the State-of-the-Art

Many works have investigated waste and water energy recovery potential in particular, but a combined investigation and inclusion into the energy system has not been examined yet. In energy systems with a large variety of considered energy and service sectors, the complexity of the impact of energy recovery on other energy system operations has not yet been addressed. Furthermore, at present, greywater utilisation in energy system investigations has not been widely addressed. To investigate the energy recovery potential of waste and water, as well as their impact on energy system operations, analyses using sector coupling models must be performed. Even though many existing open-source sector coupling models have already been developed, a model extension is needed to meet the analysis requirements.
The novelties and contributions beyond the state-of-the-art of this work can be summarised as follows:
(i)
Inclusion of both waste and water resource utilisation and energy recovery technologies into a multiple energy sector coupling approaches with additional consideration of CO2 emissions.
(ii)
Impact assessment of greywater use in sector coupling with particular analysis considering water scarcity periods.
(iii)
Comparison of waste and water energy recovery potential and greywater utilisation in gas- and hydrogen-based energy systems.
(iv)
Development of an open-source energy system model “RUTIS” (Resource Utilisation in Sector Coupling) [84] based on the modelling framework “OEMOF” [83], featuring an extension of the framework functionalities.
(v)
Identification of the relationship between energy recovery technologies, conventional conversion technologies, and external procurement in gas- and hydrogen-based energy systems.

3. Materials and Methods

For the elaboration of the research questions, a linear optimisation problem with the hourly resolution was set up. With this model, the flows between sectors are optimised based on minimum costs [84] (dispatch optimisation model). The model was implemented within the open modelling framework (OEMOF). This has proven to be the most suitable framework for the investigation, due the simple implementation of interactions between multiple sectors.

3.1. Investigation Setup

In order to address the research questions, a test-bed setup in a fictional city in Israel with a population of approximately 12,000 was investigated. Israel is a suitable country for the investigation of the research questions, as the decentralised energy generation in Israel is based, to a large extent, on gas [85]. As gas conversion technologies cause moderately high CO2 emissions, investigation of the energy recovery potential in Israel is crucial. Furthermore, Israel is one of the countries with the highest level of water scarcity in the world, making investigations regarding water scarcity in Israel of utmost importance [86,87]. Figure 1 presents the configuration of the use-case setup. The technologies considered in all investigations are highlighted in yellow, whereas technologies only considered in the investigations with decentralised gas technologies are highlighted in grey. In an additional impact analysis, considering the transition from gas technologies to hydrogen technologies was carried out. Hydrogen can be generated through the electrolysis and anaerobic digestion of waste and sludge. The technologies and sectors studied in this analysis are highlighted in green. For certain conversion technologies, the input is changed from natural gas to hydrogen. Gas blockheat generation plants are replaced by fuel cells. Furthermore, greywater is presented as an additional sector. As not all investigations consider greywater, the associated technologies are separately highlighted in blue.
The developed optimisation model was applied to the setup in Figure 1, in order to evaluate the optimum flows between the sectors.

3.2. Energy Recovery Optimisation Model

With the model, it was possible to determine the contribution of resource treatment energy recovery to the overall inputs of the considered sectors. This was performed by evaluating the flows between the sectors through minimum costs using a dispatch optimisation. To analyse the energy recovery potential in the Israeli city, the model was applied to the setup in Figure 1. In the setup, decentralised generation and energy recovery from resource treatment were prioritised over external purchases. The latter were implemented to cover the remaining demand. To consider renewable electricity generation in Israel from photovoltaics (PV), a share of 30% of the decentralised generation was assumed to come from PV, and the remaining 70% was covered by decentralised gas conversion technologies [85].

3.2.1. Workflow

The presentation of the workflow is fundamental to understanding the functionality of the model. All steps required to determine the optimum flows are presented in this section. For the mathematical description of the model, the variables determined in the optimisation are defined using lower-case letters and pre-defined parameters with capital letters.
In the first step, the considered energy and service sectors must be defined. To connect the sectors, conversion technologies are required. Additionally, storage is implemented. For each sector, input and output sets are defined, with conversion technology flows allocated to these sets.
s e t s e c t o r i n = x t e c h , 1 i n , x t e c h , 2 i n , , x t e c h , n i n ,
s e t s e c t o r o u t = x t e c h , 1 o u t , x t e c h , 2 o u t , , x t e c h , m o u t .
Sectors can also be interpreted as sets, where the gas sector is a set element in the general examinations and the hydrogen sector in special examinations. Greywater is a set element in corresponding investigations.
S e c t o r s = E l e c , H e a t , W a s t e , W a t e r , S e w a g e , S l u d g e , G a s , H 2 , G r e y w a t e r .
The allocations of the inputs and outputs of the conversion technologies are summarised in Table A1 (Appendix A). Sewage, sludge, and greywater sectors are assigned to the water sector. Storage, grid inputs, and demands are not considered in the table, as they are only allocated to a single sector. After the sectors and technologies are defined, the energy system is built up in the second step. This includes the conversion technology connections and the allocation of operational and purchase costs to technologies. After setting up the energy system, the optimisation is performed by cost minimisation. The results of the model are the dispatched flows between the sectors. An overview of the workflow is presented in Figure 2.

3.2.2. Objective Function

The objective of the optimisation model is to determine the manner of operation of the energy system components that leads to the least total costs. The costs consist of conversion, storage, technological operation and maintenance costs (O&M costs), as well as the costs associated with external energy purchases from grids. For grids, there exists a difference between the modelled costs and real incurred costs. The model costs are set at a relatively high level compared to the technology O&M costs. By using high model costs, the decentralised technologies are prioritised in the optimisation process. The real costs must be defined in order to be able to reflect reality in the results. For evaluation of the incurred costs, real costs, in the form of procurement costs, are considered.
Conversion technologies can be summarised in sets, where each element has assigned O&M costs. The inputs and outputs of technologies are considered as sets, as some have multiple inputs or outputs. Furthermore, specific costs are assigned to each input and output. If no costs are incurred, the specific costs are set to zero.
T e c h n o l o g i e s = P o w e r 2 h e a t , B a t t e r y , B o i l e r , ,
c i , t O & M = I n p u t s C i , t i n · x i i n + O u t p u t s C i , t o u t · x i o u t i T e c h n o l o g i e s .
The sources can equivalently be summarised as sets:
S o u r c e s = E l e c t r i c i t y g r i d , G a s g r i d ,
c j , t p u r c h a s e = C j , t p u r c h a s e · x j , t p u r c h a s e j S o u r c e s .
The objective function minimises the sum of technological O&M ( C t e c h n o l o g y O & M ) and external purchase costs ( C s o u r c e p u r c h a s e ), which are incorporated into the total costs ( C t o t a l ) (see Equation (8)). Total costs are considered for the whole period T.
m i n ( c t o t a l ) = m i n t = 1 T ( i T e c h n o l o g i e s C i , t O & M + j S o u r c e s C j , t p u r c h a s e ) .

3.2.3. Constraints

The cost minimisation is limited by model constraints. Due to the use of technology in the energy system, technological processing limitations are considered. The maximum energy that can be processed in each time step Δ t is limited by the maximum power ( P i m a x ) of the technology. Similar limitations arise for maximum processed masses ( V i m a x ) and volumes ( M i m a x ), with maximum flows per time unit. The constraints are described in Equations (9)–(11).
q i , t Δ t P i m a x i T e c h n o l o g i e s , t T ,
v i , t Δ t V i m a x Δ t i T e c h n o l o g i e s , t T ,
m i , t Δ t M i m a x Δ t i T e c h n o l o g i e s , t T .
As storage is considered in the model, storage equations are also implemented as model constraints. Some storages, such as waste, are only emptied in certain time steps. For these technologies, disposal periods ( T d i s p o s a l ) are defined. Such disposal periods are combined together into a set ( P e r i o d d i s p o s a l ), with a number of elements equal to the disposal actions in the total time steps T. For all other time steps, no storage output is possible.
P e r i o d d i s p o s a l = T 1 d i s p o s a l , T 2 d i s p o s a l , , T d d i s p o s a l .
Each set element is calculated using the following equation.
T d d i s p o s a l = T d · T i n t e r v a l d i s p o s a l .
The state of charge ( S O C ) for the storage equations is calculated using the S O C of the previous time step; the charge, discharge, and standby efficiencies ( η ); and the input and output decision variables. In the first time step, an initial value for the S O C is set.
s o c t = η s b · s o c t 1 + η i n · x t i n x t o u t η o u t ,
s o c t = 0 = S O C s t a r t ,
s o c t = 0 t P e r i o d d i s p o s a l ,
x t o u t = 0 t P e r i o d d i s p o s a l .
Furthermore, the conversion equations for each technology are implemented as model constraints through the technology conversion factor ( F c o n v e r s i o n ) in Equation (18). Depending on the technology, the conversion factor may also be time-dependent.
x i , t o u t = F i , t c o n v e r s i o n · x i , t i n i T e c h n o l o g i e s .
Some conversion technologies have additional required inputs from other sectors that are dependent on the primary input (Equation (19)). Electrolysis, for example, requires water in a manner depending on the electricity input in order to generate hydrogen. Such relationships are implemented through additional constraints for technologies with at least two dependent inputs ( n i n p u t s t e c h n o l o g y ).
x i , t r e s o u r c e = F i , t r e s o u r c e · x i , t i n i T e c h n o l o g i e s , n I n p u t s t e c h n o l o g y 2 .
Finally, a balance rule for all sectors, equating the inputs and outputs of sectors, is implemented. The sets in Equations (1) and (2), in addition to the sector set in Equation (3), are considered in this constraint.
k s e t k i n x k , t = l s e t k o u t x l , t k S e c t o r s .

3.3. Water Scarcity

To investigate the impact of water scarcity in Israel, additional constraints are added to the model. The main focus here is to analyse the impact of water scarcity on technology use and the opportunities emerging through greywater utilisation. In all scarcity investigations, the sector set in Equation (3) includes the greywater sector. For the setup in Figure 1, a total water demand D t w a t e r is given as a parameter at each time step. The water demand can be covered by either potable water from the water sector ( d t p o t a b l e w a t e r ) or greywater from the greywater sector ( d t g r e y w a t e r ). Both coverage options are implemented as variables, which are determined in the optimisation process. The demand coverage is added to the model as an additional constraint.
D t w a t e r = d t p o t a b l e w a t e r + d t g r e y w a t e r .
The share of the water demand that can be covered by greywater is limited. A limitation for S h a r e g r e y w a t e r of 50% is assumed, based on the greywater re-use potential presented by Christova-Boal et al. [40].
d t g r e y w a t e r S h a r e g r e y w a t e r · D t w a t e r .
For the potable water share, no limitations are assumed. This means that the potable water coverage for the demand ranges between 50% and 100%. The water scarcity constraint is implemented through the consideration of time-dependent scarcity factors F t s c a r c i t y . Potable water used for the demand coverage and for electrolysis are limited by these scarcity factors.
d t p o t a b l e w a t e r + d t e l e c t r o l y s i s F t s c a r c i t y · D t w a t e r .
By evaluating the decision variables for potable water demand coverage and electrolysis, the impacts of water scarcity on technology use and greywater are examined. As mentioned above, Israel is a country with one of the highest water stress levels. The scarcity factors used in the model were based on previously reported data [86,87,88]. In the summer months, the scarcity factors are assigned the lowest values. By assuming after-effects from the summer, scarcity factors in autumn are lower than in the winter.

3.4. CO2 Emissions

CO2 emissions are considered in two different ways. At first, the impact of the CO2 price on the dispatch of the flows was investigated. In a further analysis, the model was reconfigured to include an emissions minimisation objective function. This led to an alternative objective function, which served to minimise the emissions.

3.4.1. CO2 Price

Emissions are considered as additional outputs of some technologies. For the conversion technologies of the set in Equation (4), local emissions are considered; whereas, for the source emissions in Equation (6), pre-chain emissions in the generation and transmission steps are considered. To implement the CO2 emissions in the model, the set of sectors in Equation (3) was extended with a CO2 sector. Furthermore, the sets in Equations (1) and (2) were created for the CO2 sector. The balance rule of Equation (20) was also applied to the CO2 sector. However, the output flow set of the CO2 sector only consists of one variable e t t o t a l , in which all of the CO2 emission inputs are summed.
e t t o t a l = i s e t k i n e i , t k S e c t o r s , k = E m i s s i o n s .
The CO2 price is multiplied by the total emissions to obtain the total costs caused by the emissions:
c e m i s s i o n s = t = 1 T P C O 2 · e t t o t a l .
The emission costs are considered as additional costs in the objective function. Therefore, Equation (8) is extended using the emission costs in order to take into account the influence of emissions in the optimisation, resulting in the adapted objective function:
m i n ( c t o t a l , e x t e n d e d ) = m i n ( c t o t a l + c E m i s s i o n s ) .
To determine the impact of the CO2 price on the total emissions and the dispatch of the energy, mass, and volume flows, a sensitivity analysis of the CO2 price was conducted. The prices were set based on the data of [89,90,91]. For the basic investigations, a price variation from 30 €/tCO2 to 500 €/tCO2 was considered. As extreme values, prices of 800 €/tCO2 and 4000 €/tCO2 were additionally examined.

3.4.2. CO2 Emission Minimisation

Another option to consider CO2 emissions is to perform a CO2 minimisation approach with the optimisation model. Therefore, the objective function of the model must be altered to minimise emissions.
m i n ( e t o t a l ) = m i n t = 1 T ( i T e c h n o l o g i e s F i , t C O 2 · x i i n + j S o u r c e s F j , t C O 2 · x j o u t ) .
The minimum cost objective function in Equation (8), in combination with the cost evaluation in Equations (5) and (7), is similar to the minimum emission objective function in Equation (27). Therefore, only the costs in the original objective function were replaced with the emissions factors F C O 2 in the optimisation. Technologies without emissions were considered to have an emissions factor of zero and had no contribution to the objective function. For sources, real emissions factors and comparably high emissions factors for the promotion of local technologies were both investigated. Otherwise, no changes to the optimisation problem were required, and the other steps in the workflow were equivalent to the steps presented in Figure 2. The constraints in Section 3.2.3 remain valid for both objective functions. The goal of the emissions minimisation was to determine the impact of CO2 emissions on technology use.

3.5. Case Study Setup

A short introduction to the investigations performed with the model, with respect to the case study setup, is presented in this section. The execution of the examination was carried out in several steps. In the first step, the gas-based energy system in Figure 1 was set up using the “RUTIS” model. A major focus was placed on decentralised conversion technologies, which, in the first case study, consisted mainly of gas conversion and resource energy recovery technologies. All technologies, demands, and generation units in the setup were scaled and aggregated to the size of the considered city in Israel. In general, this setup represents the technology and resource utilisation in the city. In the second step, the energy recovery potential of resource treatment in the setup was assessed. The method presented in Section 3.2.1 was applied for this assessment. Additionally, the change in technology use without resource treatment energy recovery implementation was determined. Investigations of the CO2 emissions were further conducted in the second step. However, in the third step, the setup was extended with water scarcity constraints (see Section 3.3). In this step, the focus was placed on technologies requiring potable water as a resource. A further emphasis was placed on the change of technology use when scarcity constraints were applied. Furthermore, the impact of greywater on technology use is a significant aspect of the third step. While CO2 investigations were a part of all investigations conducted, they were the main focus of the fourth investigation. The impact of CO2 prices and the change in the energy system optimisation with respect to emissions minimisation were analysed in this step. As in the previous steps, the goal was to assess the change in technology use. In the fifth step, the setup in Figure 1 was altered to a hydrogen-based energy system. The same investigations as in the gas-based energy system (Steps 1–4) were conducted for the hydrogen-based system. Furthermore, both setups were compared regarding technology use and CO2 emissions. Finally, in the sixth step, sensitivity analyses of the disposed waste and sludge were carried out in both the gas- and hydrogen-based setups, with the goal of analysing the relationship between energy recovery technologies and the overall energy system operations. Based on this analysis, the inherent complexity of the processes was identified. In summary, the six steps in the case study allowed for the elaboration of the research questions.

3.6. Model Validation

For validation of the model, an energy system with all model functionalities and conversion technologies was set up for the operation of test scenarios. In these scenarios, the impact of the model configuration was tested. Technologies and energy sectors were removed from the energy system, and technological parameters such as costs were set to extreme values to force a specific model behaviour. The functionality of the model was then validated through the corresponding reactions of the model. A detailed description of the model validation process can be found in Appendix C.

4. Results

The results presented in this section include the results for energy recovery in Section 4.1, the impact of water scarcity in Section 4.2, CO2 emission investigations in Section 4.3, and the results regarding the transition to a hydrogen economy in Section 4.4. Finally, the relationships between energy recovery and other energy system operations are presented in Section 4.5.

4.1. Energy Recovery

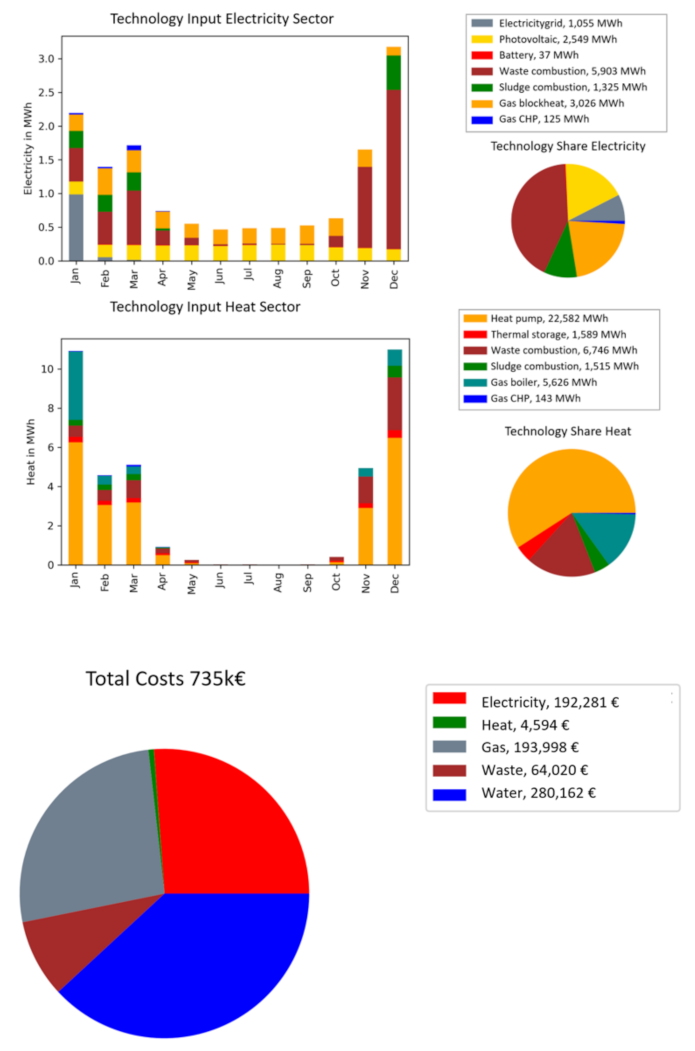
The main results for energy recovery from waste and water are described in this section. Waste and water have non-negligible energy recovery potential, as they can provide high contributions to electricity and heat generation. The results with empty waste and sludge storage at the beginning of the year, in addition to the total costs, can be seen in Figure 3.
The contribution of waste combustion to electricity generation was 5903 MWh, and the contribution of sludge combustion was 1325 MWh. Together, waste and sludge combustion can cover about 52% of the electricity generation. For the heat sector, the total contribution was 8261 MWh (22%). Gas, which is used at 22% for electricity and 15% for heat, can be covered by 79% through anaerobic sludge digestion. The total waste is further treated for energy recovery, and less than 1% of the sludge resources are disposed of without further restrictions. Regarding the costs, electricity and gas costs mainly emerged through grid purchasing, with costs between 158 and 193 kEUR. Technological O&M costs were low compared to grid procurement costs. The cost-intensive processing of sewage sludge is a special case, with costs of 170 k€. However, as its disposal without recovery of energy would also cause costs, sludge treatment is still the most efficient option. The overall costs of the gas-based setup for one year were 735 k€.
For the efficient use of resources, the adaption of resource treatment to demand profiles is necessary. By changing the planning horizon of waste treatment, with the storage being half full at the beginning of the year, the contribution of waste combustion to electricity could be slightly increased, and the total costs were decreased by over 100 k€. Therefore, long-term treatment planning can lead to higher efficiencies. Another important aspect is efficient resource processing. If the waste storage disposal periods are set too low, the waste cannot be treated when the recovered energy is needed; however, if no waste and water energy recovery potential are considered at all, the electricity purchased from the grid rose to 10,178 MWh (80%), and all gas had to be purchased from the grid. This resulted in a total cost increase to 3.8 Mio €, due to increased grid purchase and high waste and sludge disposal costs. The impact of non-usable waste on the energy contributions and on the CO2 emissions can be seen in Figure 4. For this investigation, a constraint imposing a minimum disposed waste amount was added, and a CO2 price of 30 €/tCO2 was considered.
Until 20% of waste is disposed of, the contribution of gas technology to electricity significantly increased. From this share on, sludge must be saved for winter, and less was incinerated. However, the gas grid purchase decreased at first due to the increasing anaerobic digestion of sludge. At higher shares, decentralised gas technologies could not cover the electricity demand in the city, and electricity had to be procured from the grid (i.e., central power plants). As with the previous results, the total costs increased with increasingly disposed waste. The right figure shows that emissions increased with higher disposed waste and rose even more when grids were increasingly needed.

4.2. Water Scarcity

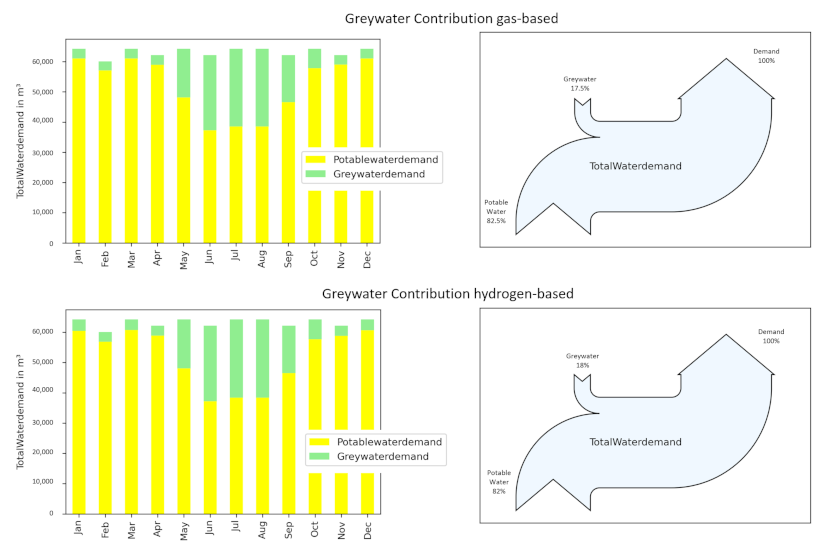
The water scarcity results, based on the assumptions in Section 3.3, are presented for the hydrogen-based setup. Without electrolysis, greywater was only used to cover the demand in scarcity periods. Over the whole year, the contribution of greywater to the total water demand was about 18%. When the hydrogen economy scenario was considered (green in Figure 1), an impact on the technology use of electrolysis also emerged due to Equation (23). Table 1 shows the impact of scarcity on greywater and electrolysis use.
It can be seen that greywater was implemented to cover the water demand in scarcity periods and to provide water for electrolysis. With other economically feasible hydrogen generation technologies, electrolysis was reduced in scarcity periods; however, with few available technologies, electrolysis must be enabled in the energy system, even in scarcity periods. Additional conversion technologies for hydrogen, apart from electrolysis, must, therefore, be provided in hydrogen-based energy systems.

4.3. CO2 Emissions

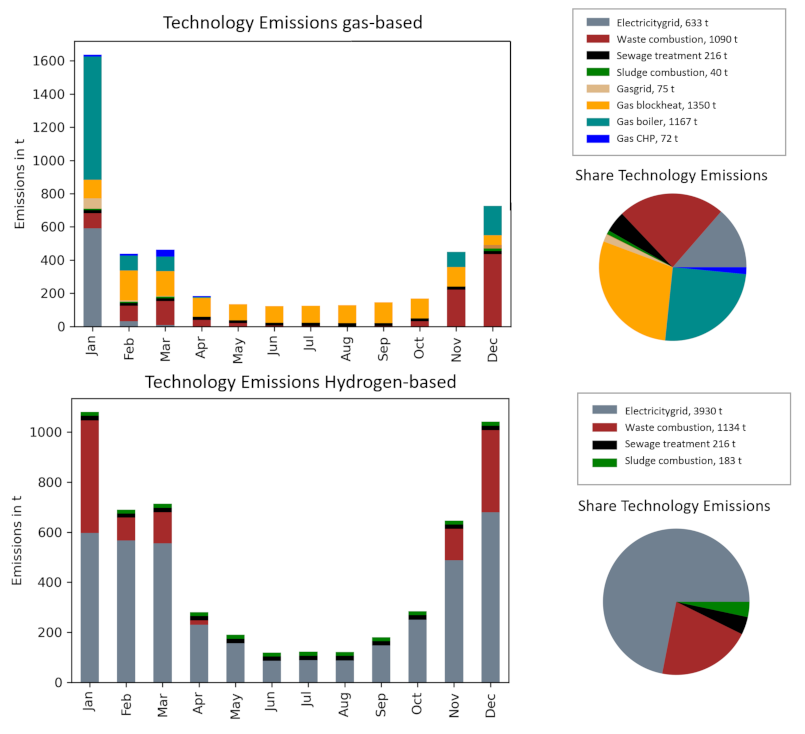
In this section, the impacts of CO2 price and emission minimisation, as described in Section 3.4, are presented. At maximum waste and water energy recovery, annual CO2 emissions of about 4700 t per year can be evaluated from the graph in Figure 4. Table 2 provides an overview of the impact of the CO2 price and CO2 minimisation on similar parameters as in Figure 4.
With CO2 prices over 800 €/tCO2, an impact on the energy system with reduced gas technology use was determined. The impact of CO2 price was low due to the few technology options. In the minimisation, the results differed between the consideration of grids (Opt Grid) and primary local technology usage (Opt Local). As the gas grid has only a low amount of pre-chain emissions ( 0.02 kgCO2/kWh), compared to the emissions in the electricity mix in Israel (of 0.6 kgCO2/kWh), the gas grid was used in favour of the electrical grid [92,93]. The local gas technology emissions do not exceed the electricity grid emissions. For waste combustion, only the fossil share ( 0.22 kgCO2/kgwaste) of the total emissions ( 1.1 kgCO2/kgwaste) was considered [94]. In the CO2 price scenario, sludge combustion increased with increasing CO2 prices. A similar behaviour was determined in the minimisation scenarios, where gas technologies were increasingly replaced by energy recovery technologies. Greywater emerged as a further option to reduce CO2 emissions; however, financial incentives or high CO2 prices were necessary to promote greywater utilisation from a financial perspective. From an emissions perspective, greywater was implemented, as in the CO2 minimisation scenario, with a greywater contribution of about 4%.

4.4. Hydrogen Economy

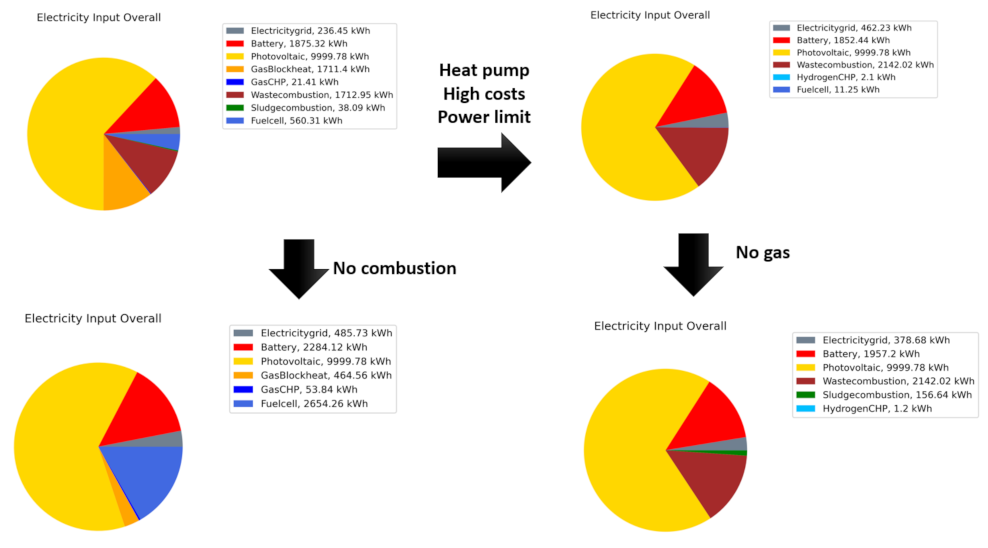
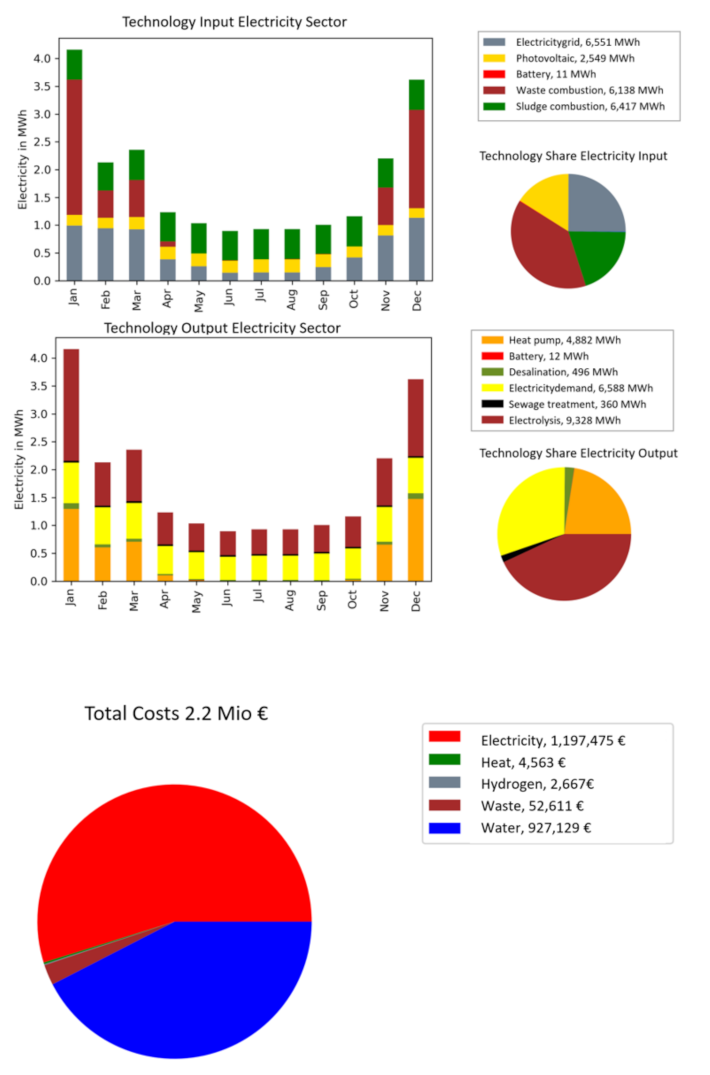
The results of the green highlighted setup in Figure 1 are presented in this section, in which gas technologies are replaced by hydrogen technologies. To cover the hydrogen demand, electrolysis (at 11 , 861 MWh per year) was required. All hydrogen was obtained by electrolysis. Sludge anaerobic digestion is currently not economically feasible due to its low efficiency. The heat from sludge combustion in the summer could not be used in the considered setup and was lost as waste heat. Alternative use as processing heat could help to reduce this waste heat. Furthermore, the increased electrolysis led to an increase in electricity grid consumption ( 7764 MWh) compared to the original setup, while the contribution of decentralised technology decreased. The overall electricity demand increased by 9932 MWh. With total costs of 2.58 Mio €, the costs were at a higher level compared to the gas-based setup. As in the original setup, efficient resource utilisation was mandatory. With additional resource treatment adapted to the given demand parameters, grid consumption ( 2267 MWh) and electrolysis ( 2533 MWh) could be reduced. Thus, the costs could be lowered to 2.2 Mio €, but were still about 1.5 Mio € higher than those in the gas-based setup. If no energy recovery potential of waste and water is used, the electricity grid consumption increased to 29 , 522 MWh, and 7477 MWh additional electrolysis operation was required compared to the original hydrogen-based setup. Furthermore, the total costs increased to 6.2 Mio €. The electricity inputs and outputs with the implementation of energy recovery and half-full waste storage are presented in Figure 5.
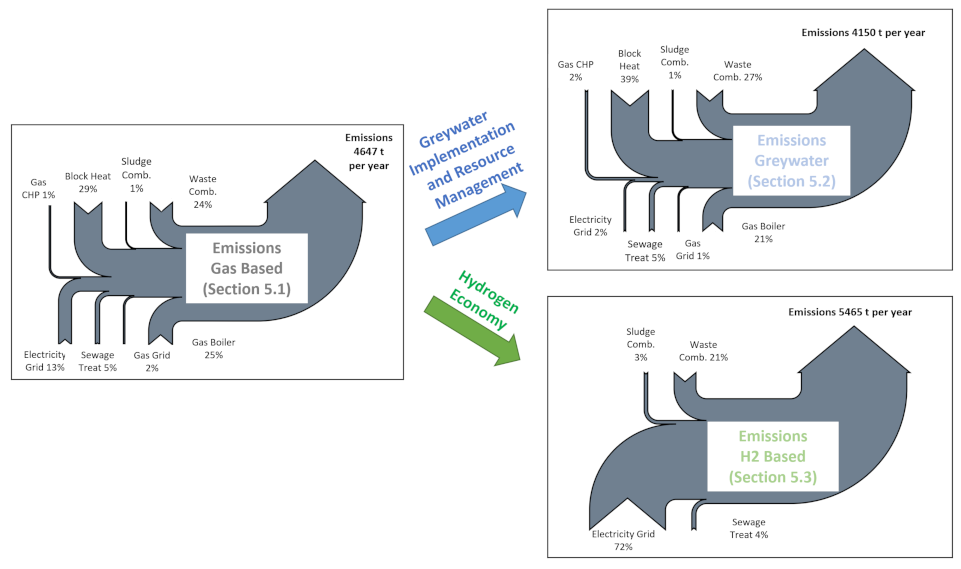
By transitioning to hydrogen technologies, the total CO2 emissions increased by 2000 t/year, due to the high emissions share in the Israeli electricity mix. With efficient resource management, the emissions in the hydrogen economy could be lowered to be only about 900 t/year above the minimum emissions in the gas-based system. Due to few technological options, the CO2 price only had a minor impact on the emissions reduction. Furthermore, greywater had only a slight influence, as treated sewage was needed for energy recovery. Regarding CO2 minimisation, hydrogen technologies were promoted due to the absence of local emissions.

4.5. Relationship between Energy Recovery and Energy System Operations

The results of the sensitivity analyses considering waste and sludge disposal in the gas- and hydrogen-based energy systems are presented in this section. Figure 6 shows the results for the gas-based setup. The disposed waste and sludge are displayed on the horizontal axis, whereas the value (in percentage) applies to both resources (e.g., 50% disposal means that 50% of waste and 50% of sludge are disposed of without energy recovery).
For the gas-based setup, the impacts of resource disposal on electricity grid purchase, gas grid purchase, and gas technologies are presented. The values on the vertical axis describe the contribution of the technologies and grids to the respective energy sectors in relation to the total contributions of all technologies (in per cent). Furthermore, the impact on the CO2 emissions is presented. Until disposal of 35%, the electricity grid consumption was constant, at about 8%. Between 35% and 90% disposal, an increase in electricity grid consumption to 75% emerged due to lower electricity generation from waste and sludge combustion. The gas grid purchase steadily increased with increased disposal. At 75% disposal, a sharp increase in gas grid consumption occurred, as not enough sludge can be utilised in anaerobic digestion to cover the gas demand. Regarding the gas technologies with electricity as an output, a constant contribution until disposal of 50% was identified. As less gas from anaerobic digestion was available at higher shares and the remaining gas was required for heat provision, the electricity generated by gas technologies decreased. With additional disposal, increasing gas conversion technologies for heat provision were required. Recovered heat from waste and sludge combustion could not be utilised, as the heat pumps were already operating at their capacity limits. Therefore, heat must be provided by gas technologies. The increased grid purchases and gas-to-heat technological operations led to increased CO2 emissions with increased disposed waste and sludge. However, the complex relations in the gas-based setup lead to non-linearity between energy system technology operations and disposed waste and sludge.
In Figure 7, the impact of disposed waste and sludge on electricity grid purchase, electrolysis, and hydrogen-to-heat conversion technologies, as well as the effects on CO2 emissions, are presented.
Regarding the electricity grid and hydrogen-to-heat technologies, the contribution to the overall electricity and heat provision to the energy system is presented. For electrolysis, the share of electricity needed for electrolysis, compared to the overall electricity demand, is presented. Electricity grid purchase, electrolysis, and hydrogen-to-heat technology operation increased almost linearly with increased disposal. Due to less electricity and heat being provided by energy recovery technologies, additional hydrogen for hydrogen boilers was required to cover the heat demand. This hydrogen must be generated by electrolysis, leading to increased electricity grid purchase. Due to these direct relationships, an almost linear relationship between waste and sludge disposal emerged.

5. Discussion

Based on the results presented in Section 4, the significant findings are discussed. In Section 5.1, the potential of energy recovery in the considered city is discussed. Section 5.2 discusses the impact of and potential barriers to greywater implementation. The discussions in Section 5.3 address the transition to a hydrogen economy. Finally, the complexity of the relationships between waste and water energy recovery and energy system operation is discussed in Section 5.4. Figure 8 presents an overview of the importance of the discussion points regarding the impact on emissions under a CO2 price of 30 €/tCO2.

5.1. Potential and Implementation of Energy Recovery

Energy recovery through waste and water is expected to become increasingly crucial in future sustainable energy systems. The results in Section 4.1 demonstrated that energy recovery from waste and water can provide major contributions to energy demand coverage in the considered Israeli city. Waste and sludge combustion have a direct impact, while anaerobic digestion of the resources can also provide major contributions through the generation of biogas. However, it is not only required to utilise energy recovery of the resources but also to exploit the energy recovery potential when it is needed. A lack of opportunities for coordinated resource utilisation or the missing option for the use of resources at the point of demand can reduce the energy obtained through resource utilisation, as was presented with an emphasis on the planning horizon in Section 4.1. From the emissions perspective, the efficient treatment of resources—especially waste—is a mandatory aspect, as the emissions increase with increasingly disposed waste (see Figure 4).
The combustion of waste and sludge, as efficient resource treatment processes, can help to reduce the total CO2 emissions and are essential for reducing the electricity procured, which is associated with emission-intensive grid consumption in Israel. By comparing the results of the cost and CO2 minimisation (see Table 2), it can be seen that energy recovery technologies should be promoted for emissions minimisation. As such, energy recovery should not be considered purely from a cost perspective but also from an environmental perspective. Conversion technologies with local zero emissions (e.g., waste anaerobic digestion) become more important in the emissions minimisation analysis. Therefore, it can be concluded that future energy system planning should be carried out not only in accordance with cost minimisation but also with consideration of emissions minimisation. Technologies should not be fundamentally excluded due to comparatively high costs, provided that they can contribute to a reduction of emissions.
For evaluation of the results, optimisation was performed, in which resource utilisation was only affected by certain constraints and conversion efficiencies. In real-life implementations considering energy recovery from resources, the additional efforts needed for coordination and management of resources may lower the outcome from energy recovery. In particular, the decentralisation of resource utilisation and treatment may be associated with barriers to implementation. Operators must be found for the plants, as decentralisation to privately operated plants for resource treatment might not be expedient, thus leading to high barriers [95]. Connection of the technology energy outputs to the household energy system for direct use can lead to high costs, as grid connections for all of the energy outputs would be required. Furthermore, resource collection and management would have to be completely taken over by households, where there might be a lack of expertise. This leads to the conclusion that an upscaling of resource treatment plants would be the most efficient implementation.
Further implementation barriers might emerge due to the high requirements for the coordination of resource management. The allocation of the energy recovered to the resources collected by certain consumers cannot be determined exactly. This might lower the motivation of consumers for efficient resource utilisation, as the associated business models are complex to implement, and the perspective of sustainable resource treatment might not be motivation enough for some consumers. Moreover, this can lead to free-riders not implementing efficient resource management [96]. Furthermore, for allocation, the resources of multiple consumers need to be measured, which may be too complicated in real-life implementations [97]. This leads to the conclusion that resource utilisation for energy recovery must be implemented and considered with respect to larger use-cases rather than individual consumers.
In summary, efficient resource utilisation for energy recovery requires demand-dependent coordination and the cooperation of many consumers with the operators of waste and sewage treatment plants. A sustainable consumer mindset is an additional requirement for the efficient use of resources.

5.2. Greywater: Opportunities and Barriers

Greywater, as a resource in sector coupling, has been barely considered to date. In times where water is becoming a more and more valuable and precious resource, the recycling of water is becoming increasingly relevant, as well as in the context of energy system operations. Drinking water should only be used for purposes where no other option is available. Therefore, the use of greywater for non-potable water demand coverage is an efficient possibility to use recycled water.
The options for using greywater in the most efficient way are manifold. In addition to laundry and bath sewage, the inclusion of rainwater to cover non-potable water demand is possible [47,48]. All of these recycling technologies can be key factors in getting the maximum utility out of water as a resource. Especially in countries with a high level of water scarcity, the use of greywater may be mandatory in helping to cover the water demand. Considering increasingly electrified systems, with hydrogen as an often-discussed energy carrier needing water, the inclusion of other water provision options than potable water can help to make the inclusion of hydrogen technologies possible, even in dry regions (see Table 1). In an optimised system, greywater use can be implemented to provide potable water for technological use. Furthermore, greywater can help to reduce CO2 emissions in energy systems with many emissions-intensive decentralised generation technologies.
Greywater use not only has numerous advantages but also disadvantages that can arise as barriers. For the use of greywater, two separate sewage pipeline systems are required in households. These are associated with high installation costs, and conversions tend to be even more costly in already existing buildings [98,99]. Furthermore, greywater is water with a low quality level, which makes it unsuitable for many water demand purposes and technologies. In addition, greywater cannot be stored over long periods due to biological processes decreasing the water quality. The results in Section 4.2 indicated that, as energy recovery has a higher impact on energy systems than greywater use, greywater should only be considered in the context of scarcity constraints. In other scenarios, the higher share of energy recovery due to more sewage emerging from potable water use had a higher contribution to energy system operations. Therefore, the sewage from greywater should also be further treated in order to take advantage of the whole available energy recovery potential. However, greywater can still contribute to more sustainable energy system operations, as major advantages arise due to the sustainable utilisation of water as a resource.

5.3. Transition to Hydrogen in Water-Scarce Countries

For future sustainable energy systems, the transition to a hydrogen economy—in which gas technologies are replaced by hydrogen technologies—has been widely discussed. Water is required as a resource for hydrogen generation through electrolysis; however, in water-scarce countries, where the available water for demand coverage is limited, the technological use of potable water is controversial.
Greywater use can help to save water for hydrogen generation by electrolysis, as presented in Table 1. However, additional hydrogen generation technologies, apart from electrolysis, must be provided in hydrogen-based energy systems. The anaerobic digestion of waste and sewage sludge can contribute to hydrogen generation without the additional direct use of potable water, but this is dependent on the emergence of relevant resources. Both technologies are not yet economically feasible compared to combustion technologies, as no contribution was seen in the results of Section 4.4. Therefore, further technological development is required. Electrolysis was a more flexible option in the investigated city, as the electricity that is required as input was available in all time steps; meanwhile, potable water availability was dependent on the scarcity assumptions.
The transition to a hydrogen economy is connected with an increase in total primary energy consumption due to the low efficiencies of hydrogen generation technologies such as electrolysis. The results in Section 4.4 indicated that the absence of energy recovery can lead to a sharp increase in electricity grid consumption and electrolysis operations due to the high demand for hydrogen. In cities implementing a hydrogen economy, energy recovery from waste and water gains even more relevance. If the decentrally generated energy cannot be provided by waste and sewage treatment processes, the remaining energy demand must be covered by decentralised hydrogen conversion technologies, as shown in the sensitivity analysis in Figure 7. This led to an increase in the total primary energy consumption.
The main purpose of a transition from gas technologies to hydrogen technologies is to achieve the goal of reducing total CO2 emissions. Hydrogen combustion technologies are associated with locally zero CO2 emissions. However, if the demand for hydrogen increases, the use of electrolysis also increases. This, again, leads to higher electricity demand, where a large share of the demand must be covered by electricity purchases from the electricity grid. In Israel, the generation of electricity is based on a large share of fossil fuels ( 0.6 kgCO2/kWh). Due to the high emissions intensity, increased hydrogen demand in Israel led to higher CO2 emissions. The results in Section 4.4 presented that the emissions in the hydrogen economy were 2000 t/year higher than those in the original setup, whereby an alignment is possible with resource management. This leads to the conclusion that the transition to a hydrogen economy is not necessarily associated with lower emissions. For a target-oriented implementation, it is necessary to reduce the emissions associated with the generation of electricity. Therefore, the transition to a hydrogen economy must be associated with a preliminary transition of electricity generation from fossil fuels to renewable energy sources.

5.4. Complexity in Energy Recovery Relations

The results in Section 4.5 detailed the complexity of the relationships between waste and sludge energy recovery and other energy system operations. Relationships between energy recovery technologies and other energy system operations differed from the presented energy system setups. Thus, a universally valid assumption for the impact of energy recovery technologies on energy system planning is not possible, and detailed, energy system-dependent analyses must be performed. The relationships between energy recovery and energy system operations are strongly reliant on the energy system configuration, which, in turn, depends on the available technologies. Increasing procurement from central sources can lead to increasing complexity. Additional sensitivity analyses on conversion technology capacities in both setups showed that the relationships are also dependent on capacity. If the capacity of a conversion technology is too low to cover the demand, additional generation through other conversion technologies is required. Further implementation of greywater led to increased complexity. Table 1 shows that electrolysis operation was not affected by scarcity constraints due to the provision of greywater for water demand coverage. The interdependence between greywater utilisation, conversion technology operation, and scarcity constraints led to increased complexity in the system. Furthermore, the interdependence between technology capacities, implemented energy recovery technologies, and energy system operations underline the complexity of the described relations.
For further analysis, a parameter describing the influence of energy recovery, Γ c o m p o n e n t r e c o v e r y , was introduced, where the component in the index can be a specific energy system component. This parameter describes the impact of energy recovery on other energy system operations with respect to the associated technologies. Thus, this parameter describes the relationships presented in Figure 6 and Figure 7; however, this parameter is only introduced for theoretical discussion. In a linear relationship, this parameter only depends on the disposed waste and sludge.
Γ c o m p o n e n t r e c o v e r y = f ( m t o t a l w a s t e , d i s p o s e d , m t o t a l s l u d g e , d i s p o s e d ) .
The results in Section 4.5 demonstrated that the influence of one energy system technology is dependent on various parameters of all available energy system components (e.g., capacities or the energy system configuration). In most energy system configurations, a more complex relationship than in Equation (28) will occur. Such a relationship can be described with Equation (29):
Γ c o m p o n e n t r e c o v e r y = f ( m t o t a l w a s t e , d i s p o s e d , m t o t a l s l u d g e , d i s p o s e d , Q i m a x , T e c h n o l o g i e s , P C O 2 , F t s c a r c i t y , ) .
For investigations on the energy recovery potential of waste and sludge in energy systems, such a relationship must be determined. If this relation is not available, a detailed simulation of the energy system, with consideration of all energy sectors, must be performed. However, regardless of the applied method, the potential assessment of energy recovery is coupled with a high level of complexity.

6. Conclusions

This work proposed the integration of waste and water as sectors in sector coupling approaches in order to achieve efficient resource utilisation by implementing waste and water energy recovery. The functionality of the developed model was demonstrated through the use of an energy system test-bed considering resource utilisation under sector coupling.
The results showed that waste and water energy recovery could make significant contributions to energy generation in other energy sectors. Losses due to non-efficient treatment planning led to the conclusion that, even though there is a lot of energy recovery potential in waste and water, associated implementations in real-life might be hindered due to failures in preliminary management or in the treatment processes. Additionally, the implementation of greywater was investigated as an option for higher water sustainability. However, greywater utilisation requires the installation of separate sewage systems, which may prevent many households from its implementation. Investigations of the transition to a hydrogen economy showed that such a transition is not automatically connected with a reduction in emissions. This is due to the increasing primary energy demand in hydrogen-based systems and the high emissions intensity of the Israeli electricity generation sector. Furthermore, the complexity of the relationships between energy recovery technologies and energy system operations was investigated. The relationships are strongly dependent on the energy system configuration and are usually non-linear.
In future energy system analyses, waste and water energy recovery should be considered in order to increase the overall energy efficiency. Therefore, waste and water should be implemented in sector coupling. Investigations on the energy recovery potential of waste and water in the energy system involve a high level of complexity. Options for the analysis include defining general relations for a considered energy system or performing a detailed analysis of the energy system. However, due to the complexity of the connections, and energy system configuration-dependent analysis might be the more efficient method. Furthermore, the inclusion of greywater is additionally recommended for the more sustainable use of water; before abandoning water-intense conversion technologies from the energy system in water-scarce countries, the alternative use of greywater should be considered. All of these inclusions should be considered in conjunction with CO2 emissions. In particular, preliminary resource management can be essential for CO2 reductions. However, resource utilisation will have a major impact on energy system operations, as some resources, such as water, are becoming a valuable commodity. The disposal of resources without recycling or energy recovery might be declared unsustainable or even environmentally harmful.
With the developed optimisation model, the impacts of energy recovery, greywater, and emissions could be determined accordingly. The setup test-bed could be appropriately processed, as the energy system operations were performed in the most efficient way. Through the modular design of the model, the future extension to more conversion technologies and sectors, as well as its application in other energy system setups, can be carried out without high effort. Through the use of an open-source approach, further model development can be carried out by anyone with expertise in energy system modelling.
The limitations of the model arose through the simple mathematical description of the conversion technologies, as our focus was set on the interactions rather than the behaviours of individual technologies. A further limitation of the approach was the aggregation of consumers and conversion technologies as the interactions between technologies of the same type were not modelled. Furthermore, grids and resource distribution streams, as well as component locations, that could have an impact on the energy system operations were not implemented in the model.
Future work should consider a similar approach with multiple consumers and conversion technologies, allocated to a particular location. Such investigations may include the optimisation of energy system operations, as well as the implementation of specific business models for a more efficient resource utilisation by individual consumers. Additionally, future work should combine the cost and emissions minimisations (e.g., through Pareto optimisation) in order to determine the optimal technological operation mode. Moreover, future work should also focus on the complexity of energy recovery potential assessment in energy recovery analyses.

Author Contributions

Methodology, M.M. and D.S.; Formal analysis, M.M. and D.S.; Software, M.M.; Investigation, M.M.; Validation, M.M.; Visualisation, M.M.; Writing—Original draft preparation, M.M.; Conceptualisation, G.L. and H.A.; Funding acquisition, G.L.; Resources, G.L.; Supervision, H.A.; Writing—Reviewing and editing, C.L., C.C. and H.A. All authors have read and agreed to the published version of the manuscript.

Funding

Open-Access Funding by TU Wien Bibliothek.

Institutional Review Board Statement

Not applicable.

Informed Consent Statement

Not applicable.

Data Availability Statement

Not applicable.

Acknowledgments

This work was performed under the “Hybrid Local Sustainable Communities” project [100], and was supported with funds from the Climate and Energy Fund and implemented in the framework of the RTI-initiative “Flagship region Energy” within the Green Energy Lab. The authors acknowledge TU Wien Bibliothek for financial support through its Open-Access Funding Program.

Conflicts of Interest

The authors declare no conflict of interest.

Nomenclature

Model parameters and decision variables.
S e t s e c t o r i n Sector inputsindex: n
S e t s e c t o r o u t Sector outputsindex: m
S e c t o r s Set with all considered sectorsindex: k
T e c h n o l o g i e s Set with implemented technologiesindex: i
S o u r c e s Set with implemented sourcesindex: j
P e r i o d d i s p o s a l Set of all disposal time stepsindex: d
Parameters
TTotal time steps h
C t i n Technology input costs€ per [ x i n ]
C t o u t Technology output costs€ per [ x o u t
C t p u r c h a s e Specific purchase costs€ per [ x p u r c h a s e ]
P m a x Maximum power kW
V m a x Maximum processed volume m 3
M m a x Maximum processed mass kg
Δ t Time step h
T i n t e r v a l d i s p o s a l Disposal interval h
T d i s p o s a l Disposal time step h
η s b Storage standby efficiency/
η i n Storage input efficiency/
η o u t Storage output efficiency/
S O C s t a r t State of charge at beginning[sector]
F t c o n v e r s i o n Technology conversion factor [ x o u t / x i n ]
F t r e s o u r c e Technology resource deployment [ x r e s o u r c e / x i n ]
D t w a t e r Water demand m 3
S h a r e t g r e y w a t e r Maximum greywater contribution/
F t s c a r c i t y Water scarcity factor/
P C O 2 CO2 price€ per kg
F t C O 2 CO2 factor kg per [ x i n ]
Γ c o m p o n e n t r e c o v e r y Energy recovery relation [ X t e c h n o l o g y ] /kg
Decision Variables
c t O & M Operational technology costs
c t p u r c h a s e External purchase costs
c t o t a l Total costs
x t i n Input flowGeneric unit
x t o u t Output flowGeneric unit
x t p u r c h a s e External purchased flow[sector]
x t r e s o u r c e Additional resource flow[sector]
q t Energy flow kWh
v t Volume flow m 3
m t Mass flow kg
s o c t Storage state of charge[sector]
d t p o t a b l e w a t e r Potable water to water demand m 3
d t g r e y w a t e r Greywater to water demand m 3
d t e l e c t r o l y s i s Water demand electrolysis m 3
e t Technology and source emissions kg
e t t o t a l Total emissions kg
c e m i s s i o n s Total emissions costs
c t o t a l , e x t e n d e d Total costs including emissions

Appendix A. Case Study Setup and Assumptions

The setups for the test-bed in Israel and the corresponding energy system flows between sectors are presented in this section. Figure A1 presents the gas-based energy system. The use of greywater is also implemented but not presented in the graph in order to keep it compact.
Figure A1. Gas-based energy system.
Sustainability 14 07445 g0a1
The same setup for the hydrogen-based energy system is presented in Figure A2.
Figure A2. Hydrogen-based energy system.
Sustainability 14 07445 g0a2
The assigned technological input and output sectors are presented in Table A1.
Table A1. Input and output sector allocation to conversion technologies.
TechElecHeatWasteWaterGasH2
PV GenerationOut/////
DesalinationIn//Out//
P2HInOut////
Hot Water/In/Out/In//
Waste Comb.OutOutIn///
Waste Biogas//In/Out/
Waste H2//In//Out
Gas CHPOutOut//In/
Gas Boiler/Out//In/
Blockheat/Out//In/
Sewage Treat.InOut/In/Out//
Sludge Comb.OutOut/In//
Sludge Biogas///InOut/
Sludge H2///In/Out
ElectrolysisIn//In/Out
H2 CHPOutOut///In
Fuel CellOut////In
H2 Boiler/Out///In
To conclude the test-bed setup, the assumed data are shortly described. A total of 560 single-family houses and 200 multi-family houses in Israel were assumed [101]. With about eleven households per multi-family house, this resulted in a total of 2800 households. Regarding decentralised technologies, a share of 30% of renewable energy generation and 70% gas-based generation was assumed [85]. In the following tables, the assumed maximum values (i.e., maximum power and maximum flows), as well as the conversion factors and costs, are summarised for each sector.
Table A2. Electricity Assumptions.
TechnologyLimitConversionCostsComment
Elec. grid80 MW/15 ct/kWh11 kW per household [102]
PV 1.73 MWStandard profile/Half of households with PV
Heat pump 12.6 MWCOP time-series 0.15 ct/kWh[103,104]
Battery 0.285 MW η of 0.95 0.3 ct/kWh6% of households [105]
Desalination 150 m 3 3 kWh/ m 3 elec.44 ct/ m 3 [106,107]
Demand/3400 kWh/[108]
Table A3. Heat Assumptions.
TechnologyLimitConversionCostsComment
Boiler33 MW η of 0.95, water of 17l/kWh/[109]
Heat storage 473 m 3 η of 0.8 0.05 ct/kWh[110,111]
Demand/35 GWh/[112]
Table A4. Waste Assumptions.
TechnologyLimitConversionCostsComment
Storage 1343 m 3 //Disposal periods
Stock 51580 m 3 //No disposal periods
Accruing/612 kg/year/[113]
Disposal/1343 m 3 0.23 ct/kg[114]
Combustion75 MW η e l of 0.35, η t h of 0.4 0.4 ct/kWh[115]
Table A5. Water Assumptions.
TechnologyLimitConversionCostsComment
Demand/758520 m 3 /[116]
Storage5988 m 3 /1 ct/ m 3 Basic assumptions
Sewage treatment/ η w a t e r of 0.95, η e l of
0.5 kWh/ m 3
4 ct/ m 3 [117,118]
Sewage sludge/ 9.2 kg/ m 3 /Based on sludge parameters
Sewage heat/ 3.5 kWh/ m 3 /[119]
Sludge combustion 2.2 MW η e l of 0.35, η t h of 0.46 ct/kWhSame as waste combustion
Sludge disposal//23 ct/kgSame as waste
Table A6. Gas Assumptions.
TechnologyLimitConversionCostsComment
Demand/5112 MWh/[120]
Grid1000 MW//[121]
Blockheat 6.4 MWEfficiency 0.44 0.3 ct/kWh[122,123]
Boiler 31.5 MWEfficiency 0.95 0.1 ct/kWhLike waste combustion (higher efficiency)
Co-generation 31.5 MW η e l of 0.35, η t h of 0.4 0.1 ct/kWhLike waste combustion [124]
Anaerobic digestionWaste: 75
MW Sludge: 2.2 MW
0.5 kggas/kg7 ct/kg[21]
Table A7. Hydrogen Assumptions.
TechnologyLimitConversionCostsComment
Demand/5112 MWh/Same as for gas
Storage6 GWhefficiency 0.6 1.6 ct/kWh[125,126,127]
Electrolysis50 MWelectricity 3.5 kWh/ m 3 ,
water 1 l/ m 3
6.8 ct/ m 3 [128,129,130]
Fuel cell 2.8 MWefficiency 0.6 1.8 ct/kWh[131,132]
Boiler 31.5 MWefficiency 0.95 0.1 ct/kWhLike gas boiler
Co-generation 31.5 MW η e l of 0.35, η t h of 0.43 ct/kWh[133]
Anaerobic digestionWaste: 75
MW Sludge: 2.2 MW
15 gH2/kg7 ct/kg[134]
The assumptions for the emissions associated with the considered technologies are summarised in Table A8.
Table A8. Emissions Assumptions.
TechnologyEmissionsComment
Elec. grid 0.6 kg/kWh[92]
Gas grid 0.02 kg/kWh[93]
Gas boiler 0.201 kg/kWh[135]
Blockheat 0.201 kg/kWh[135]
Gas co-generation 0.201 kg/kWh[135]
Waste combustion 1.1 kg/kgwaste[94]
Waste disposal 0.382 kg/kgwaste[136]
Sewage treatment 0.3 kg/ m 3 [137]
Sludge combustion50 kg/ m 3 [135]
Sludge disposal1456 kg/ m 3 [138]
For the water scarcity investigations, the assumed scarcity factors ( F t s c a r c i t y ) over the year are presented in Table A9.
Table A9. Scarcity Factor Assumptions.
Month F t scarcity
January0.95
February0.95
March0.95
April0.95
May0.75
June0.6
July0.6
August0.6
September0.75
October0.9
November0.95
December0.95

Appendix B. Model Validation

For the “RUTIS” model validation, a test energy system was set up with the optimisation model in order to test the model functionalities. In the energy system, all model blocks representing conversion technologies were implemented with their corresponding functionalities and constraints. Sources and sinks for external procurement and disposal were also added to the system. For model validation, different configuration settings and their impact on the optimisation results were investigated.
In the first configuration alteration, waste combustion and sludge combustion were removed from the energy system. As in the original setup, no waste and sludge was disposed of without energy recovery. Instead of combustion, anaerobic digestion of both resources was used. In addition, electricity grid consumption and power to heat were increased due to lower electricity generation and heat generation by combustion technologies. By removing anaerobic digestion conversion technologies from the energy system, instead of combustion technologies, all waste and sludge were incinerated. As hydrogen was considered in the whole energy system, the gas demand was covered by methanation instead of anaerobic digestion. Both configurations showed that a change in the energy system setup resulted in the best possible alternative, as no resources were disposed of without energy recovery. Further configuration changes were made by removing the gas sector and its technologies completely. The technologies with gas as an input (e.g., boilers) were replaced by hydrogen technologies. Waste and sludge were incinerated instead of digested. A similar configuration was built by removing the whole hydrogen sector. This resulted in an increase in gas technologies. In both configurations, the removed technologies were replaced by other existing technologies in order to cover the given demand. The use of alternative technologies and alternative energy sectors, if technologies are removed, validated the functionality of the model.
For further validation, extreme values for certain parameters were investigated. By setting a disproportionately high price for the heat pump, compared to other conversion technologies, the technology was not used any more in the optimisation results, as was expected. A limitation of the heat pump power to zero resulted in the same results, as the heat pump was not used in the optimum operation. Similar impacts were seen when reducing the electricity grid purchase costs, which resulted in an expected increase in grid consumption. In addition, the CO2 price was set to a high value compared to all other considered costs in the model. This led to a replacement of all CO2-intensive technology operations with technologies with zero or lower emissions. All extreme value settings resulted in the expected outcome in the results, which provided further model validation.
In summary, all energy system configuration settings and value changes resulted in the expected results. Furthermore, an energy system operation with alternative technologies for energy recovery was performed in all investigations. This led to the conclusion that the setup optimisation model was valid and could be used for the processing of the research questions in this paper. A graphical representation of the model validation method is presented in Figure A3.
Figure A3. Model validation set up: electricity sector input.
Sustainability 14 07445 g0a3

Appendix C. Waste and Sludge Operation Results
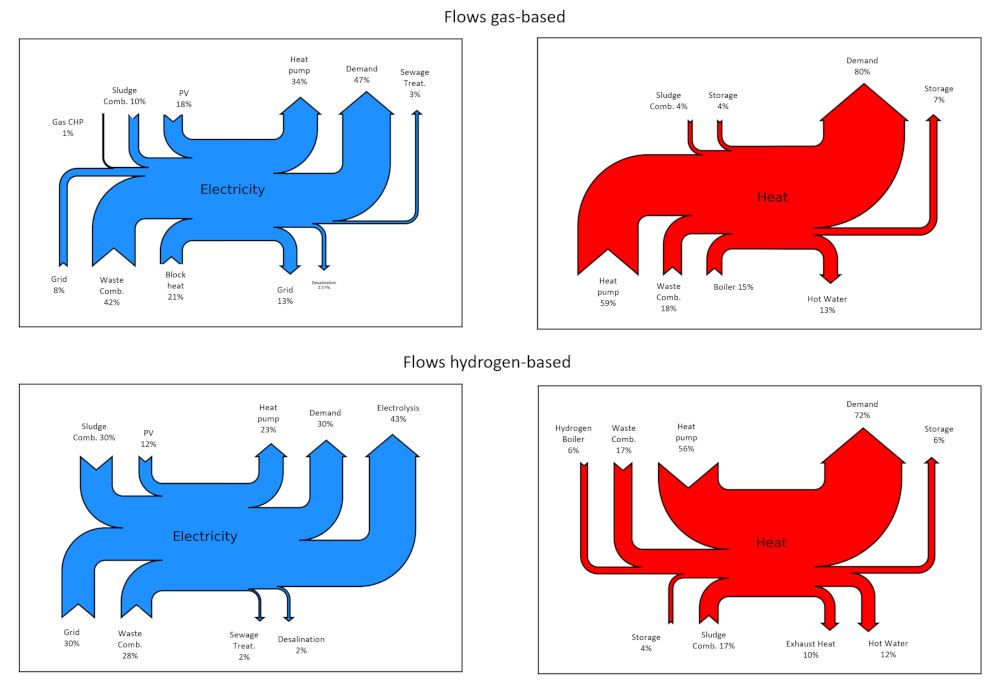
For a more detailed presentation of the flows in the electricity and heat sector in the gas- and hydrogen-based energy systems, the flows of the sectors are presented in Figure A4.
Figure A4. Electricity and Heat flows.
Sustainability 14 07445 g0a4
As an additional extension to Section 4, the results for the processing of waste and sludge are presented. The results for both the gas- and hydrogen-based energy systems are presented. In Figure A5, the waste and sludge diagrams for the gas-based energy system are presented.
Figure A5. Gas-based system: Waste and Sludge Contributions.
Sustainability 14 07445 g0a5
The results showed that a major share of waste was incinerated, whereas sludge was mainly digested but also incinerated. The processing in the hydrogen-based economy is presented in Figure A6.
Figure A6. Hydrogen-based system: Waste and Sludge Contributions.
Sustainability 14 07445 g0a6
As in the gas-based energy system, almost all waste was incinerated; furthermore, almost all sludge was incinerated, as the anaerobic digestion of hydrogen is not efficient. The contribution of greywater in scarcity periods is additionally presented for both cases. Figure A7 shows the impact of greywater in scarcity periods.
Figure A7. Contribution of greywater in scarcity periods.
Sustainability 14 07445 g0a7
It can be seen that greywater required a contribution of over 17% to overcome scarcity periods. The share was slightly increased in hydrogen-based energy systems due to the additional greywater contribution needed to enable electrolysis. Finally, the CO2 emissions results for both cases are presented in Figure A8. The planning horizons are equivalent to those in Figure 3 for the gas-based setup and Figure 5 for the hydrogen-based setup.
Figure A8. Total CO2 Emissions.
Sustainability 14 07445 g0a8
In the gas-based energy system, the emissions were caused by multiple decentralised gas technologies, while the impact of the electricity grid was only marginal. In turn, in the hydrogen-based system, the major share of emissions was caused by the electricity grid, as the decentralised hydrogen technologies do not cause emissions. Furthermore, adapted resource management was required for the optimal operation of the energy system.

References

  1. United Nations Deparment of Economic and Social Affairs. Sustainable Development. Available online: https://sdgs.un.org/goals (accessed on 14 March 2022).
  2. Bundesministerium für Klimaschutz. Das Übereinkommen von Paris. 2022. Available online: https://www.oesterreich.gv.at/themen/bauen_wohnen_und_umwelt/klimaschutz/1/Seite.1000325.html (accessed on 14 March 2022).
  3. European Commission. Communication from the Commission to the European Parliament, the Council, the European Economic and Social Committee and the Committee of the Regions. 2020. Available online: https://eur-lex.europa.eu/legal-content/EN/TXT/PDF/?uri=CELEX:52020DC0299&from=DE (accessed on 30 April 2021).
  4. Kumar, A.N.; Russel, I.F. Introduction. Int. J. Pattern Recognit. Artif. Intell. 2000, 14, 1–2. [Google Scholar] [CrossRef]
  5. Hamiche, A.M.; Stambouli, A.B.; Flazi, S. A review of the water-energy nexus. Renew. Sustain. Energy Rev. 2016, 65, 319–331. [Google Scholar] [CrossRef]
  6. Oladejo, J.; Shi, K.; Luo, X.; Yang, G.; Wu, T. A Review of Sludge-to-Energy Recovery Methods. Energies 2019, 12, 60. [Google Scholar] [CrossRef] [Green Version]
  7. Thormark, C. Conservation of energy and natural resources by recycling building waste. Resour. Conserv. Recycl. 2001, 33, 113–130. [Google Scholar] [CrossRef]
  8. Moya, D.; Aldás, C.; López, G.; Kaparaju, P. Municipal Solid Waste as a Valuable Renewable Energy Resource: A Worldwide Opportunity of Energy Recovery by Using Waste-To-Energy Technologies; Elsevier Ltd.: Amsterdam, The Netherlands, 2017; Volume 134, pp. 286–295. [Google Scholar] [CrossRef]
  9. Giugliano, M.; Cernuschi, S.; Grosso, M.; Rigamonti, L. Material and energy recovery in integrated waste management systems. An evaluation based on life cycle assessment. Waste Manag. 2011, 31, 2092–2101. [Google Scholar] [CrossRef]
  10. Dlamini, S.; Simatele, M.D.; Kubanza, N.S. Municipal solid waste management in South Africa: From waste to energy recovery through waste-to-energy technologies in Johannesburg. Local Environ. 2019, 24, 249–257. [Google Scholar] [CrossRef]
  11. Milutinović, B.; Stefanović, G.; Đekić, P.S.; Mijailović, I.; Tomić, M. Environmental assessment of waste management scenarios with energy recovery using life cycle assessment and multi-criteria analysis. Energy 2017, 137, 917–926. [Google Scholar] [CrossRef]
  12. Yi, S.; Jang, Y.C.; An, A.K. Potential for energy recovery and greenhouse gas reduction through waste-to-energy technologies. J. Clean. Prod. 2018, 176, 503–511. [Google Scholar] [CrossRef]
  13. Chen, Y.C. Evaluating greenhouse gas emissions and energy recovery from municipal and industrial solid waste using waste-to-energy technology. J. Clean. Prod. 2018, 192, 262–269. [Google Scholar] [CrossRef]
  14. Yaman, C.; Anil, I.; Alagha, O. Potential for greenhouse gas reduction and energy recovery from MSW through different waste management technologies. J. Clean. Prod. 2020, 264, 121432. [Google Scholar] [CrossRef]
  15. Peccia, J.; Westerhoff, P. We Should Expect More out of Our Sewage Sludge. Environ. Sci. Technol. 2015, 49, 8271–8276. [Google Scholar] [CrossRef] [PubMed]
  16. Hong, J.; Hong, J.; Otaki, M.; Jolliet, O. Environmental and economic life cycle assessment for sewage sludge treatment processes in Japan. Waste Manag. 2009, 29, 696–703. [Google Scholar] [CrossRef] [PubMed]
  17. Wang, K.; Nakakubo, T. Strategy for introducing sewage sludge energy utilization systems at sewage treatment plants in large cities in Japan: A comparative assessment. J. Clean. Prod. 2021, 316, 128282. [Google Scholar] [CrossRef]
  18. Singh, V.; Phuleria, H.C.; Chandel, M.K. Estimation of energy recovery potential of sewage sludge in India: Waste to watt approach. J. Clean. Prod. 2020, 276, 122538. [Google Scholar] [CrossRef]
  19. Quan, L.M.; Kamyab, H.; Yuzir, A.; Ashokkumar, V.; Hosseini, S.E.; Balasubramanian, B.; Kirpichnikova, I. Review of the application of gasification and combustion technology and waste-to-energy technologies in sewage sludge treatment. Fuel 2022, 316, 123199. [Google Scholar] [CrossRef]
  20. Masuda, S.; Sano, I.; Hojo, T.; Li, Y.Y.; Nishimura, O. The comparison of greenhouse gas emissions in sewage treatment plants with different treatment processes. Chemosphere 2018, 193, 581–590. [Google Scholar] [CrossRef]
  21. Verstraete, W.; de Caveye, P.V.; Diamantis, V. Maximum use of resources present in domestic “used water”. Bioresour. Technol. 2009, 100, 5537–5545. [Google Scholar] [CrossRef]
  22. Amulen, J.; Kasedde, H.; Serugunda, J.; Lwanyaga, J.D. The potential of energy recovery from municipal solid waste in Kampala City, Uganda by incineration. Energy Convers. Manag. X 2022, 14, 100204. [Google Scholar] [CrossRef]
  23. Medina-Mijangos, R.; Seguí-Amórtegui, L. Technical-economic analysis of a municipal solid waste energy recovery facility in Spain: A case study. Waste Manag. 2021, 119, 254–266. [Google Scholar] [CrossRef]
  24. Kan, A. General characteristics of waste management: A review. Energy Educ. Sci. Technol. Part A 2009, 23, 55–69. [Google Scholar]
  25. Vasanthi, P.; Kaliappan, S.; Srinivasaraghavan, R. Impact of poor solid waste management on ground water. Environ. Monit. Assess. 2008, 143, 227–238. [Google Scholar] [CrossRef] [PubMed]
  26. Hasan, M.M.; Rasul, M.G.; Khan, M.M.; Ashwath, N.; Jahirul, M.I. Energy recovery from municipal solid waste using pyrolysis technology: A review on current status and developments. Renew. Sustain. Energy Rev. 2021, 145, 111073. [Google Scholar] [CrossRef]
  27. Tseng, M.L.; Wong, W.P.; Soh, K.L. An overview of the substance of Resource, Conservation and Recycling. Resour. Conserv. Recycl. 2018, 136, 367–375. [Google Scholar] [CrossRef]
  28. Zhang, C.; Hu, M.; Maio, F.D.; Sprecher, B.; Yang, X.; Tukker, A. An overview of the waste hierarchy framework for analyzing the circularity in construction and demolition waste management in Europe. Sci. Total Environ. 2022, 803, 149892. [Google Scholar] [CrossRef] [PubMed]
  29. Khan, S.; Anjum, R.; Raza, S.T.; Bazai, N.A.; Ihtisham, M. Technologies for municipal solid waste management: Current status, challenges, and future perspectives. Chemosphere 2022, 288, 132403. [Google Scholar] [CrossRef]
  30. Corsten, M.; Worrell, E.; Rouw, M.; Duin, A.V. The potential contribution of sustainable waste management to energy use and greenhouse gas emission reduction in The Netherlands. Resour. Conserv. Recycl. 2013, 77, 13–21. [Google Scholar] [CrossRef]
  31. Sharafatmandrad, M.; Mashizi, A.K. Temporal and Spatial Assessment of Supply and Demand of the Water-yield Ecosystem Service for Water Scarcity Management in Arid to Semi-arid Ecosystems. Water Resour. Manag. 2021, 35, 63–82. [Google Scholar] [CrossRef]
  32. Willis, R.M.; Stewarta, R.A.; Panuwatwanich, K.; Jones, S.; Kyriakides, A. Alarming visual display monitors affecting shower end use water and energy conservation in Australian residential households. Resour. Conserv. Recycl. 2010, 54, 1117–1127. [Google Scholar] [CrossRef] [Green Version]
  33. Zhang, B.; Meng, Z.; Zhang, L.; Sun, X.; Hayat, T.; Alsaedi, A.; Ahmad, B. Exergy-based systems account of national resource utilization: China 2012. Resour. Conserv. Recycl. 2018, 132, 324–338. [Google Scholar] [CrossRef]
  34. Aivazidou, E. Water Management in Agriculture and Industry: Challenges, Trends, and Opportunities. Sustainability 2022, 14, 66. [Google Scholar] [CrossRef]
  35. Lee, M.; Kim, H.; Lee, J.Y.; Yang, J.E.; Lim, C. A Shift Towards Integrated and Adaptive Water Management in South Korea: Building Resilience Against Climate Change. Water Resour. Manag. 2022, 36, 1611–1625. [Google Scholar] [CrossRef]
  36. Department of Water and Environmental Regulation Government of Western Australia. Greywater. Available online: https://www.water.wa.gov.au/urban-water/water-recycling-efficiencies/waterwise-community-toolkit/greywater (accessed on 7 March 2022).
  37. Nolde, E. Greywater reuse systems for toilet flushing in multi-storey buildings—Over ten years experience in Berlin. Urban Water 2000, 1, 275–284. [Google Scholar] [CrossRef]
  38. City of Golden. 2021. Available online: https://www.cityofgolden.net/live/sustainability-initiative/water-conservation/graywater-reuse/ (accessed on 7 March 2022).
  39. Sudarsan, J.S.; Vaishampayan, S.; Srihari, V. Grey water recycling as a tangible solution to water crisis: A case study in Thiruvananthapuram, India. Int. J. Energy Water Resour. 2021, 5, 441–445. [Google Scholar] [CrossRef]
  40. Christova-Boal, D.; Eden, R.E.; McFarlane, S. An investigation into greywater reuse for urban residential properties. Desalination 1996, 106, 391–397. [Google Scholar] [CrossRef]
  41. Al-Jayyousi, O.R. Greywater reuse: Towards sustainable water management. Desalination 2003, 156, 181–192. [Google Scholar] [CrossRef]
  42. Mandal, D.; Labhasetwar, P.; Dhone, S.; Dubey, A.S.; Shinde, G.; Wate, S. Water conservation due to greywater treatment and reuse in urban setting with specific context to developing countries. Resour. Conserv. Recycl. 2011, 55, 356–361. [Google Scholar] [CrossRef]
  43. Knutsson, J.; Knutsson, P. Water and energy savings from greywater reuse: A modelling scheme using disaggregated consumption data. Int. J. Energy Water Resour. 2021, 5, 13–24. [Google Scholar] [CrossRef]
  44. Khajvand, M.; Mostafazadeh, A.K.; Drogui, P.; Tyagi, R.D.; Brien, E. Greywater characteristics, impacts, treatment, and reclamation using adsorption processes towards the circular economy. Environ. Sci. Pollut. Res. 2022, 29, 10966–11003. [Google Scholar] [CrossRef]
  45. Santasmasas, C.; Rovira, M.; Clarens, F.; Valderrama, C. Grey water reclamation by decentralized MBR prototype. Resour. Conserv. Recycl. 2013, 72, 102–107. [Google Scholar] [CrossRef]
  46. Couto, E.D.A.D.; Calijuri, M.L.; Assemany, P.P.; Santiago, A.D.F.; Carvalho, I.D.C. Greywater production in airports: Qualitative and quantitative assessment. Resour. Conserv. Recycl. 2013, 77, 44–51. [Google Scholar] [CrossRef] [Green Version]
  47. Ángel López Zavala, M.; Vega, R.C.; Miranda, R.A.L. Potential of Rainwater Harvesting and Greywater Reuse for Water Consumption Reduction and Wastewater Minimization. Water 2016, 8, 264. [Google Scholar] [CrossRef] [Green Version]
  48. Zhang, L.; Njepu, A.; Xia, X. Minimum cost solution to residential energy-water nexus through rainwater harvesting and greywater recycling. J. Clean. Prod. 2021, 298, 126742. [Google Scholar] [CrossRef]
  49. Stang, S.; Khalkhali, M.; Petrik, M.; Palace, M.; Lu, Z.; Mo, W. Spatially optimized distribution of household rainwater harvesting and greywater recycling systems. J. Clean. Prod. 2021, 312, 127736. [Google Scholar] [CrossRef]
  50. Ahmad, J.; EL-Dessouky, H. Design of a modified low cost treatment system for the recycling and reuse of laundry waste water. Resour. Conserv. Recycl. 2008, 52, 973–978. [Google Scholar] [CrossRef]
  51. Radingoana, M.P.; Dube, T.; Mazvimavi, D. Progress in greywater reuse for home gardening: Opportunities, perceptions and challenges. Phys. Chem. Earth Parts A/B/C 2020, 116, 102853. [Google Scholar] [CrossRef]
  52. Anuja, J.; Darshan, B.; Saraswathi, G.; Meyyappan, N. Study on reuse of grey water—A Review. J. Physics Conf. Ser. 2021, 1979, 012004. [Google Scholar] [CrossRef]
  53. Mourad, K.A.; Berndtsson, J.C.; Berndtsson, R. Potential fresh water saving using greywater in toilet flushing in Syria. J. Environ. Manag. 2011, 92, 2447–2453. [Google Scholar] [CrossRef]
  54. Soong, H.N.; Omar, R.; Goh, K.C.; Seow, T.W. The Challenges of Implementation Greywater Recycling System In Residential Buildings. Res. Manag. Technol. Bus. 2021, 2, 1113–1129. [Google Scholar]
  55. Cureau, R.J.; Ghisi, E. Reduction of Potable Water Consumption and Sewage Generation on a City Scale: A Case Study in Brazil. Water 2019, 11, 2351. [Google Scholar] [CrossRef] [Green Version]
  56. Al-Husseini, T.H.; Al-Anbari, R.H.; AL-Obaidy, A.H.M.J. Greywater Environmental Management: A Review. IOP Conf. Ser. Earth Environ. Sci. 2021, 779, 012100. [Google Scholar] [CrossRef]
  57. Wietschel, M.; Plötz, P.; Pfluger, B.; Klobasa, M.; Eßer, A.; Haendel, M.; Müller-Kirchenbauer, J.; Kochems, J.; Hermann, L.; Grosse, B.; et al. Sektorkopplung: Definition, Chancen und Herausforderungen. 2018. urn:nbn:de:0011-n-4845758. Available online: http://hdl.handle.net/10419/175374 (accessed on 30 April 2021).
  58. Fridgen, G.; Keller, R.; Körner, M.F.; Schöpf, M. A holistic view on sector coupling. Energy Policy 2020, 147, 111913. [Google Scholar] [CrossRef]
  59. Brauner, G. Efficiency Through Sector Coupling; Springer: Wiesbaden, Germany, 2022; pp. 209–224. [Google Scholar] [CrossRef]
  60. Edtmayer, H.; Nageler, P.; Heimrath, R.; Mach, T.; Hochenauer, C. Investigation on sector coupling potentials of a 5th generation district heating and cooling network. Energy 2021, 230, 120836. [Google Scholar] [CrossRef]
  61. Mokhtara, C.; Negrou, B.; Settou, N.; Abdessalem, B.; Yao, Y. Design optimization of grid-connected PV-Hydrogen for energy prosumers considering sector-coupling paradigm: Case study of a University building in Algeria. Int. J. Hydrogen Energy 2020, 46, 37564–37582. [Google Scholar] [CrossRef]
  62. Gea-Bermúdez, J.; Jensen, I.G.; Münster, M.; Koivisto, M.; Kirkerud, J.G.; Chen, Y.K.; Ravn, H. The role of sector coupling in the green transition: A least-cost energy system development in Northern-central Europe towards 2050. Appl. Energy 2021, 289, 116685. [Google Scholar] [CrossRef]
  63. Arnaudo, M.; Dalgren, J.; Topel, M.; Laumert, B. Waste heat recovery in low temperature networks versus domestic heat pumps—A techno-economic and environmental analysis. Energy 2021, 219, 119675. [Google Scholar] [CrossRef]
  64. Puttachai, W.; Tarkhamtham, P.; Yamaka, W.; Maneejuk, P. Linear and nonlinear causal relationships between waste-to-energy and energy consumption in Germany. Energy Rep. 2021, 7, 286–292. [Google Scholar] [CrossRef]
  65. Ohnishi, S.; Fujii, M.; Ohata, M.; Rokuta, I.; Fujita, T. Efficient energy recovery through a combination of waste-to-energy systems for a low-carbon city. Resour. Conserv. Recycl. 2018, 128, 394–405. [Google Scholar] [CrossRef]
  66. Thabit, Q.; Nassour, A.; Nelles, M. Potentiality of Waste-to-Energy Sector Coupling in the MENA Region: Jordan as a Case Study. Energies 2020, 13, 2786. [Google Scholar] [CrossRef]
  67. Schäfer, M.; Gretzschel, O.; Steinmetz, H. The Possible Roles of Wastewater Treatment Plants in Sector Coupling. Energies 2020, 13, 2088. [Google Scholar] [CrossRef] [Green Version]
  68. Mitsdoerffer, R. Wärme- und Kältekonzepte auf Kläranlagen. 2017. Available online: https://www.gfm-ingenieure.de/fileadmin/Daten/Referenzen/Klaeranlage/Energie/Vortrag-Mitsdoerffer-20170115-mi.pdf (accessed on 4 March 2022).
  69. Neugebauer, G.; Lichtenwoehrer, P.; Huber, F.; Stoeglehner, G.; Kretschmer, F. Potentials and Integrated Suitability Pre-assessment of Wastewater Treatment Plants as Local Energy Cells. Front. Environ. Sci. 2022, 9, 785557. [Google Scholar] [CrossRef]
  70. Michailos, S.; Walker, M.; Moody, A.; Poggio, D.; Pourkashanian, M. A techno-economic assessment of implementing power-to-gas systems based on biomethanation in an operating waste water treatment plant. J. Environ. Chem. Eng. 2021, 9, 104735. [Google Scholar] [CrossRef]
  71. Lichtenwoehrer, P.; Abart-Heriszt, L.; Kretschmer, F.; Suppan, F.; Stoeglehner, G.; Neugebauer, G. Evaluating Spatial Interdependencies of Sector Coupling Using Spatiotemporal Modelling. Energies 2021, 14, 1256. [Google Scholar] [CrossRef]
  72. Mills, N.; Pearce, P.; Farrow, J.; Thorpe, R.B.; Kirkby, N.F. Environmental & economic life cycle assessment of current & future sewage sludge to energy technologies. Waste Manag. 2014, 34, 185–195. [Google Scholar] [CrossRef] [PubMed] [Green Version]
  73. Sayegh, M.A.; Ludwińska, A.; Rajski, K.; Dudkiewicz, E. Environmental and energy saving potential from greywater in hotels. Sci. Total Environ. 2021, 761, 143220. [Google Scholar] [CrossRef] [PubMed]
  74. Ni, L.; Lau, S.K.; Li, H.; Zhang, T.; Stansbury, J.S.; Shi, J.; Neal, J. Feasibility study of a localized residential grey water energy-recovery system. Appl. Therm. Eng. 2012, 39, 53–62. [Google Scholar] [CrossRef]
  75. Sarkar, P.; Sharma, B.; Malik, U. Energy generation from grey water in high raised buildings: The case of India. Renew. Energy 2014, 69, 284–289. [Google Scholar] [CrossRef]
  76. Hadad, E.; Fershtman, E.; Gal, Z.; Silberman, I.; Oron, G. Simulation of dual systems of greywater reuse in high-rise buildings for energy recovery and potential use in irrigation. Resour. Conserv. Recycl. 2022, 180, 106134. [Google Scholar] [CrossRef]
  77. Nouri, N.; Balali, F.; Nasiri, A.; Seifoddini, H.; Otieno, W. Water withdrawal and consumption reduction for electrical energy generation systems. Appl. Energy 2019, 248, 196–206. [Google Scholar] [CrossRef]
  78. Rinaldi, A.; Soini, M.C.; Streicher, K.; Patel, M.K.; Parra, D. Decarbonising heat with optimal PV and storage investments: A detailed sector coupling modelling framework with flexible heat pump operation. Appl. Energy 2021, 282, 116110. [Google Scholar] [CrossRef]
  79. Bernath, C.; Deac, G.; Sensfuß, F. Impact of sector coupling on the market value of renewable energies – A model-based scenario analysis. Appl. Energy 2021, 281, 115985. [Google Scholar] [CrossRef]
  80. Hörsch, J.; Hofmann, F.; Schlachtberger, D.; Brown, T. PyPSA-Eur: An open optimisation model of the European transmission system. Energy Strategy Rev. 2018, 22, 207–215. [Google Scholar] [CrossRef] [Green Version]
  81. Robinius, M.; Otto, A.; Syranidis, K.; Ryberg, D.S.; Heuser, P.; Welder, L.; Grube, T.; Markewitz, P.; Tietze, V.; Stolten, D. Linking the Power and Transport Sectors—Part 2: Modelling a Sector Coupling Scenario for Germany. Energies 2017, 10, 957. [Google Scholar] [CrossRef] [Green Version]
  82. Gaete-Morales, C.; Kittel, M.; Roth, A.; Schill, W.P. DIETERpy: A Python framework for the Dispatch and Investment Evaluation Tool with Endogenous Renewables. SoftwareX 2021, 15, 100784. [Google Scholar] [CrossRef]
  83. Hilpert, S.; Kaldemeyer, C.; Krien, U.; Günther, S.; Wingenbach, C.; Plessmann, G. The Open Energy Modelling Framework (oemof)—A new approach to facilitate open science in energy system modelling. Energy Strategy Rev. 2018, 22, 16–25. [Google Scholar] [CrossRef] [Green Version]
  84. Maldet, M. RUTIS. 2022. Available online: https://gitlab.com/team-ensys/projects/maldet_energysystemmodel (accessed on 15 March 2021).
  85. Ministry of Energy Department of Economics. Israel’s Energy Sector Review for 2018. 2018. Available online: https://www.gov.il/BlobFolder/reports/energy_sector_2018/en/Review_of_energy_sector_2018.pdf (accessed on 9 March 2022).
  86. Juanico, M.; Salgot, M. Water Reuse in the Northern Mediterranean. 2022. Available online: https://www.researchgate.net/publication/228378519_WATER_REUSE_IN_THE_NORTHERN_MEDITERRANEAN (accessed on 9 March 2022).
  87. Wright, M. Most Water-Stressed Countries in the World for 2019. 2019. Available online: https://ceoworld.biz/2019/08/08/most-water-stressed-countries-in-the-world-for-2019/ (accessed on 9 March 2022).
  88. Von Pentz, L. Das Wasser Wird Knapp! 2016. Available online: https://www.cleanenergy-project.de/umwelt/ressourcenmanagement/das-wasser-wird-knapp/ (accessed on 9 March 2022).
  89. Dolna-Gruber, C. Gastbeitrag: Ein CO2-Preis in Österreich. 2021. Available online: https://positionen.wienenergie.at/blog/gastbeitrag-ein-co2-preis-in-osterreich/ (accessed on 21 December 2021).
  90. Lazarou, S.; Christodoulou, C.; Vita, V. Global Change Assessment Model (GCAM) considerations of the primary sources energy mix for an energetic scenario that could meet Paris agreement. In Proceedings of the 2019 54th International Universities Power Engineering Conference (UPEC), Bucharest, Romania, 3–6 September 2019. [Google Scholar] [CrossRef]
  91. International Institute for Applied System Analysis. Global Price of Carbon Emissions and Assessment of Comparative Carbon Prices (Figure 2.26). 2020. Available online: https://data.ene.iiasa.ac.at/sr15_scenario_analysis/assessment/sr15_2.5_carbon_price_analysis.html (accessed on 21 December 2021).
  92. Lev-On, M.; Lev-On, P.; Liebes, I.; Ayalon, O. Assessment of Greenhouse Gas Emissions Intensity from Electricity Generation in Israel Haifa Israel. 2017. Available online: https://www.neaman.org.il/EN/Assessment-greenhouse-gas-emissions-intensity-electricity-generation (accessed on 22 February 2022).
  93. Köppel, W.; Degünther, C.; Wachsmuth, J. Bewertung der Vorkettenemissionen bei der Erdgasförderung in Deutschland. 2018. Available online: https://www.umweltbundesamt.de/sites/default/files/medien/1410/publikationen/2018-01-30_climate-change_02-2018_roadmap-gas_0.pdf (accessed on 11 March 2022).
  94. IEA Bioenergy. Municipal Solid Waste and Its Role in Sustainability. 2003. Available online: https://www.ieabioenergy.com/wp-content/uploads/2013/10/40_IEAPositionPaperMSW.pdf (accessed on 10 April 2022).
  95. Quezada, G.; Walton, A.; Sharma, A. Risks and tensions in water industry innovation: Understanding adoption of decentralised water systems from a socio-technical transitions perspective. J. Clean. Prod. 2016, 113, 263–273. [Google Scholar] [CrossRef]
  96. Xu, L.; Ling, M.; Wu, Y. Economic incentive and social influence to overcome household waste separation dilemma: A field intervention study. Waste Manag. 2018, 77, 522–531. [Google Scholar] [CrossRef]
  97. Struk, M. Distance and incentives matter: The separation of recyclable municipal waste. Resour. Conserv. Recycl. 2017, 122, 155–162. [Google Scholar] [CrossRef]
  98. Li, Z.; Boyle, F.; Reynolds, A. Rainwater harvesting and greywater treatment systems for domestic application in Ireland. Desalination 2010, 260, 1–8. [Google Scholar] [CrossRef] [Green Version]
  99. Greywater and Wastewater Industry Group. Cost of Greywater System and Installation. 2021. Available online: https://www.gwig.org/cost-of-greywater-system-and-installation/ (accessed on 17 May 2021).
  100. Green Energy Lab. Hybrid LSC. 2021. Available online: https://greenenergylab.at/projects/hybrid-lsc/ (accessed on 2 July 2021).
  101. Statista. Number of Households in Israel 2020, by Household Size. 2022. Available online: https://www.statista.com/statistics/1287835/number-of-households-in-israel-by-household-size/ (accessed on 16 March 2022).
  102. Global Petrol Price. Strompreise. 2021. Available online: https://de.globalpetrolprices.com/electricity_prices/ (accessed on 16 March 2022).
  103. IEA Heat Pump Centre. Annex 32 Economical Heating and Cooling Systems for Low Energy Houses. Final Report. 2011. Available online: https://www.aramis.admin.ch/?DocumentID=63016 (accessed on 10 May 2021).
  104. Nie, J.; Li, Z.; Kong, X.; Li, D. Analysis and Comparison Study on Different HFC Refrigerants for Space Heating Air Source Heat Pump in Rural Residential Buildings of North China. Procedia Eng. 2017, 205, 1201–1206. [Google Scholar] [CrossRef]
  105. Mongird, K.; Viswanathan, V.; Balducci, P.; Alam, J.; Fotedar, V.; Koritarov, V.; Hadjerioua, B. An Evaluation of Energy Storage Cost and Performance Characteristics. Energies 2020, 13, 3307. [Google Scholar] [CrossRef]
  106. Schiermeier, Q. Wasser Marsch! 2014. Available online: https://www.spektrum.de/news/neue-methoden-zur-trinkwassergewinnung/1306738 (accessed on 21 January 2022).
  107. Ghaffour, N.; Missimer, T.M.; Amy, G.L. Technical review and evaluation of the economics of water desalination: Current and future challenges for better water supply sustainability. Desalination 2013, 309, 197–207. [Google Scholar] [CrossRef] [Green Version]
  108. Damari, Y.; Kissinger, M. An integrated analysis of households’ electricity consumption in Israel. Energy Policy 2018, 119, 51–58. [Google Scholar] [CrossRef]
  109. Paschotta, R. Warmwasser. 2021. Available online: https://www.energie-lexikon.info/warmwasser.html (accessed on 29 November 2021).
  110. Zablocki, A. Fact Sheet Energy Storage (2019). 2019. Available online: https://www.eesi.org/papers/view/energy-storage-2019#:~:text=Thermal%20energy%20storage%20can%20also,type%20of%20thermal%20energy%20used (accessed on 12 May 2021).
  111. Den Ouden, B.; Lintmejer, N.; van Aken, J.; Maarten, A.; Croezen, H.; van Lieshout, M.; Klop, E.; Waggeveld, R.; Grift, J. Electrification in the Dutch Process Industry. 2017. Available online: https://blueterra.nl/wp-content/uploads/2018/03/Electrification-in-the-Dutch-process-industry-final-report.pdf (accessed on 12 May 2021).
  112. Qadi, S.A.; Sodagar, B.; Elnokaly, A. Estimating the heating energy consumption of the residential buildings in Hebron, Palestine. J. Clean. Prod. 2018, 196, 1292–1305. [Google Scholar] [CrossRef]
  113. Ministry of Environmental Protection. Waste Facts and Figures. 2019. Available online: https://www.gov.il/en/departments/guides/waste_facts_and_figures#:~:text=The%20average%20resident%20of%20Israel,kilograms%20of%20waste%20per%20month (accessed on 16 March 2022).
  114. Scott, S.; Watson, D. Introduction of Weight-Based Charges for Domestic Solid Waste Disposal. 2006. Available online: https://mpra.ub.uni-muenchen.de/107713/1/MPRA_paper_107713.pdf (accessed on 13 May 2021).
  115. Kleppmann, F. Current Developments in European Waste-to-Energy. 2014. Available online: https://www.vivis.de/wp-content/uploads/WM4/2014_wm_49_56_kleppmann (accessed on 13 May 2021).
  116. Israel Water Authority. Challenges and Solutions for the Water Sector in Israel and the Region. 2011. Available online: https://web.archive.org/web/20140828231723/http://www.water.gov.il/Hebrew/ProfessionalInfoAndData/2012/02-Israel-Water-Sector-Overall-Review.pdf (accessed on 16 March 2022).
  117. Ayoub, M.; Rashed, I.; El-Morsy, A. Energy Production from Sewage Sludge in a Proposed Wastewater Treatment Plant. Civ. Eng. J. 2016, 2, 637–645. [Google Scholar] [CrossRef]
  118. Huber Technology Waste Water Solutions. Stromverbrauch von Kläranlagen. Available online: https://www.huber.de/de/loesungen/energieeffizienz/grundsaetzliches/klaeranlagen.html (accessed on 22 December 2021).
  119. Cecconet, D.; Raček, J.; Callegari, A.; Hlavínek, P. Energy Recovery from Wastewater: A Study on Heating and Cooling of a Multipurpose Building with Sewage-Reclaimed Heat Energy. Sustainability 2020, 12, 116. [Google Scholar] [CrossRef] [Green Version]
  120. Worldometer. Israel Natural Gas. 2015. Available online: https://www.worldometers.info/gas/israel-natural-gas/ (accessed on 1 March 2022).
  121. Global Petrol Price. Israel Erdgaspreise. 2021. Available online: https://de.globalpetrolprices.com/Israel/natural_gas_prices/ (accessed on 16 March 2022).
  122. Zhang, T. Methods of Improving the Efficiency of Thermal Power Plants. J. Phys. Conf. Ser. 2020, 1449, 12001. [Google Scholar] [CrossRef]
  123. Danish Energy Agency. Technology Data Generation of Electricity and District Heating. 2016. Available online: https://ens.dk/en/our-services/projections-and-models/technology-data/technology-data-generation-electricity-and (accessed on 12 May 2021).
  124. ESC Energy Solutions Center. 6.8 Cost of CHP: Engineering and Installation Costs. Available online: https://understandingchp.com/chp-applications-guide/6-8-rules-of-thumb-for-chp-engineering-and-installation-costs/ (accessed on 17 May 2021).
  125. Energy Storage Association. Hydrogen Energy Storage. Available online: https://energystorage.org/why-energy-storage/technologies/hydrogen-energy-storage/#:~:text=Hydrogen%20can%20be%20re%2Delectrified,as%20high%20as%2060%25 (accessed on 20 May 2021).
  126. Safari, S.; Ardehali, M.M.; Sirizi, M.J. Particle swarm optimization based fuzzy logic controller for autonomous green power energy system with hydrogen storage. Energy Convers. Manag. 2013, 65, 41–49. [Google Scholar] [CrossRef]
  127. Initiative Energie Speichern. Sauebere Energien in Gas- und Wasserstoffspeichern. 2022. Available online: https://erdgasspeicher.de/positionen/umweltvertraeglichkeit/saubere-energien-in-gas-und-wasserstoffspeichern/ (accessed on 16 March 2022).
  128. Friedrich, K.A. Wasserstoff als Chemischer Speicher: Erzeugung, Verteilung und Speicherung. 2012. Available online: https://www.dlr.de/tt/Portaldata/41/Resources/dokumente/ess_2012/Friedrich_Wasserstoff_Chemische_Speicher.pdf (accessed on 20 May 2021).
  129. Qintech Brennstoffzellen Systeme. Elektrolyseure. Available online: http://www.brennstoffzelle-energie.de/index.php/elektrolyseure/ (accessed on 12 May 2021).
  130. Glenk, G.; Reichelstein, S. Economics of converting renewable power to hydrogen. Nat. Energy 2019, 4, 216–222. [Google Scholar] [CrossRef]
  131. Hwang, J.J. Review on development and demonstration of hydrogen fuel cell scooters. Renew. Sustain. Energy Rev. 2012, 16, 3803–3815. [Google Scholar] [CrossRef]
  132. Reznicek, E.; Braun, R.J. Techno-economic and off-design analysis of stand-alone, distributed-scale reversible solid oxide cell energy storage systems. Energy Convers. Manag. 2018, 175, 263–277. [Google Scholar] [CrossRef]
  133. U.S. Department of Energy. Fuel Cells. 2016. Available online: https://www.energy.gov/sites/prod/files/2016/09/f33/CHP-Fuel%20Cell.pdf (accessed on 20 May 2021).
  134. Zappi, A.; Hernandez, R.; Holmes, W.E. A review of hydrogen production from anaerobic digestion. Int. J. Environ. Sci. Technol. 2021, 18, 4075–4090. [Google Scholar] [CrossRef]
  135. Bundesamt für Wirtschaft und Ausfuhrkontrolle. Informationsblatt CO2-Faktoren. 2021. Available online: https://www.bafa.de/SharedDocs/Downloads/DE/Energie/eew_infoblatt_co2_faktoren_2021.pdf?__blob=publicationFile&v=5 (accessed on 21 December 2021).
  136. Ritchie, N.; Smith, C. Comparison of Greenhouse Gas Emissions from Waste-to-Energy Facilities and the Vancouver Landfill. 2009. Available online: http://pentz.com/NoIncinerator/greenhouse%20Emmissions.pdf (accessed on 21 December 2021).
  137. Campos, J.L.; Valenzuela-Heredia, D.; Pedrouso, A.; del Río, A.V.; Belmonte, M.; Mosquera-Corral, A. Greenhouse Gases Emissions from Wastewater Treatment Plants: Minimization, Treatment, and Prevention. J. Chem. 2016, 2016, 3796352. [Google Scholar] [CrossRef] [Green Version]
  138. Chen, Y.C.; Kuo, J. Potential of greenhouse gas emissions from sewage sludge management: A case study of Taiwan. J. Clean. Prod. 2016, 129, 196–201. [Google Scholar] [CrossRef]
Figure 1. Use-Case Setup, based in Israel.
Sustainability 14 07445 g001
Figure 2. Optimisation Model Workflow.
Sustainability 14 07445 g002
Figure 3. Energy Recovery Contribution to Electricity and Heat.
Sustainability 14 07445 g003
Figure 4. Impact of non-usable waste energy recovery.
Sustainability 14 07445 g004
Figure 5. Hydrogen Economy Electricity Demand and Generation.
Sustainability 14 07445 g005
Figure 6. Gas-based sensitivity analysis.
Sustainability 14 07445 g006
Figure 7. Hydrogen-based sensitivity analysis.
Sustainability 14 07445 g007
Figure 8. Overview of CO2 emissions discussion points.
Sustainability 14 07445 g008
Table 1. Impact of wat er scarcity on greywater and electrolysis use.
CaseGreywater Share %Electrolysis in MWhElectrolysis Water in m 3
No scarcity constraint093302640
Limit ( f s c a r c i t y = 1 )0.393302640
Scarcity time-series17.993302640
Table 2. Impact of CO2 price and emissions minimisation.
CO2El. Grid %Gas-Grid %Gas to El. %Comb. to El. %CO2 in t/year
0 €/tCO27.520.622.551.64720
30 €/tCO27.520.92252.14647
120 €/tCO27.521.621.652.64531
500 €/tCO27.521.122.951.14477
800 €/tCO27.323.41955.84302
Opt Grid048.318.662.93561
Opt Local040.131.355.74002
Publisher’s Note: MDPI stays neutral with regard to jurisdictional claims in published maps and institutional affiliations.