Article

Impact of Openings on the In-Plane Strength of Confined and Unconfined Masonry Walls: A Sustainable Numerical Study

1
Department of Civil Engineering, University of Engineering and Technology, Lahore 54890, Pakistan
2
Department of Civil Engineering, College of Engineering, Prince Sattam bin Abdulaziz University, Al-Kharj 16273, Saudi Arabia
3
Architectural Engineering, Faculty of Engineering and Technology, Future University in Egypt, New Cairo 11745, Egypt
*
Author to whom correspondence should be addressed.
Sustainability 2022, 14(12), 7467; https://doi.org/10.3390/su14127467
Submission received: 4 April 2022 / Revised: 24 May 2022 / Accepted: 15 June 2022 / Published: 18 June 2022

Abstract

:
While openings are an essential requirement in buildings as a source of access, fresh air and sunlight, these openings cause a reduction in the lateral stiffness and torsional resistance of masonry wall units. A detailed numerical investigation was carried out to explore the impact of the opening percentage on the in-plane stiffness and lateral strength of unconfined and confined masonry wall panels prepared using calcium silicate bricks, for sustainable masonry structures. A commercially available FEM package (ANSYS) was used to carry out comparative analysis of ten wall panels, five of each type (confined and unconfined masonry walls) with concentrically located openings of varying sizes (0% to 16.5%). A simplified micro-modeling technique following the Newton Raphson Algorithm was adopted. Results revealed that the confined masonry approach unveiled a more reliable anti-seismic response along with improved in-plane strength in the case of confined masonry walls. The failure type shifted from pure flexural to more of a blend of shear and flexure after the opening percentage increased to 10.09% in unconfined masonry walls, which was not the case where confinement was provided. Based on the outcomes, it is strongly recommended to adopt confined masonry in highly seismic-prone areas to avoid catastrophic damage caused by earthquakes.

1. Introduction

The housing sector is one of the most important sections of the construction industry due to the need of shelter for humans. Although the overall geometry of a house experiences variations and improvements, important components of a house such as openings in the form of windows and doors remained permanent features of the structures as they provide access for humans and air, etc. The opening size has continuously kept on varying from one architectural plan to the other, but with time, larger size openings have gained more attraction as compared to smaller ones. The provision on large-sized openings may compromise the strength of masonry walls, especially in seismic-prone areas. This may be attributed to the provision of unsymmetrical openings in load-bearing walls, which may cause a reduction in the in-plane stiffness and lateral strength of masonry walls [1,2]. The construction of masonry houses is being practiced not only in Pakistan but throughout the world. According to media reports [3], in the 2005 Kashmir earthquake around 87,000 people including 19,000 children died and 3.5 million people were rendered homeless. Therefore, one needs to carefully consider the effect of these seismic forces in the structural design as mentioned in the latest seismic codes [4,5]. With the increase in population and recent seismic activities including large magnitude earthquakes, more emphasis should be placed on the earthquake resistance of masonry structures.
In the recent past, the concept of performance-based design has gained more attention. Further, the numerical modeling of masonry has gained importance due to the need to understand the role of masonry in earthquake-resistant structures. With the advent of digital computers and the availability of sophisticated analytical tools, the complex behavior of structures can be simulated to understand and predict failure mechanisms, which is a cost-effective solution. There are various types of numerical modeling approaches available such as simplified micro-modeling, macro-modeling, and detailed micro-modeling as shown in Figure 1.
The macro modeling approach is utilized due to fewer data processing time requirements, but at the same time it is relatively less accurate. In this technique, the whole wall is considered as one complete homogenous element with mesh size equal to the size of a brick element and the properties assigned to a masonry wall in place of brick and mortar separately [6]. Where detailed accuracy is not a major concern, the macro-modeling technique can be employed, for instance, for larger structures. In contrast to macro-modeling, in the detailed micro-modeling approach brick elements and mortar are modeled separately, having their own individual properties. Therefore, this technique requires more time to process data. However, simplified micro-modeling takes less time compared to detailed micro-modeling and is feasible for this sort of analysis. To assign the compressive and shear stress properties of mortar, springs are used, and for the bond between the brick and mortar, contact elements are utilized. Several researchers have performed finite element analyses of masonry walls to perceive the intricate performance of masonry and have presented their suggestions regarding the simplified methods [7,8,9,10,11,12]. Similarly, the failure mechanism of a brick wall with openings has been reported in the literature by many researchers [13,14,15,16]. To predict the possible failure pattern of a masonry wall, various numerical modeling techniques such as the applied element method [15], the discrete element method, the finite element method [13,14] etc., have been used by researchers. Arya and Hegemier [17] and Page [18] used the simplified approach to model masonry in which they considered the bricks as continuum elements, while they used mortar joints with masonry units for the interface elements. Lotfi and Shing [19] used an identical approach for the simulation of the cracks of the mortar joints with shear and normal stresses but did not get rewarding results in high compression cases. Finite element analysis of partially grouted masonry shear walls was carried out by Shing and Cao [20] and it was reported that the lateral strength of walls obtained experimentally was less than compared to the numerical approach. The simulation of the initiation of cracks in masonry was performed by Kumar et. al. [21] and Citto [22] in both shear and normal directions. To define a constitutive behavior a user-defined subroutine was made. All the above-mentioned studies have performed analysis on two-dimensional models and the loading conditions were in-plane and monotonic, whereas a three-dimensional analysis was performed by Aref and Dolatshahi [23] on Abaqus. The types of loading used on masonry walls were cyclic, in-plane, and out-of-plane. In order to study the mortar joints, Abdullah et al. [14] performed simplified micro-modeling by including the surface-based cohesion in Abaqus. For the simulation of masonry under compression, they used the Druker Prager model. The proposition of a combination of plasticity-based and extended finite elements for the simulation of three-dimensional non-linear masonry models was reported. The loading conditions used were monotonic in-plane, cyclic, and out of the plane. The analysis was carried out by using the Newton Raphson solution and no user-defined subroutines were used. Several researchers have assessed different parameters like ductility, energy absorption, failure mechanism, reinforcement type, aspect ratios, etc. [6,24,25,26,27,28,29]. Ahmed and Shahzada [30] assessed the seismic vulnerability of confined masonry structures using a case study by macro-modeling approach in ATENA. They performed parametric analysis on masonry strength, wall density, confining elements, and precompression loads and concluded that by increasing the masonry strength from 2 MPa to 4 Mpa, the lateral strength increased about 80%. The increase in lateral capacity was found to be 18.6% when the wall density was increased from 4.5% to 7.5%. Similarly, by increasing the steel ratio of the longitudinal reinforcement in confining elements from 0.05 to 0.4, a 26% increase in lateral capacity was observed. In some of the major seismic events such as the earthquakes of Manjil in 1990 [31], 1994 Northridge in 1994 [32], and San Fernando in 1971, it was observed that masonry structures were subjected to severe damage as compared to concrete construction, which dominated the use of reinforced concrete construction as sustainable structural design. Ahmed et al. [33] performed the validation of confined and unreinforced masonry structures by macro-modeling. The report compared already tested unreinforced masonry and confined masonry structures with their numerical results and found them to be in close comparison. It was concluded that the confined masonry structures are more suitable for seismic-prone areas because the confinement increases the ductility of masonry structures considerably. Cruz and Gavilan [34] performed an experimental study on the effect of joint reinforcement and aspect ratio on the seismic performance of confined masonry walls. They used a total of eight samples with aspect ratios of 1.46, 1, 0.59, and 0.4 with two different amounts of reinforcements in each aspect ratio. They concluded that the shear strength of walls was increased by increasing the joint reinforcement. They also concluded that the longer walls depicted a more brittle behavior. Singhal and Rai [35] performed an experimental study on eight half-scaled wall models to study the effect of toothing and openings on the in and out of plane strength of confined masonry walls. Cyclic drifts and shake table tests were performed to conclude that the interaction between the confining elements and masonry walls was enhanced by the toothing connections. They also concluded that the confinement provided around the openings was very much beneficial in terms of uniform distribution of cracks which ultimately lead to enhanced strength and deformability.
The seismic response of a structural element can be smartly approximated by the use of non-linear push-over analysis because the computation time is higher in dynamic time history analysis [36,37,38]. A prior primitive effort was made by the author to investigate the effects of openings on unconfined masonry walls. It was observed that the provision of openings reduces the lateral stiffness of unconfined masonry walls immensely [39]. Therefore, as an extension to the same work, in this article, an attempt has been made to investigate the effect of the size of openings on the lateral performance of confined and unconfined brick masonry walls, prepared using calcium silicate bricks, having an aspect ratio of 1.78 with loading applied as in-plane and quasi-static and by means of a simplified finite element approach, Figure 1b. The calcium-silicate bricks are usually preferred as they require less mortar for plastering as well as having uniform color and accurate sizes. Furthermore, these bricks offer better resistance to efflorescence and heat. Different computational strategies for masonry structures are explained in detail by Lourenco [40]. ANSYS APDL was used for numerical modeling and analysis of walls. Numerical and experimental validation of the wall model was done by using the research work published by Barraza [13]. The calibrated model was then modified with openings by changing the percentage from 1.85% to 16.5%. All the walls were also confined to see the change in the in-plane strength of masonry walls having openings. The effect on the in-plane strength and stiffness was observed, compared, and reported. Peak loads, stress diagrams, and load-displacement curves were produced and a comparative analysis of results is presented here.

2. Methodology

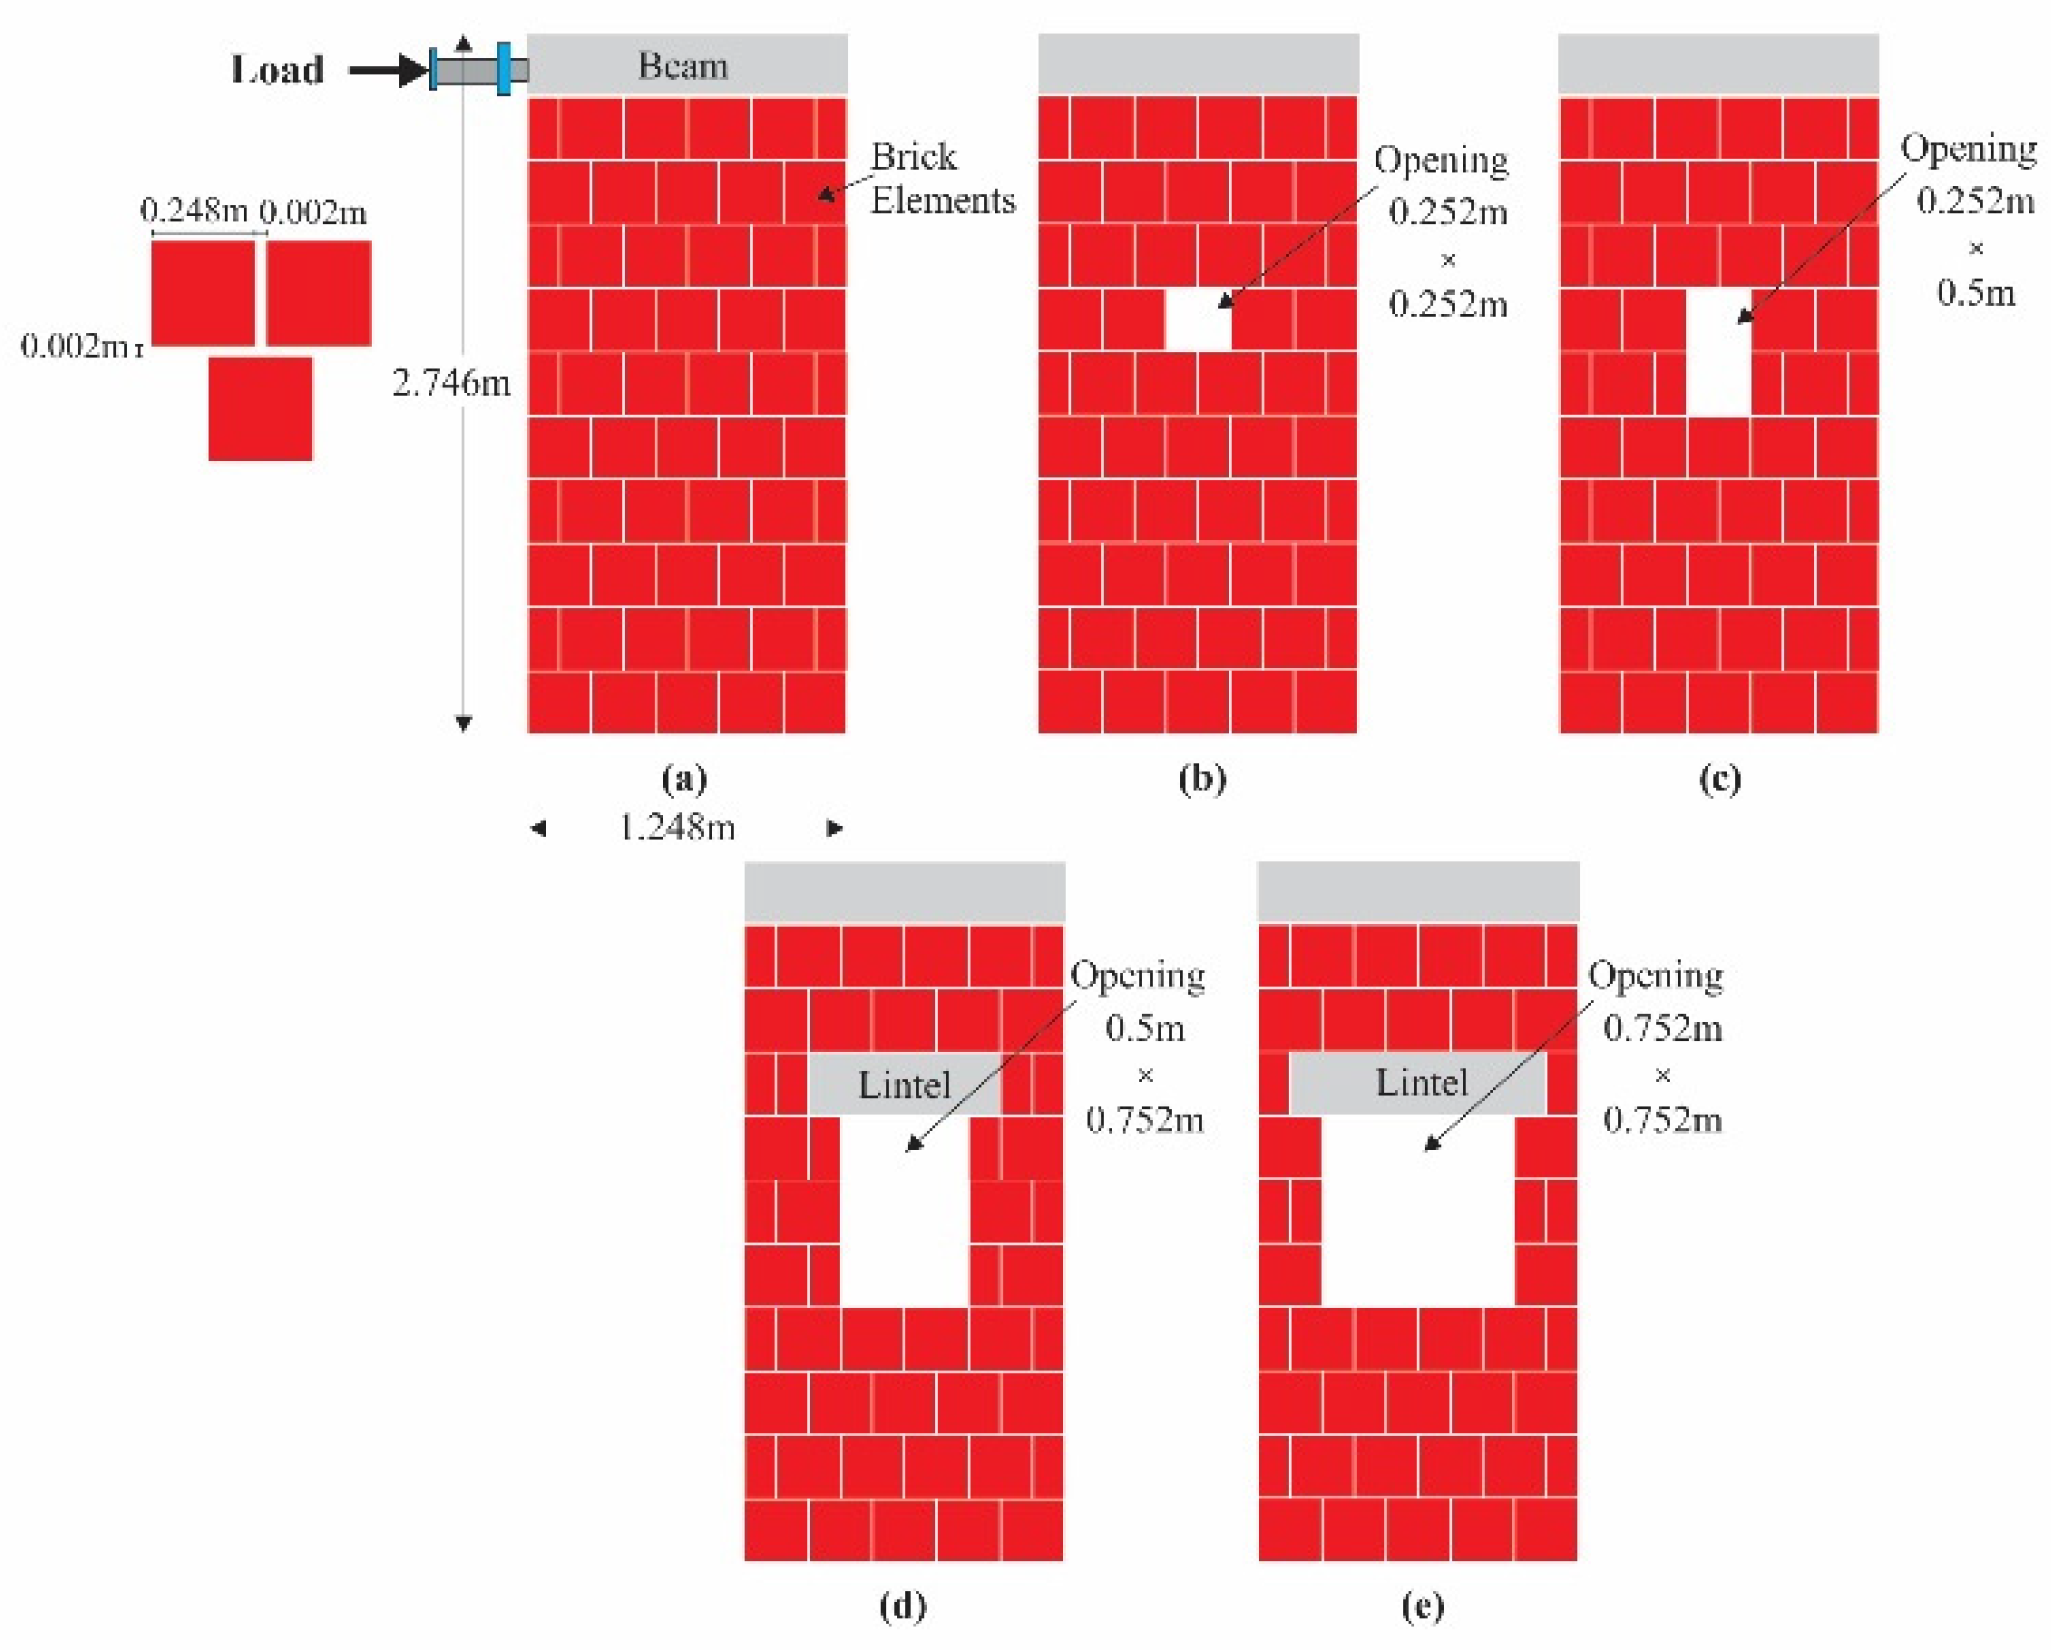
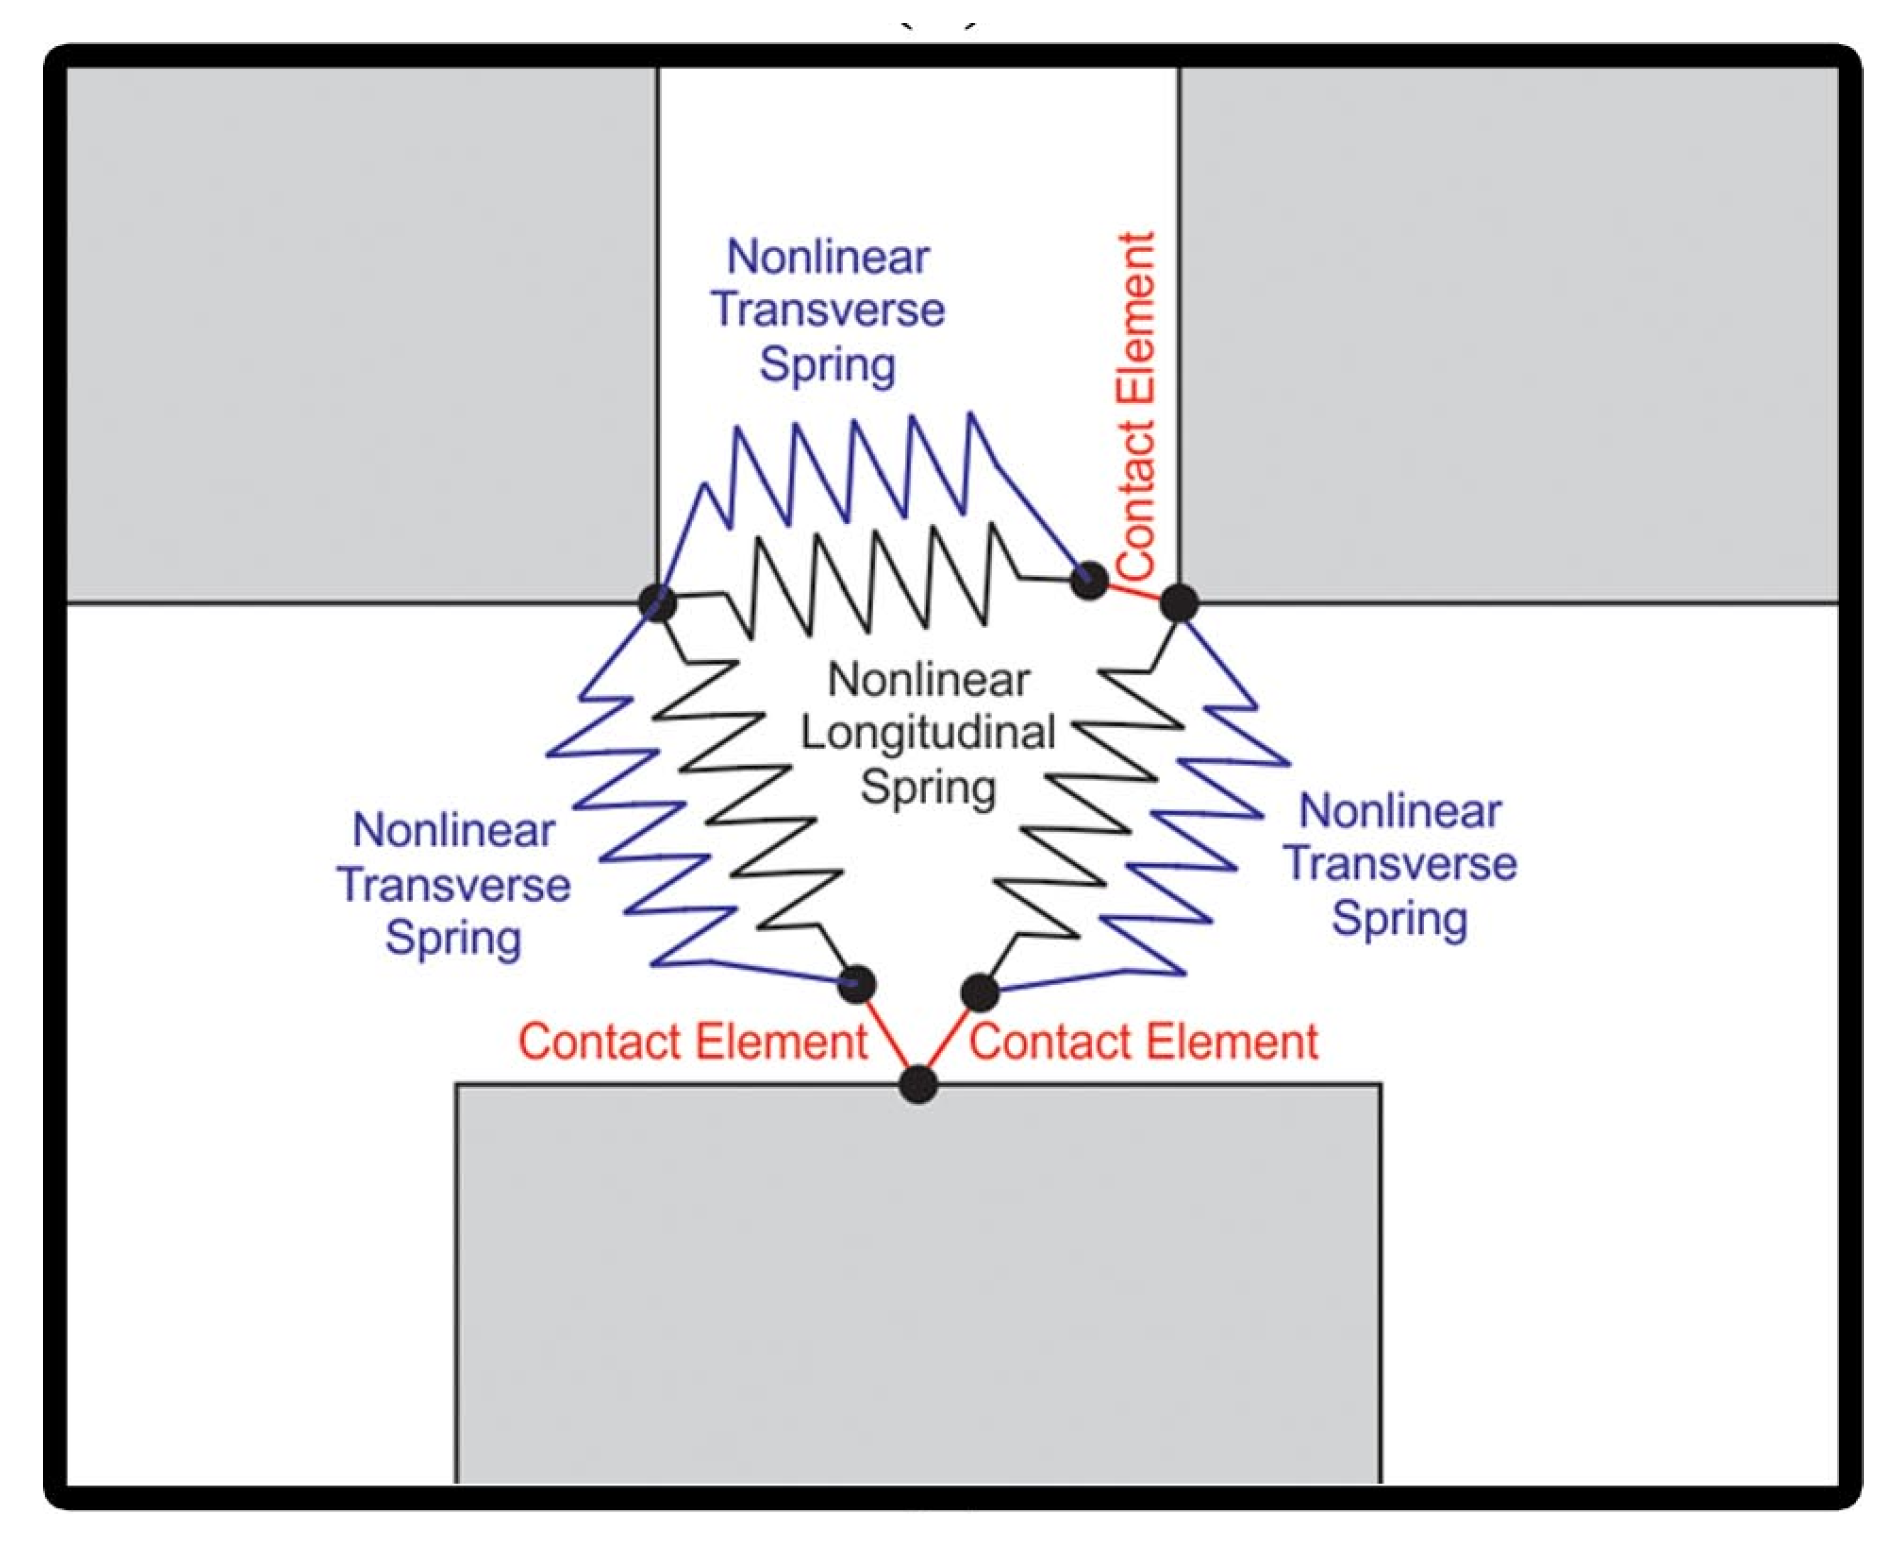
2.1. Numerical Modeling

A total of ten three-dimensional slender masonry wall panels having an aspect ratio of 1.78 including five unconfined and five confined wall panels were modeled in ANSYS APDL using a simplified micro-modeling approach. Of the unconfined masonry walls (Figure 2), the first wall (MW AR1.78–0%) had no opening and the remaining four unconfined masonry walls (MW AR1.78–1.85%, MW AR1.78–3.66%, MW AR1.78–10.91%, and MW AR1.78–16.5%) had openings of 1.85%, 3.66%, 10.91%, and 16.5%, respectively. In a similar pattern, for comparison purposes, the confined walls were also modeled of five types (CMW AR1.78–1.85%, CMW AR1.78–3.66%, CMW AR1.78–10.91%, and CMW AR1.78–16.5%) with the same percentage of openings. Schematic diagrams of the confined masonry walls are presented in Figure 3.
Solid 65 was used as the brick element because of having three degrees of freedom at every node and the property of crushing in compression and cracking in tension. The shear and compression properties of mortar were assigned to spring elements while COMBIN39 was used as the type of spring element. COMBIN39 possesses two degrees of freedom at each node and is non-linear and uni-directional with a generalized multilinear force-deflection law. To have more realistic results, in each direction, individual and separate spring elements were assigned to each node for the compression and shear. To represent the sliding and contact between the nodes in ANSYS, the element CONTA178 was used, which can be seen in Figure 4.
For steel, the element type used was Link180 and the type of material chosen was bilinear isotropic with a yield strength of 280 MPa. To predict the actual behavior, two separate springs along with a single contact element were used between brick nodes. Element properties used have been summarized in Table 1.
Element units modeled were of the size 0.248 m × 0.248 m × 0.175 m while the thickness of mortar used was kept 2 mm. These values were selected based on the experimental values used for the validation of the numerical model which was discussed in Section 2.2. Simplified stress-strain curves of brick and mortar elements were drawn and given as an input in ANSYS. See [13].
Brick elements were meshed by dividing them equally into two parts vertically. This was done to connect them with the nodes of the upper and lower layers. To predict the capacity of brick masonry walls numerically, it is better to use a running bond for the modeling of masonry walls because of the better cinematic behavior of bricks [13]. In order to input the force-deflection curves, the force was calculated from the tributary area of every node by dividing the surface of the brick into eight equal parts as shown in Figure 5.
The deflection was calculated by multiplying the strain with the length of the spring element. The length of the spring element was included as ninety percent (9/10th) of the thickness of the joint and the contact element’s length was calculated as one-tenth (1/10th) of the thickness of the joint. This was done to accommodate the insertion of the springs. The capacity of mortar in tension was added as one-tenth (1/10th) of the compressive strength and its behavior in compression was taken as tri-linear until it reached its peak, and after that the behavior was seen turning to ideal plastic.
The contact algorithm followed the pure penalty method. To incorporate the shear strength of the mortar, a value of one-tenth (1/10th) of the mortar’s compressive strength was used. It was possible to control the numerical model either by displacement or by force. In the laboratory, it is normally preferred to perform displacement control tests as compared to force control to better perform the test and to investigate the failure mechanism, which is why the analysis performed in this research followed the displacement-controlled method. The application of loads took two steps, first being the gravity load for initial compression and then the second as the lateral load. To avoid instability, the UZ direction of the model was constrained but was allowed to move freely in the UX and UY directions. In order to have a uniform distribution of gravity load, a rigid beam was provided at the top. The top surface area of the beam was utilized in the application of gravity load as load step one, whereas, in load step two, the left surface area of the beam was used for the application of a 0.05 m displacement. The solution took some time and then it converged successfully. A pushover curve was drawn and was in good agreement with the numerical and experimental curves of Barraza [13] and Magenes [41], which has been presented in Figure 6.
After calibrating the numerical model with experimental results, the research was extended by adding openings with varying percentages from 0% to 16.5% of the surface area of the walls. The opening percentages were decided considering the brick element size and are quite close to the conventional sizes used for windows. The position of the opening in all walls was also kept in the diagonal position as the extreme reduction in lateral strength takes place when the window is at the diagonal center of a masonry wall. Pushover curves were made for all walls and the effect of stiffness and strength reduction due to the percentage of openings was studied and correlated. Because the load was applied in two steps, a lintel was provided above the openings in walls ‘d’ and ‘e’ of Figure 3 for the safe transfer of the gravity load to the sides. A comparative analysis of the pushover curves of unconfined masonry walls generated by the numerical modeling depicted the maximum strength reduction due to larger-sized openings and to eliminate this reduction, all the walls were confined by giving proper toothing in alternate layers. The connection between the confining elements and bricks was also made with the help of spring elements so that it could give more realistic results. Reinforcement provided in the confining columns and beam was bonded with concrete.

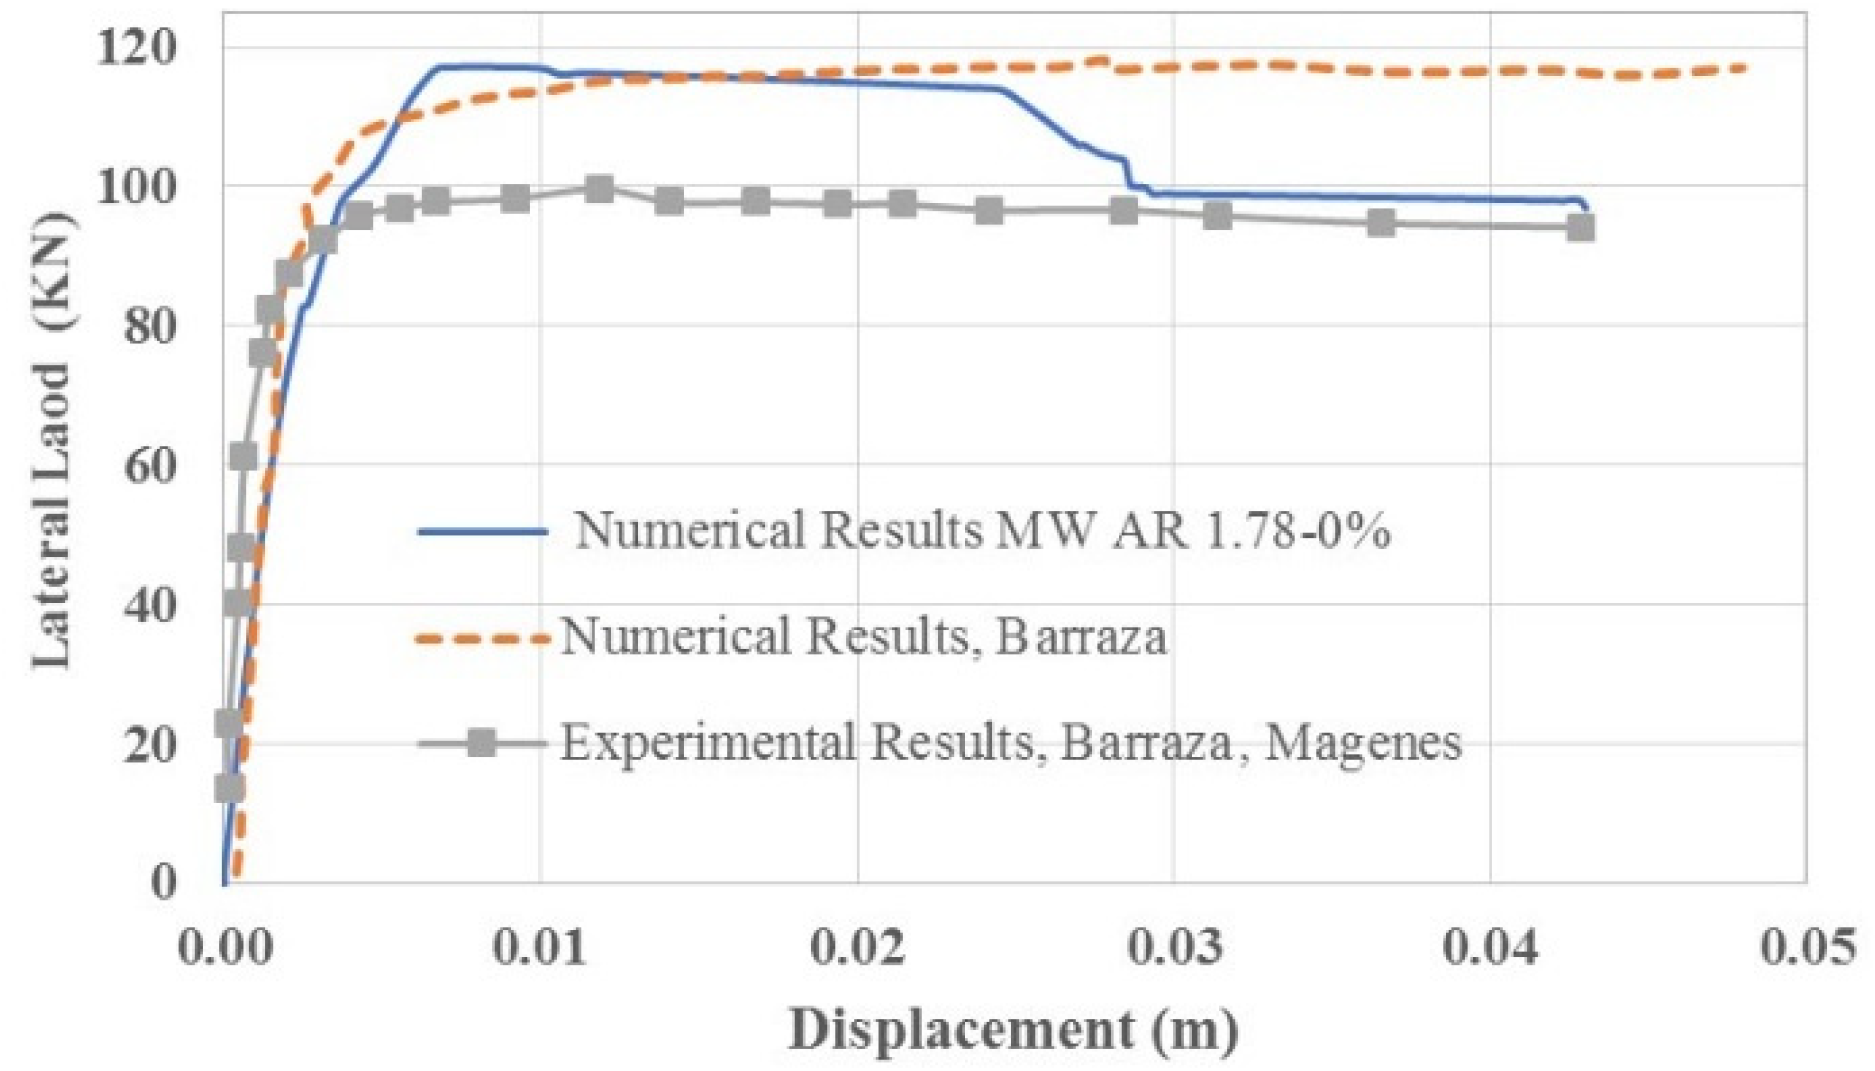
2.2. Experimental Tests and Validation

A research study based on a numerical model needs experimental validation of the numerical model to ascertain that the parameters used in the model are correct. To validate the numerical model used in this study, the experimental work reported by Barraza [13] and Magenes [41] was used. In-plane cyclic tests were performed on twenty-eight walls in the EUCENTRE laboratory for seismic testing of large structures. The walls were built on a 400 mm thick reinforced concrete floor and were clamped from the bottom with steel bars. The loading was applied with the help of servo-hydraulic actuators. Two actuators in the vertical direction applied the vertical load on the wall and one horizontal actuator was used to apply the horizontal load on the top beam. A load cell was also placed in the direction of the horizontal actuator to measure the horizontal load. The wall was restrained from out of plane bending and the displacement was measured with the help of displacement transducers. A total of twenty-five displacement transducers were installed on each wall. Due to the similarity in dimensions, out of all the walls, the wall ‘CS05′ was selected for this study. The comparison of our numerical model and experimental work reported by Barraza [13] is presented in Figure 6. From the figure, it is clear that the numerical model used in this study can be used to validate the results of other masonry walls as well. After validation, the research was extended to model further walls with different openings to see the impact of the change in the percentage of openings in unconfined and confined masonry walls. All the walls had the same loading and boundary conditions.

3. Results and Discussion

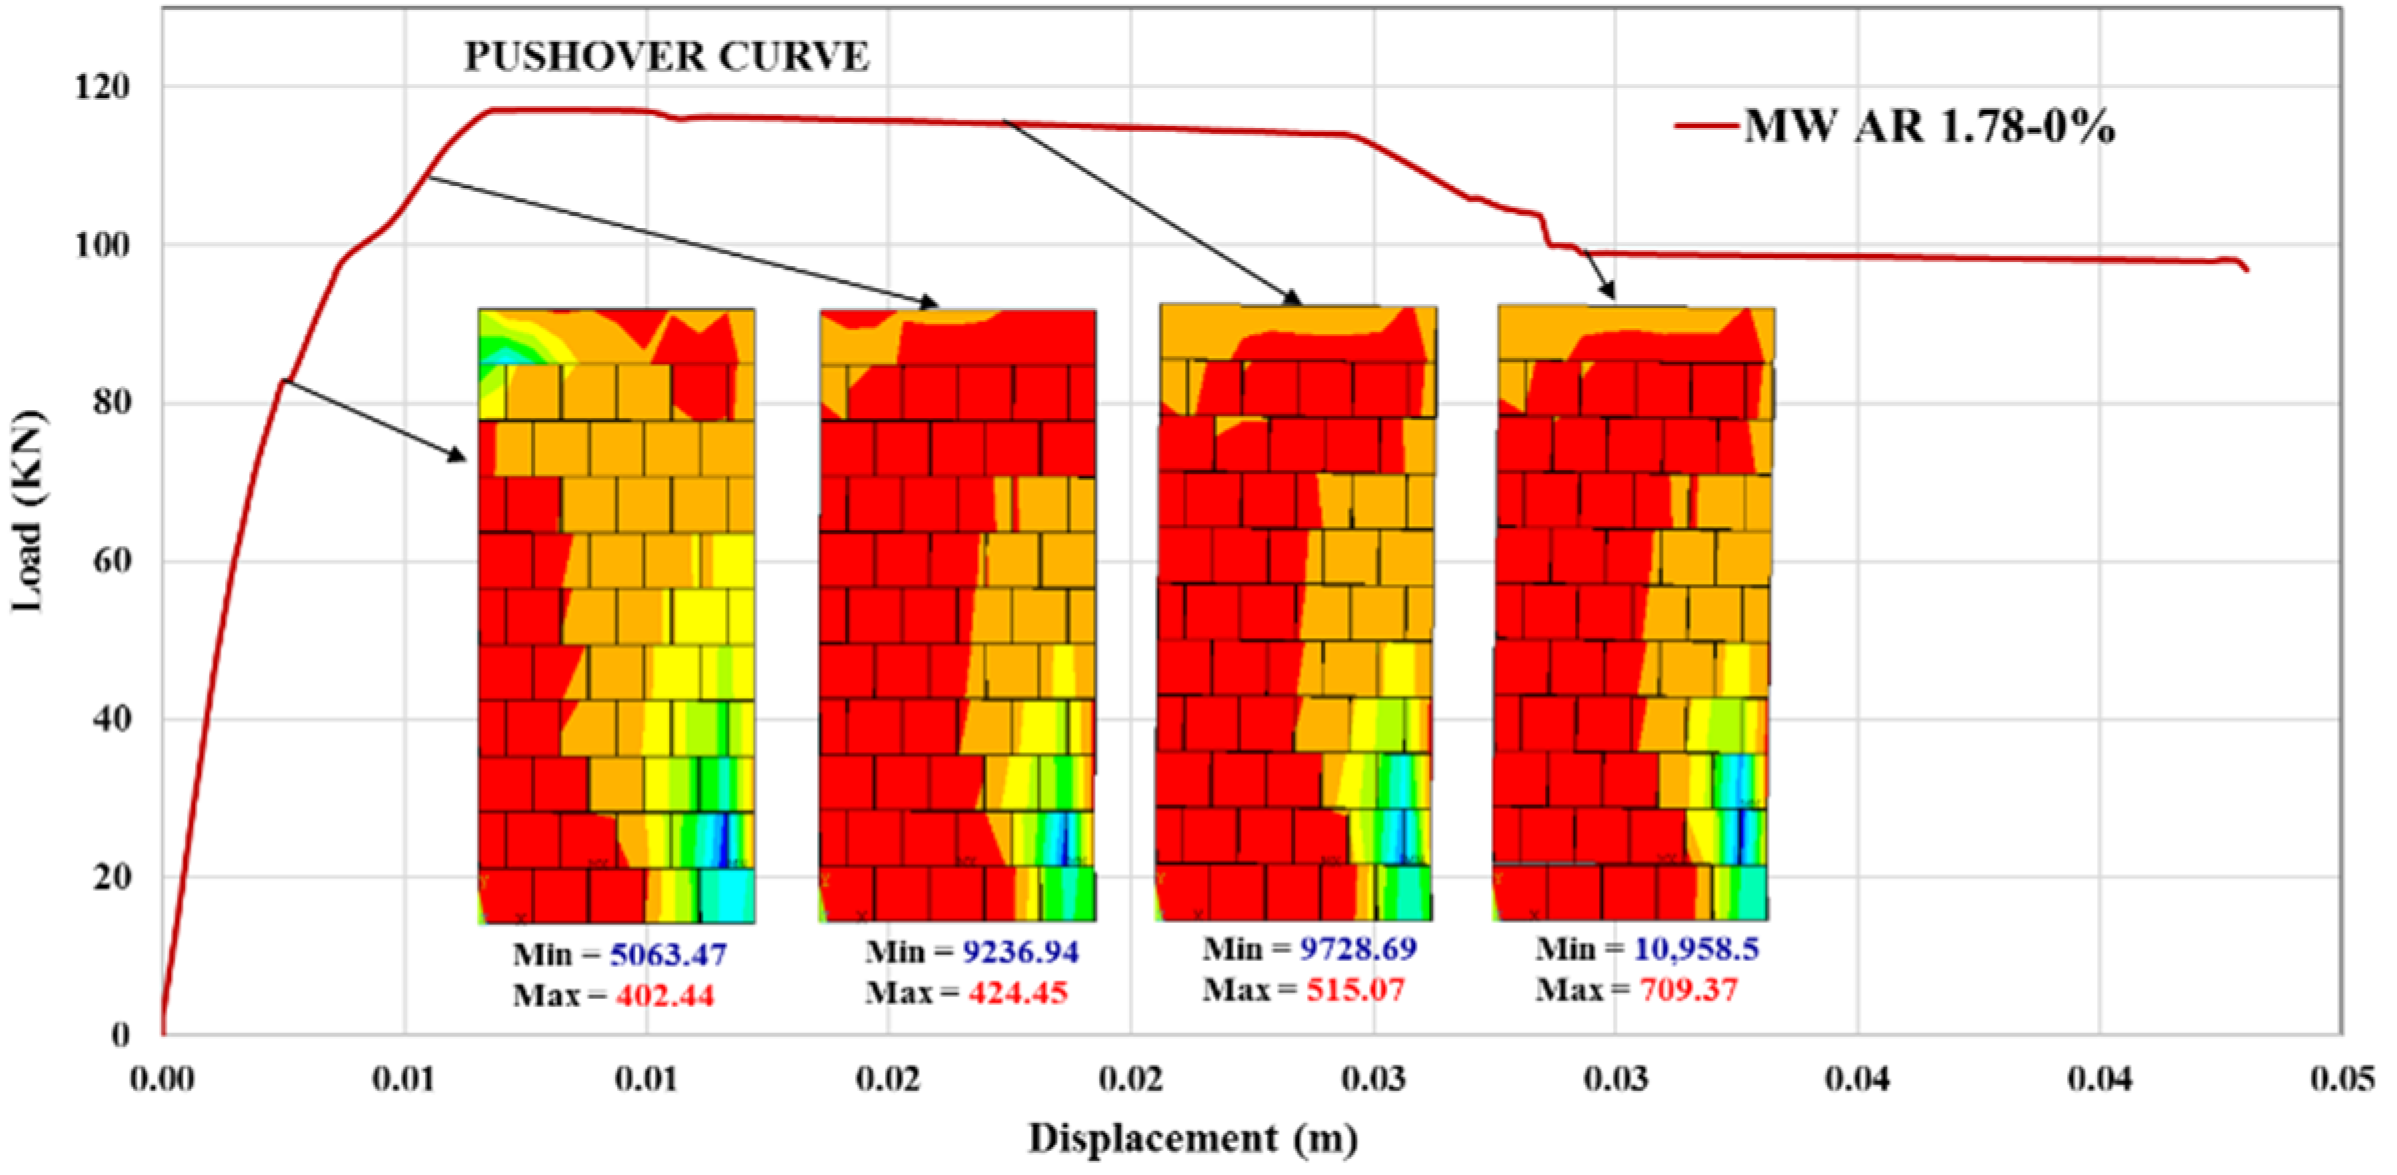
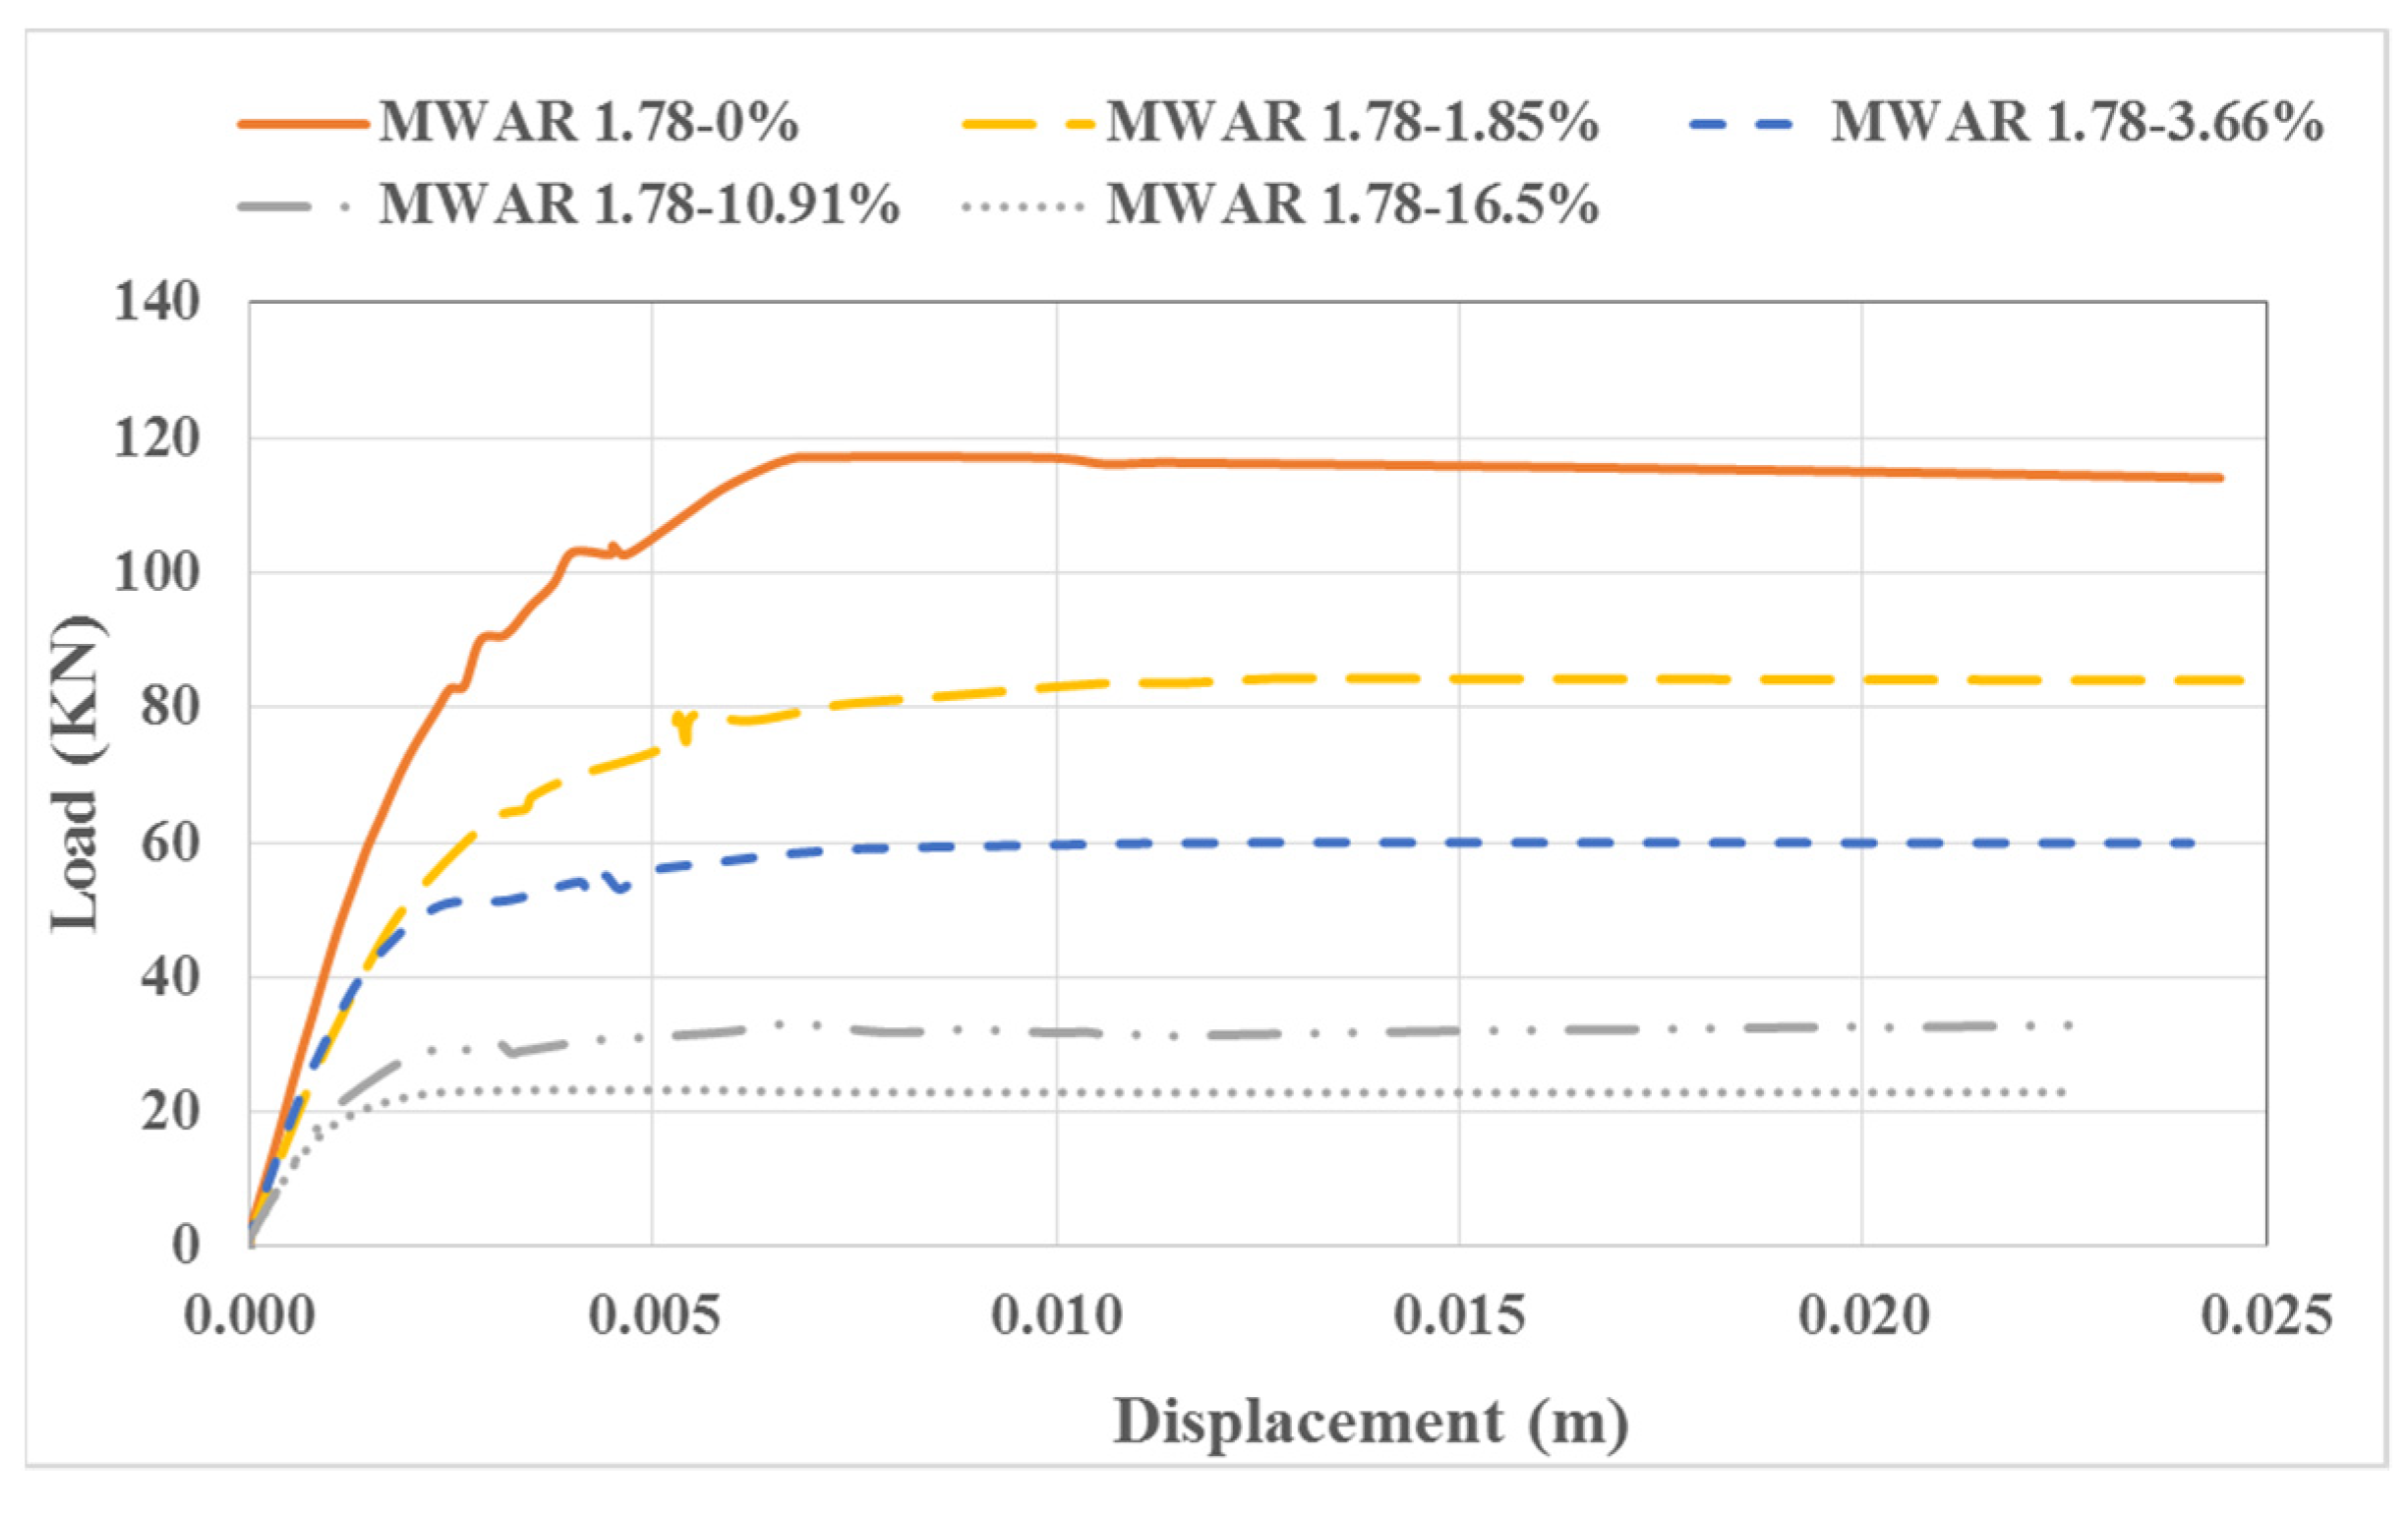
3.1. Performance of Unconfined Masonry Walls against Lateral Loading
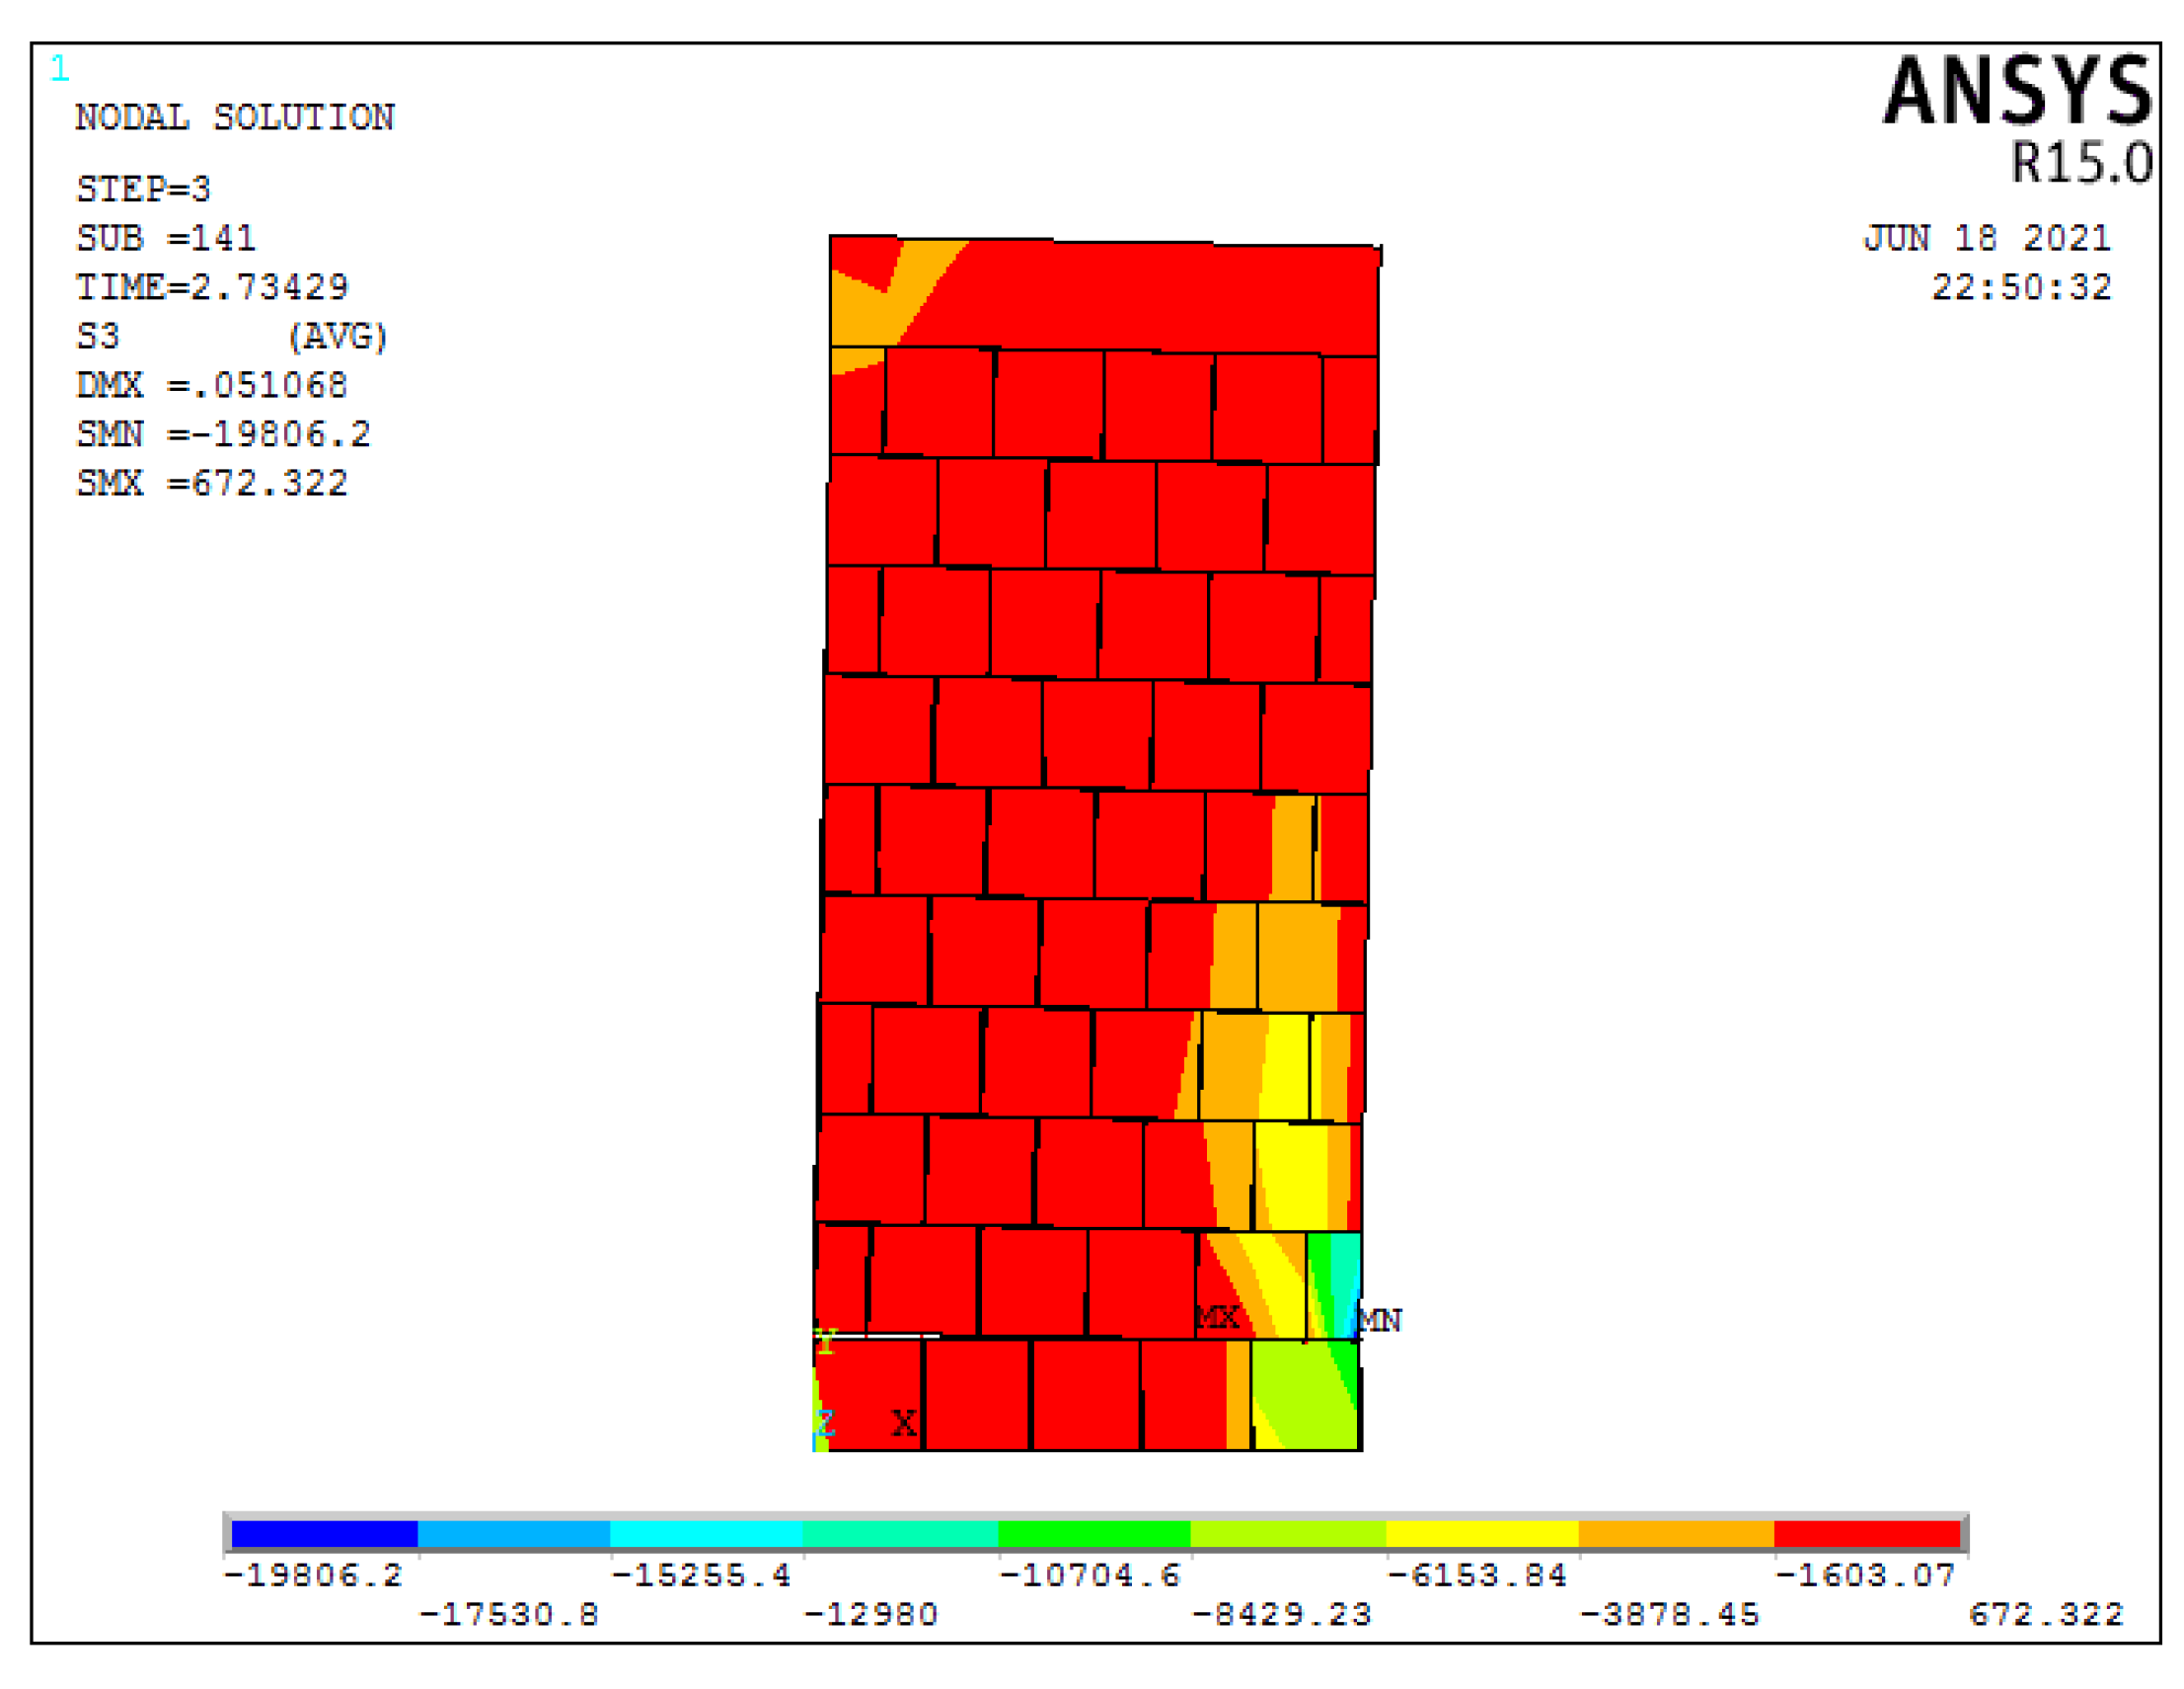
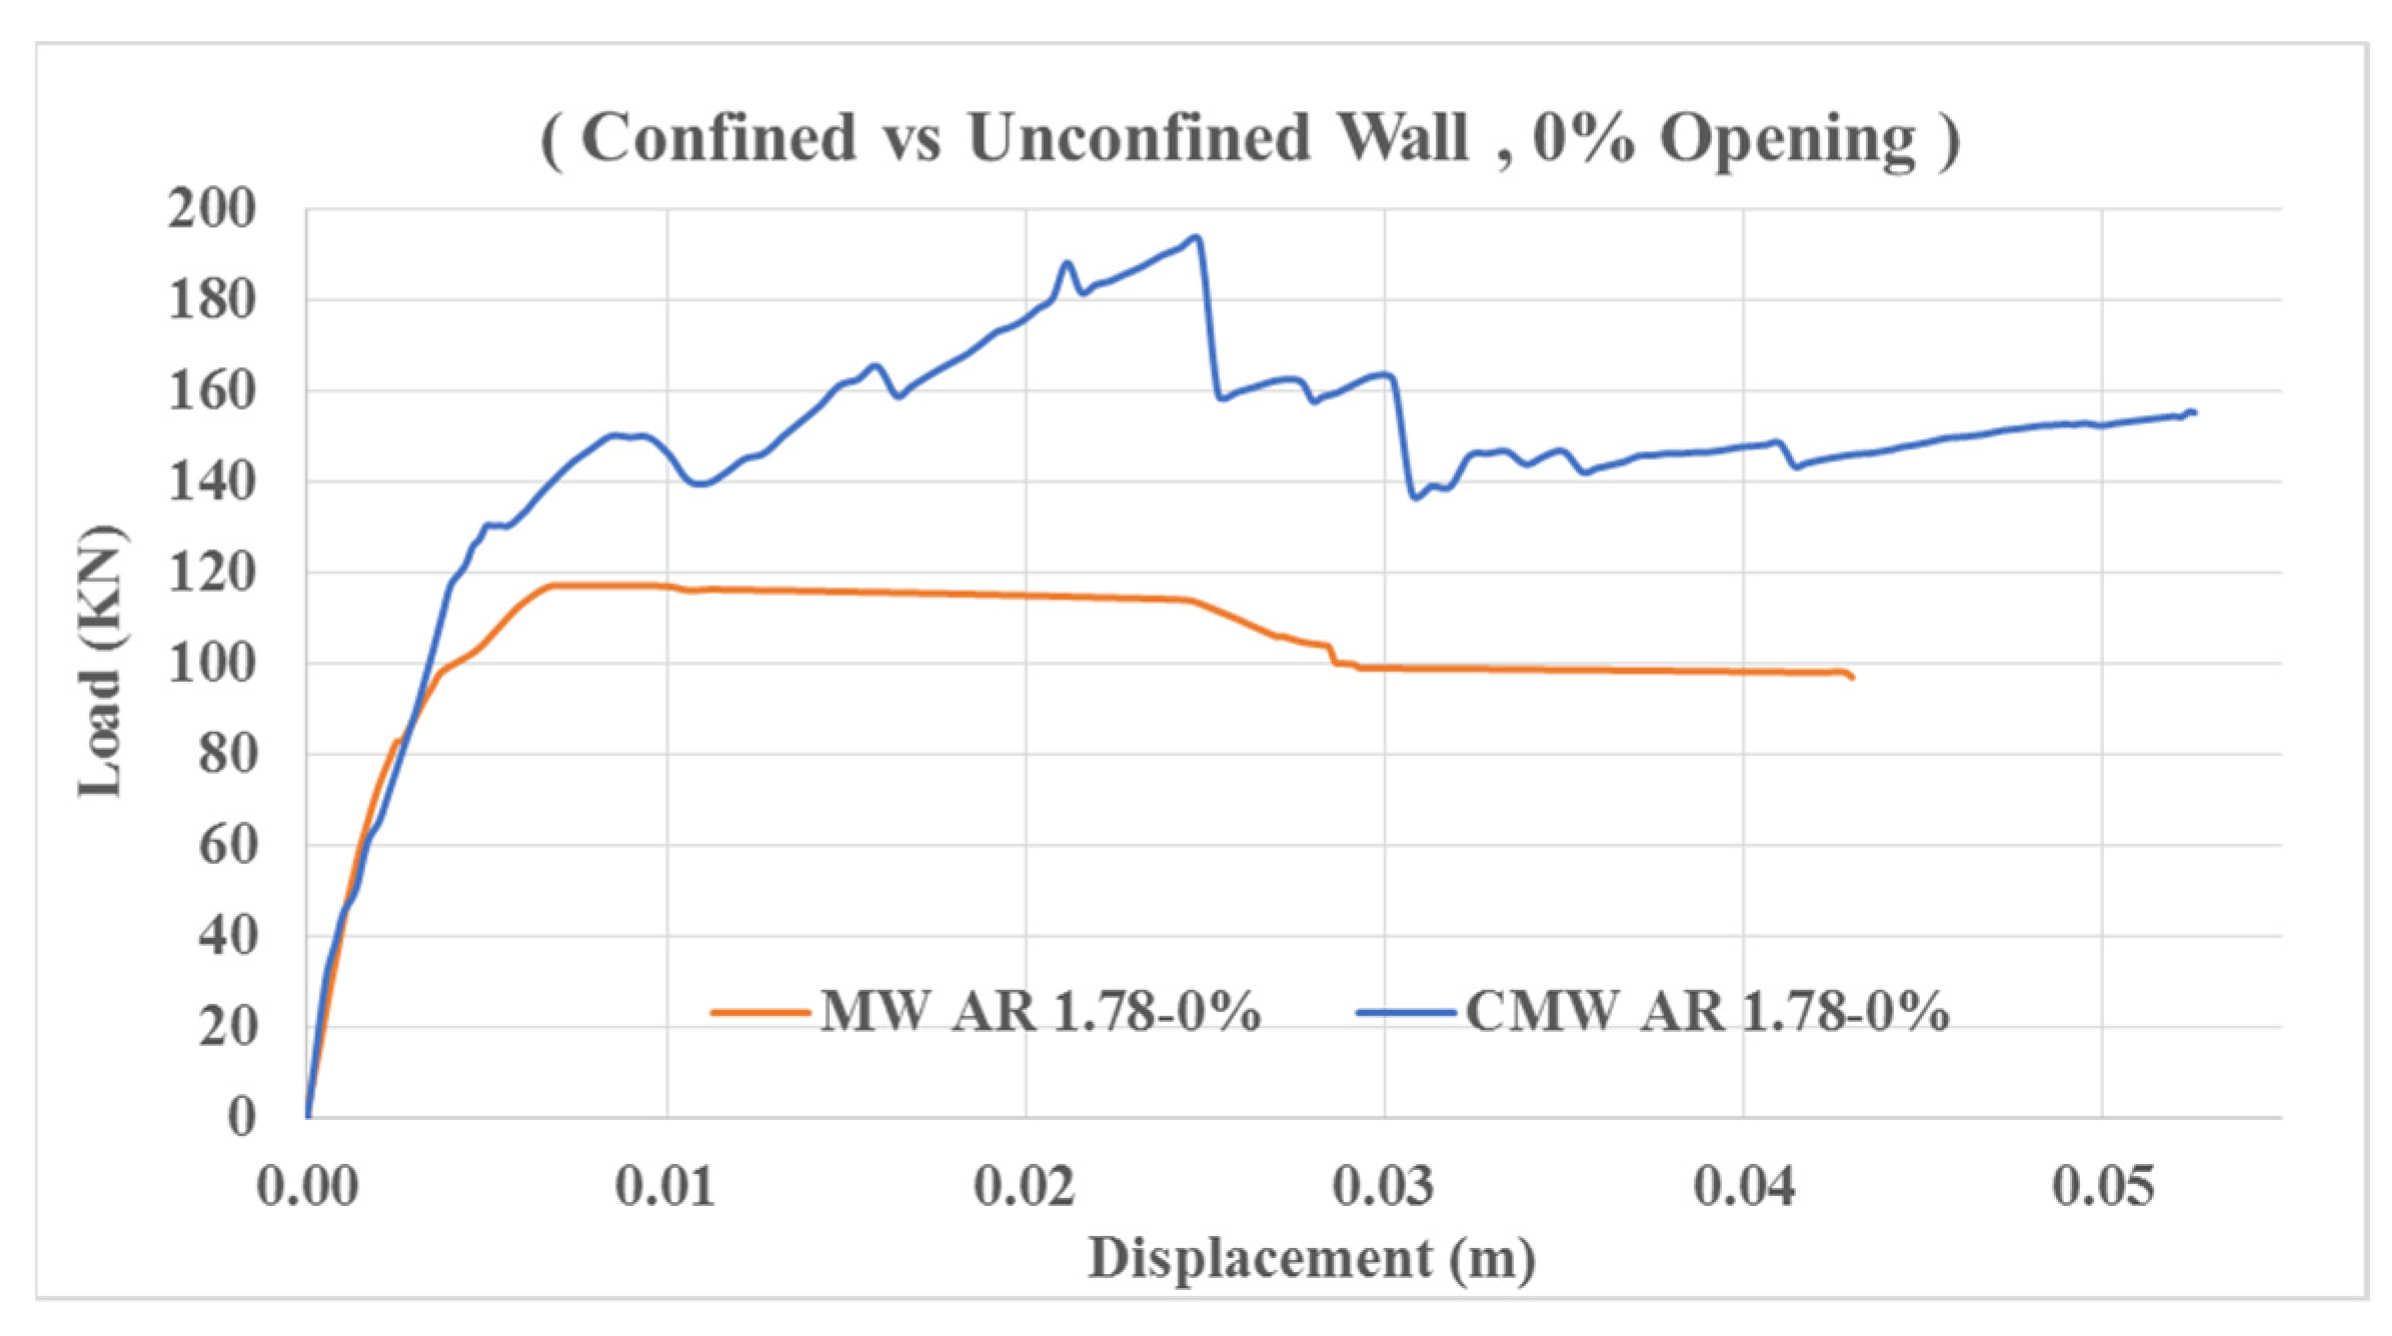
3.1.1. MW AR1.78–0%

The pushover curve along with the stress distributions at all the three parts of the load-displacement curve has been presented in Figure 7.
The linear part of the curve up to the value of 82.8 kN indicates that the load was taken by the masonry unit and no cracks had developed yet. At 82.8 kN, crack initiation can be seen in the masonry wall, and then the curve changes from linear to parabolic. In this region, some more cracks can be seen as the maximum mortar strength is about to be utilized. The curve goes up to a maximum value of 117 kN and then softening starts. The displacement keeps on increasing but the load remains almost the same. The crack widens and the wall tilts to the right side, creating compression on the right bottom of the wall and tension on the left bottom of the wall causing a flexural failure, which can be seen in the same figure. Similar patterns of load-displacement curves were explained by Lourenco in 1996. From the constitutive relationships in it, it is clear that the cracks will not pass through the bricks as the mortar strength is less and the crack initiation will be along the mortar joints. Similarly, by increasing the percentage of openings, a reduction in lateral load-carrying capacity was observed in all the walls. A comparison of the push-over curves of unconfined masonry walls having different percentages of openings is presented in Figure 8 and stress distributions in all the walls are presented in Figure 9, Figure 10, Figure 11, Figure 12 and Figure 13.

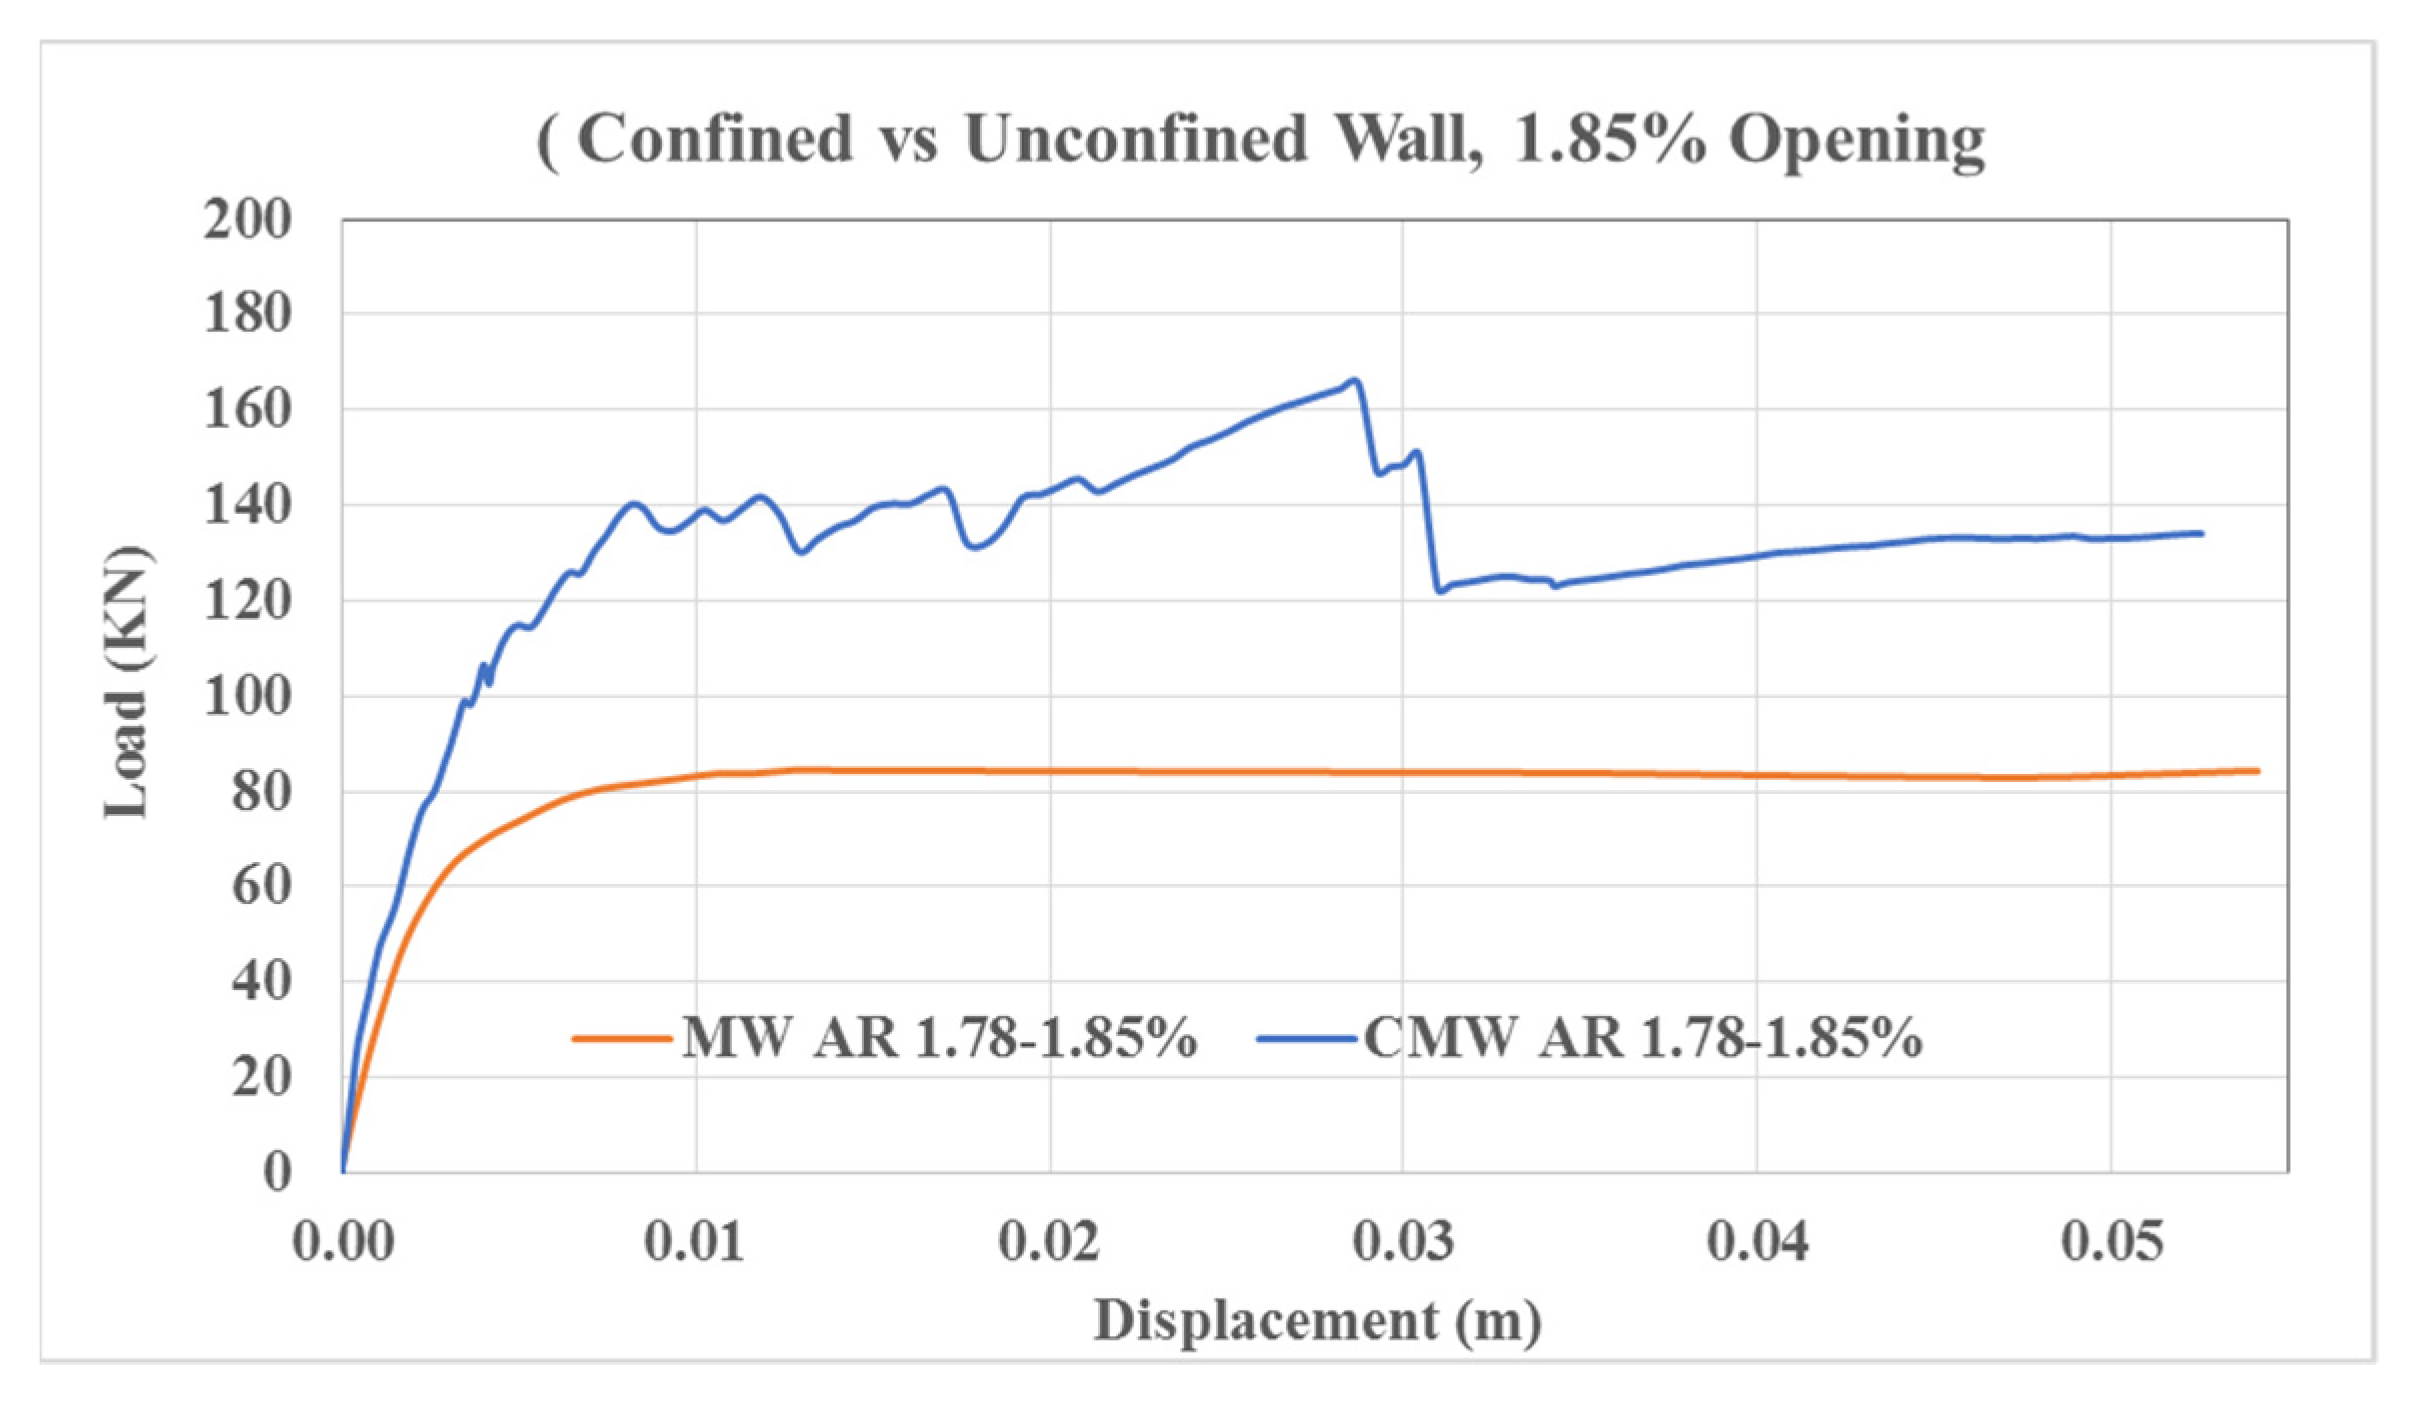
3.1.2. MW AR1.78–1.85%

The load-displacement curve of the unconfined masonry wall having an opening of 1.85% followed a similar trend (Figure 8), but with an approximate reduction of 28% in the lateral load-carrying capacity. The linear part of the load-displacement curve up to around 50 kN shows that the load was being taken by the masonry unit with no cracks yet developed. Soon after that, the curve starts changing to parabolic with some initial cracks, and then it goes up to a maximum value of 84.44 kN. This reduction in the maximum lateral load-carrying capacity is due to the small opening present in the diagonal compression of the masonry wall, shifting the diagonal compression a little to the right side of the masonry wall (Figure 10) with a reduction of 28.5% in the lateral stiffness. To calculate the stiffness, the slope was obtained from the first elastic part of the stress-strain curves. The failure in this wall remains flexural and the place of the crack opening also remains the same as that of the MW AR1.78–0%. It can be seen that even a small opening can make a difference in the in-plane load-carrying capacity of slender masonry walls. However, this effect may be less in masonry walls with an aspect ratio equal to one or more.

3.1.3. MW AR1.78–3.66%

In masonry wall MW AR1.78–3.66%, the opening size was increased to 3.66% of the wall area. The load-displacement curve in Figure 8 follows a straight line up to a value of 41.27 kN, and after that it changes to parabolic and cracking starts. It further goes higher to a maximum value of 59.89 kN. Once the maximum capacity is achieved, the wall starts tilting to the right side, causing the crack to widen at the toe of the wall. At the same time, concrete crushing can also be seen at the heel of the wall. The stress distribution in Figure 11 shows that due to the increase in this opening percentage, the width of diagonal compression decreased and it shifted to the right side of the opening. The failure type remained flexural. The percentage reduction in stiffness was calculated as 50.83%, which indicates that an opening of around 4% can decrease the stiffness by up to 50% in slender masonry walls.

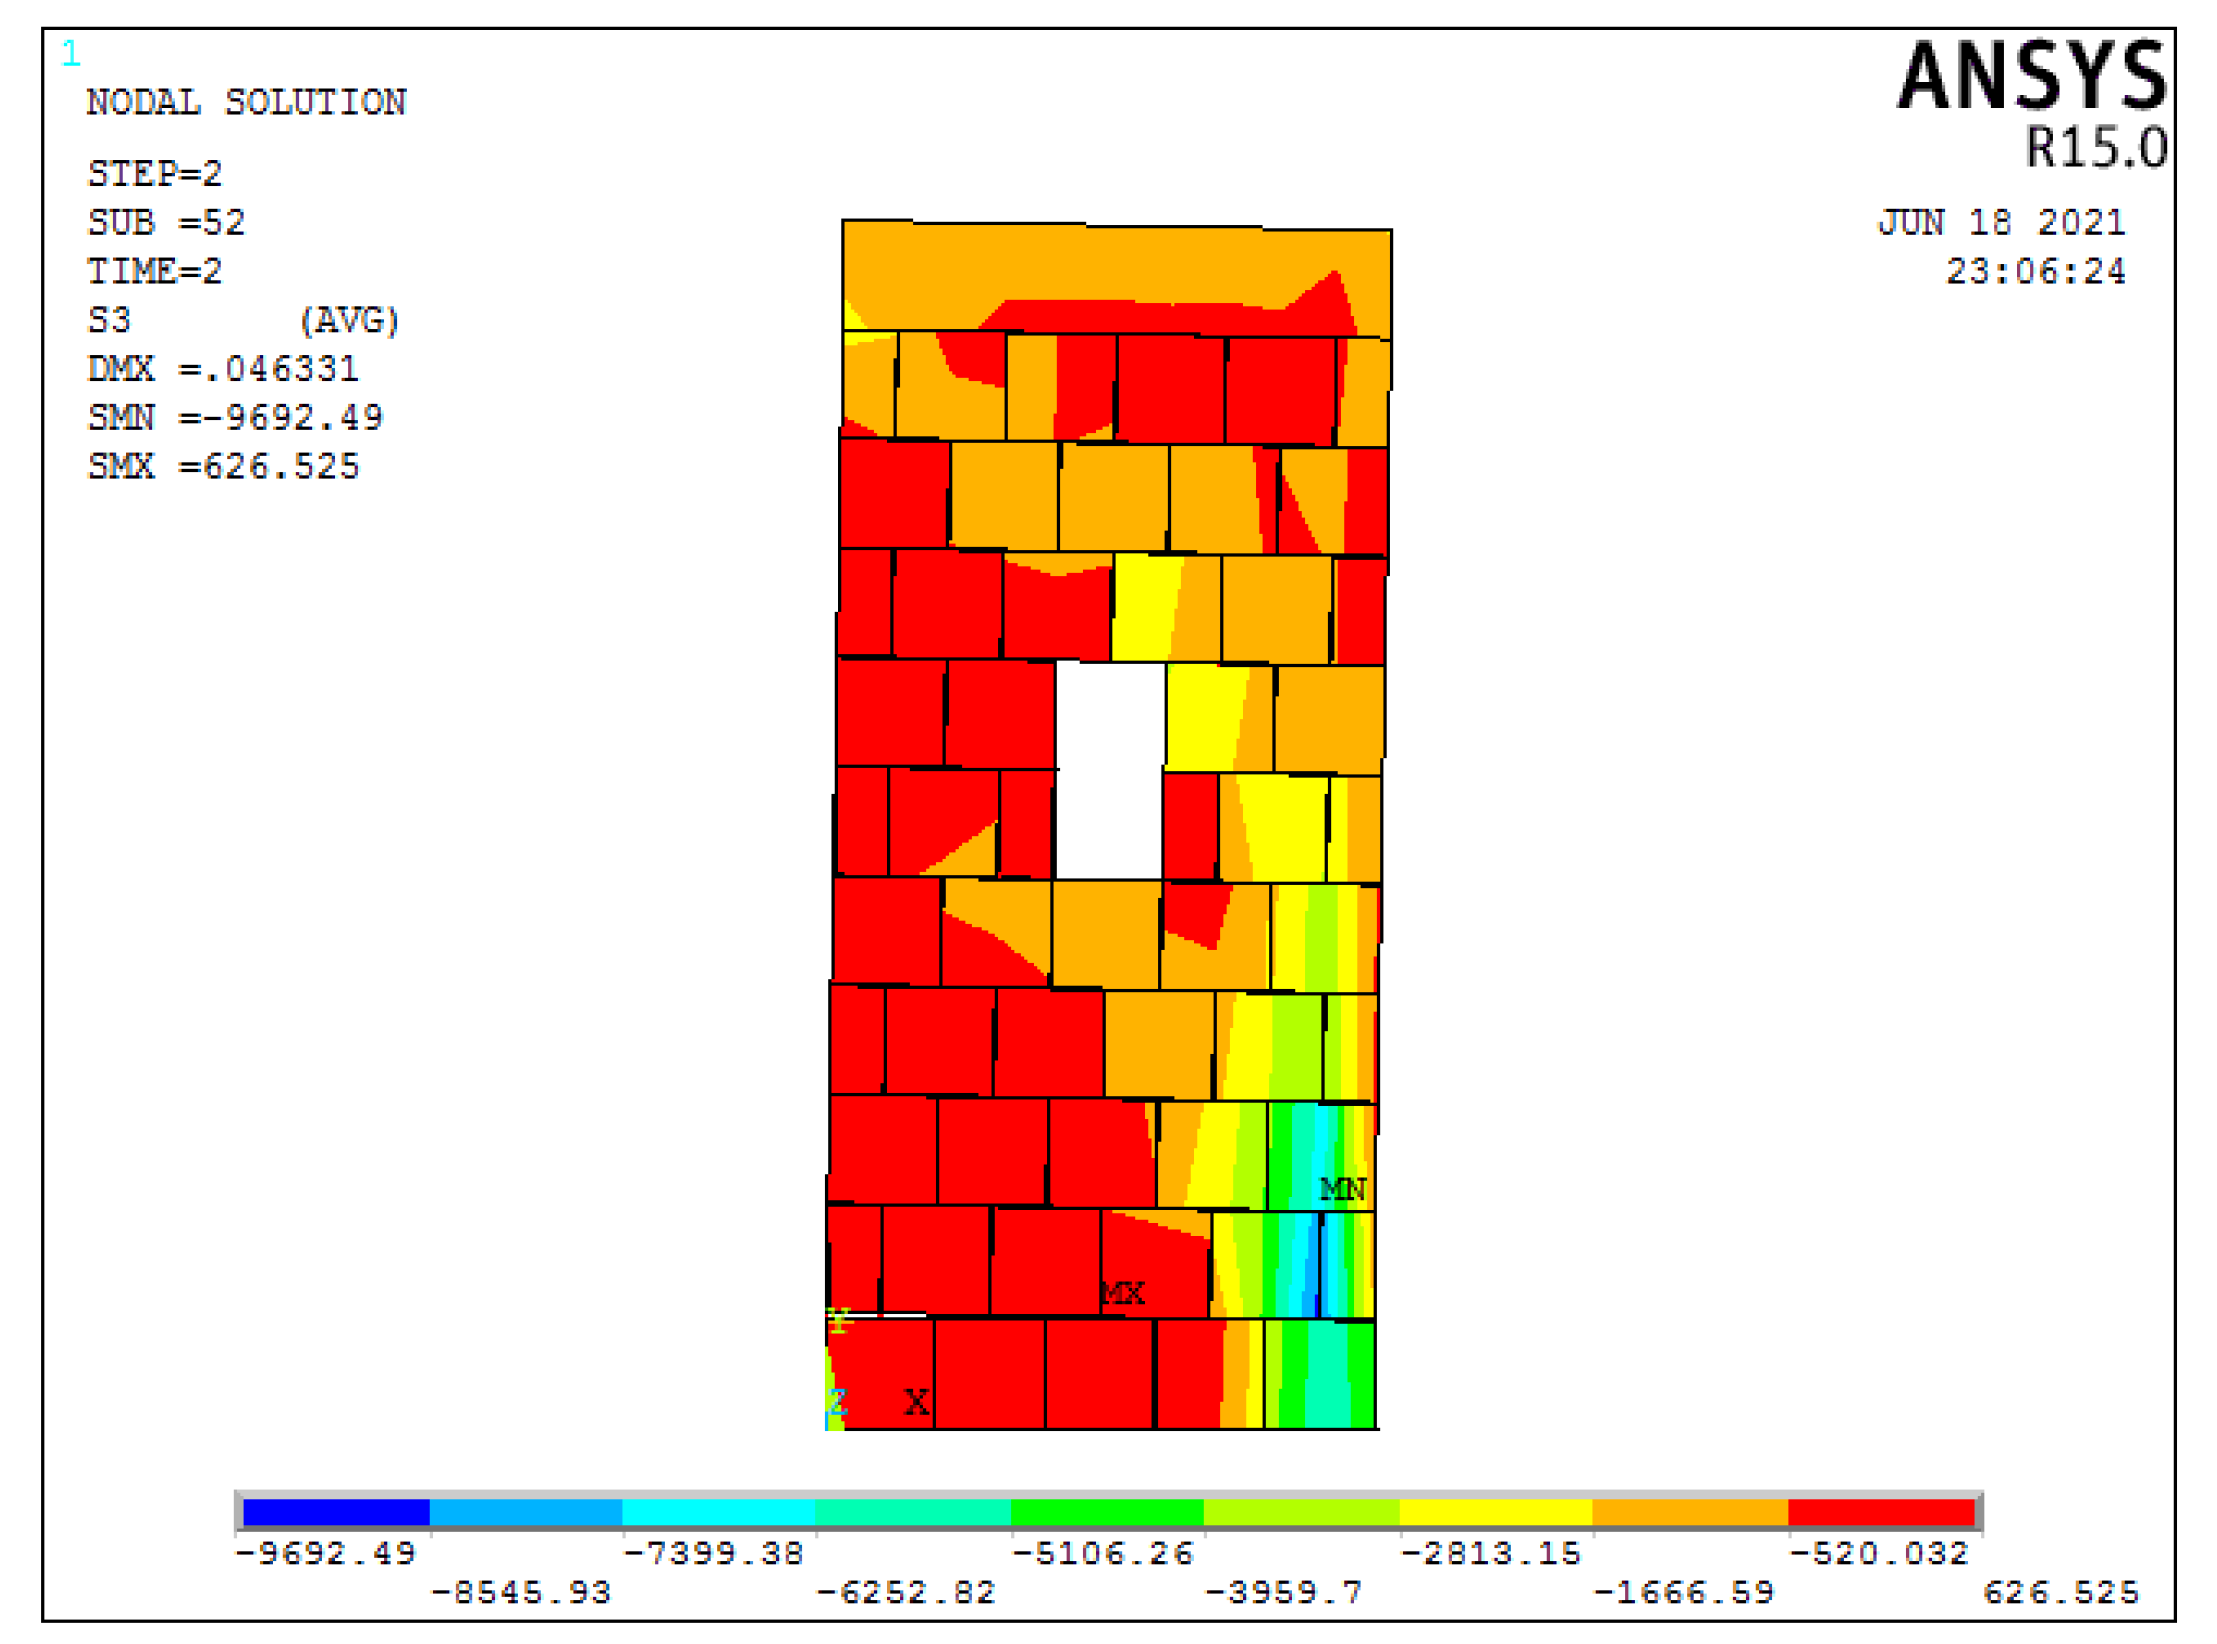
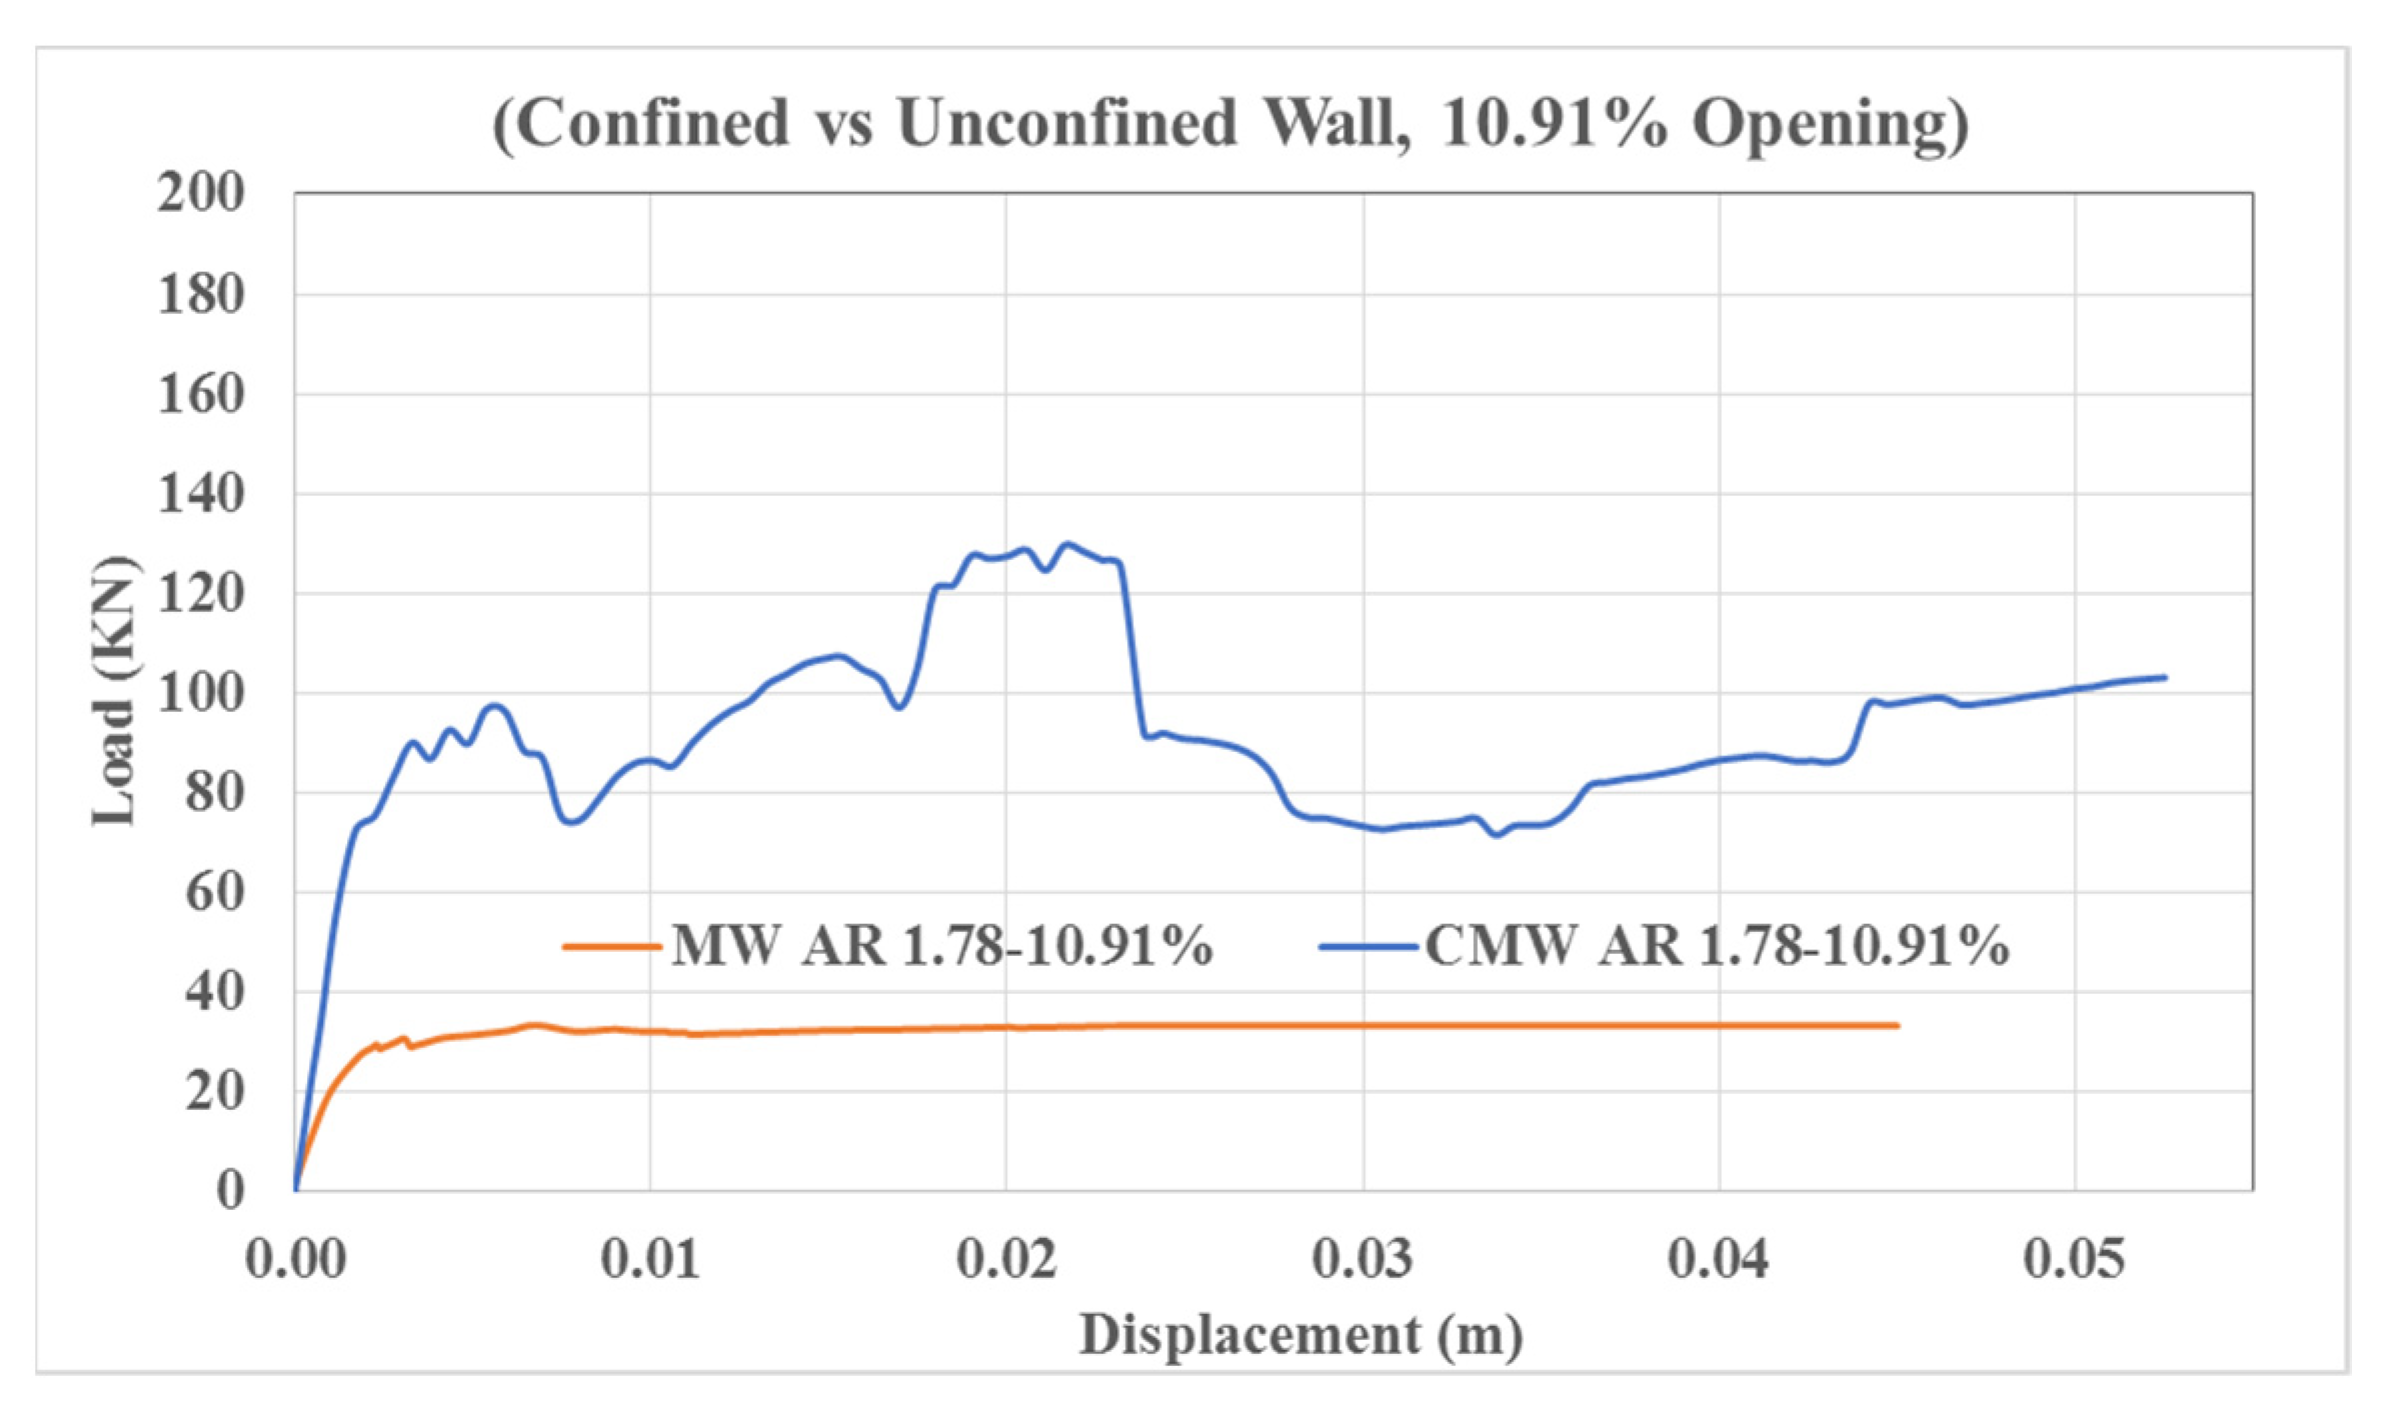
3.1.4. MW AR1.78–10.91%

In MW AR1.78–10.91%, the opening area became higher than the wall area present on each side of the opening. The load-displacement curve of MW AR1.78–10.91% in Figure 8 remained straight only up to 20 kN, and after that the crack initiation started. This wall gave a maximum lateral load-carrying capacity of 33.22 kN. The stress distribution in Figure 12 does not indicate a pure diagonal compression as the stresses are distributed over the whole wall area. The maximum and minimum principal stress locations are also shifted upwards to the window corners. The place of the crack opening also changed from the lower left bottom of the masonry wall to the right bottom corner of the window. One thing that can be noted here is that, when the wall area present at both sides of the opening was more than the opening area, the failure remained flexural and the place of crack opening also remained the same, but when the wall area present at both sides of the opening became less than the opening area, the place of the crack initiation changed and shifted to the corner of the window, which can be seen in Figure 12. The failure type now changed to a combination of shear and flexure. The percentage reduction in stiffness also increased to 61.93%.

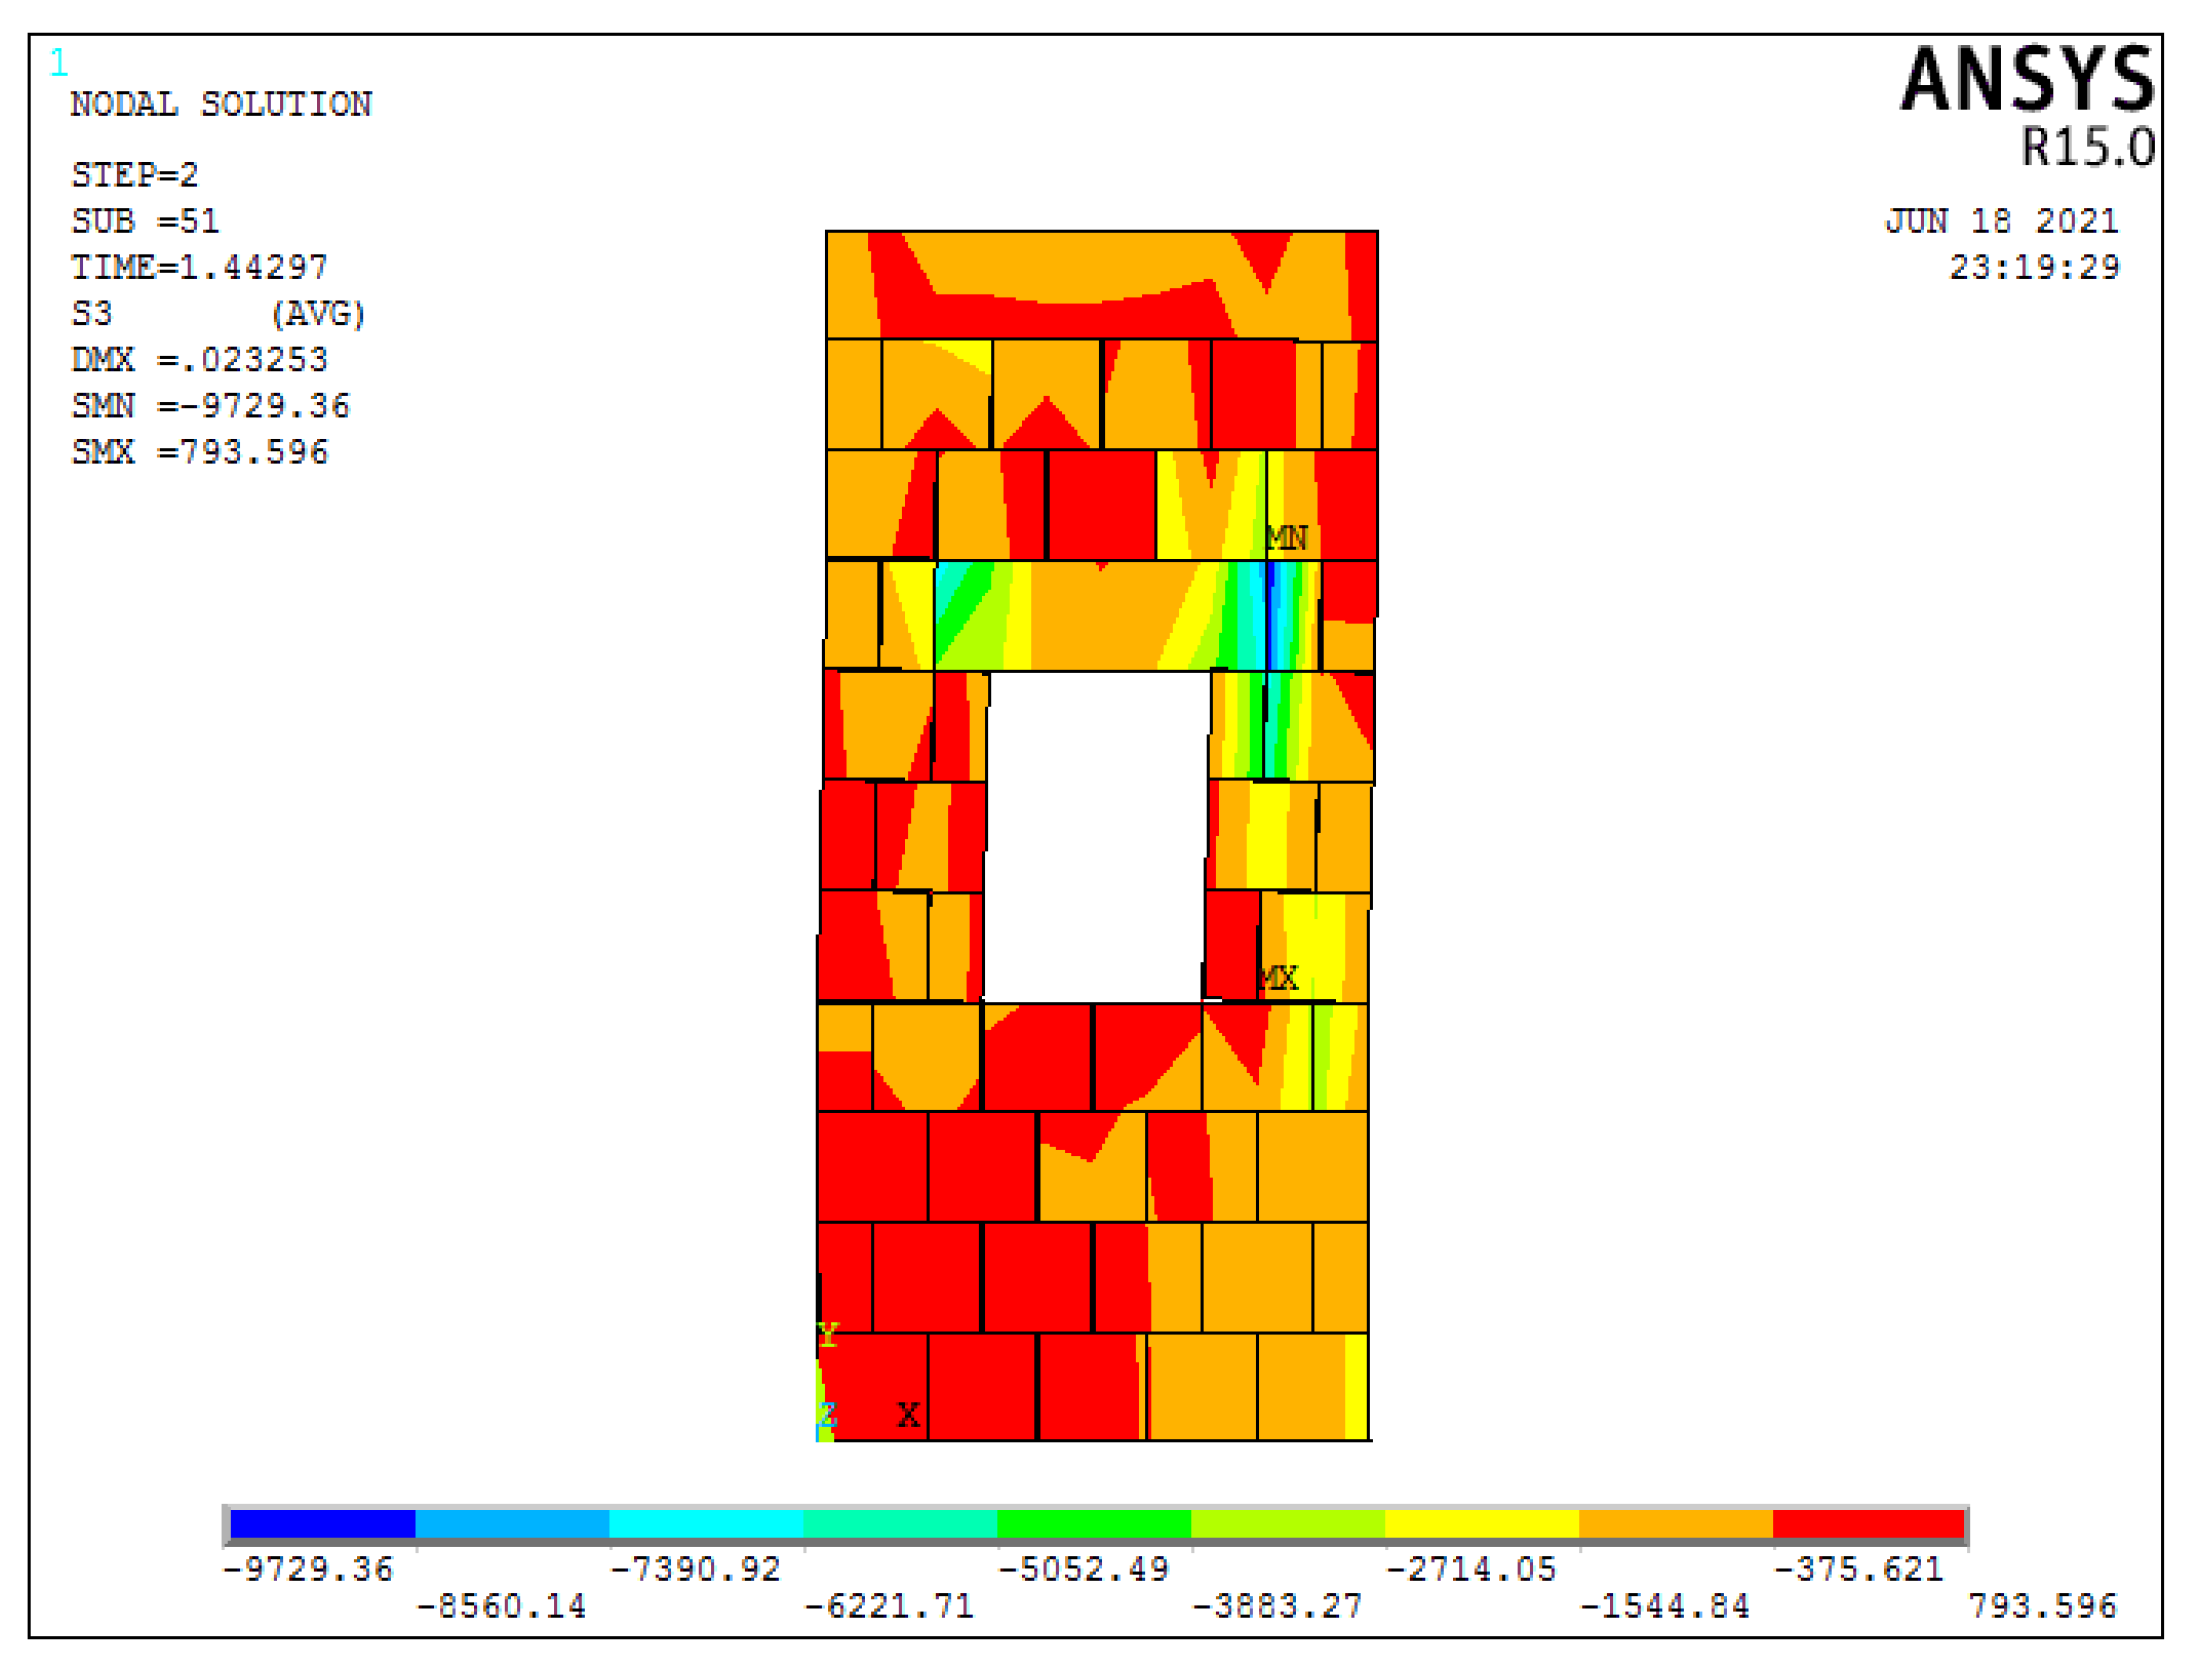
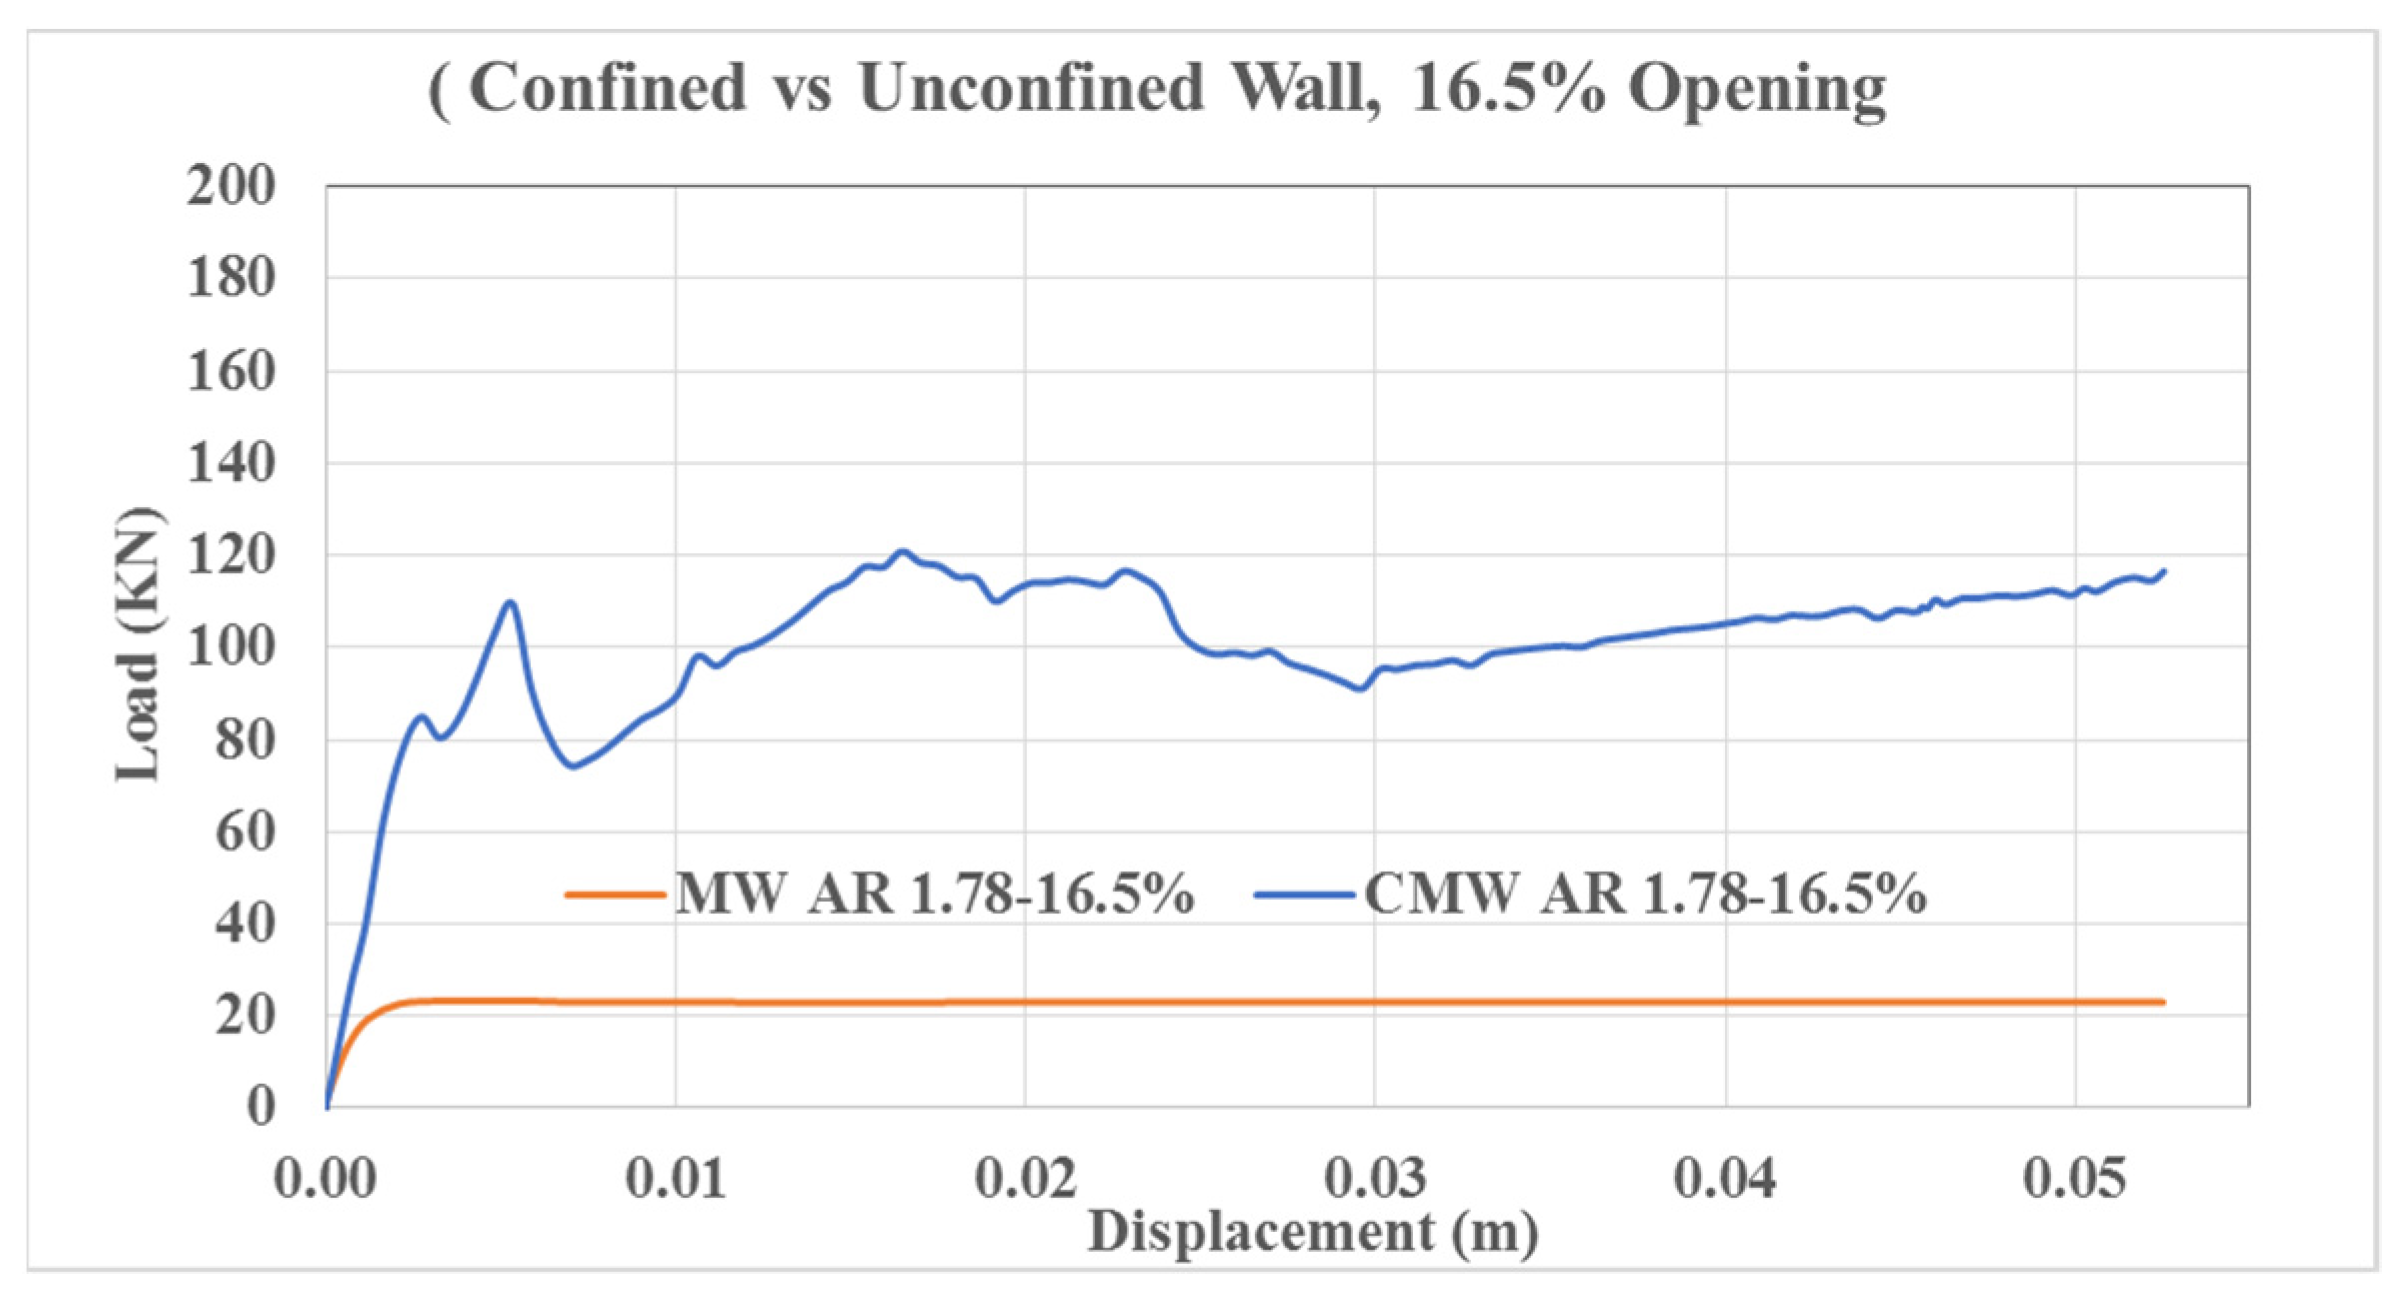
3.1.5. MW AR1.78–16.5%

MW AR1.78–16.5% gave the minimum lateral load-carrying capacity due to the maximum opening percentage (16.5%). There was much less wall area present at each side of the opening, which was not able to take much load, and due to the larger opening present in the diagonal compression area, the load transfer did not take place to the lower area of the wall. It can be seen from Figure 13 that the upper portion of the wall slides to the right side and the lower portion of the wall remains at its position. We can say that the failure has now shifted to sliding shear form flexure. The position of crack openings is also clearly visible at the right upper corner of the window and left lower corner of the window. The maximum lateral load-carrying capacity of MW AR1.78–16.5% was obtained as 23.32 kN and the stiffness degradation was calculated as 76.4%, which was the maximum out of all the walls.

3.2. Performance of Confined Masonry Walls against Lateral Loading

Since openings are essential and we cannot avoid them, one option to increase the capacity of a masonry wall with openings is the use of confined masonry. This study was extended to see the increase in capacity after confining the same walls with openings with confining elements like columns and beams. The column size was kept equal to the thickness of the wall (0.175 m × 0.175 m). The amount of reinforcement provided in the top beam and confining columns was around 1% of the cross-sectional area of the member, which was according to the building code of Pakistan. For the beam and columns, four steel bars of 10 mm were used along with stirrups of 6 mm at a distance of 126 mm from center to center while maintaining a clear cover of 20 mm. All the walls were analyzed again by keeping the boundary conditions and loading criteria the same.

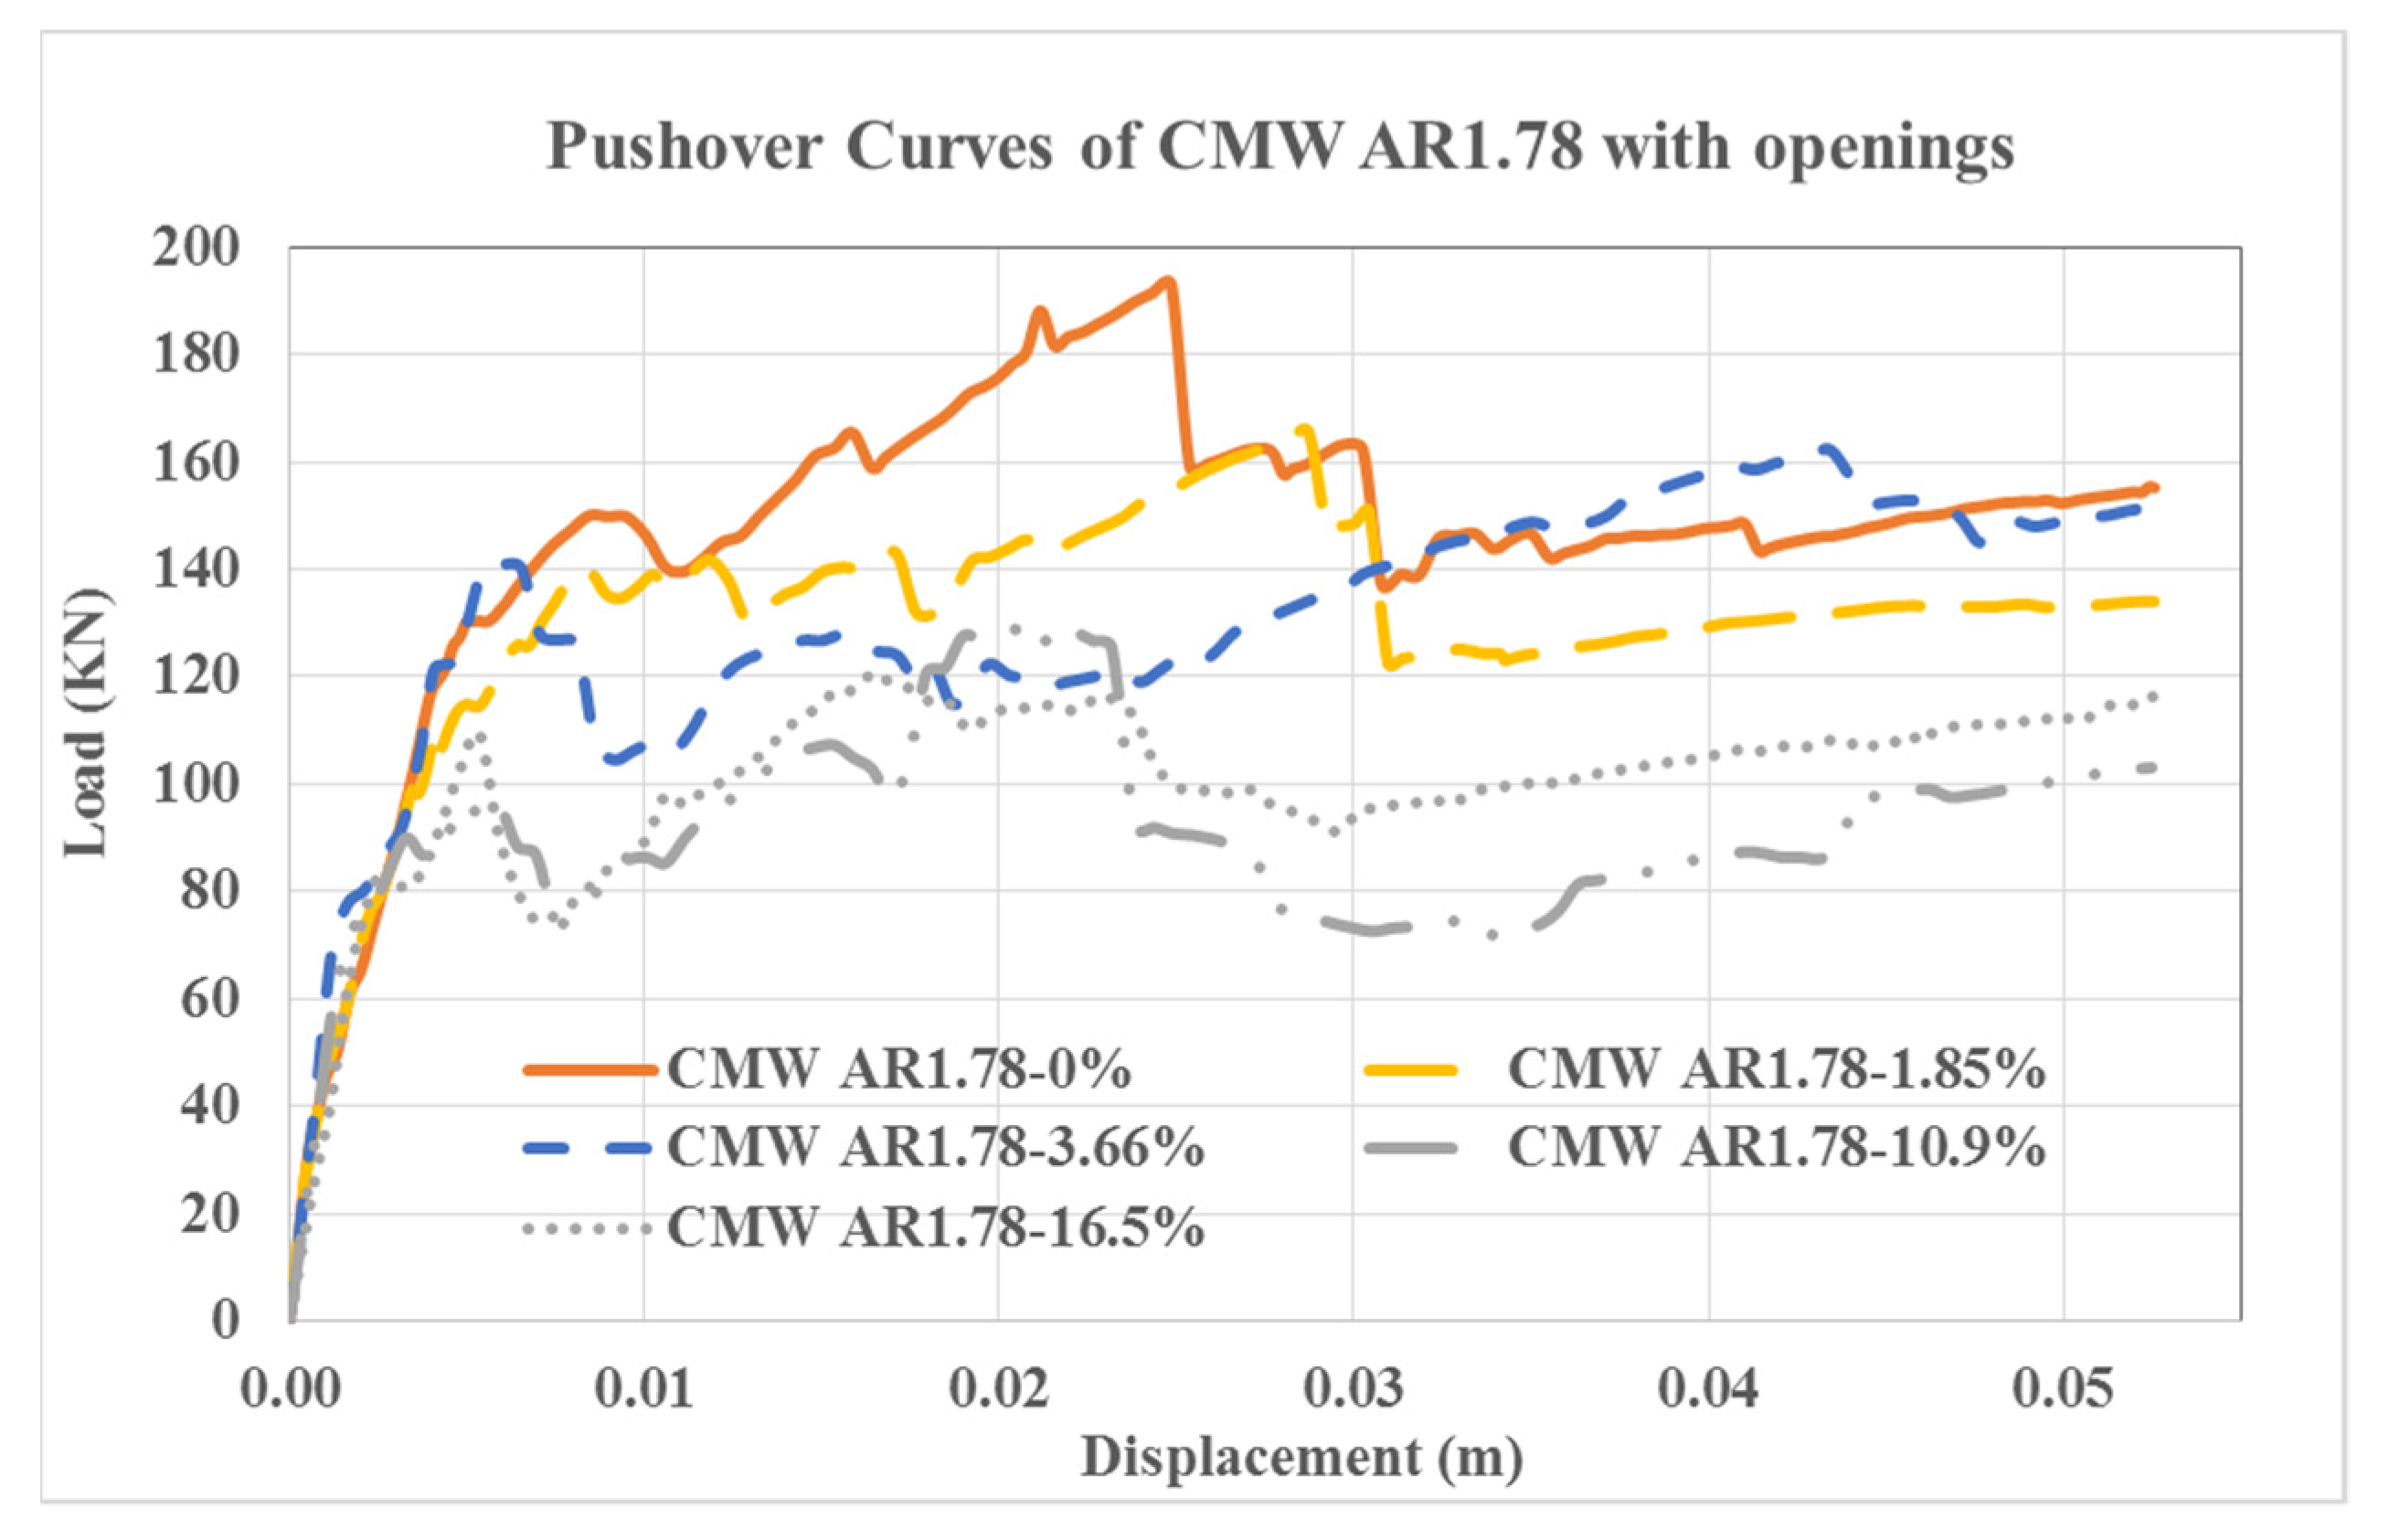
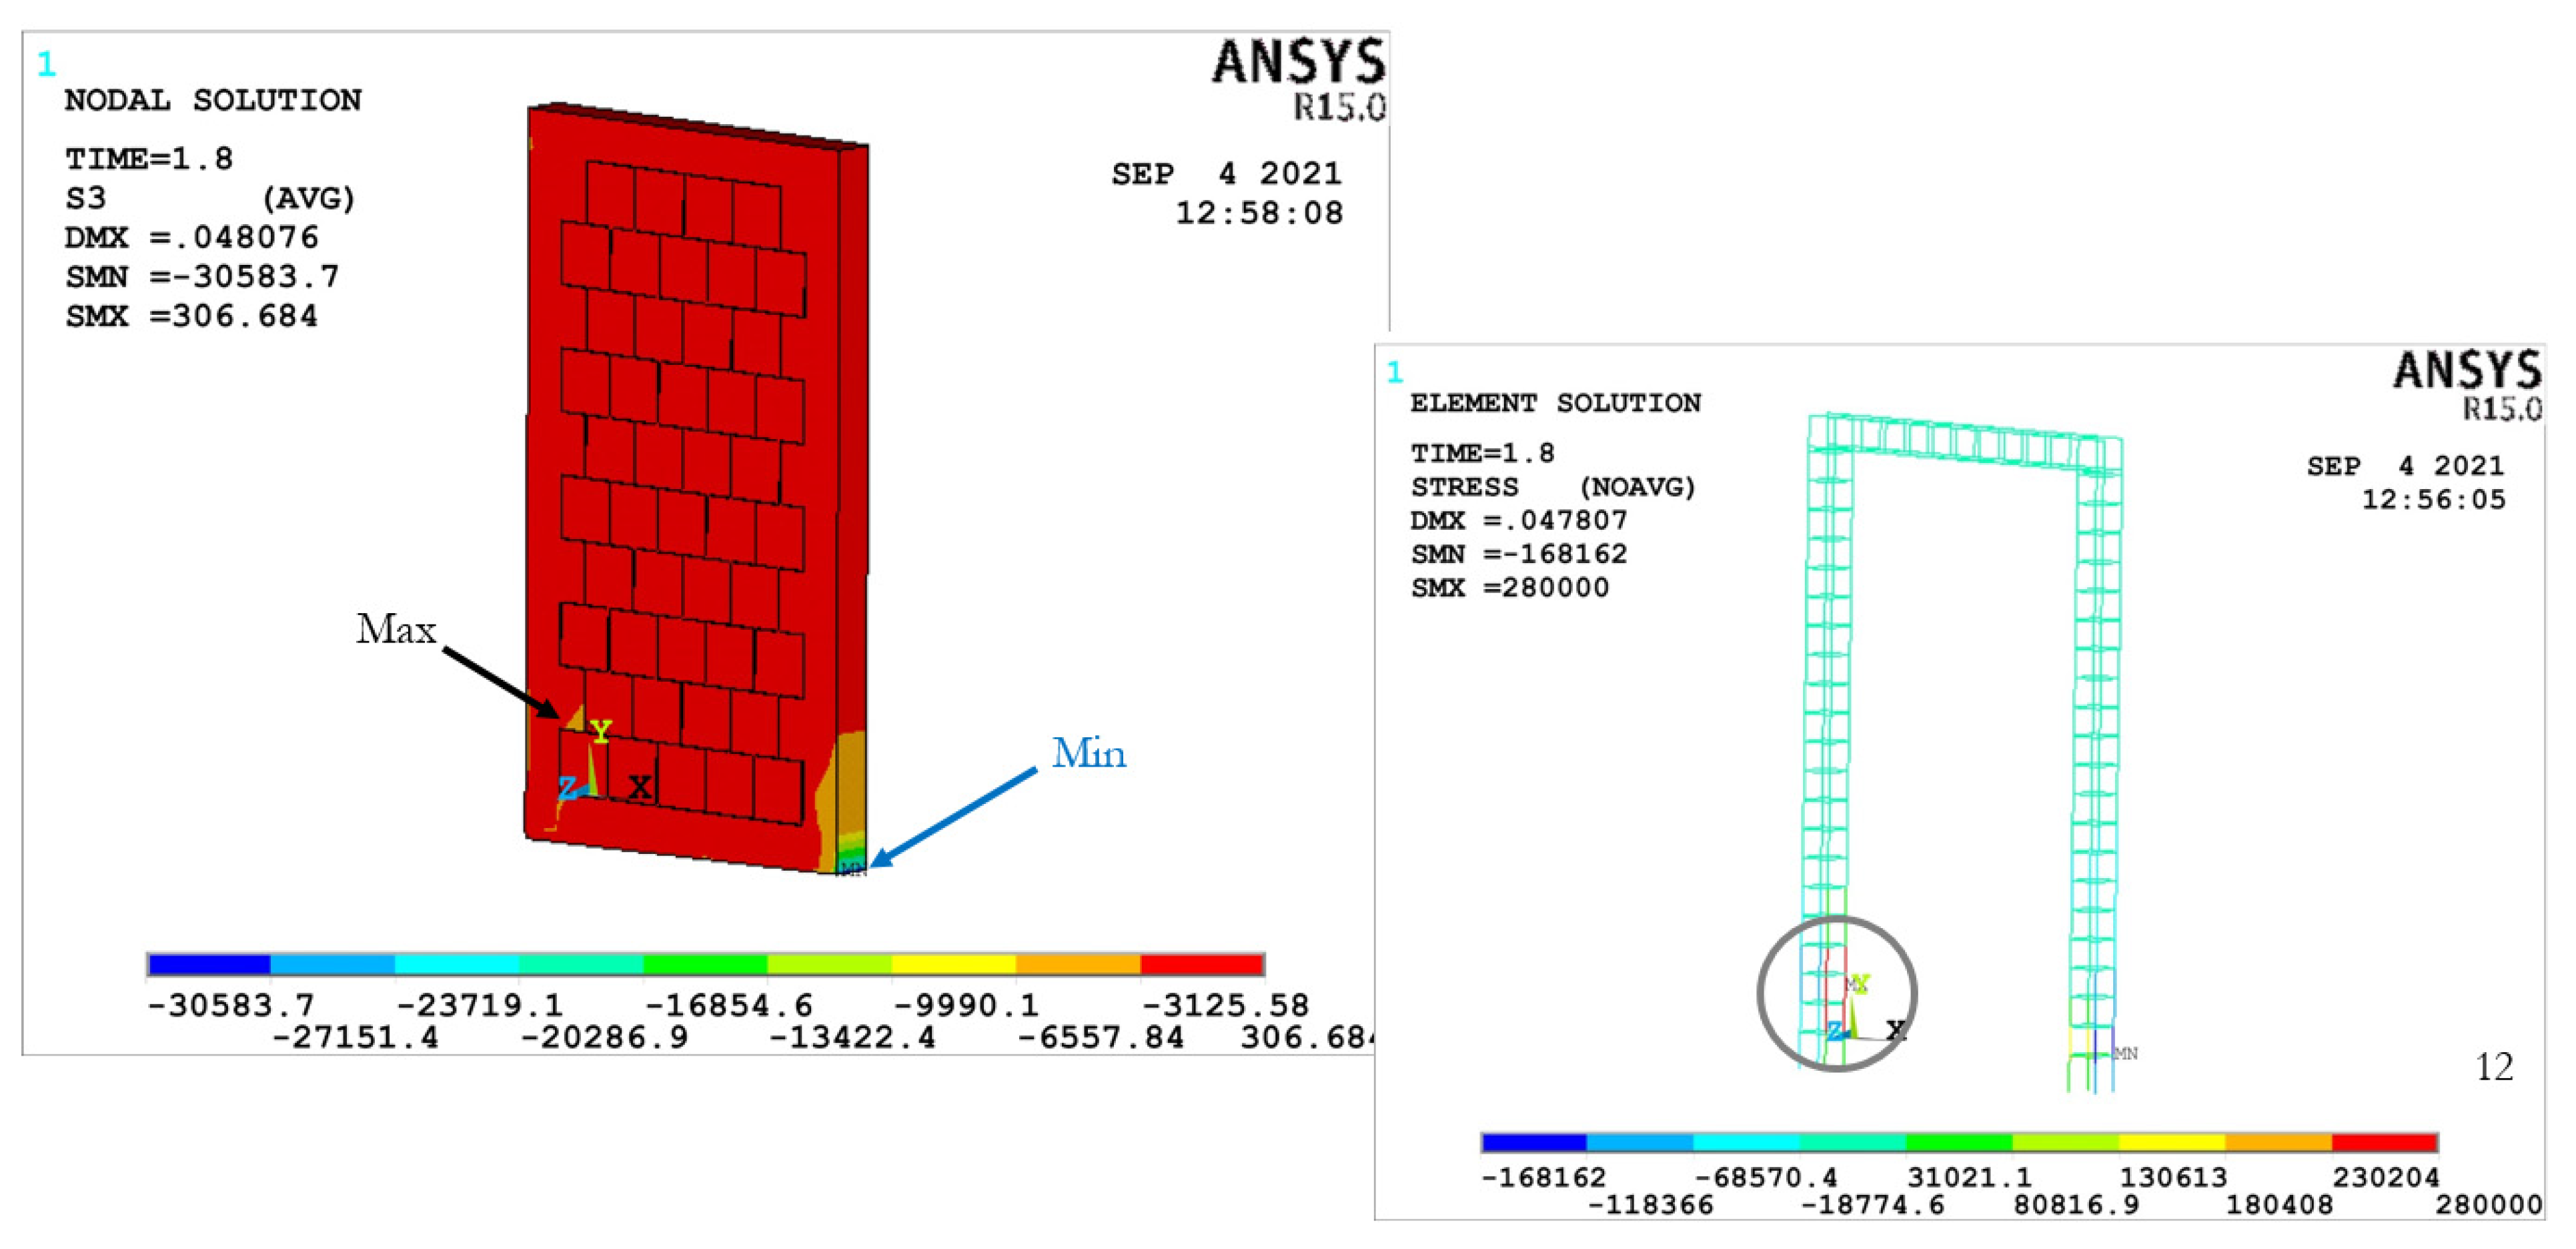
3.2.1. CMW AR1.78–0%

In confined masonry walls, the load is first taken by the confining elements and then it is transferred to the inner elements. The pushover curves are presented in Figure 14.
The CMW AR1.78–0% shows a little higher initial stiffness, the curve keeps on going higher up to a value of 130 kN with some small deviations, but at 130 kN the yielding can be seen in the curve. The curve then changes its slope and small crack initiation takes place at the toe of the wall where compressive forces are greater. The in-plane shear capacity of confined masonry walls is dependent on the strength of the masonry strut [42]. So, the higher the strength of the masonry strut, the higher the combined capacity of confined masonry walls. The curve goes higher to a value of 150 kN and then drops down to 139.6 kN, indicating some cracking at the lower right side of the confined masonry wall. It then starts moving up once again to a maximum value of 193 kN, and after that the failure takes place due to a sudden large drop in the curve. The load path which was observed from the stress diagrams in the case of confined masonry walls was from the left column to the top beam and then it was transferred to the right column as well as the right side of the inner masonry wall. The stress was then spread to the inner masonry wall and the toe of the wall. Maximum compression can be seen at the base of the right column of the masonry wall, which is the toe of the wall. The lateral load capacity of a confined masonry wall with no opening was found to be greater than that of the unconfined masonry wall, which is discussed later in this research.

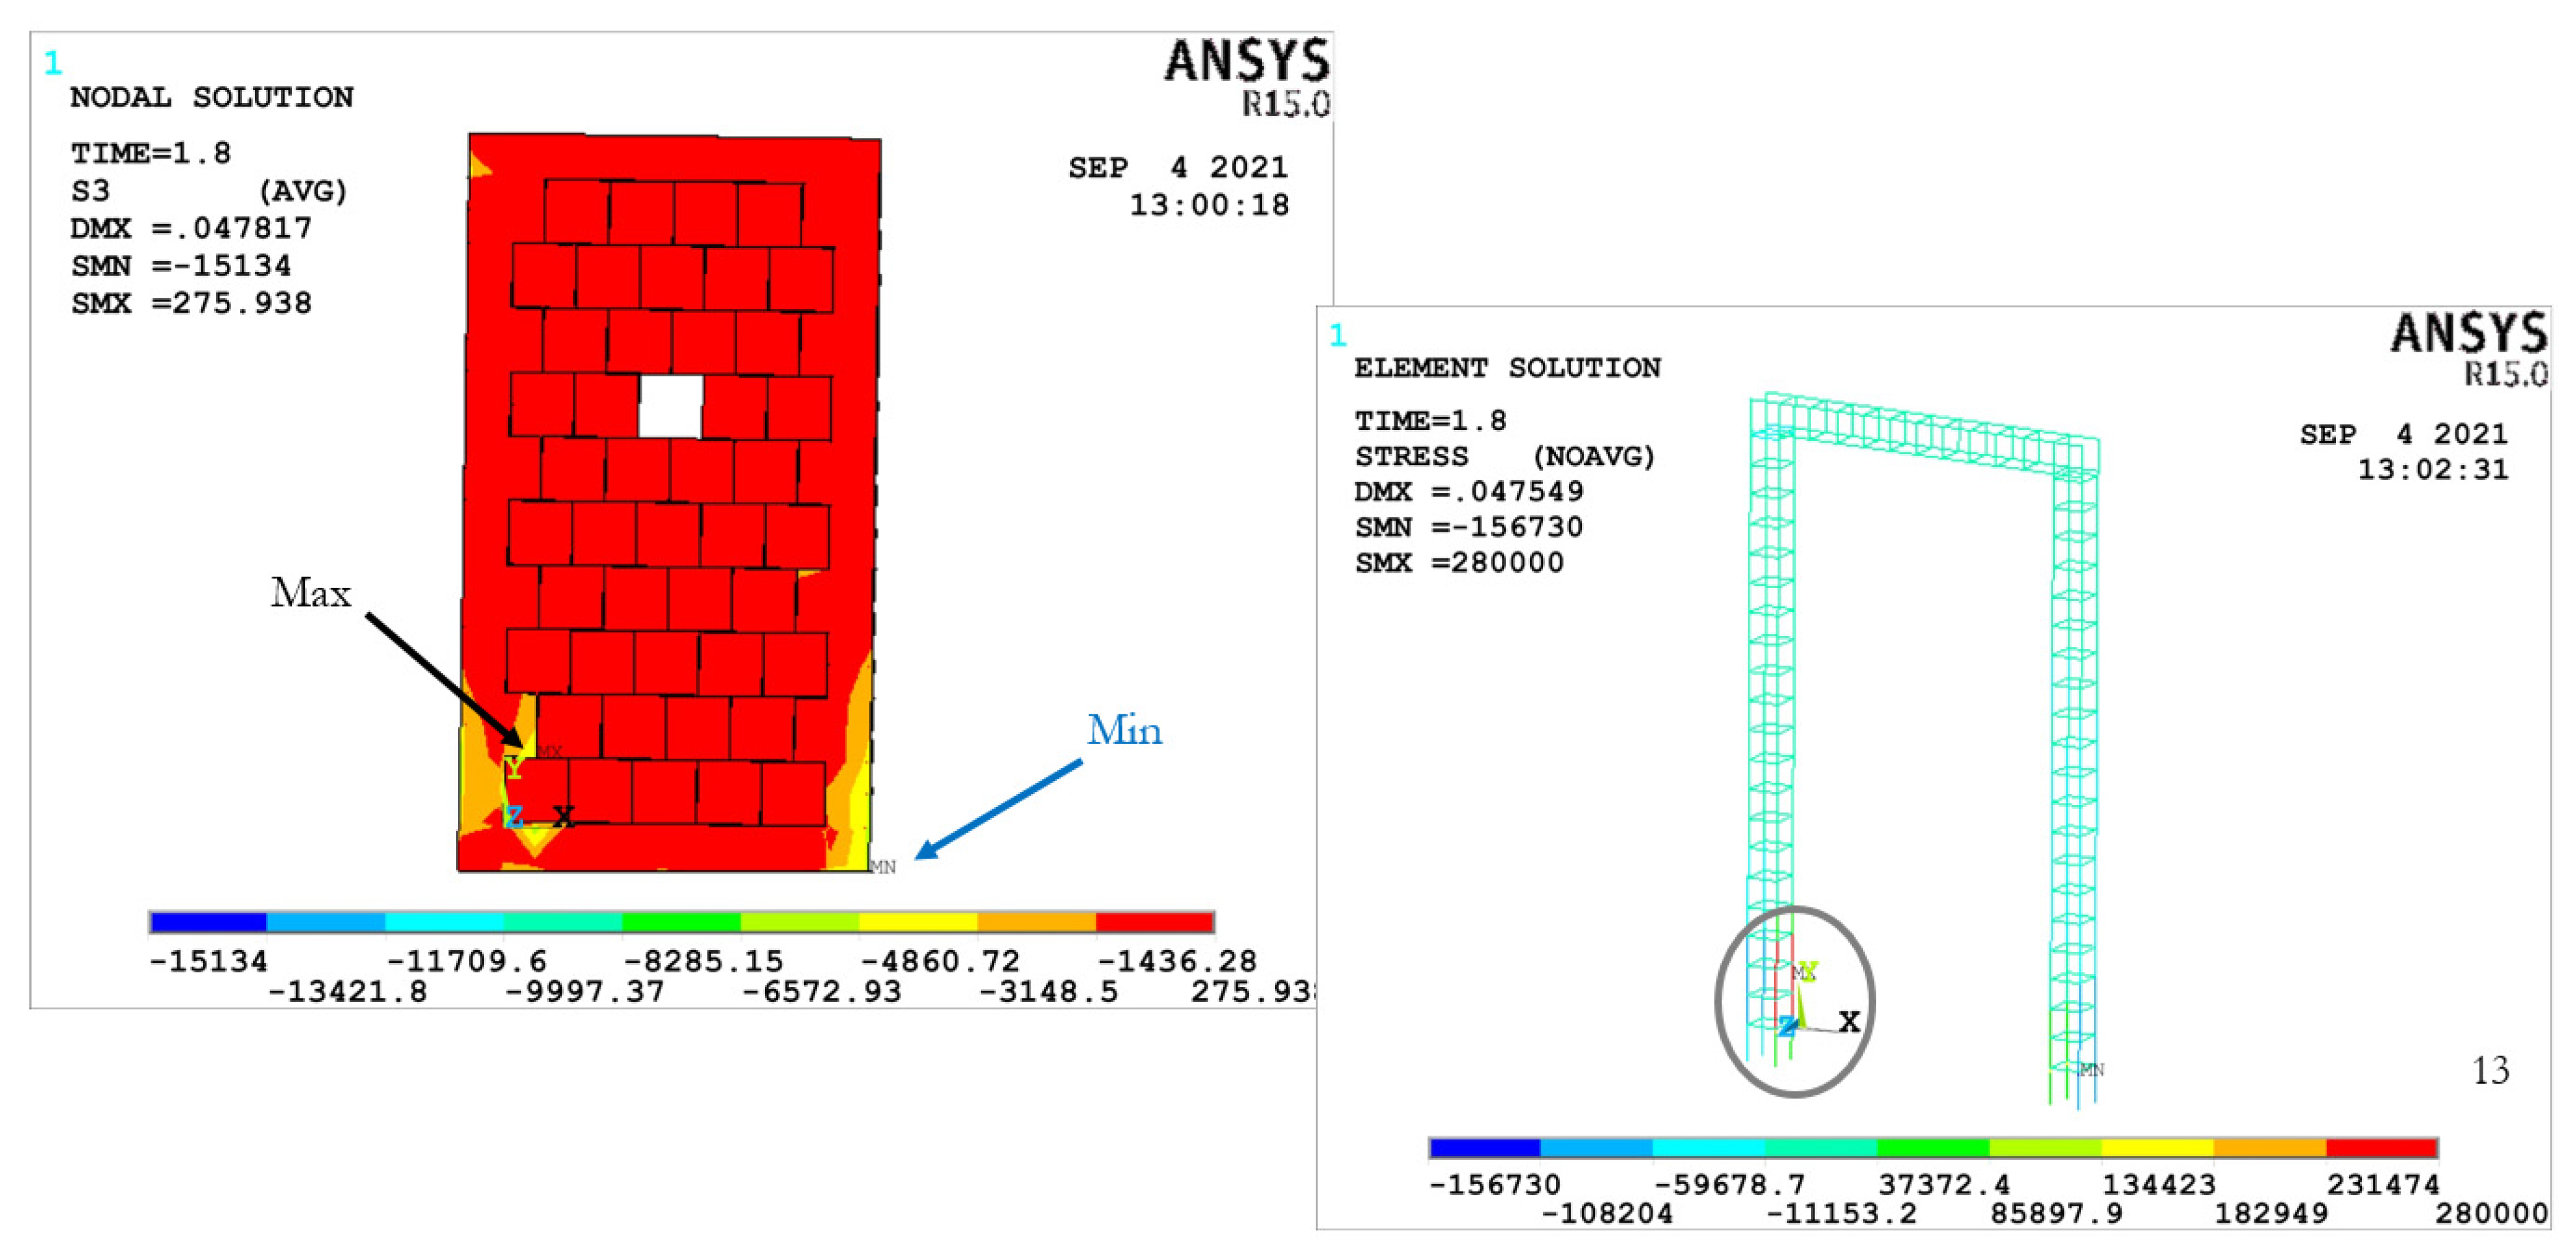
3.2.2. CMW AR1.78–1.85%

The load-displacement curve of CMW AR1.78–1.85% changes four times before yielding and only a small initial part remained straight. The reason for this can be that when the load reached the right side of the confined masonry wall and the confining column, maximum compressive stresses were observed at the junction of the bottom-right element of the masonry wall and the upper face of the foundation. The compressive stress was more than the mortar’s compressive strength and hence we can say that the spring’s maximum capacity was utilized there. The curve then goes higher by adopting a parabolic trend and then at about 140 kN the curve remains at the same load with small deviations, but displacement keeps on increasing, this is the part where the brick elements are retransferring load to the intact springs. The curve goes higher by following a straight line up to a maximum value of 165 kN, then it drops down. The stiffness of CMW AR1.78–1.85% was found to be reduced by around 37% as compared to the lateral strength, which was reduced by only around 14%. From the stress contours, it was observed that due to the yielding of steel in the left confining column and crushing of concrete at the right column or toe of the wall, a flexural type of failure took place.

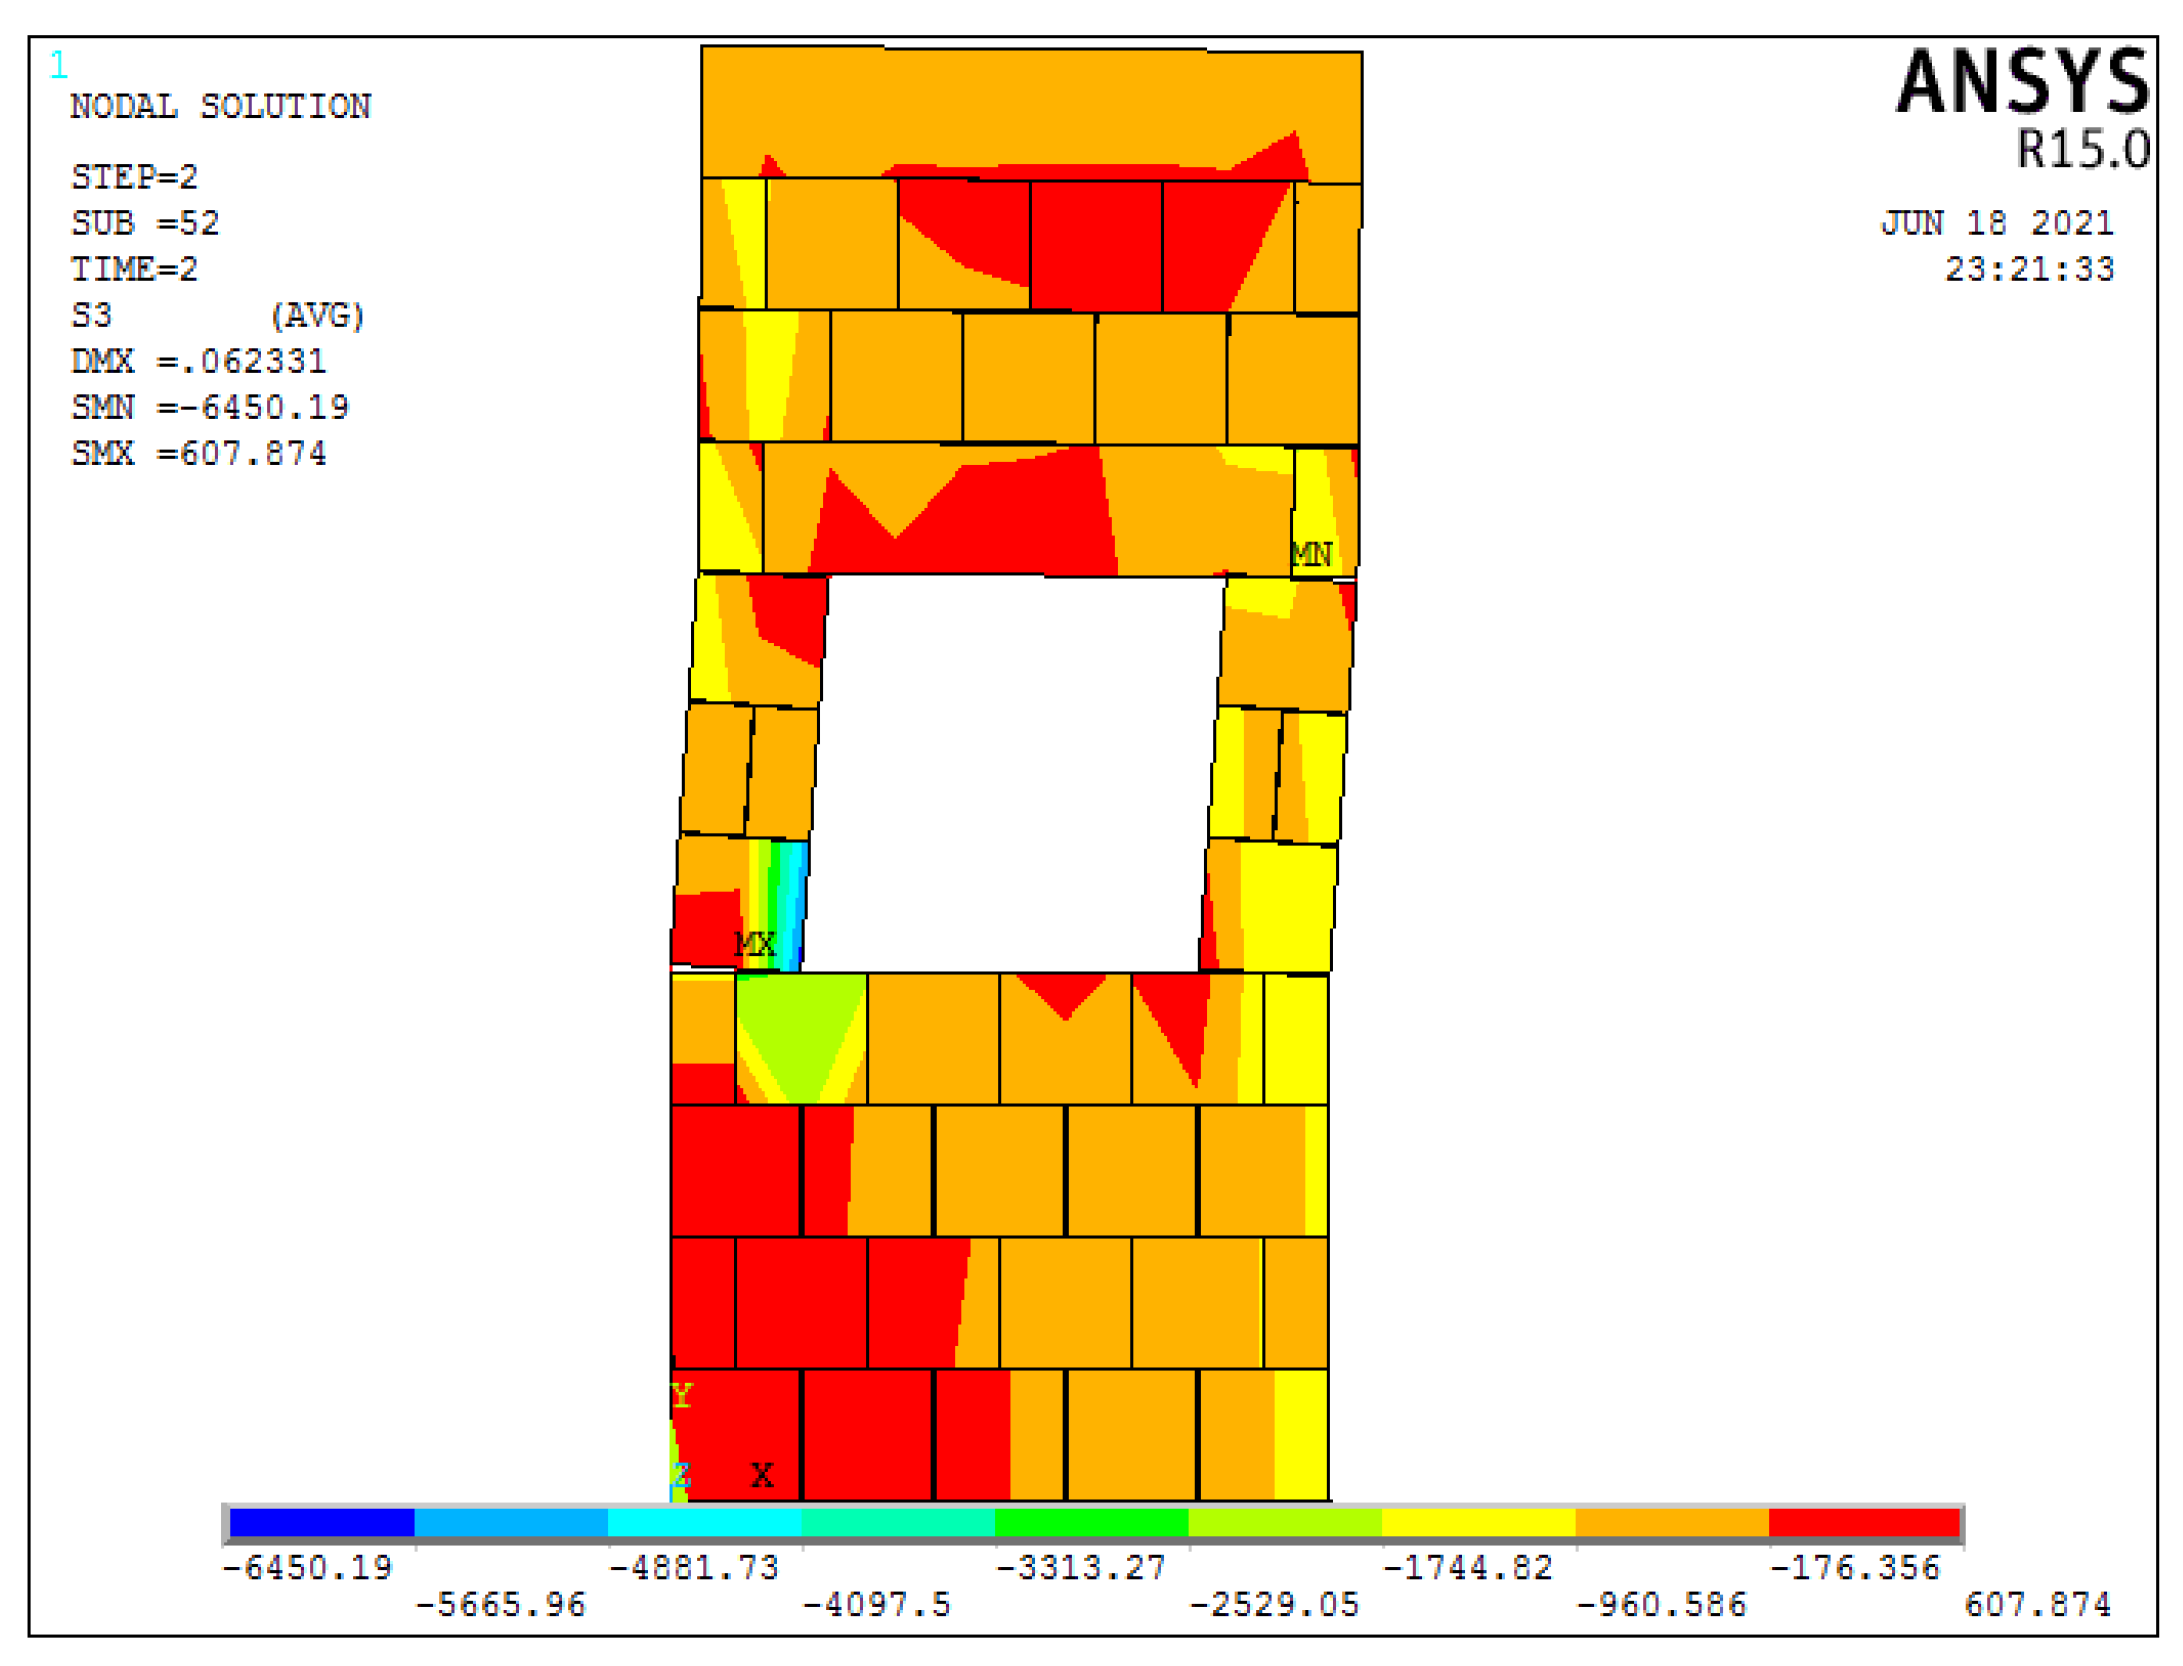
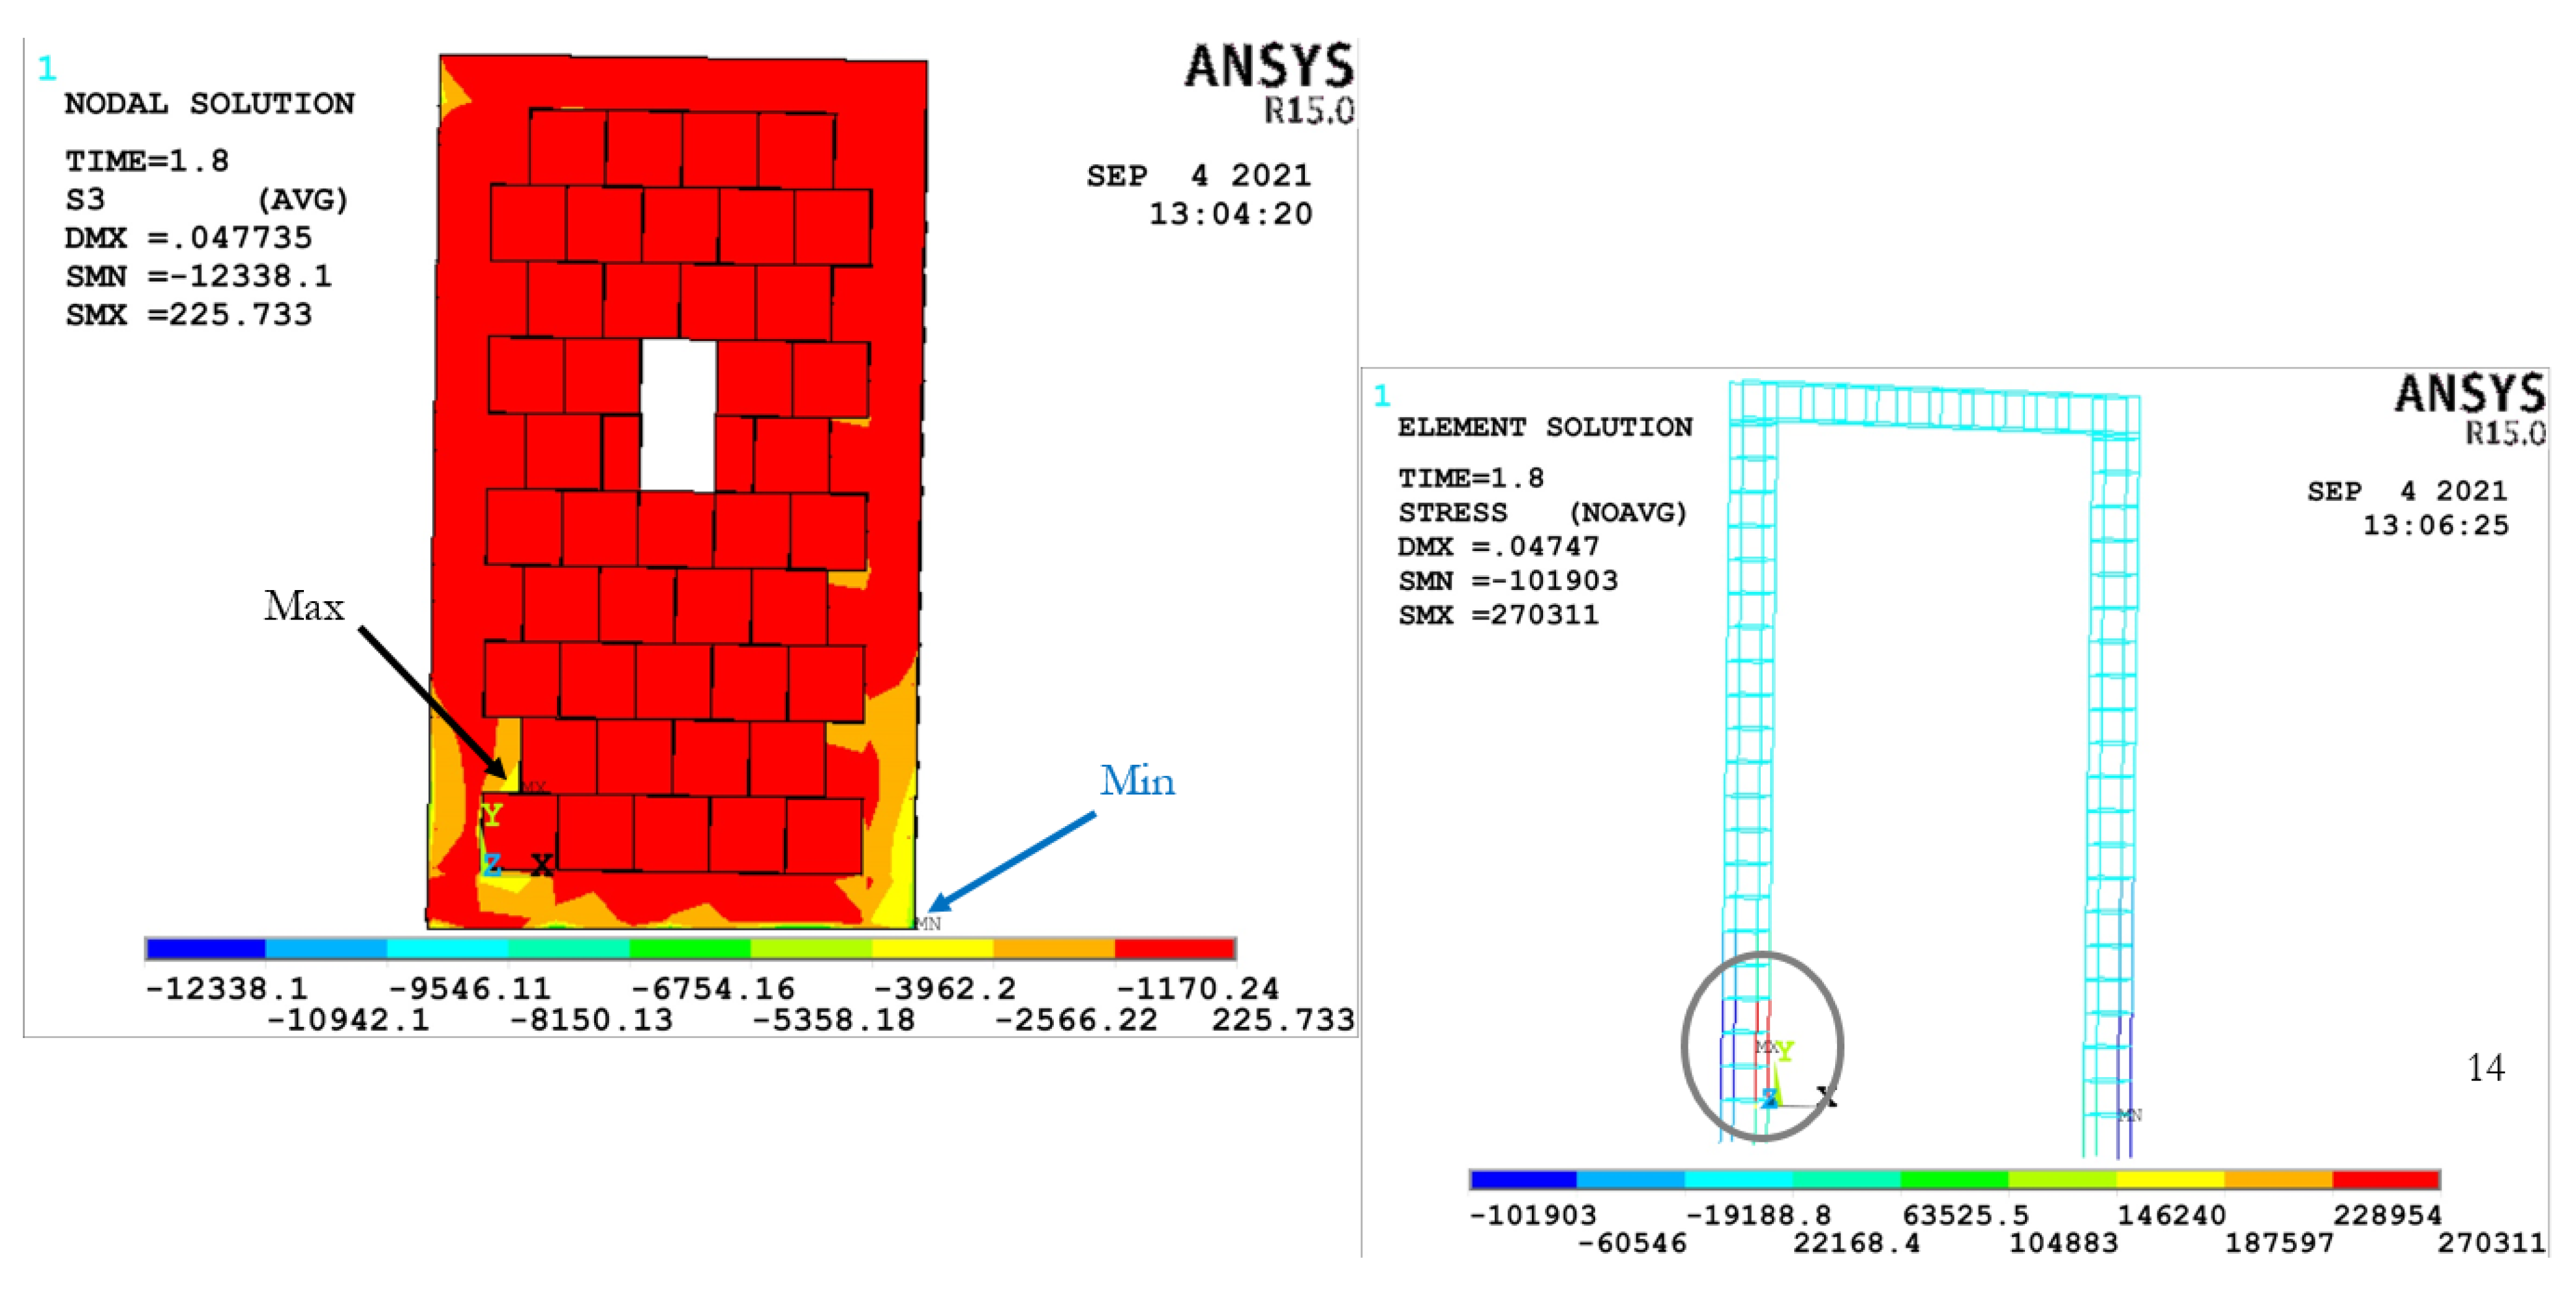
3.2.3. CMW AR1.78–3.66%

In CMW AR1.78–3.66% the pushover curve gives a linear trend at the start and goes up to a value of 77.5 kN, after which small crack initiation takes place at the interface of the lower right corner of the brick element and the left face of the right confining column. Since toothing is provided in all the walls, the second last tooth of the right column also experiences some compressive stresses just after the previous time step. The curve again goes higher up to a value of 141 kN and then suddenly drops, when checked from the model, it was found out to be due to the vertical loading, where some compression took place due to the toothing. The curve then again starts taking load but now in a parabolic trend, and after that yielding of steel starts. After yielding, the curve reaches a maximum value of 162 kN before dropping again. The lateral strength reduction was found to be around 16%, whereas the stiffness reduction was calculated at 52.35%. In this wall, more cracks were visible in the left column due to the yielding of steel and at the right column base due to the toe crushing and also in the toothing of the left column. The failure hence remained flexural.

3.2.4. CMW AR1.78–10.91%

If we talk about CMW AR1.78–10.91%, the pushover curve gives a linear trend up to 72 kN, after which crack initiation takes place, after which it again goes higher to a value of 96.6 kN, and then the curve drops down to 74.4 kN. This was due to the larger percentage of openings. More stress contours were observed around the opening in the 3D model with maximum stresses observed at the lower right corner of the opening along with the right column or toe of the wall. In the wall, stresses were also observed at the central tooth of the left confining column, indicating the stress concentrations around the opening, whereas more of them were transferred to the base of the inner masonry elements and the right confining column. The same thing happened at the junction of the foundation with the brick elements as was discussed in CMW AR1.78–1.85% with the addition of stresses at the corners of the opening. After the load was redistributed on the intact springs, the curve again goes higher up to a maximum value of 129.56 kN and then it drops. The behavior of the pushover curve going down and up was observed and also verified from the stress contours. The strength and stiffness degradation of the CMW AR1.78–10.91% was calculated as 32.93% and 60.26%, respectively. In this wall the failure was not purely flexural, it was a combination of flexural and shear as more cracks were seen around the opening as well as the base of both confining columns, however, the yielding of steel only took place in the left confining column.

3.2.5. CMW AR1.78–16.5%

CMW AR1.78–16.5% had the maximum opening size making it the least stiff wall of all the others, but the first crack load, i.e., 80.37 kN, obtained from the pushover curve of CMW AR1.78–16.5% gave a higher value. This was due to the continuous lintel present at the top of the opening. Out of all the walls, only this wall experienced stresses at the complete face of the wall with maximum tension observed at the top left corner and bottom right corner of the opening. Crack openings were easily seen in these places. More variations in stresses were observed around the opening as well as in the left and right confining columns as the lateral load continued to be applied. After this, the curve again started going up to a value of 109.4 kN and then more cracking took place and it went down. Due to the much lower stiffness present in the diagonal strut of the wall, the stresses were transferred to the confining columns. Maximum compressive stresses were seen at the toe of the wall and minimum tensile stresses at the last tooth of the left confining column. The curve once again goes higher to a maximum value of 120.87 kN and then drops. This is the only wall in which yielding took place in both the left and right column steels. There were many cracks seen at the left top corner of the window as well as the left tooth of the confining column and at the right bottom corner of the opening with the tooth of the right confining column present at that place. The number of cracks at the foundation beam also increased in this wall. The strength and stiffness degradation were calculated as 37.43% and 68.92%, respectively.

3.3. Impact of Openings on the Unconfined Masonry Walls

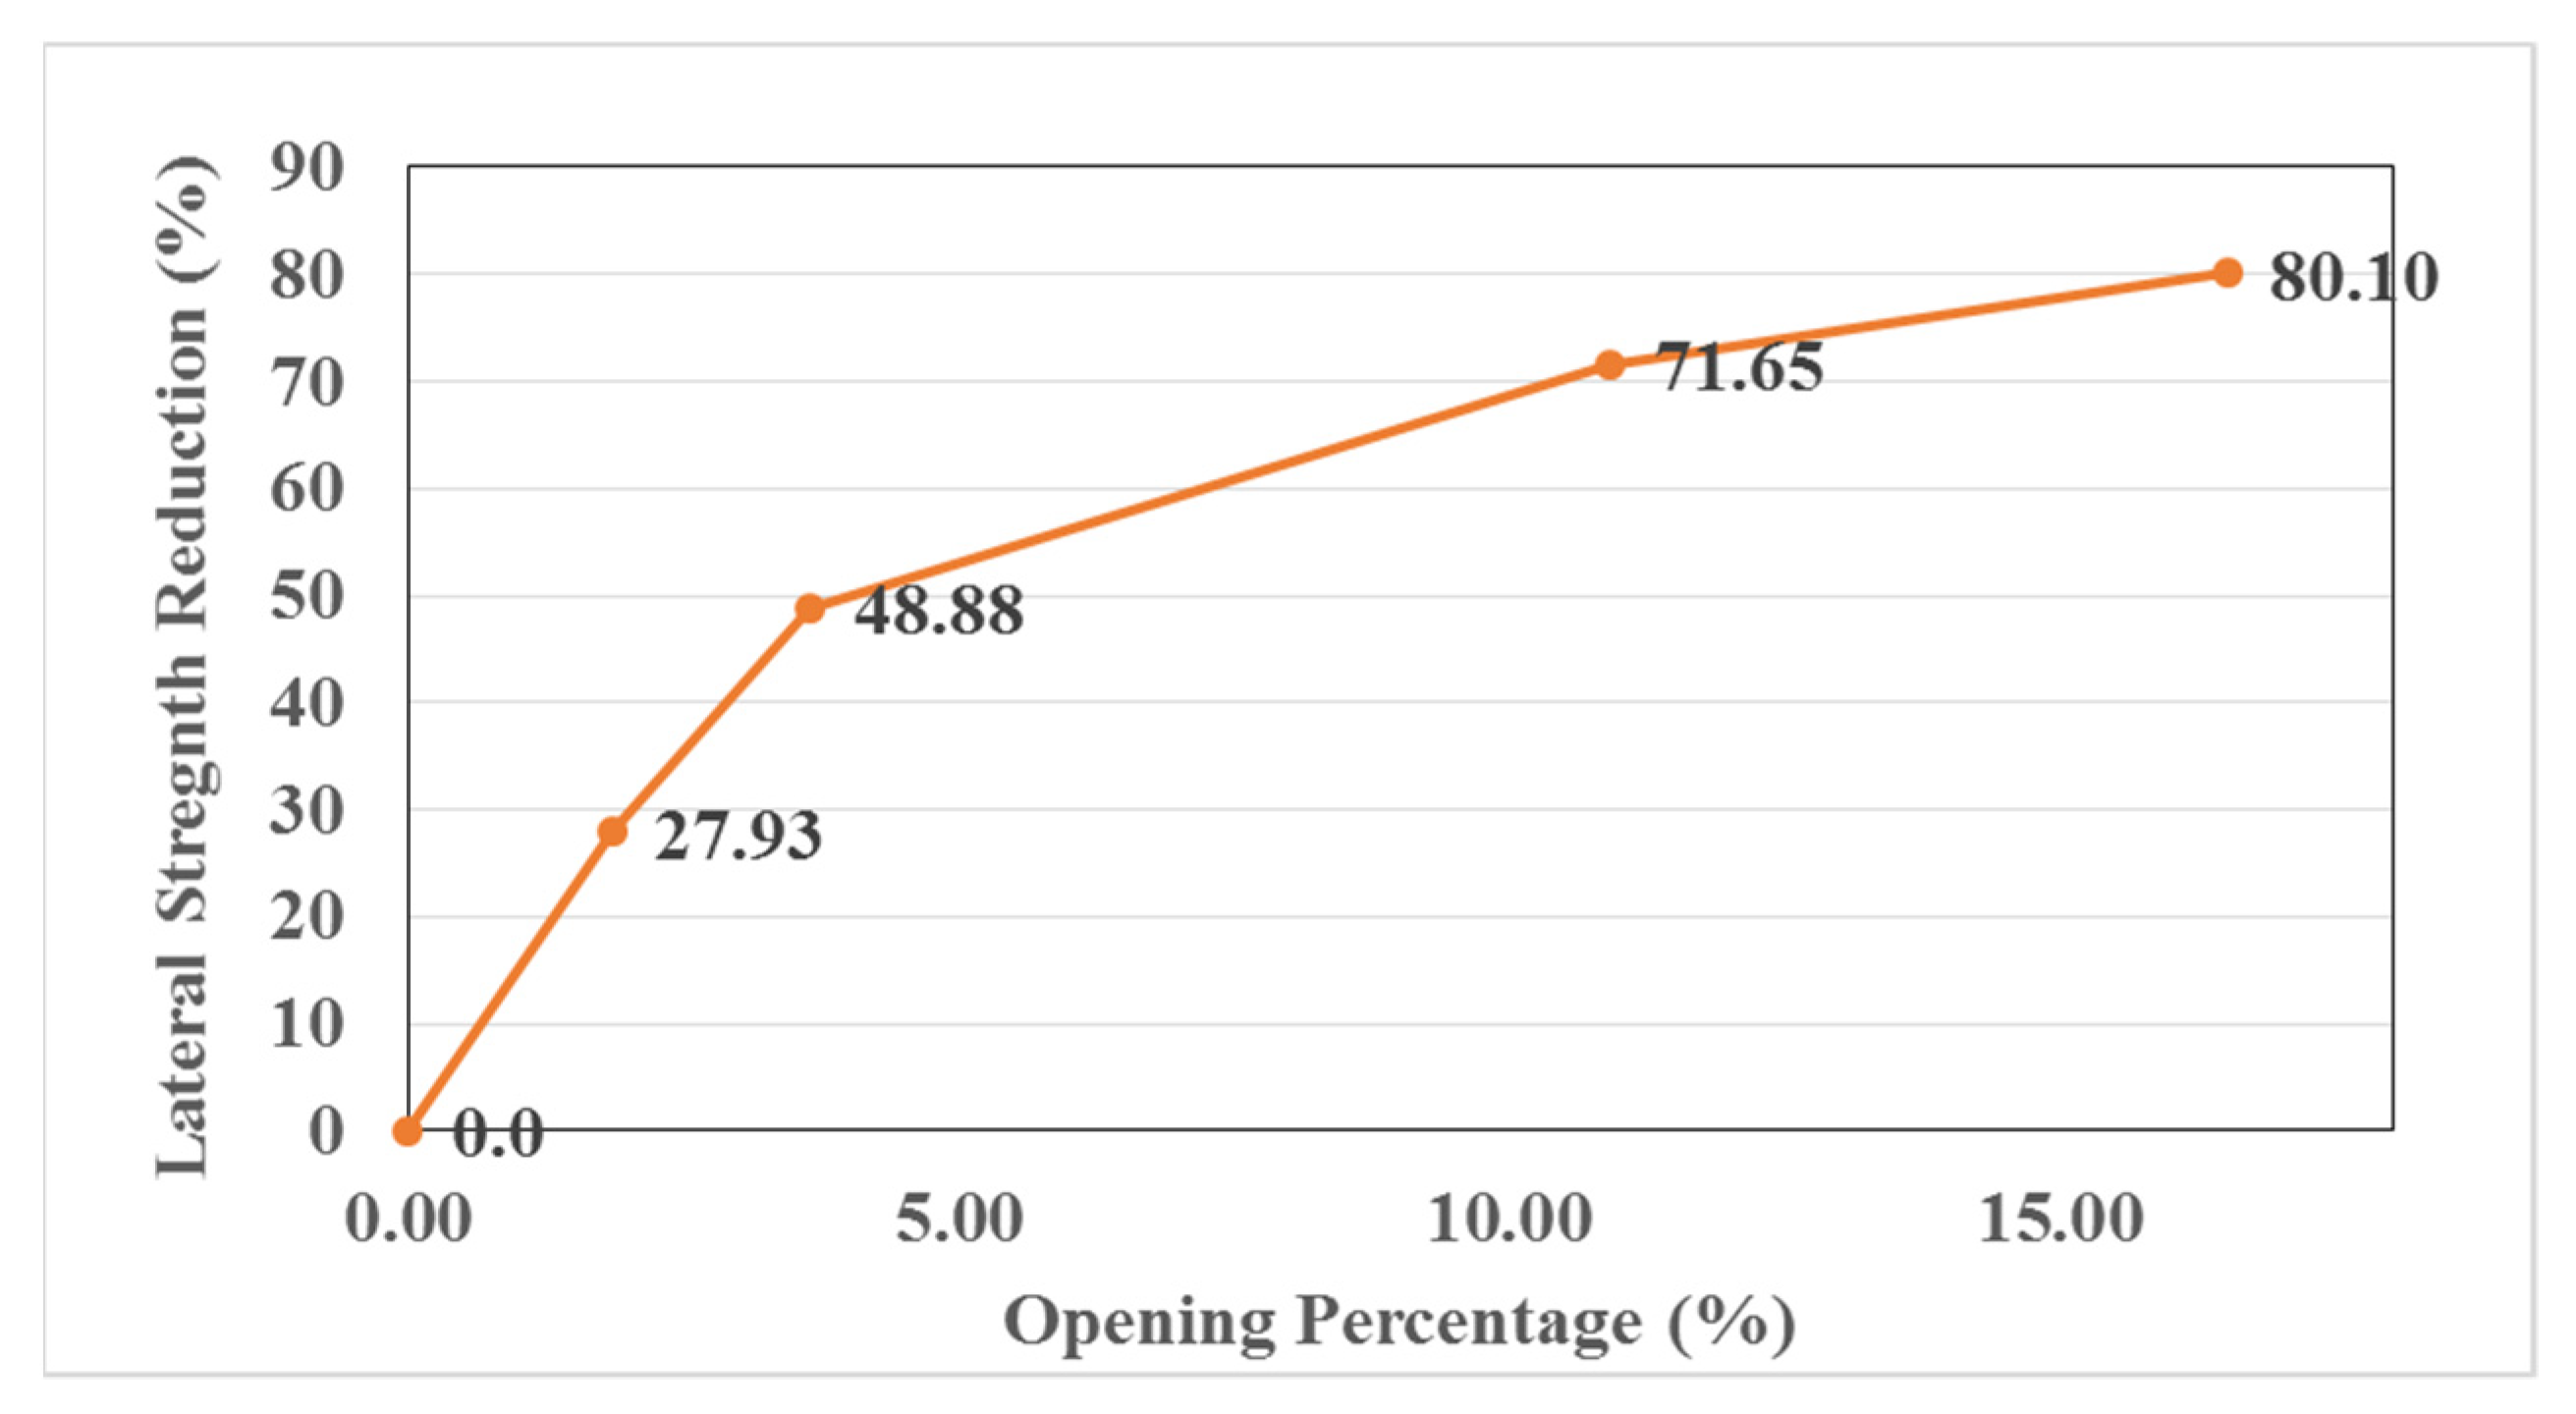
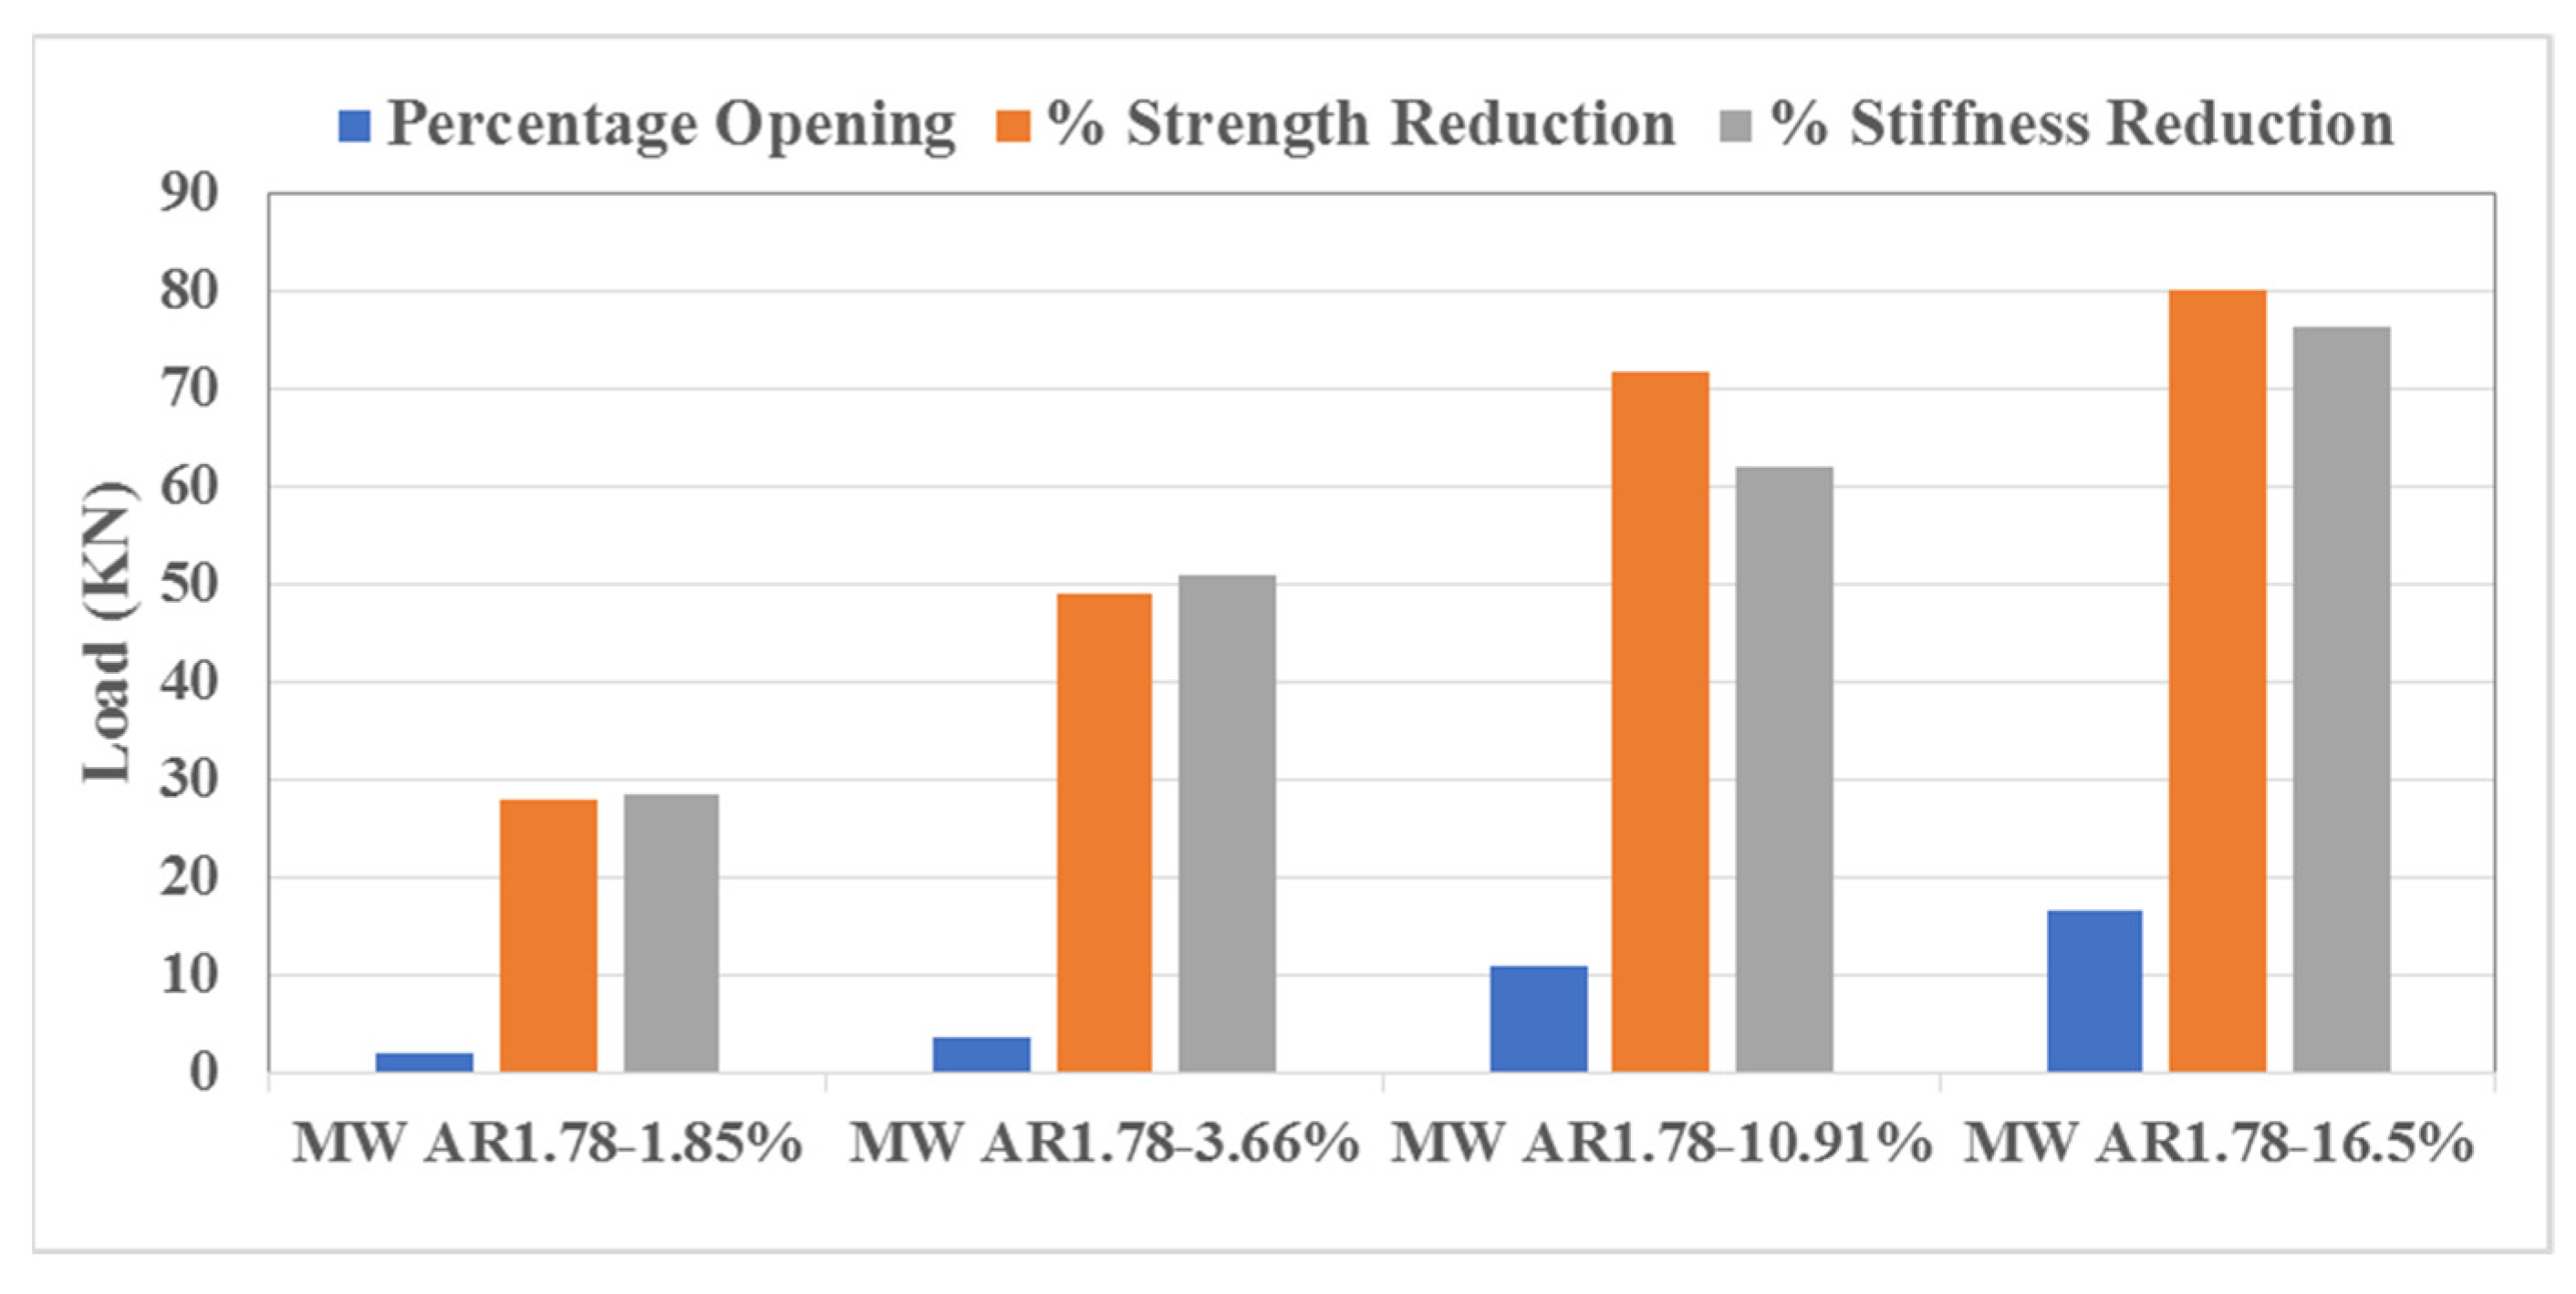
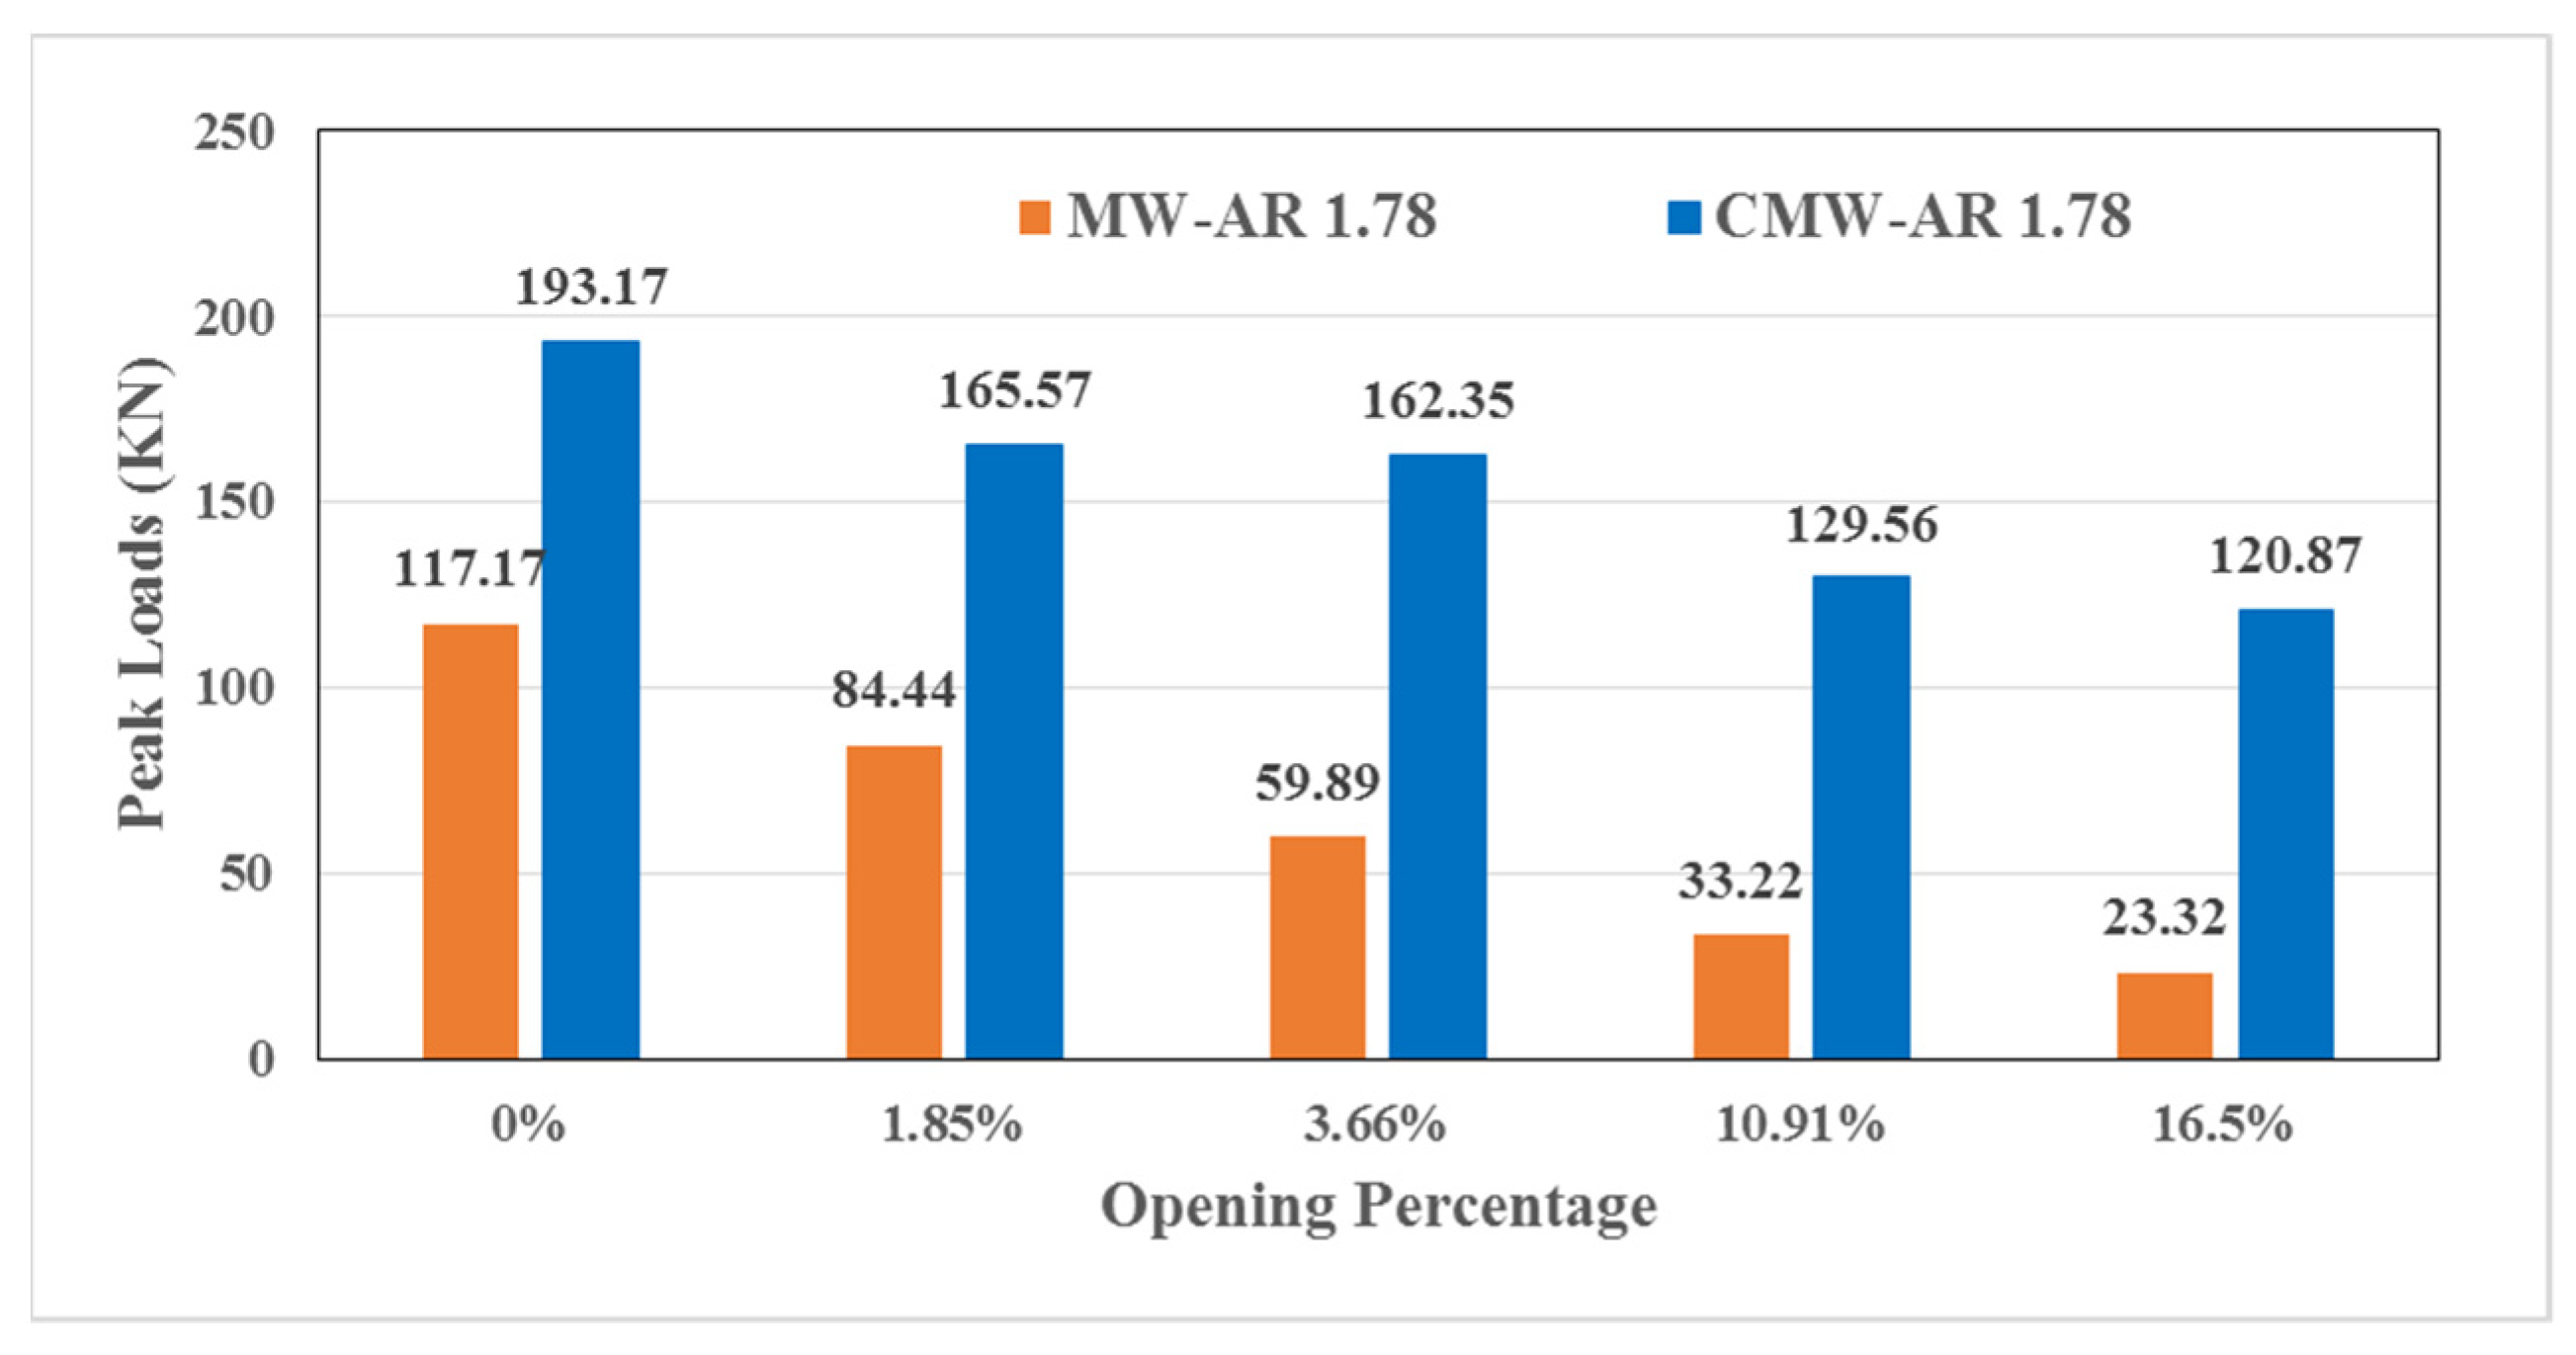
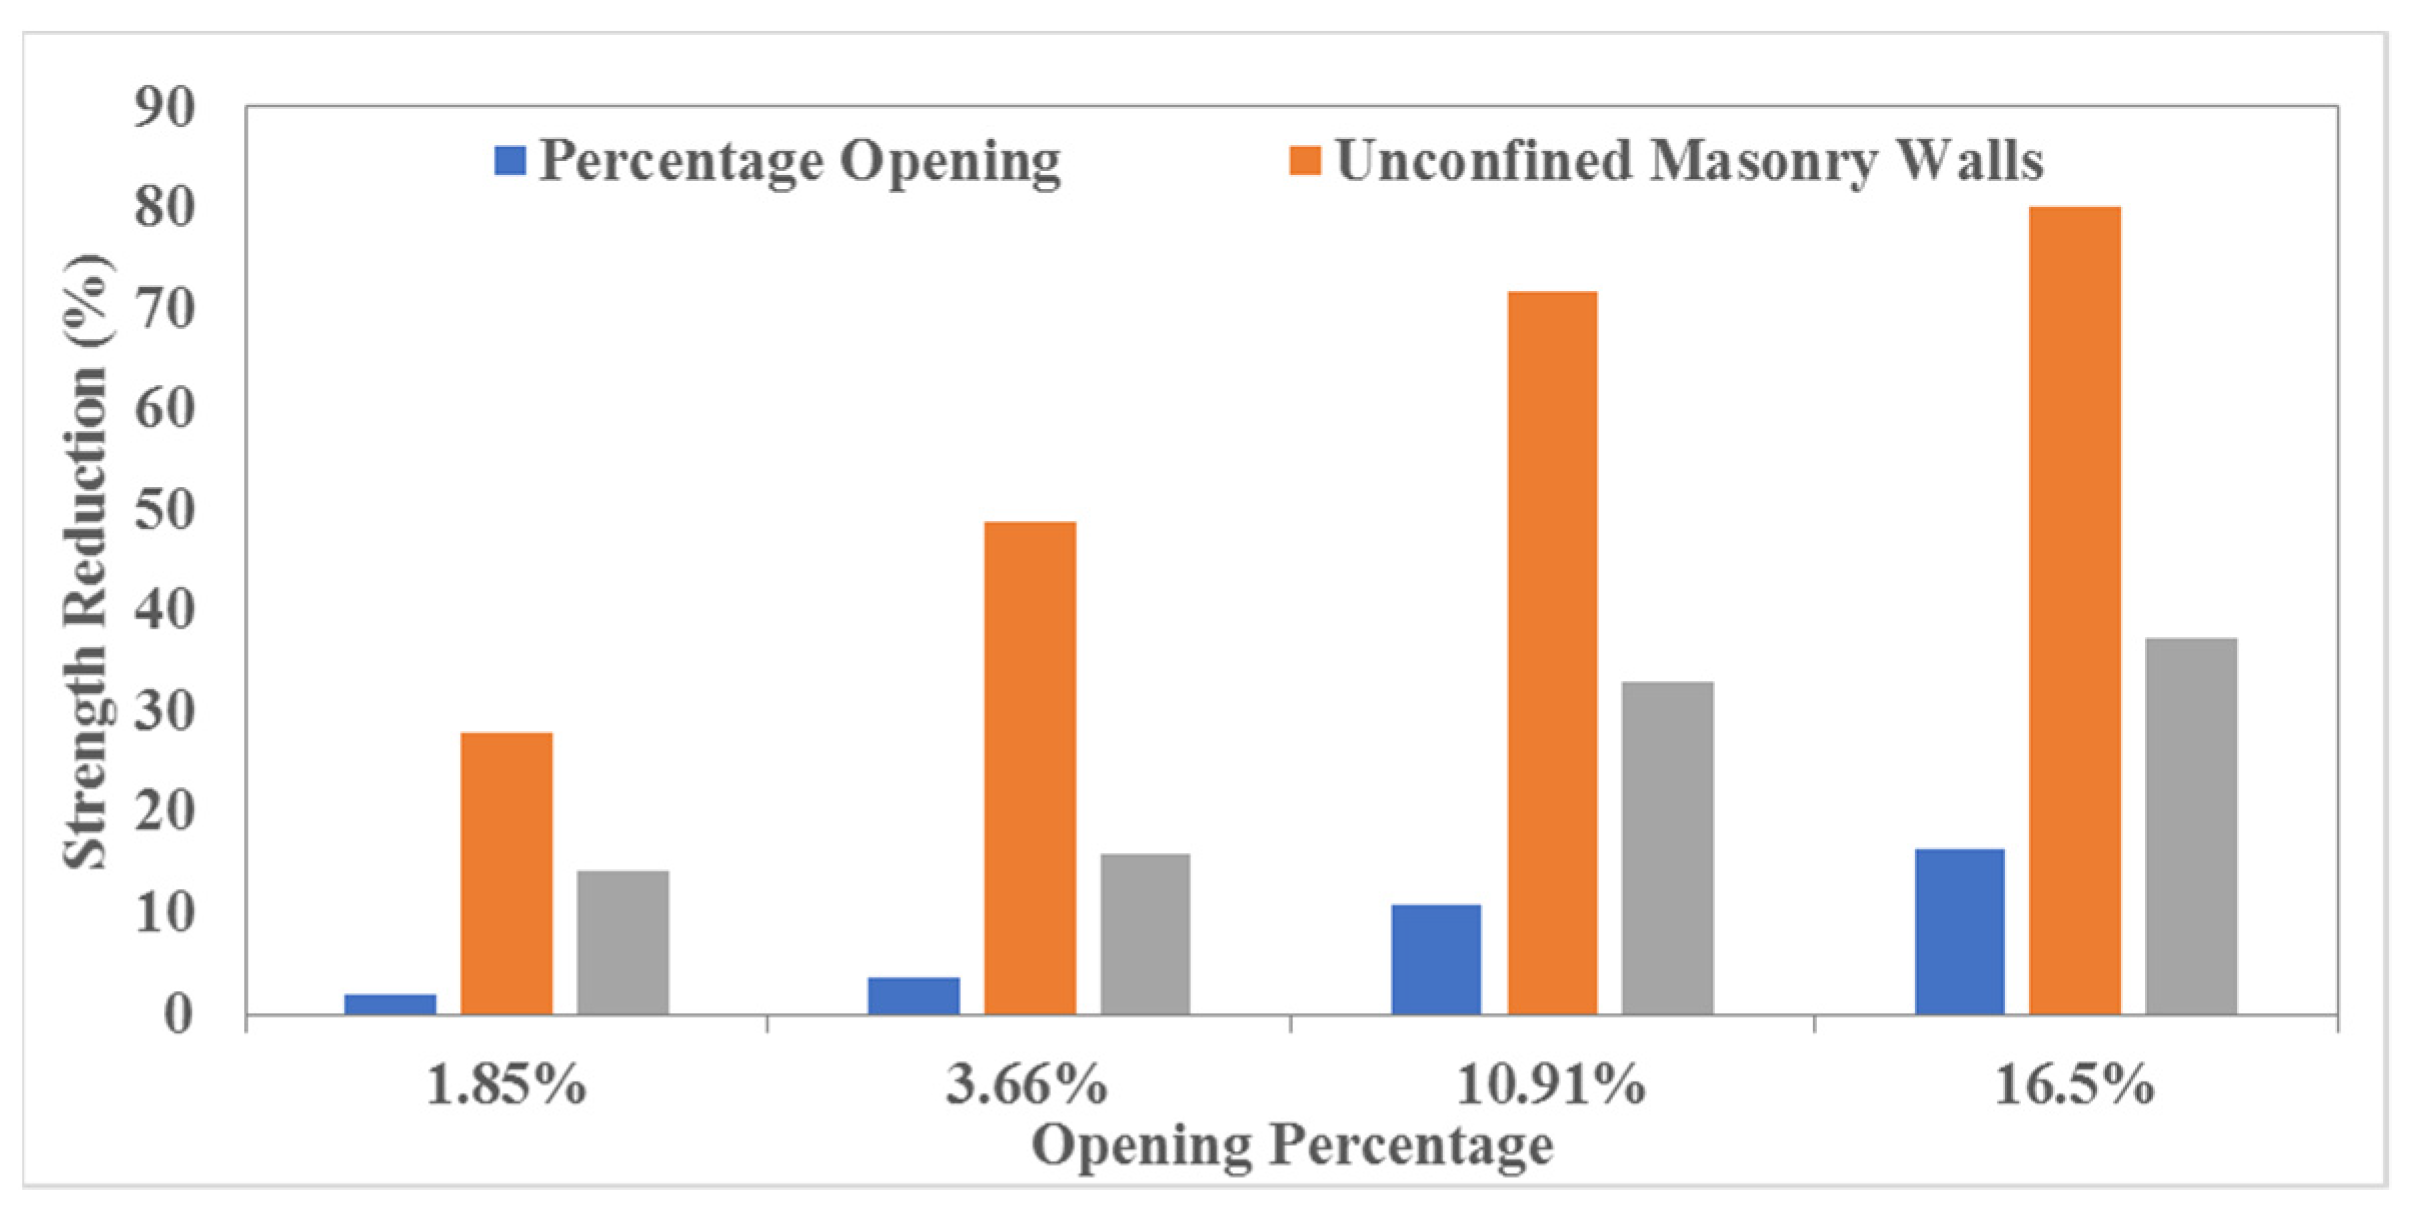
3.3.1. Peak Load and Lateral Strength

Table 2 summarizes the peak loads of unconfined masonry walls.
It can be seen that the maximum load-carrying capacity obtained while testing the MW AR1.78–0% was at maximum at 117 kN. Furthermore, the peak load observed in the case of MW AR1.78–1.85% was observed as 84.44 kN, which accounts for a reduction of 27.93%, which means that even a small opening can compromise the lateral strength of an unconfined masonry wall. Similarly, the peak load value obtained for MW AR1.78–3.66% was 59.89 kN, which was 48.88% less. The reduction continued to increase as the opening size increased. When the opening increased from 3.66% to 10.91%, the percentage reduction in peak load of MW AR1.78–10.91% also increased to 71.65%. Similarly, in MW AR1.78–16.5% the maximum peak load obtained was 23.32 kN and this reduction was equal to 80.10%. By taking all the above information, a graph between the percentage strength reduction and the opening percentage was plotted, which is presented in Figure 15 and which indicates a steepness in the slope until around 50% of the lateral strength reduction, after that the steepness decreases.

3.3.2. Stiffness Reduction

The initial part of the load-displacement curves was used to calculate the stiffness of all the unconfined walls. The stiffness reduction of all the unconfined masonry walls was calculated with respect to MW AR1.78–0% and is summarized in Table 2. MW AR1.78–0% gave a maximum stiffness of 43,448.24 kN/m, while the stiffness kept decreasing with the increase in opening percentage. The initial stiffness value obtained for MW AR1.78–1.85% was 31,049.80 kN/m, which was 28.54% less. Similarly, the initial stiffness values of MW AR1.78–3.66% and MW AR1.78–10.91% were obtained as 21,365.52 kN/m and 16,538.58 kN/m, respectively, and the reductions were calculated as 50.83% and 61.93% respectively. The maximum stiffness reduction took place in MW AR1.78–16.5% due to the maximum percentage of opening. The initial stiffness and strength reductions obtained were 10,253.75 kN/m and 76.40%, respectively. The strength and stiffness reductions were fairly close to each other, which can be seen in Figure 16. It is evident that with the increase in the opening percentage, the stiffness of the unconfined masonry walls decreases. However, this decrease is rapid until 50% of the wall’s lateral stiffness, and after that the slope becomes gentle.

3.3.3. Failure Type

The opening percentage may change the type of failure of an unconfined slender masonry wall. Stress distribution of all the unconfined masonry walls with minimum and maximum stresses are presented in this paper from Figure 9, Figure 10, Figure 11, Figure 12 and Figure 13. The left side face of the unconfined masonry wall is seen in tension and the bottom right side face is seen in compression. Figure 9 shows the crushing pattern of the wall at the bottom right side and a crack opening at the interface of brick courses of the wall at the bottom left is also visible, which indicates its flexural or bending failure. This is due to the effect of the aspect ratio (1.78) of the wall as slender walls inherently exhibit a flexural failure mode. Figure 10 indicates a similar flexural failure with a small opening at the center of the wall. Diagonal compression can also be seen in Figure 9, Figure 10, Figure 11, Figure 12 and Figure 13, while in Figure 12, the failure changes to a combination of shear and flexure from being flexural. Excessive displacement can cause crushing at the right toe of the wall. The minimum and maximum stresses change their position as the opening size increases from 3.66% to 10.91% of the area of the wall as indicated in Figure 9, Figure 10, Figure 11, Figure 12 and Figure 13. In Figure 13, the failure changes to sliding shear as it can be seen that the opening size is more than the thickness of bricks available on both sides of the opening, which becomes the weak point and failure takes place from there.

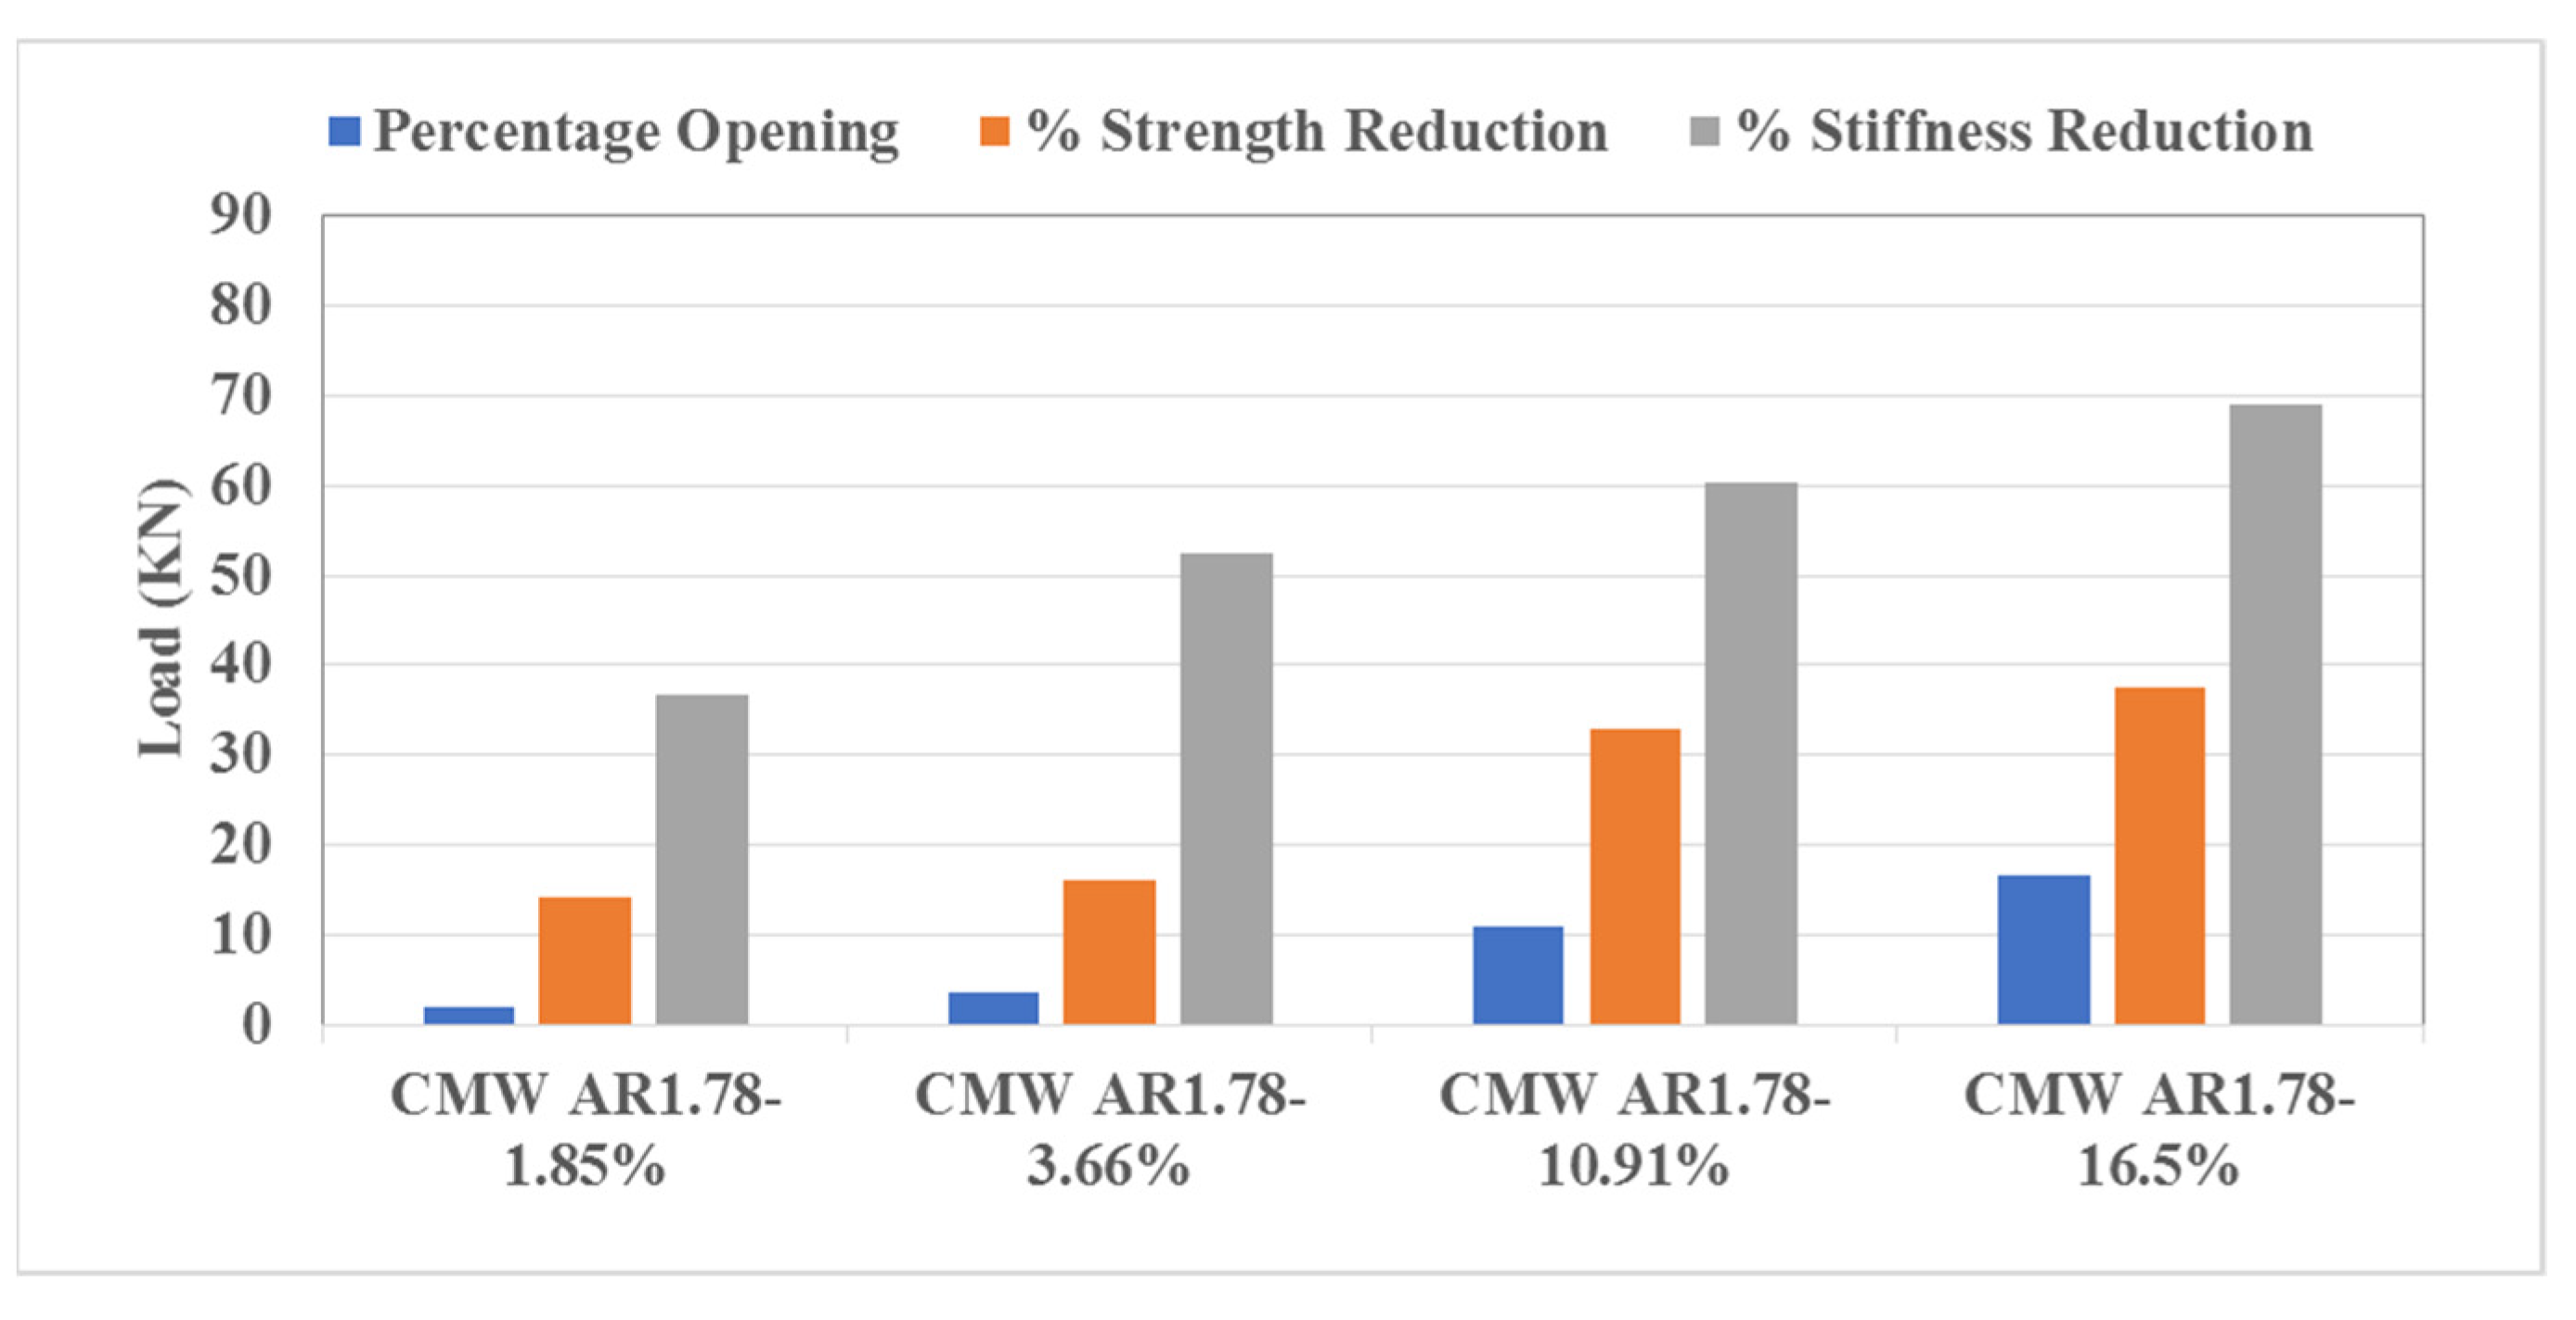
3.4. Impact of Openings on the Confined Masonry Walls

3.4.1. Peak Load and Lateral Strength

Table 3 summarizes the peak loads, strength, and stiffness of confined masonry walls.
It can be seen that the maximum load-carrying capacity of CMW AR1.78–0% was obtained as 193.17 kN, whereas the peak load value of CMW AR1.78–1.85% was obtained as 165.5 kN. The reduction in the peak load value of CMW AR1.78–1.85% was observed as only 14.29%, which means that the impact of a small opening in the case of confined masonry walls is slightly lower. Similarly, the peak load value obtained for CMW AR1.78–3.66% was 162.35 kN and the reduction obtained was 15.95%, which means that the increase in the opening size from 1.85% to 3.66% did not affect the lateral strength of confined masonry wall that much, but when the opening size was increased from 3.66% to 10.91%, the lateral strength reduction was found to be 32.93% with the peak load value of 129.56 kN. This was the maximum difference observed between the opening percentages and lateral strength. When the percentage of the opening was further increased to 16.5%, the reduction in the peak load was found to be 37.43% with a peak load value of 120.87 kN. We can see that the total reduction which took place in the case of confined masonry walls was found to be only 37.43% even with the maximum percentage of opening (16.5%).

3.4.2. Stiffness Reduction

The strength and stiffness reduction in confined masonry walls are graphically presented in Figure 17.
The maximum initial stiffness value obtained for CMW AR1.78–0% was 52,808.06 kN/m. In CMW AR1.78–1.85%, the introduction of the opening decreased the initial stiffness to 33,437.00 N/m, which was found to be 36.68% less. When the opening percentage was increased to 3.66%, the initial lateral stiffness decreased to 52.35 kN/m. The lateral stiffness continued to decrease with the increase of the opening percentage. CMW AR1.78–10.91% gave a reduction in lateral stiffness of 60.26%, in this case, the opening percentage was increased from 3.66% to 10.91%, but the stiffness reduction was not that much. The initial stiffness obtained for CMW AR1.78–16.5% was 16,412.80 kN/m and the maximum reduction which took place in this wall was 69.92%.

3.4.3. Failure Type

In the case of confined masonry walls, the load was first taken by the confining frame and then it was transferred to the inner brick elements, due to which the steel present in the left column of all the walls yielded first, and only in the confined masonry wall with a 16.5% opening did the steel in the right confining column also yield. The failure type in the first three confined masonry walls remained flexural, but in CMW AR1.78–10.91% and CMW AR1.78–16.5% the failure changed to a combination of shear and flexure. The sliding shear was prevented due to the confinement present on both sides. The minimum and maximum stresses also kept changing with the loading. The position of steel yielding in the confining columns and the stresses in walls can be seen from Figure 18, Figure 19, Figure 20, Figure 21 and Figure 22.

3.5. Benefits of Confinement

3.5.1. Peak Load and Lateral Strength

Figure 23 shows a comparison of peak loads between unconfined and confined masonry walls.
It can be seen that the lateral strength of both unconfined and confined masonry walls decreases with the increase in opening percentage and the total reduction in the case of unconfined masonry walls was 80.10%, but in the case of confined masonry walls it was only 37.43%. This difference is even less than two times and it indicates that the impact of openings is greater in the case of unconfined masonry walls than in the case of confined masonry walls. Figure 23 also tells us that confined masonry walls with openings are better in terms of peak loads because the walls with the same aspect ratio and the same percentage of opening gave higher peak loads than unconfined masonry walls in all cases. The confined masonry wall with the maximum percentage of opening gave a maximum lateral strength of 120.87 kN, which was even greater than that of the unconfined masonry wall having no opening at all, which gives us a clear indication of the importance of confinement in the case of larger openings, especially in seismic-prone areas. The comparison of the pushover curves can be seen in Figure 24, Figure 25, Figure 26, Figure 27 and Figure 28 and the strength reduction comparison is presented in Figure 29.

3.5.2. Stiffness

The difference in the initial stiffness between the unconfined and confined masonry walls can be seen in Figure 24, Figure 25, Figure 26, Figure 27 and Figure 28. It is clear that the confined masonry walls give more initial stiffness as compared to the unconfined masonry walls, but the stiffness reduction was comparable with confined masonry walls with a little less on the opening sides. A comparison of the reduction in stiffness can be seen in Figure 30.

3.5.3. Failure Type

The failure type remained flexural in both cases in the first three walls, but when the percentage of the opening increased to 10.91%, the failure shifted to more of a mixture of shear and flexure. Confinement prevented the sliding shear failure in the wall with a 16.5% percentage of opening.

4. Conclusions

A comparative study on the numerical investigation of the impact of openings on the in-plane stiffness and strength of confined and unconfined masonry walls was carried out. The results revealed that the confined masonry walls provide better resistance against seismic activities as compared to unconfined masonry walls with openings. The stiffness of the unconfined masonry can reduce drastically due to openings in walls, while this reduction is very little in the case of confined masonry. It was observed that the lateral load-carrying capacity of unconfined masonry walls may be reduced by up to 28.5% when incorporating only a 1.85% opening. This reduction increases to 76.5% with a 16.5% opening. However, in the case of confined masonry wall panels, the reduction of lateral load-carrying capacity was limited to 14% with a 1.85% opening and 37.5% with a 16.5% opening. This corresponds to around a 50% improvement in the case of confined masonry walls. Furthermore, it was observed that on providing confinement in masonry wall panels with large openings, the failure mode shifts from flexural cracking to a hybrid failure mode including both flexural and shear cracking. This may help in the absorption of more seismic energy. Based on these outcomes, it can be concluded that the use of a confined masonry approach may be strongly recommended (especially in seismically active zones).

Author Contributions

Conceptualization, U.A.M., A.A. and A.U.Q.; Data curation, A.A., U.A.M., S.A. and W.A.; Formal analysis, U.A.M., A.S. and M.M.S.; Funding acquisition, W.A., A.S. and M.M.S.; Investigation, A.A., U.A.M., S.A., W.A., A.S. and M.M.S.; Methodology, A.A., A.U.Q. and U.A.M.; Resources, S.A., W.A., A.S. and M.M.S.; Software, U.A.M.; Supervision, A.A. and A.U.Q.; Validation, S.A. and W.A.; Visualization, U.A.M. and A.U.Q.; Writing—original draft, U.A.M. and A.A.; review & editing, A.A., S.A. and W.A. All authors have read and agreed to the published version of the manuscript.

Funding

This research received no external funding.

Institutional Review Board Statement

Not applicable.

Informed Consent Statement

Not applicable.

Data Availability Statement

Not applicable.

Conflicts of Interest

The authors declare no conflict of interest.

References

  1. Giordano, A.; Guadagnuolo, M.; Faella, G. Pushover analysis of plan irregular masonry buildings. In Proceedings of the 14th World Conference on Earthquake Engineering, Beijing, China, 12–17 October 2008. [Google Scholar]
  2. Gokdemir, H.; Özbaşaran, H.; Dogan, M.; Ünlüoğlu, E.; Albayrak, U. Effects of torsional irregularity to structures during earthquakes. Eng. Fail. Anal. 2013, 35, 713–717. [Google Scholar] [CrossRef]
  3. Wikipedia Report. Kashmir Earthquake. Available online: https://en.wikipedia.org/wiki/2005_Kashmir_earthquake (accessed on 13 March 2022).
  4. EN 1998-1:2004; Eurocode 8: Design of Structures for Earthquake Resistance—Part 1: General Rules, Seismic Actions, and Rules for Buildings. European Committee for Standardization: Brussels, Belgium, 2004.
  5. EN 1998-3:2005; Eurocode 8: Design of Structures for Earthquake Resistance—Part 3: Assessment and Retrofitting of Buildings. European Committee for Standardization: Brussels, Belgium, 2005.
  6. Brzev, S. Earthquake-Resistant Confined Masonry Construction; National Information Center of Earthquake Engineering, Indian Institute of Technology: Kanpur, India, 2007; ISBN 8190419099. [Google Scholar]
  7. Caliò, I.; Marletta, M.; Pantò, B. A new discrete element model for the evaluation of the seismic behavior of URM buildings. Eng. Struct. 2012, 40, 327–338. [Google Scholar] [CrossRef]
  8. Raka, E.; Spacone, E.; Sepe, V.; Camata, G. Advanced frame element for seismic analysis of masonry structures: Model formulation and validation. Earthq. Eng. Struct. Dyn. 2015, 44, 2489–2506. [Google Scholar] [CrossRef]
  9. Tomaževič, M. The Computer Program POR; Report ZRMK; ZRMK: Ljubljana, Slovenia, 1978. (In Slovenian) [Google Scholar]
  10. Lagomarsino, S.; Penna, A.; Galasco, A.; Cattari, S. TREMURI program: An equivalent frame model for the nonlinear seismic analysis of masonry buildings. Eng. Struct. 2013, 56, 1787–1799. [Google Scholar] [CrossRef]
  11. Magenes, G.; Della Fontana, A. Simplified non-linear seismic analysis of masonry buildings. In Proceedings of the 5th International Masonry Conference, London, UK, 13–15 October 1998; pp. 190–195. [Google Scholar]
  12. Vanin, A.; Foraboschi, P. Modelling of masonry panels by truss analogy—Part 1. Mason. Int. 2009, 22, 1–10. [Google Scholar]
  13. Barraza, J.A.C. Numerical Model for Nonlinear Analysis of Masonry Walls. Ph.D. Thesis, Aachen University, La Serena, Chile, 2012. [Google Scholar]
  14. Abdullah, K.F.; Cuningham, L.S.; Gillie, M. Simulating masonry wall behaviour using a simplified micro-model approach. Eng. Struct. 2017, 151, 349–365. [Google Scholar] [CrossRef]
  15. Panday, B.H.; Meguro, K. Simulation of brick masonry wall behavior under in-plane lateral loading using applied element method. In Proceedings of the 13th World Conference on Earthquake Engineering, Vancouver, BC, Canada, 1–6 August 2004. [Google Scholar]
  16. Erdal, M.; Isik, N.S.; Can, O.; Kopraman, Y.; Buyukkaragozet, A. Lateral Strength of Masonry Walls with Openings: Analytical Approach. In Proceedings of the Conference on Application of Efficient & Renewable Energy Technologies in Low Cost Buildings and Construction, Ankara, Turkey, 16–18 September 2013. [Google Scholar]
  17. Arya, S.K.; Hegemier, G.A. Non-linear response predictions of concrete masonry assemblies. In Proceedings of the Conference North American Masonry, Boulder, CO, USA, 14–16 August 1978; pp. 19.1–19.24. [Google Scholar]
  18. Page, A.W. A Finite Element Model for Masonry. J. Struct. Div. 1978, 104, 1267–1285. [Google Scholar] [CrossRef]
  19. Lotfi, H.R.; Shing, P.B. Interface model applied to fracture of masonry structures. J. Struct. Eng. 1994, 120, 63–80. [Google Scholar] [CrossRef]
  20. Shing, P.; Cao, L. Analysis of Partially Grouted Masonry Shear Walls; US Department of Commerce: Washington, DC, USA, 1997; pp. 97–710. [Google Scholar]
  21. Kumar, N.; Amirtham, R.; Pandey, M. Plasticity based approach for failure modelling of unreinforced masonry. Eng. Struct. 2014, 80, 40–52. [Google Scholar] [CrossRef]
  22. Citto, C. Two-Dimensional Interface Model Applied to Masonry Structures. Master’s Thesis, University of Bologna, Bologna, Italy, 2008. [Google Scholar]
  23. Aref, A.J.; Dolatshahi, K.M. A three-dimensional cyclic meso-scale numerical procedure for simulation of unreinforced masonry structures. Comput. Struct. 2013, 120, 9–23. [Google Scholar] [CrossRef]
  24. Alcocer, S.M.; Zepeda, J.A. Behavior of multi-perforated clay brick walls under earthquake type loading. In Proceedings of the 8th North American Masonry Conference, Austin, TX, USA, 16–19 June 1999; pp. 235–246. [Google Scholar]
  25. Alcocer, S.M.; Arias, J.G.; Vazquez, A. Response assessment of Mexican confined masonry structures through shaking table tests. In Proceedings of the 13th World Conference on Earthquake Engineering, Vancouver, BC, Canada, 1–6 August 2004; p. 2130. [Google Scholar]
  26. Aguilar, G.; Meli, R.; Diaz, R.; Vazquez-del-Mercado, R.S. Influence of the horizontal reinforcement on the behavior of confined masonry walls. In Proceedings of the 11th World Conference on Earthquake Engineering, Acapulco, Mexico, 23–28 June 1996. [Google Scholar]
  27. Gostic, S.; Zarnic, R. Cyclic lateral response of masonry infilled RC frames and confined masonry walls. In Proceedings of the 8th North American Masonry Conference, Austin, TX, USA, 16–19 June 1999; pp. 477–488. [Google Scholar]
  28. Gouveia, J.; Lourenço, P. Masonry shear walls subjected to cyclic loading: Influence of confinement and horizontal reinforcement. In Proceedings of the 10th North American Masonry Conference (10NAMC), Saint Louis, MO, USA, 3–5 June 2007. [Google Scholar]
  29. Irimies, M.T. Confined Masonry Walls: The influence of the tie-column vertical reinforcement ratio on the seismic behaviour. In Proceedings of the 12th European Conference on Earthquake Engineering, London, UK, 9–13 September 2002. [Google Scholar]
  30. Ahmed, A.; Shahzada, K. Seismic vulnerability assessment of confined masonry structures by macromodeling approach. Structures 2020, 27, 639–649. [Google Scholar] [CrossRef]
  31. Moghaddam, H.A. Seismic Design of Masonry Building; Sharif University Press: Tehran, Iran, 2006. (In Persian) [Google Scholar]
  32. Bruneau, M. Performance of masonry structures during the 1994 Northridge (Los Angeles) Earthquake. Can. J. Civ. Eng. 1995, 22, 378–402. [Google Scholar] [CrossRef]
  33. Ahmed, A.; Shahzada, K.; Ali, S.M.; Khan, A.N.; Shah, S.A.A. Confined and unreinforced masonry structures in seismic areas: Validation of macro models and cost analysis. Eng. Struct. 2019, 199, 109612. [Google Scholar] [CrossRef]
  34. Cruz, O.; Gavilan, P. Seismic performance of confined masonry walls with joint reinforcement and aspect ratio: An experimental study. Eng. Struct. 2021, 242, 112484. [Google Scholar] [CrossRef]
  35. Singhal, V.; Rai, D.C. Seismic behavior of confined masonry walls when subjected to inplane and out of plane loadings. In Proceedings of the 10th U.S. National Conference on Earthquake Engineering, Frontiers of Earthquake Engineering, Anchorage, Alaska, 21–25 July 2014. [Google Scholar]
  36. Sun, J.; Ono, T.; Zhao, Y.; Wang, W. Lateral load pattern in pushover analysis. Earthq. Eng. Eng. Vib. 2003, 1, 99–107. [Google Scholar]
  37. Makarios, T.K. Optimum definition of equivalent non-linear SDF system in pushover procedure of multistory r/c frames. Eng. Struct. 2005, 27, 814–825. [Google Scholar] [CrossRef]
  38. Jiang, Y.; Li, G.; Yang, D. A modified approach of energy balance concept based multimode pushover analysis to estimate seismic demands for buildings. Eng. Struct. 2010, 32, 1272–1283. [Google Scholar] [CrossRef]
  39. Mughal, U.A.; Qazi, A.U.; Hassan, F.; Rasool, A.M.; Hameed, A. Numerical investigation of openings on lateral strength of masonry walls. Key Eng. Mater. 2022, 913, 247–255. [Google Scholar] [CrossRef]
  40. Lourenco, P.J.B. Computational Strategies for Masonry Structures. Ph.D. Thesis, University of Delft, Delft, The Netherlands, 1996. [Google Scholar]
  41. Magenes, G.; Morandi, P.; Penna, A. ESECMaSE—Tests Results on the Behaviour of Masonry under Static Cyclic in Plane Loads; ESECMaSE University of Pavia: Pavia, Italy, 2008. [Google Scholar]
  42. Tripathy, D.; Singhal, V. Estimation of in-plane shear capacity of confined masonry walls with and without openings using strut-and-tie analysis. Eng. Struct. 2019, 188, 290–304. [Google Scholar] [CrossRef]
Figure 1. Finite Element Approaches. (a) Macro-modeling approach, (b) Simplified micro-modeling, (c) Detailed micro-modeling approach.
Sustainability 14 07467 g001
Figure 2. Schematics of unconfined masonry walls with varying opening percentages. (a) MW AR1.78–0%, (b) MW AR1.78–1.85%, (c) MW AR1.78–3.66%, (d) MW AR1.78–10.91%, (e) MW AR1.78–16.5%.
Sustainability 14 07467 g002
Figure 3. Schematics of confined masonry walls with varying opening percentages. (a) CMW AR1.78–0%, (b) CMW AR1.78–1.85%, (c) CMW AR1.78–3.66%, (d) CMW AR1.78–10.91%, (e) CMW AR1.78–16.5%.
Sustainability 14 07467 g003
Figure 4. Schematics of connection between brick elements using springs and contact elements.
Sustainability 14 07467 g004
Figure 5. Tributary area.
Sustainability 14 07467 g005
Figure 6. Pushover curves comparison between numerical and experimental results.
Sustainability 14 07467 g006
Figure 7. Pushover curve with stress distributions of MWAR 1.78–0%.
Sustainability 14 07467 g007
Figure 8. Pushover Curves of MWAR 1.78 with Openings.
Sustainability 14 07467 g008
Figure 9. Third Principle Stresses MW AR1.78–0%.
Sustainability 14 07467 g009
Figure 10. Third Principle Stresses MWAR 1.78–1.85%.
Sustainability 14 07467 g010
Figure 11. Third Principle Stresses MW AR1.78–3.66%.
Sustainability 14 07467 g011
Figure 12. Third Principle Stresses MW AR1.78–10.91%.
Sustainability 14 07467 g012
Figure 13. Third Principle Stresses MW AR1.78–16.5%.
Sustainability 14 07467 g013
Figure 14. Pushover curves of Confined Masonry Walls with varying percentages of openings.
Sustainability 14 07467 g014
Figure 15. Lateral Strength Reduction in unconfined masonry walls.
Sustainability 14 07467 g015
Figure 16. Strength and Stiffness reduction in Unconfined Masonry Walls.
Sustainability 14 07467 g016
Figure 17. Strength and Stiffness reduction in Confined Masonry Walls.
Sustainability 14 07467 g017
Figure 18. Third Principle Stresses CMW AR1.78–0%.
Sustainability 14 07467 g018
Figure 19. Third Principle Stresses CMW AR1.78–1.85%.
Sustainability 14 07467 g019
Figure 20. Third Principle Stresses CMW AR1.78–3.66%.
Sustainability 14 07467 g020
Figure 21. Third Principle Stresses CMW AR1.78–10.91%.
Sustainability 14 07467 g021
Figure 22. Third Principle Stresses CMW AR1.78–16.5%.
Sustainability 14 07467 g022
Figure 23. Peak Loads Comparison.
Sustainability 14 07467 g023
Figure 24. Pushover curves of walls with 0% opening.
Sustainability 14 07467 g024
Figure 25. Pushover curves of walls with 1.85% opening.
Sustainability 14 07467 g025
Figure 26. Pushover curves of walls with 3.66% opening.
Sustainability 14 07467 g026
Figure 27. Pushover curves of walls with 10.91% opening.
Sustainability 14 07467 g027
Figure 28. Pushover curves of walls with 16.5% opening.
Sustainability 14 07467 g028
Figure 29. Comparison of Strength Reduction.
Sustainability 14 07467 g029
Figure 30. Comparison of Stiffness Reduction.
Sustainability 14 07467 g030
Table 1. Properties of Elements used.
Maximum Compressive Strength of Brick = fb =26,500 kN/m2
Maximum compressive strength of mortar = fm =12,300 kN/m2
Initial elastic modulus of bricks = Eb =9,407,500 kN/m2
Initial elastic modulus of mortar = Em =2,460,000 kN/m2
Poisson’s coefficient for brick elements = νb =0.2
Poisson’s coefficient for mortar = νm =0.15
Normal Stiffness = kN =66,727,500 kN/m
Tangential Stiffness = Ks =28,973,783 kN/m
Yield Strength of Reinforcement = σy =280 MPa
Table 2. Openings vs. Stiffness and Strength for unconfined masonry walls.
Masonry WallsOpening Size (m)Peak Load (kN)% Reduction in Strength Initial Stiffness (kN/m)% Reduction in
Stiffness
MW AR1.78–0%0.00117.170.0043,448.240.00
MW AR1.78–1.85%0.25 × 0.2584.4427.9331,049.8028.54
MW AR1.78–3.66%0.25 × 0.559.8948.8821,365.5250.83
MW AR1.78–10.91%0.5 × 0.7533.2271.6516,538.5861.93
MW AR1.78–16.5%0.75 × 0.7523.3280.1010,253.7576.40
Table 3. Openings vs. Stiffness and Strength for Confined Masonry Walls.
Confined Masonry WallsOpening Size (m)Peak Load (kN)% Reduction in Strength Initial
Stiffness (kN/m)
% Reduction in Stiffness
CMW AR1.78–0%0.00193.170.0052,808.060.00
CMW AR1.78–1.85%0.25 × 0.25165.5714.2933,437.0036.68
CMW AR1.78–3.66%0.25 × 0.5162.3515.9525,165.0752.35
CMW AR1.78–10.91%0.5 × 0.75129.5632.9320,987.0060.26
CMW AR1.78–16.5%0.75 × 0.75120.8737.4316,412.8068.92
Publisher’s Note: MDPI stays neutral with regard to jurisdictional claims in published maps and institutional affiliations.

