Article

The Spatial Distribution and Optimization of Medical and Health Land from the Perspective of Public Service Equalization: A Case Study of Urumqi City

1
School of Public Management, Xinjiang Agricultural University, Urumqi 830052, China
2
Center for MPA Program, Xinjiang Agricultural University, Urumqi 830052, China
3
MPA Education Center, Jiangsu Ocean University, Lianyungang 222005, China
4
Jiangsu Institute of Marine Resources Development, Lianyungang 222005, China
*
Author to whom correspondence should be addressed.
Sustainability 2022, 14(13), 7565; https://doi.org/10.3390/su14137565
Submission received: 25 May 2022 / Revised: 11 June 2022 / Accepted: 18 June 2022 / Published: 21 June 2022

Abstract

:
From the two aspects of land quantity and spatial distribution, this article studies the existing problems and ideas for optimizing the supply of medical and health (M&H) land for municipal units to promote an equal supply of urban public services. Method: The existing problems were explored with the help of the kernel density, the spatial gravity model and the buffer zone analysis method, and the key optimization areas of M&H land under the trends of population flow were explored by constructing a suitability evaluation system for the natural, social and ecological elements. Results: The total amount of M&H land in the study area was lower than the standard. The characteristics of land supply that support hospitals and primary medical care are different, which makes it difficult for the population in different regions to obtain services from the two types of medical facilities. The supply of both types of land has room for improvement. Conclusion: The effect of public M&H supply is greatly affected by the factors of land supply, which directly causes the problem of uneven medical services in different regions. The land-use layout should be scientifically planned according to the characteristics of different regions.

1. Introduction

Basic public services are non-profit services provided to residents, with the government as the main body. Basic public services, including M&H care, public culture, education, etc., can effectively meet the various needs of people’s lives and improve people’s happiness. Previous studies have indicated that aging, residential segregation by class or due to spatial income inequality, and spatial population density may hinder equal and efficient access of residents to basic public services [1,2,3,4,5]. Spatial inequalities in public services that correlate with different social classes are found in many cities around the world [6,7]. The development characteristics of most Chinese cities may be different from those of some Western countries. Residential segregation has not led to a decayed inner city and wealthy suburbs but has remained vibrant by redevelopment projects, while the low-income population has been progressively and extensively displaced to the urban fringe [8,9,10]. As the unit supporting public service facilities, land has the characteristic of a fixed location, and it is difficult to change its use. The difference in the area and location of each public service facility on the land leads to the difference in the upper limit of the service capability provided. The construction of basic public services is a key breakthrough point in the development of new urban areas and is one of the basic conditions to ensure the comprehensive development of a city as well as social equity and justice [11]. In China, urban land is owned by the state, which can improve the efficiency of local governments in allocating land for public facilities in accordance with urban planning. It also makes them pre-deploy new public service land in new areas of development readily in order to pursue the leading role of public service facilities in population migration to a greater extent. Such approach will accelerate local development, but at the same time, this may cause scarcity of public services in some regions because of non-optimized allocation of resources. Therefore, our research aims to verify whether the M&H service in the city center and suburban areas can match the size and spatial distribution pattern of the current population. In addition, we also aim to investigate whether the layout of M&H land in the study area has been affected by the policy and whether the M&H land has been deployed ahead of schedule. Cities around the world are committed to increasing the level of spatial equity of public services. Arguably, the main problem is not the lack of this service itself but the limited access to it [1]. Spatial inequality has been a hot subject in recent decades [12], as even Europe still has relevant problems [13]. In recent years, the focus of spatial equity research has still been on the positioning and layout optimization of public services [14]. M&H is a typical type of basic public service, and people who live in areas with good access to M&H can obtain greater feelings of happiness and security than those in underserved areas [15,16,17]. The COVID-19 epidemic that broke out at the end of 2019 is still having a severe impact on the world. The way to further build and improve the M&H system to deal with possible outbreaks of infectious diseases has attracted extensive attention from scholars in various fields [18,19]. M&H land is a type of land in the public management and public service system and is important in supporting public M&H service facilities. The spatial equity of M&H land is the object of this research, and the method of measurement is the spatial accessibility of M&H land.
When measuring spatial accessibility, it must be emphasized that the M&H land is distributed to provide services to people. Likewise, many researchers take the demand side of public services, that is, urban residents, as a comparison object for exploring the spatial matching between service provision and the needs of user groups [14,20,21]. This research refers to the ideas of Jin et al. [15,22] when measuring M&H land/facilities accessibility: firstly, the volume of services provided relative to the population’s size, and secondly, the proximity of services provided relative to the location of the population.
As for the types of data, researchers used questionnaires [23,24,25], field surveys [26], postal code locations [27] to measure the service capacity of land or facilities. These methods are time-consuming and lack spatial clarity and comprehensiveness. With the rapid development and wide application of Internet Big Data, data sources represented by POI provide new possibilities for evaluating facility service capabilities [14,28,29,30]. These new data types have been widely used in measuring the spatial layout of M&H land/facilities [15], public toilets [31], restaurants [32], stadiums [8], green space [33], etc. AOI is very similar to POI, but the difference is that AOI is a polygon file, which can clearly represent the shape and boundary of the land. Meanwhile, it can also take into account the advantages of accurate and timely acquisition of POI data. At the demand level, census data and social statistical yearbooks used to be the main tools for analyzing population layout. The advantage is that they perform well in the calculation of the total population on a large scale, but they cannot be refined to a smaller scale, such as the neighborhood or street level, and cannot reflect the changes in population density on a small scale and in a timely manner. Some researchers have also tried to compensate for the accuracy problem by combining night-time light remote sensing data [34]. In contrast, in recent years, some scholars have begun to attempt to reflect the spatial population density in a small range by using mobile phone signaling data [35]. The authors chose census data as the volume of the total population and combined it with a Baidu heat map generated by Internet Big Data to reflect the spatial population density of residents.
As for the methods applied, the provider-to-population ratios are considered to be the most popular measurement for spatial accessibility, which can sufficiently determine the minimum supply standard and underserved areas from the perspective of policy analysis [22,36,37]. Nevertheless, its disadvantage is that it cannot be effectively adapted to a small scale. The space gravity model is a method combining the indicators of accessibility and availability. Previous studies have shown that the space gravity model can provide more effective measures of public service accessibility than other models [17,38,39]. To analyze the spatial equity, the authors use a provider-to-population ratio model to measure the M&H land area per capita in different regions and use the fishnet and kernel density method to show the spatial distribution characteristics of population and M&H land/facilities. Then, the spatial equity of M&H from the perspective of supply and demand is reflected by using the spatial gravity model and buffer zone method.
The novelties of this study: First of all, land instead of facilities is mainly taken as the object of the analysis of public service supply, which can make a more effective evaluation of the current situation of public service layout and optimization from the source. Secondly, traditional data (census data, remote sensing images, DEM data) and Internet Big Data (Baidu heat map, AOI\POI) are combined, and a traditional quantitative method is combined with spatial gravity models. This can make up for the limitations of traditional data and methods and give better play to the advantages of new data. Especially, AOI can effectively provide help for the analysis of land layout. Thirdly, the M&H land suitability evaluation results and the urban planning approved by the local government can not only effectively alleviate the spatial inequity of the case area but also make the research results easier to put into practice.
From the “Planning Standards for Urban Public Service Facilities (Draft for Comment)” issued by the Ministry of Housing and Urban-Rural Development of China in 2018, the minimum supply standard of M&H land per capita in a city was created [40]. Each Chinese city should provide corresponding land according to its own population scale: the per capita M&H land area in cities with a population of three million to five million should be at least 0.8 m2, and the per capita hospital land should reach 0.48 m2. Combined with the above background and current research progress, and based on the perspective of equalizing public services, by referring to the current population distribution in the central urban area of Urumqi, this article will analyze the allocation of existing M&H land by means of the kernel density, the spatial gravity model and the buffer zone method. The article will also evaluate the suitability of the land reserved for public management and public services in the Urban Plan of Urumqi and propose future optimization advice for the scale and location of new M&H land (Figure 1). The goals of the article: (1) Identify and calculate whether the total area of M&H land in the case area can meet the minimum needs of people, whether the per capita M&H land area can reach 0.8 m2 per capita, and whether the per capita hospital land can reach 0.48 m2. (2) Analyze the spatial distribution of the M&H land by measuring the spatial accessibility. (3) Put forward suggestions for the optimization of M&H land in the study area according to the suitability evaluation results.

2. Materials and Methods

This research selected the municipal district of Urumqi, Xinjiang, as the case study area (Figure 2). Urumqi is located in northwestern China and is the capital of Xinjiang. Most of China’s cities and population are distributed in the southeast, while the northwest is a relatively underdeveloped region. Urumqi is one of the most important big cities in the northwest of China, and its development degree has a significant impact on the improvement of the whole northwest of China. According to the results of the seventh national census released in November 2020, the city has 4.054 million people, of which the urban population accounts for more than 90%. The scope of the study area includes the Xinshi District, Toutunhe District, Tianshan District, Shayibak District, Midong District, Shuimogou District and parts of Urumqi County, with a total area of 1505.03 km2. Urumqi’s urban plan divides the urban area of Urumqi into a layout of “one axis, two cores and multiple centers”. The urban area’s comprehensive service expansion axis connects the downtown area and the new north area of the city and is called the “one axis”, and the two areas at both ends of the axis are the “dual cores”. The multiple centers consist of seven areas: the Airport Group, the High-speed Rail Group, the Exhibition Group, the Midong Group, the Sanping Group, the Bayi Steel Group and the Xishan Group, which are distributed on both sides of the axis.

2.1. Materials

The base map of GIS data was obtained referring to the RS images downloaded from the GS Cloud (http://www.gscloud.cn, accessed on 5 March 2021) in 2021, and the M&H land was based on the AOI (polygon) and POI (point) data crawled from AutoNavi (http://ditu.amap.com, accessed on 17 April 2021) in April 2021. The AOI/POI data of M&H land/facilities contains information including name, latitude and longitude, address, and administrative unit code. AOI is a polygon file that can clearly interpret the shape and boundary of the M&H land. POI is a point file used in this article to represent primary M&H stations, which can be on land with other facilities. The AOI/POI data were preprocessed, including coordinate converting, data cleaning and cross-checking, before being used in measurements. The data used in this article also include the 12.5-m DEM data downloaded from the GS Cloud (http://www.gscloud.cn, accessed on 13 May 2021), and the data on rivers and administrative boundaries were extracted from urban plans. All data were uniformly projected and transformed by the ArcGIS 10.8 tool using the geographic coordinate system of WGS-84. The M&H land was based on Urumqi’s urban plan, which was corrected by referring to the current land use and AOI/POI data. The classification and pretreatment of land in this study also involved the classification of M&H facilities in the “Planning Standards for Urban Public Service Facilities” (GB 50442-20XX) issued by the government [40] in 2018 (Table 1). Under this classification, “community health service stations” in primary M&H institutions do not occupy land independently and are calculated as point files, while other types of facilities occupy land independently and are calculated with polygon files. The data describing residential areas were obtained in a similar way to the data on M&H land. In addition, this article divided residential areas into three categories: residential complexes, housing under construction and low-density settlements (Figure 3).
The population data used in this research are derived from two sources. First, according to the results of the seventh national census released by the government, as of 00:00 on 1 November 2020, there were 4.054 million people in the city, of which the urban population accounted for more than 90%. Therefore, the population of the study area was estimated to be between 3.648 million and 3.852 million. Second, the population distribution was estimated according to the LBS data. Location-based service (LBS) data are internet-based open-source data that can dynamically reflect the characteristics of urban population aggregation, which can make up for the lack of timeliness and dynamics of traditional population data and can accurately reflect the distribution characteristics of a particular urban population at a specific time point [41]. The Baidu heat map is a type of LBS data that can reflect the network’s heat in real-time, as it is updated every 15 min. It generates a real-time spatial distribution map of the population [42], which is valuable to urban research [43]. The author collected data five times from 22:30 to 00:00 on three working days (21, 23 and 25 March 2022) and two weekend days (20 March, 27 March) and took the median for calculations. Referring to Zhang Hailin’s research on population extraction methods, the alpha value (Band 4) in the collected raster data has a linear relationship with the population density level, and the reclassification function of the population aggregation density was established accordingly [44]. The equation is as follows:
           Ni = 10/(151 − 52) × (SAi − 52) + 0,    52 ≤ SAi ≤ 151
            Ni = 10/(163 − 151) × (SAi − 151) + 10,  151 < SAi ≤ 163
Pi = Ni × k such that   Ni = 20/(170 − 163) × (SAi − 163) + 20,  163 < SAi ≤ 170
            Ni = 20/(179 − 170) × (SAi − 170) + 40,  170 < SAi ≤ 179
            Ni = 40/(194 − 179) × (SAi − 179) + 60,  179 < SAi ≤ 194
where Pi represents the population density (per/ha) of the ith raster cell, k is a correction factor, Ni is the inferred pixel population density value and SAi is the alpha value of the ith raster cell. After grid division and collection of zoning statistics, the estimated number of people was counted in the polygonal elements of the current residential area. The correction factor k = 1.38 was calculated. The total population of the study area was calculated to be about 3.726 million, which is within the range of the total population estimated above, and the results can be mutually confirmed with the demographic data as long as the data are available.

2.2. Method

2.2.1. Measurement of Spatial Balance

Spatial aggregation and dispersion of public facilities can express the equilibrium of spatial distribution at a certain level [31]. In this paper, the kernel density estimation is used to evaluate the spatial balance of M&H land of different types. Kernel density is a spatial density surface generated by distance attenuation based on each element scattered across the spatial area from the center, with r being the radius used to divide a certain range [45,46,47]. Kernel densitometric analysis is used to estimate the density and degree of agglomeration of a particular point-like factor. This involves overlaying the density value of each point element to obtain the kernel density value and the density map. The equation is as follows:
D(xi,yi) = (1/ur) × Σi=1u(kr/d)
where D(xi,yi) refers to the kernel density value of point i, r refers to the distance decay threshold, u refers to the number of elements that are less than or equal to r between the distant point i, k refers to the spatial weight function and d refers to the distance between the current point and point i.

2.2.2. Spatial Accessibility Measurement of M&H Land/Facilities

Only land/facilities of hospitals and primary M&H institutions instead of professional M&H institutions will be considered in measurements since such types of institutions do not provide services to residents directly.
The gravity model, originated from physics, is widely introduced and used in spatial analysis for geographers’ work, and such model is becoming the core tool in quantitative research on spatial interaction. Some previous studies have utilized the spatial gravity model to measure the accessibility between supply and demand locations [38,39]. This article analyzed the equalization of M&H land on the basis of spatial accessibility. The model consists of three parts, which are service objects (the starting point), service availability (the path) and the service capability of M&H facilities (the end point) [48,49,50]. The equation is as follows:
Hi = Σj=1m(areaj/D ijβVj)   such that Vj = Σi=1n(popj/D ij2)
where Hi is the spatial accessibility of a street’s or residential area’s centroid to each M&H land area; m is the total quantity of M&H land; Dij is the traffic impedance between i and j, which is expressed by the Euclidean distance in this research; and β is the traffic friction coefficient. In light of the research results of Peeters et al., who found that a traffic friction coefficient between 1.5 and 2 has little effect on the results [51], this article determined β = 2. Vj refers to the impact factor of population size, and popi refers to the population of a street or residential area.
Each piece of land categorized as a primary M&H institution is small, and its distribution in space is almost punctiform. The two types of primary M&H institutions have different service ranges and capacities for serving different numbers of people. Therefore, the buffer zone analysis method is needed to construct the types of spatial patterns faced by people living in different communities. The buffer zone analysis takes point, line, and surface elements as objects, and buffer zone polygons of a certain range are built outward [31]. In this paper, the center of mass of the land served by primary M&H is taken as the center of the circle, and the distance between 300 (primary M&H stations) and 1000 m (primary M&H centers) is taken as the service radius to construct a circular buffer zone. For communities within the service coverage, spatial accessibility should be measured using the spatial gravity model. Primary M&H land/facilities cannot provide services for communities outside the coverage, so the priority of optimizing such services can be expressed by comparing the volume of population of such communities.

3. Results

3.1. Configuration of M&H Land

3.1.1. Quantity Allocation

The supply of medical and health land should match current and future needs, so it is necessary to identify the population size and its spatial distribution characteristics in the study area first (Table 2). The evolution of living space has implications for the current population distribution and its expected distribution in the short-term future. In this study, the population in residential communities and low-density settlements is mainly represented as the distribution area of the current population. Due to the continued advancement of urban renewal and other work, low-density settlements such as urban villages will lose their residential functions in the short term and will be replaced by pre-sale houses currently under construction in the study area. The total population of the existing low-density settlements was projected to be that of the new housing area that is currently under construction, and the specific population density distribution expected for each new residential area was calculated with reference to the population density of the surrounding residential communities by the kriging interpolation. Because of the short time span, the natural population growth rate was ignored, and the total population of low-density settlements was allocated to new housing under construction. Therefore, the population heat of residential communities and new housing under construction is expressed as the short-term future population distribution area.
After preprocessing the data, it was found that there are 220.70 hectares of M&H land in the study area. Calculated by population, the per capita M&H land area in cities with a population of three million to five million should be at least 0.8 m2, which means that there should be 298.11 hectares of this type of land in the study area. According to the relevant standards, there is a total shortage of 77.41 hectares of land in total. There are 108 hospitals in the study area (three under construction), covering an area of about 193.69 hectares. Calculated by population, the construction land per capita for hospitals in cities with a population of three million to five million should be at least 0.48 m2.
There are 69 public hospitals in the study area, including 30 at the regional level (one under construction), 25 at the municipal level (two under construction) and 14 at the district level. There are also 39 private hospitals, which occupy a small area. The high-level public hospitals in the study area cover a larger area, while the total area of district-level public hospitals and social hospitals is smaller. The construction land area per capita of various types of hospitals is far from what is required for each type by the planning indicators. From this point of view, high-level hospitals occupy a large area of land, while the number and area of low-level hospitals are insufficient. The area structure of the hospitals in the study area is unreasonable. The role of low-level hospitals in sharing patient flow is difficult to fully account for, which may lead to problems such as spatial inequity in the medical resources in the study area and serious traffic congestion in the areas around large hospitals.
There are 46 M&H centers and 215 M&H stations in the study area. According to the service capacity of this category, the actual service population capacity is between 2.935 million and 5.44 million. Therefore, it is difficult to judge the service coverage effect of primary M&H institutions by statistics alone, and the configuration needs to be analyzed from the perspective of the spatial layout.
There are 19 professional medical facilities in the study area, and the actual floor area is equivalent to that specified in the standard. Since these types of facilities generally do not provide services directly to residents, it seems that there is no problem in the allocation of such land.

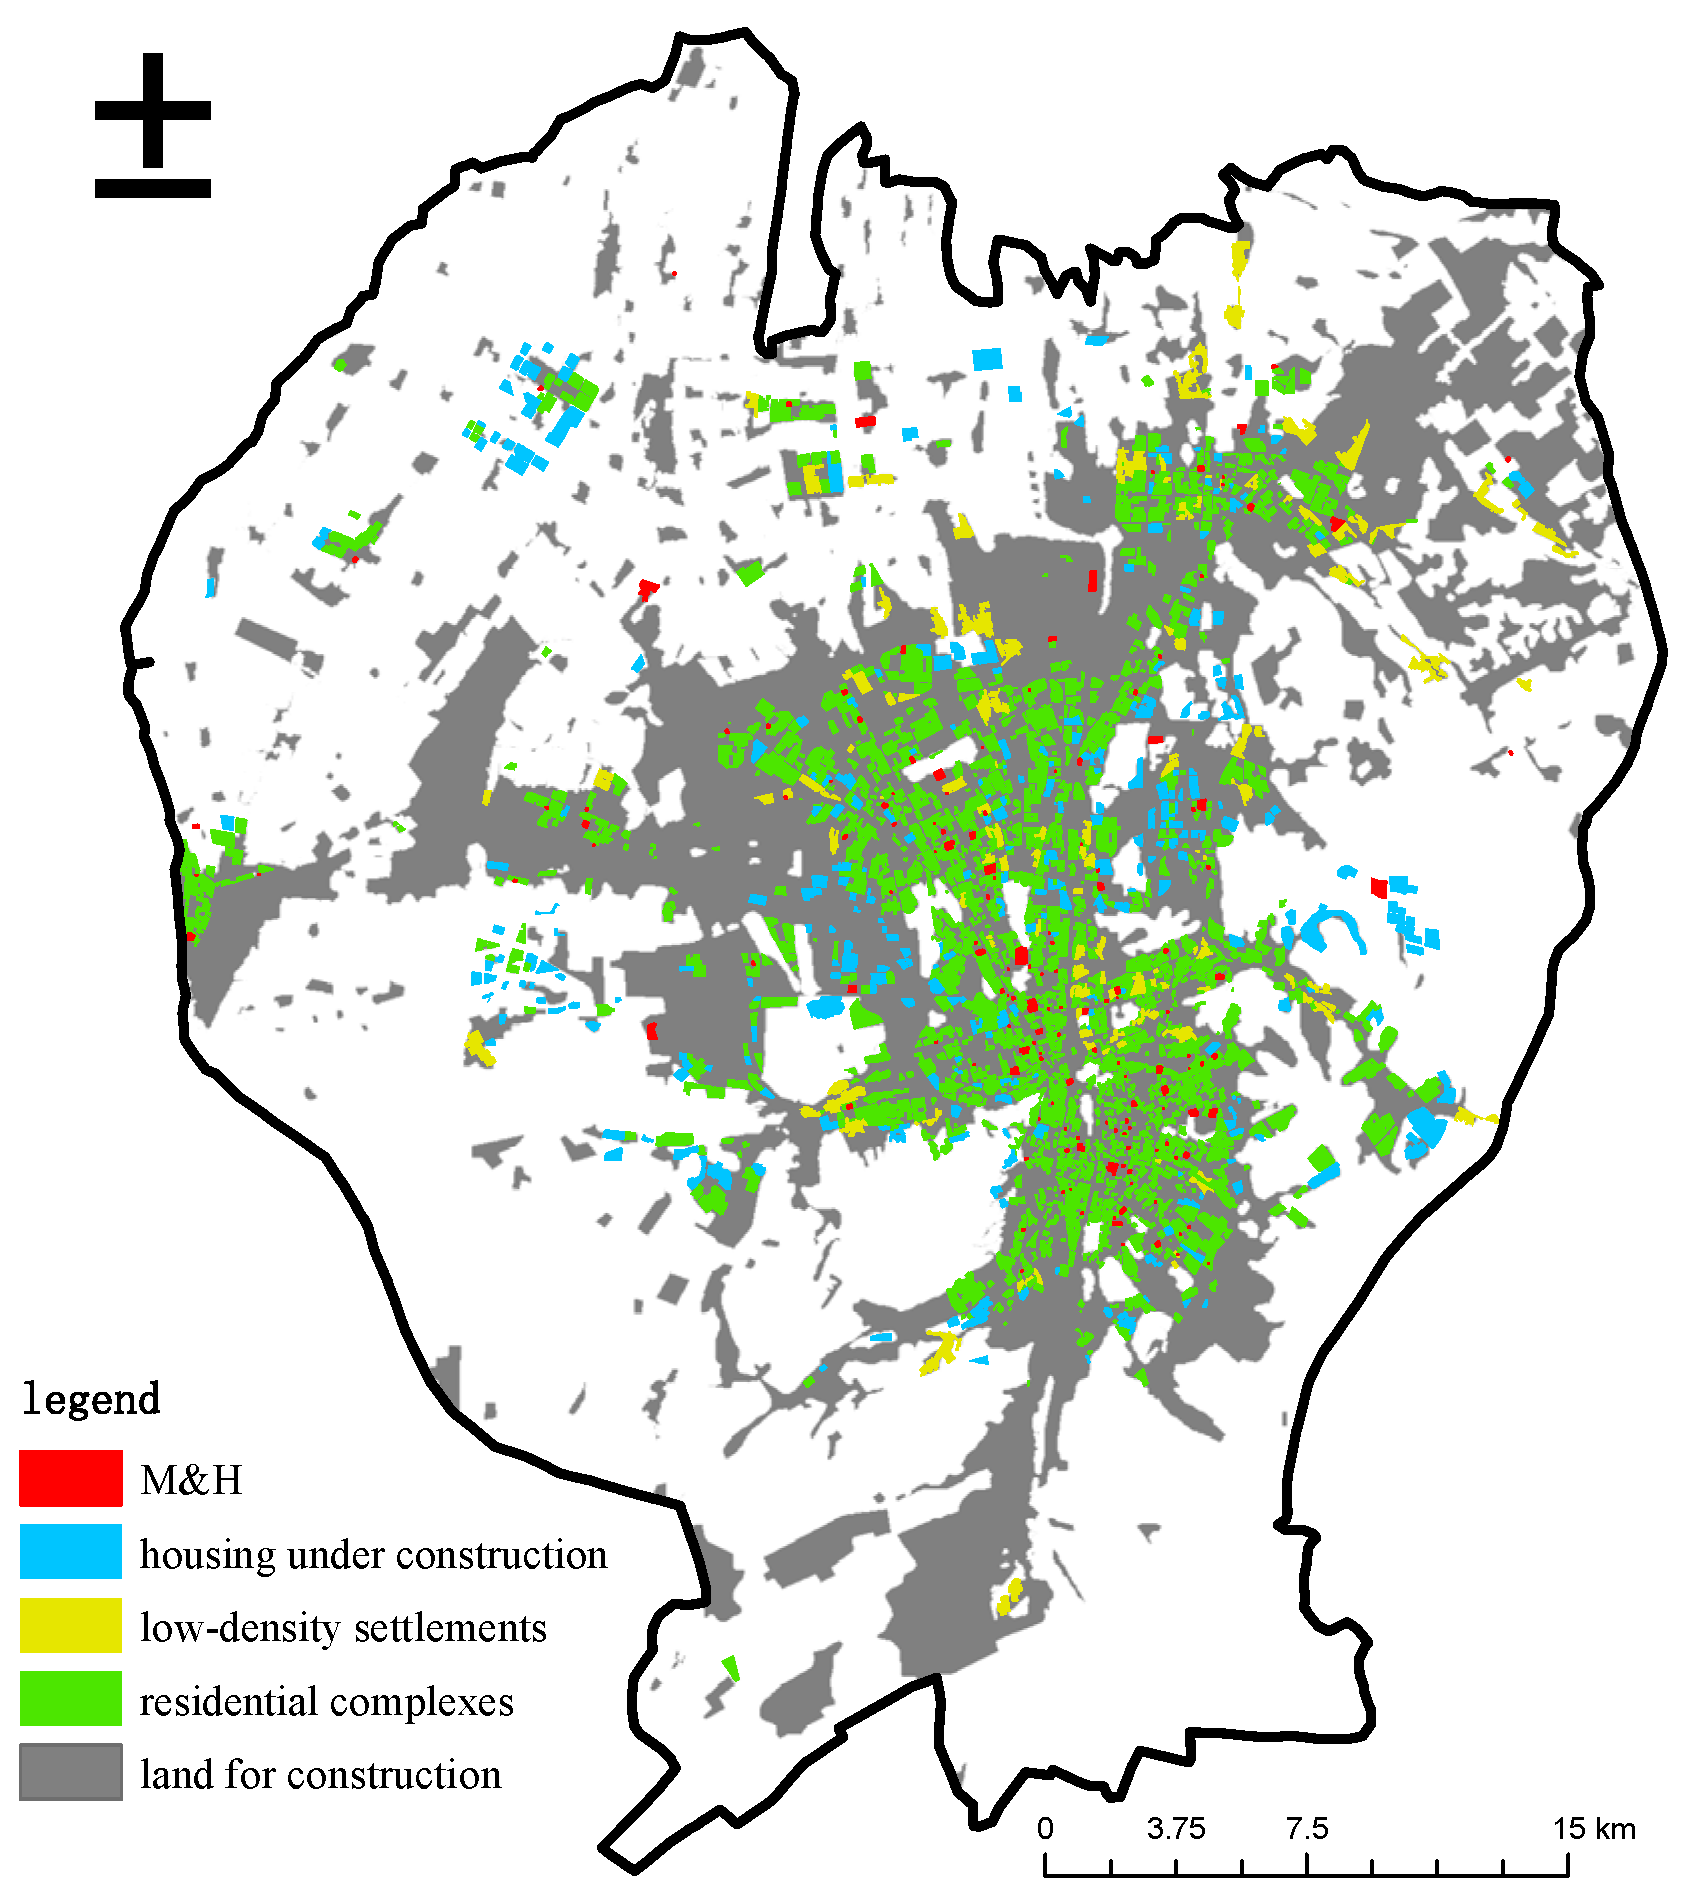
3.1.2. Spatial Allocation

  • Spatial distribution of residents
Urban residents are the target objects of M&H services. When analyzing the spatial distribution of M&H land, we should first analyze the spatial distribution characteristics of these target groups. Otherwise, the phenomenon of spatial mismatch between residential areas and M&H land (facilities) will easily occur [52,53]. There is little difference in the results of residential agglomeration in the two periods. High-value areas are approximately distributed along the direction from southeast to northwest near the “one axis” in the urban plan. (Figure 4). It can be concluded from the variation between the two periods that the population in the study area shows signs of outward expansion. These results show that the high population density in the downtown area will be alleviated to some extent in the short term, and the attractiveness of several new groups such as the High-Speed Rail Group, the Exhibition Group and the Xishan Group has already appeared in part.
  • Spatial Distribution of the M&H Land
Because of the various types of M&H land, their service radii are different, the number of single elements is small, and the number of professional M&H institutions is not closely related to the residential areas. Therefore, this article focuses on an analysis of the spatial allocation of two types of M&H land close to the daily life of urban residents: hospitals and primary M&H institutions.
  • Spatial Pattern of Hospitals
Kernel density can analyze the spatial density and the scale of agglomeration of particular features. According to the results of the kernel density of hospitals (Figure 5a), hospitals are mainly arranged in the downtown area, with a high degree of aggregation of medical resources, and they gradually extend to the new northern area.
The per capita adjacent occupancy of hospital land in each street is the ratio of the total area of land for hospitals within each street to the total internal population. The current average per capita adjacent occupancy is 0.436 m2, which fails to reach the national standard of 0.48 m2 per capita. However, with the completion of the three new hospitals in the short term, the per capita hospital area in the study area will significantly increase and exceed the standard. It can be seen that the three new hospitals will have a significant ability to increase the supply of medical services in the whole area. However, compared with the current situation, with the completion of the three new hospitals, the standard deviation of the per capita occupancy of each street in the study area will increase, widening the gaps in the per capita occupancy of each street. In addition, as hospitals are the main facility for providing M&H services to residents, it is difficult to achieve an absolute balance in the per capita occupation of each street in reality. The service radius of municipal-level hospitals is up to 2 km, and the service radius of regional hospitals is even larger. Therefore, it is not enough to only rely on the per capita occupancy of each street and neighborhood to evaluate the equity patterns of hospitals.
Therefore, the spatial gravity model was used, and the population of each street, the area of each hospital, and the Euclidean distance between the centroid of the street and the centroid of the hospital in the study area were regarded as the “starting point”, “end point” and “path”, respectively. With the help of the ArcGIS 10.8 tool, the accessibility of the hospitals in the study area to each street and neighborhood was explored by the spatial gravity model (Figure 6). The areas where the spatial accessibility of the two periods did not reach 0.48 m2 per capita accounted for the vast majority in the study area, which further showed that the spatial distribution of land for hospitals is still unbalanced.
2.
Spatial Patterns of Primary M&H Institutions
From the results of the spatial kernel density of primary M&H institutions (Figure 5b), it can be seen that compared with hospitals, primary M&H institutions are more widely distributed in space, have smoother density changes and have wider coverage overall. Compared with hospitals, the coverage of primary M&H institutions is significantly wider on both sides of the “one axis”, including the Exhibition Group, Xishan Group, the Bayi Steel Group and the High-speed Rail Group. Primary M&H institutions are characterized by a wider distribution in space. The characteristics of primary M&H institutions are different from those of hospitals. Each piece of land on which this category of M&H facility is located is small, and its distribution in space is almost punctiform. In addition, the “Planning Standards for Urban Public Service Facilities” (GB 50442-20XX) has clearly stipulated the number of residents and service radius that can be provided by facilities of different scales. Therefore, when we discuss the spatial accessibility of primary M&H institutions, buffer zones with different service radii can be established according to the standards (Figure 7).
Next, we analyzed the residential areas that are not covered by primary M&H institutions. The number of residents in the relevant residential areas was divided into five levels according to the method of Jenks (Figure 8). Areas with more people have more urgent needs for primary medical care. The most problematic areas are probably the areas between the downtown center and several new groups. In addition, residents within the coverage area of primary medical services may not always be able to enjoy sufficient services. When a facility needs to serve several times more residents than it can serve, the status quo of nearby service provision remains problematic. Based on these considerations, the article still needed to analyze the supply and demand within the scope of the service. The spatial gravity model was used to analyze whether primary M&H institutions can provide sufficient medical services for the surrounding residential areas (Figure 9). The model consisted of three elements: the service target (starting point), ease of access to the service (path) and the service capability of primary M&H institutions (end point). It can be seen from the results that even if the residential areas are all within the coverage of primary M&H services, there are still large differences in the level of services that each residential area can enjoy. Residential areas with insufficient service supply are also mainly distributed in the transition zone between the downtown area to the suburbs.

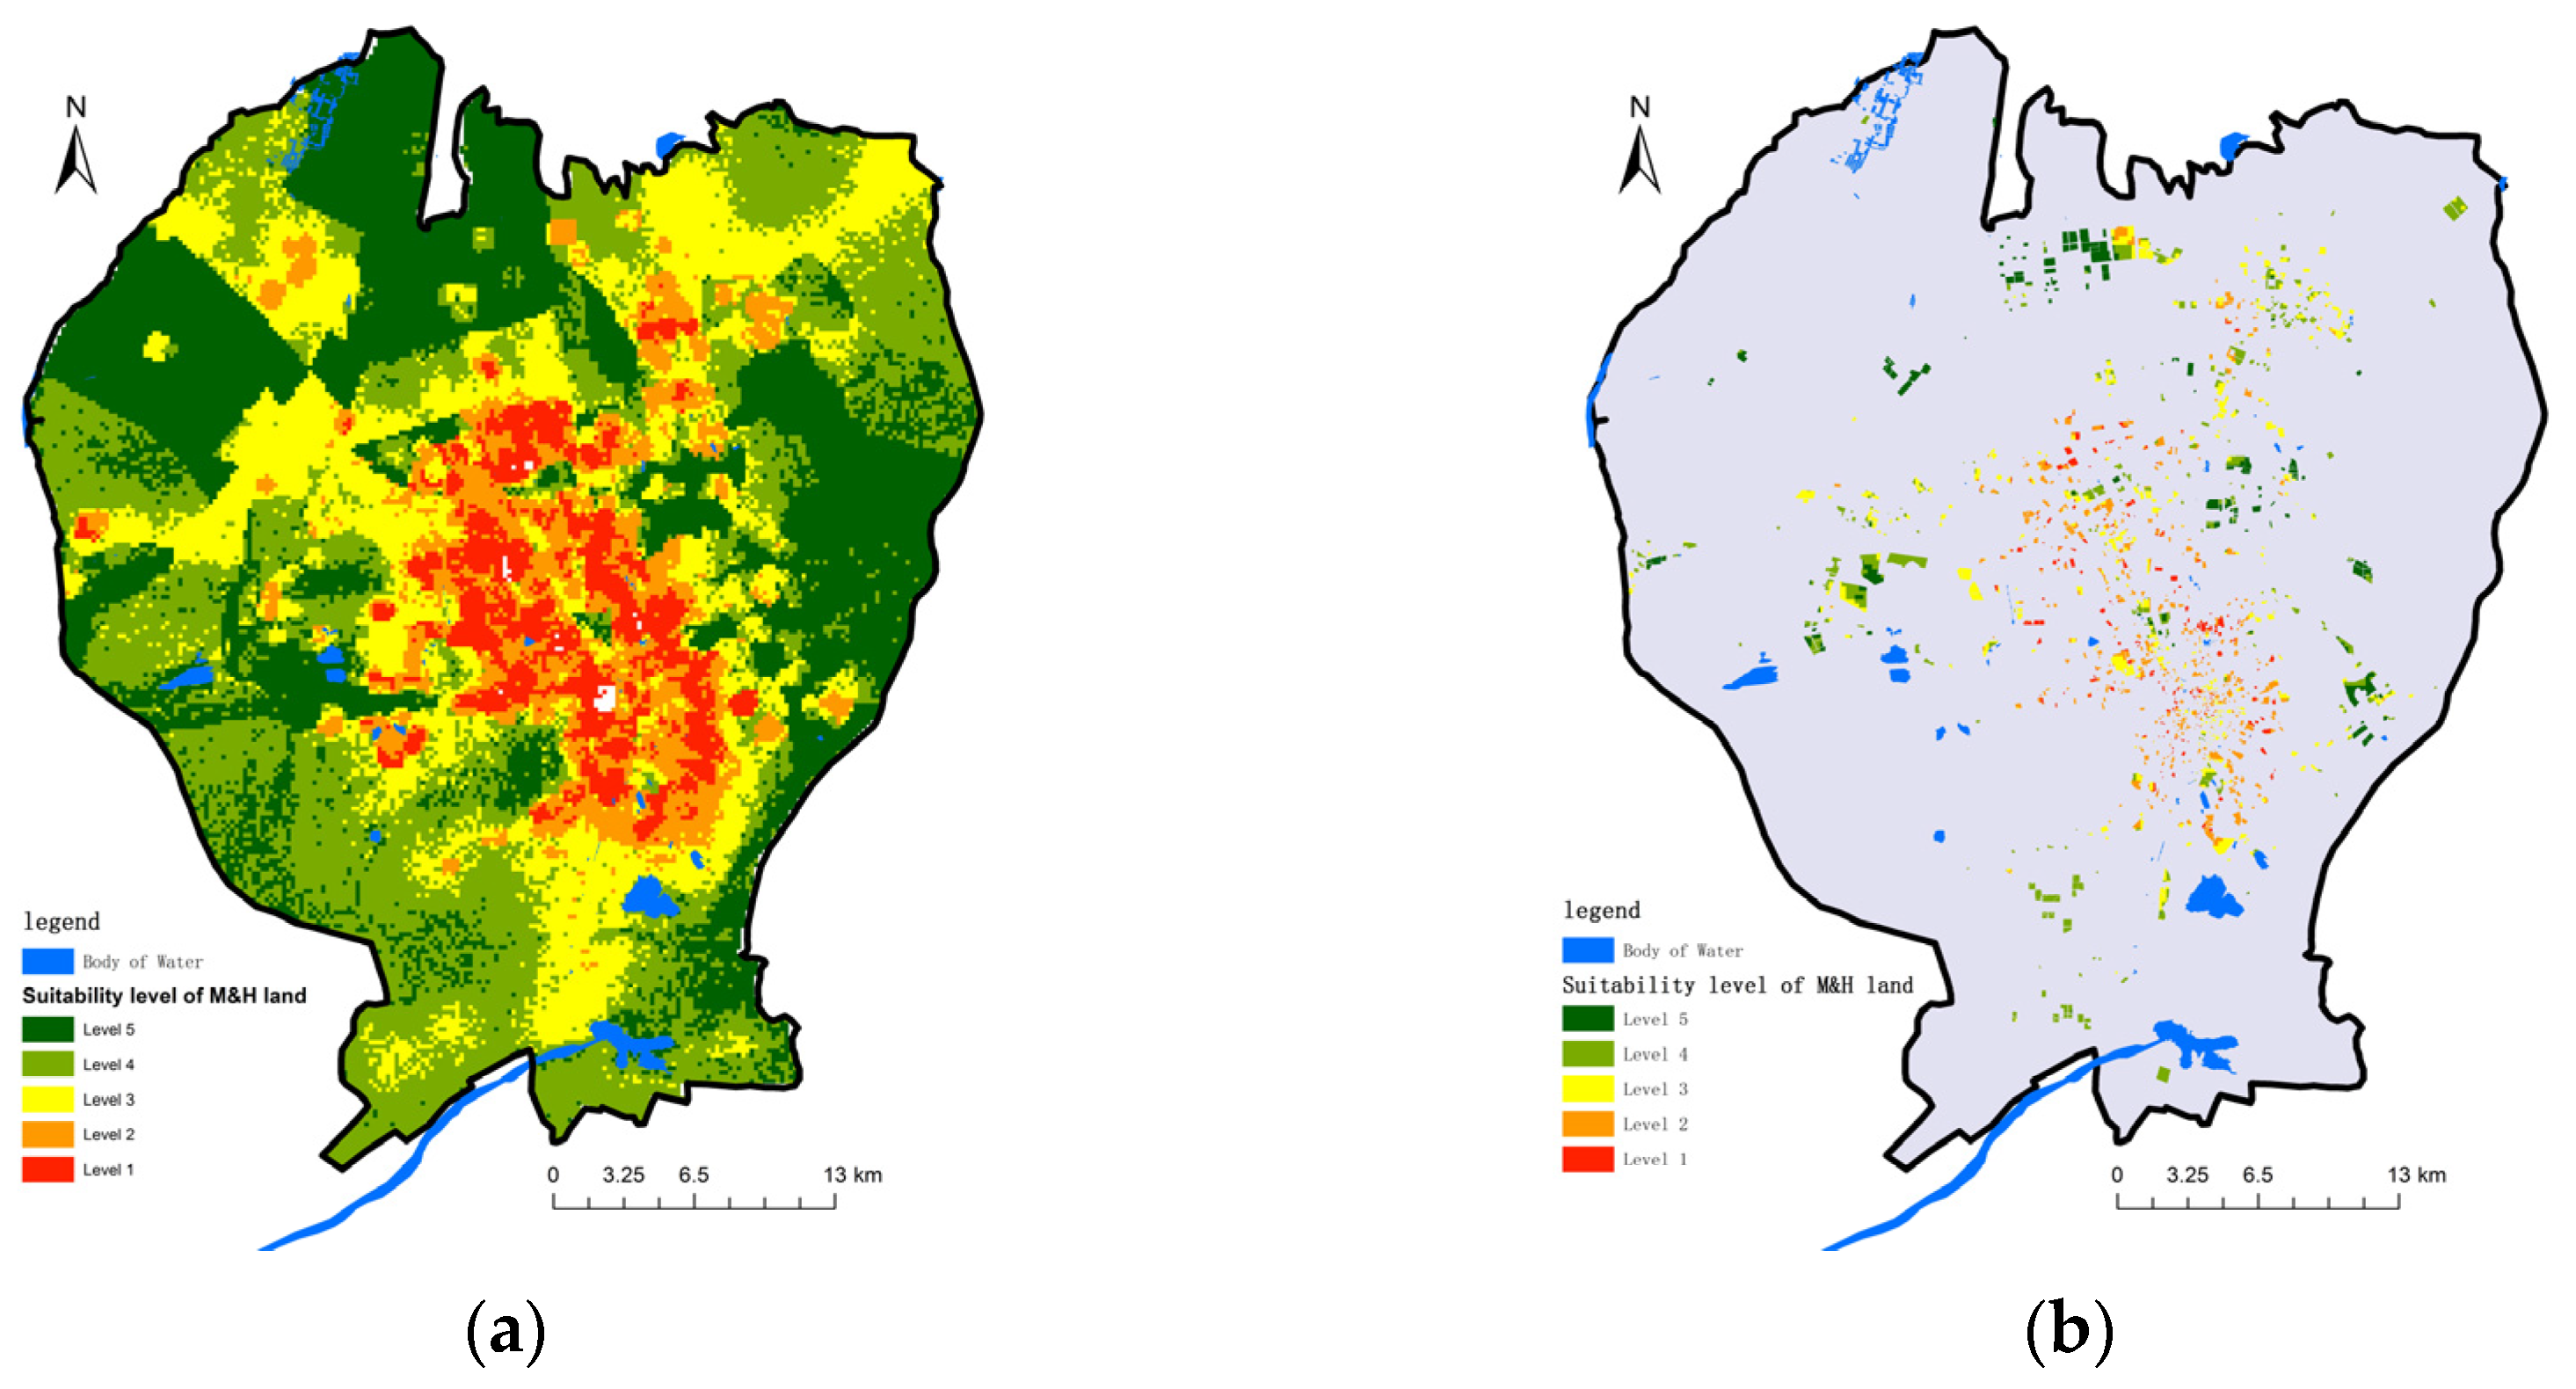
3.2. Evaluation of the Suitability of M&H Land

The problems of M&H land in the study area have been analyzed from the aspects of quantity and spatial patterns. Based on the results above, this part presents a suitability evaluation model for newly added M&H land. Specifically, an index system was constructed covering natural elements, social elements and ecological elements to evaluate the suitability of the land in the study area [54,55,56,57]. In order to more accurately reflect the differences in the natural, social and ecological elements of the land in each grid, a 200 × 200 m grid was constructed for the study area, with a total area of 1505.03 km2, and each grid was used as the evaluation unit for evaluating the suitability. In the plan of the newly added M&H land, the current distribution characteristics and flow trends of the service objects (residents) in the city should be taken into account. Meanwhile, the rational layout of land should also include elements such as natural features, ecological characteristics, the status quo of M&H services and traffic accessibility. A suitability evaluation index system was constructed by dividing the target layer, the element layer and the index layer into three parts. Among these, the target layer is the suitability for land development of the M&H land in the study area; the element layer includes natural, social and ecological factors; and the elements layer consists of 11 factors, including natural elements (the elevation, slope and aspect of the land); ecological factors, expressed in terms of the distance between land and water (rivers, lakes or reservoirs, etc.), and parks; and social elements, represented by the population, the per capita neighborhood occupancy of small-scale hospitals, the spatial accessibility of small-scale hospitals, the service gaps of primary M&H institutions obtained through the prior analysis, and the distance of each unit from the nearest subway station and bus station. According to the first law of geography, there is a spatial correlation between things in space, and the magnitude of the correlation is related to the distance [58,59,60,61]. Generally speaking, the closer the distance, the greater the correlation between the objects; the farther the distance, the greater the dissimilarity between the objects. A system of evaluating the suitability of M&H land in the study area was constructed, as shown in Table 3.
Through an independent analysis of each evaluation factor, and by comprehensively adopting the opinions of a number of relevant scholars, a pairwise comparison judgment matrix was constructed using AHP to calculate the weight of each factor (Table 4). The results of evaluating the suitability of M&H land in the whole area were obtained by a comprehensive calculation of various elements (Figure 10a). The results were divided into five levels by the method of Jenks, in which Level 1 is the most suitable area for new M&H land, and new land within the scope of Level 1 can most effectively improve the current problem of the poor spatial equity of M&H land. The results show that the most suitable areas for new M&H land are mainly distributed in the middle transition zone extending from the densely populated area in the downtown area to the surrounding seven groups, which is consistent with the analysis results above. In addition, the results of the evaluation of the suitability for M&H services calculated here may overlap with other functional land distributions, and thus the results cannot be directly adopted by government departments. In order to improve the supply of M&H services without encroaching on other functional construction land in the study area, the final step of this research was to compare the plots of the urban plan for M&H land (completed and reserved for future construction) with the results of the suitability evaluation (Figure 10b).

4. Discussion

In terms of land quantity, the current supply of M&H land in the study area is insufficient. In statistical terms, the area of high-level hospitals, such as regional and municipal hospitals, is too large, and the total area of district-level and private hospitals is insufficient. This uncoordinated M&H land structure may lead to the excessive concentration of medical resources in a certain area, which may lead to an imbalance in the supply of M&H resources across the entire area. The lack of low-level M&H facilities makes it more difficult for residents in other areas to seek medical treatment and also further increases the pressure on high-level hospitals because they cannot fully exert their function of diverting patients from large hospitals. Small hospitals should diagnose and treat as many patients with mild conditions as possible to reduce the pressure on large hospitals. When medical resources are overinvested in a few large hospitals, residents farther away from them may feel a greater sense of injustice. The results of the spatial accessibility of primary M&H services also show that urban centers are better than peripheral areas. The spatial accessibility results of primary M&H services also show that urban centers are better than peripheral areas. The results of this study are consistent with some of the research conclusions of Sun, Fu and Zheng [62]: For Chinese cities, disparities in the provision of local public services may emerge from the influence of residential market responses on income sorting. For these authors, improving the accessibility to local public services is a useful tool for increasing individuals’ opportunities for better job options, neighborhoods, education, or M&H land/facilities [62]. In the study area, the formation of a circular layout structure where the center is crowded, the outer periphery is excessive, and the middle circle is empty is shown by the spatial equity analysis. To some extent, the evidence of hospital land structure verifies our previous hypothesis that government departments may advance the deployment of public facilities in order to better play the role of attracting residents. The areas with the poorest spatial equity are distributed in the intermediate transition zone extending from the downtown area to the peripheral new groups. The findings are similar to what Rafal et al. found in Poland [1]; their research has revealed the existence of inner peripheries on the borderlines between areas of influence of different regional centers: “Relatively low levels of accessibility can be partially explained by administrative factors (delimitation of ‘catchment areas’ for some types of services), as well as by the division of competences between various administrative units”.
In order to improve the spatial equity of M&H services in Urumqi, firstly, we argue that the local government should continue to increase the supply of M&H land in appropriate areas, especially the land for the low-level hospitals or primary M&H institutions. Second, authorities should appropriately slow down the relevant land supply in several new groups in the city. Although the population in the study area shows a trend of moving outward in the short term, it will take a long time for this to have an effect. Too much attention to the construction of supporting facilities for new groups may not solve the existing problems effectively in the short-term future. Third, planners should focus on the intensive development of existing construction land. Most of the areas in the study area that are most suitable for supplementing M&H resources are already designated as construction land in the city plan, and it is difficult to rely on the method of adding new land to effectively improve the current situation. However, the demand for M&H services near areas where new land is easily added is very limited. Therefore, attention should be paid to improving the intensity of existing M&H land in key areas, such as hiring additional medical workers, increasing medical equipment, etc. Fourth, we should focus on improving the accessibility of public transportation in key areas and especially reduce the difficulty of seeing a doctor in areas where services are lacking.
Land, instead of facilities, is taken as the main object of the analysis of M&H services and is one of the novelties of our study. The selection of data types that are more accurate and up-to-date is of great help for smaller scale and more time-sensitive studies. We believe that new Internet data, whether AOI/POI or population heat maps, will also be of great value to the efforts of future researchers. In addition, our research has important public policy implications, especially for local governments. The results of evaluating the suitability of M&H land are combined with the ongoing urban plan. This arrangement is more feasible, and city managers do not require an overturn of their previous work but simply an adjustment of the order in which public services are supplied in different areas based on optimization proposals. The research process of this study focused on Urumqi City may also apply to many other cities in China and even to other countries and regions in the world committed to the equalization of public services.
This study did not further emphasize the spatial distribution characteristics of specialized hospitals (such as geriatric hospitals and children’s specialized hospitals), nor did it emphasize the differences in the spatial distribution of different age, gender and other groups. These are the parts we hope to consider in the next step of spatial equity research. In addition, we also believe that in the future, comparative studies can be carried out among multiple cities to reveal and discuss various distribution patterns of public service accessibility in different cities. It will also be a useful supplement to existing research.

5. Conclusions

The equalization of basic public services is of great benefit for promoting the construction of new high-quality urban centers, improving the modernization of the government’s governance capacity, and improving the quality of life and happiness of the people. Taking the urban residential area as the demand side, mathematical models and spatial analysis methods were used in this research to identify and analyze the amount and spatial allocation of M&H land in the study area, and the matching between supply and demand for M&H services in the study area and the main problems was explored. We also used a suitability evaluation to find the land that is most conducive to alleviating the mismatch between supply and demand for M&H services. The main research results are as follows: (1) The total amount of M&H land in the study area was lower than the standard and could not meet the demands of the current population. (2) The areas with the poorest spatial equity are distributed in the intermediate transition zone, extending from the downtown area to the peripheral new groups. (3) The results of evaluating the suitability of the newly added M&H land were calculated by combining various factors, and four targeted optimization suggestions were put forward.
People-oriented urbanization requires the government to provide services to all residents. This article explores the land supply of public service facilities such as M&H land from the perspective of land use, aiming to explore whether the land supply can help to create accurate policies in terms of quantity requirements and choice of space. Moreover, the suitability evaluation method for providing M&H services to the residents of each grid by considering the natural and ecological elements of the land also provides a scientific basis for optimizing service supply and determining key areas for increasing the supply of services in the future. In the process of China’s rapid urbanization, the next step should be to study the process of evolution across a larger span of time and space to further analyze the evolutionary characteristics of public services and the population in terms of their scale and spatial distribution.

Author Contributions

Conceptualization, Z.Y., S.H. and C.P.; methodology, J.X.; software, J.X.; validation, Z.Y., J.X. and S.H.; formal analysis, Z.Y. and J.X.; resources, Z.Y. and J.X.; data curation, J.X.; writing—original draft preparation, J.X.; writing—review and editing, Z.Y., S.H. and C.P.; visualization, J.X.; supervision, S.H. and C.P.; project administration, Z.Y.; funding acquisition, Z.Y. All authors have read and agreed to the published version of the manuscript.

Funding

This research was funded by the Project of Science Research in Universities in Xinjiang Autonomous Region, grant number XJEDU2020SY008; Project of Philosophy and Social Science Research in Universities in Jiangsu Province, grant number 2021SJA1712; Jiangsu Institute of Marine Resources Development Research Fund, grant number JSIMR202023.

Acknowledgments

The authors thank Xinjiang Education Department and Xinjiang Agricultural University for providing generous and kind support in continuing this research.

Conflicts of Interest

The authors declare no conflict of interest.

References

  1. Wiśniewski, R.; Stępniak, M.; Szejgiec-Kolenda, B. Accessibility of public services in the age of ageing and shrinking population: Are regions following trends. Geogr. Ann. Ser. B Hum. Geogr. 2021, 103, 55–74. [Google Scholar] [CrossRef]
  2. Coulton, C.; Chow, J.; Wang, E.; Su, M. Geographic Concentration of Affluence and Poverty in 100 Metropolitan Areas, 1990. Urban Aff. Rev. 1996, 32, 186–216. [Google Scholar] [CrossRef]
  3. Cortés, Y. Spatial Accessibility to Local Public Services in an Unequal Place: An Analysis from Patterns of Residential Segregation in the Metropolitan Area of Santiago, Chile. Sustainability 2021, 13, 442. [Google Scholar] [CrossRef]
  4. Cheng, W.; Wu, J.; Moen, W.; Hong, L. Assessing the spatial accessibility and spatial equity of public libraries’ physical locations. Libr. Inf. Sci. Res. 2021, 43, 101089. [Google Scholar] [CrossRef]
  5. Scaramelli, B.F.; Couto, E.V.; Bueno, P.A.A.; Souza, D.C.; Vieira, L.M.; Ferreira, J.H.D. Prioriority actions maps of municipal public services with geospace application. Acta Scientiarum. Technol. 2019, 42, e44426. [Google Scholar] [CrossRef]
  6. Lan, F.; Zhang, W.; Wen, H.; Da, H. Stratification, Spatial Agglomeration, and Unequal Public Services: Case Study in Xi’an, China. J. Urban Plan. Dev. 2020, 146, 579. [Google Scholar] [CrossRef]
  7. Stanley, B.W.; Dennehy, T.J.; Smith, M.E.; Stark, B.L.; York, A.M.; Cowgill, G.L.; Novic, J.; Ek, J. Service Access in Premodern Cities: An Exploratory Comparison of Spatial Equity. J. Urban Hist. 2016, 42, 121–144. [Google Scholar] [CrossRef] [Green Version]
  8. Li, H.; Wang, Q.; Shi, W.; Deng, Z.; Wang, H. Residential clustering and spatial access to public services in Shanghai. Habitat. Int. 2015, 46, 119–129. [Google Scholar] [CrossRef]
  9. He, S. New-build gentrification in Central Shanghai: Demographic changes and socioeconomic implications. Popul. Space Place 2010, 16, 345–361. [Google Scholar] [CrossRef]
  10. He, S.; Wu, F. Socio-spatial impacts of property-led redevelopment on China’s urban neighbourhoods. Cities 2007, 24, 194–207. [Google Scholar] [CrossRef]
  11. Li, X.; Luo, Q. The Coordinating ideas of new-form urbanization. China Popul. Resour. Environ. 2014, 24, 47–53. [Google Scholar]
  12. Jones, R.D.; Moisio, S.; Weckroth, M.; Woods, M.; Luukkonen, J.; Meyer, F.; Miggelbrink, J. Re-conceptualising Territorial Cohesion through the Prism of Spatial Justice: Critical Perspectives on Academic and Policy Discourses. Reg. Local Dev. Times Polarisation 2019, 1, 97–119. [Google Scholar]
  13. Marques, T.S.; Saraiva, M.; Ribeiro, D.; Amante, A.; Silva, D.; Melo, P. Accessibility to services of general interest in polycentric urban system planning: The case of Portugal. Eur. Plan. Stud. 2019, 28, 1068–1094. [Google Scholar] [CrossRef]
  14. Wei, W.; Ren, X.; Guo, S. Evaluation of Public Service Facilities in 19 Large Cities in China from the Perspective of Supply and Demand. Land 2022, 11, 149. [Google Scholar] [CrossRef]
  15. Jin, M.; Liu, L.; Tong, D.; Gong, Y.; Liu, Y. Evaluating the Spatial Accessibility and Distribution Balance of Multi-Level Medical Service Facilities. Int. J. Environ. Res. Public Health 2019, 16, 1150. [Google Scholar] [CrossRef] [Green Version]
  16. Dewulf, B.; Neutens, T.; De Weerdt, Y.; Van de Weghe, N. Accessibility to primary health care in Belgium: An evaluation of policies awarding financial assistance in shortage areas. BMC Fam. Pract. 2013, 14, 122. [Google Scholar] [CrossRef] [Green Version]
  17. Fryer, G.E., Jr.; Drisko, J.; Krugman, R.D.; Vojir, C.P.; Prochazka, A.; Miyoshi, T.J.; Miller, M.E. Multi-method assessment of access to primary medical care in rural Colorado. J. Rural. Health 1999, 15, 113–121. [Google Scholar] [CrossRef]
  18. Wang, L.; Liu, L. The Present Condition of China’s Medical and Health Facilities in the Epidemic Situation of Covid-19, and a Comparison with other Countries. Sci. Technol. Rev. 2020, 38, 29–38. [Google Scholar]
  19. Luo, B.; Xia, W.; Wei, Q.; Zhang, Q. Rethink Profoundly on the Special Planning of Urban Medical and Health Facilities Under the Background of COVID-19: An Empirical Analysis of Wuhan. Mod. Urban Res. 2020, 10, 2–11. [Google Scholar]
  20. Zhao, Y.; Zhang, G.; Lin, T.; Liu, X.; Liu, J.; Lin, M.; Ye, H.; Kong, L. Towards sustainable urban communities: A composite spatial accessibility assessment for residential suitability based on network big data. Sustainability 2018, 10, 4767. [Google Scholar] [CrossRef] [Green Version]
  21. Feng, S.; Chen, L.; Sun, R.; Feng, Z.; Li, J.; Khan, M.S.; Jing, Y. The Distribution and Accessibility of Urban Parks in Beijing, China: Implications of Social Equity. Int. J. Environ. Res. Public Health 2019, 16, 4894. [Google Scholar] [CrossRef] [Green Version]
  22. McGrail, M.R. Spatial accessibility of primary health care utilising the two step floating catchment area method: An assessment of recent improvements. Int. J. Health Geogr. 2012, 11, 50. [Google Scholar] [CrossRef] [Green Version]
  23. Shen, Y.; Li, L. The influence of medical facility accessibility on residents’ health seeking behaviors from the perspective of age stratification: A case study of shanghai Chongming Island. Hum. Geogr. 2021, 36, 46–54. [Google Scholar]
  24. Mariwah, S.; Hampshire, K.; Owusu-Antwi, C. Getting a foot on the sanitation ladder: User satisfaction and willingness to pay for improved public toilets in Accra, Ghana. J. Water Sanit. Hyg. Dev. 2017, 7, 528–534. [Google Scholar] [CrossRef] [Green Version]
  25. Cordera, R.; Nogués, S.; González-González, E.; dell’Olio, L. Intra-Urban Spatial Disparities in User Satisfaction with Public Transport Services. Sustainability 2019, 11, 5829. [Google Scholar] [CrossRef] [Green Version]
  26. Nega, W.; Hunie, Y.; Tenaw, M.; Kassaw, S.; Mansberger, R. Demand-Driven suitable sites for public toilets: A case study for GIS-Based site selection in Debre Markos Town, Ethiopia. Geojournal 2021, 2, 1–14. [Google Scholar] [CrossRef]
  27. Haynes, R.; Lovett, A.; Sünnenberg, G. Potential Accessibility, Travel Time, and Consumer Choice: Geographical Variations in General Medical Practice Registrations in Eastern England. Environ. Plan A 2003, 35, 1733–1750. [Google Scholar] [CrossRef]
  28. Wang, F.; Bai, Y.; Zhou, L.; Ji, X.; Xu, Z.; Qiao, F. Spatial Pattern and Influencing Factors of the Equalization of Basic Education Public Service in China. Geogr. Res. 2019, 38, 285–296. [Google Scholar]
  29. Tang, J. Measurement of the Equalization Level of Regional Basic Public Services in Henan Province. Stat. Decis. 2019, 7, 58–61. [Google Scholar]
  30. Han, Z.; Li, B.; Zhang, K. Evaluation and Spatial Analysis of the Equalization of Public Service in Urban and Rural Areas in China. Geogr. Res. 2015, 11, 2035–2048. [Google Scholar]
  31. Fu, B.; Xiao, X.; Li, J. Big Data-Driven Measurement of the Service Capacity of Public Toilet Facilities in China. Appl. Sci. 2022, 12, 4659. [Google Scholar] [CrossRef]
  32. Wu, M.; Pei, T.; Wang, W.; Song, C.; Chen, J. Roles of locational factors in the rise and fall of restaurants: A case study of Beijing with POI data. Cities 2021, 113, 103185. [Google Scholar] [CrossRef]
  33. Li, J.; Li, J.; Shao, L.; Sun, S. Evaluation of Spatial Matching between Urban Green Space and Population: Dynamics Analysis of Winter Population Data in Xi’an. J. Urban Plan. Dev. 2021, 147, 05021012. [Google Scholar] [CrossRef]
  34. Shen, Q. Spatial Coordination of Population Distribution and Service Infrastructure Distribution in Shanghai. J. Gansu Sci. 2014, 26, 139–142. [Google Scholar]
  35. Shi, Y.; Yang, J.; Shen, P. Revealing the Correlation between Population Density and the Spatial Distribution of Urban Public Service Facilities with Mobile Phone Data. ISPRS Int. J. Geo-Inf. 2020, 9, 38. [Google Scholar] [CrossRef] [Green Version]
  36. Luo, W.; Wang, F. Measures of spatial accessibility to health care in a GIS environment: Synthesis and a case study in the Chicago Region. Environ. Plan. B Plan. Des. 2003, 30, 865–884. [Google Scholar] [CrossRef] [Green Version]
  37. McGrail, M.R.; Humphreys, J.S. Measuring spatial accessibility to primary care in rural areas: Improving the effectiveness of the two-step floating catchment area method. Appl. Geogr. 2009, 29, 533–541. [Google Scholar] [CrossRef]
  38. Yin, C.; He, Q.; Liu, Y.; Chen, W.; Gao, Y. Inequality of public health and its role in spatial accessibility to medical facilities in China. Appl. Geogr. 2018, 92, 50–62. [Google Scholar] [CrossRef]
  39. Schuurman, N.; Bérubé, M.; Crooks, V.A. Measuring potential spatial access to primary health care physicians using a modified gravity model. Can. Geogr. 2010, 54, 29–45. [Google Scholar] [CrossRef]
  40. Ministry of Housing and Urban-Rural Development of the PRC; General Administration of Quality Supervision, Inspection and Quarantine of the PRC. Urban Public Service Facility Planning Standards (Draft for Comments). 2018. Available online: https://www.mohurd.gov.cn/gongkai/fdzdgknr/zqyj/201805/20180522_236167.html (accessed on 3 April 2021).
  41. Zhao, P.; Cao, Y. Jobs-Housing Balance Comparative Analyses with the LBS Data: A Case Study of Beijing. Acta Sci. Nat. Univ. Pekin. 2018, 54, 1290–1302. [Google Scholar]
  42. Tan, X.; Huang, D.; Zhao, X.; Yu, Y.; Leng, B.; Feng, L. Jobs housing balance based on Baidu thermodynamic diagram. J. Beijing Norm. Univ. Nat. Sci. 2016, 52, 622–627. [Google Scholar]
  43. Li, J.; Li, J.; Yuan, Y.; Li, G. Spatiotemporal distribution characteristics and mechanism analysis of urban population density: A case of Xi’an, Shaanxi, China. Cities 2019, 86, 62–70. [Google Scholar] [CrossRef]
  44. Zhang, H. Quantity Extraction and Planning Application of Population Activity Based on Baidu Heat Map. Urban Transp. China 2021, 19, 103–111. [Google Scholar]
  45. Yu, W.; An, T. The Visualization and Analysis of POI Features under Network Space Supported by Kernel Density Estimation. Acta Geod. Cartogr. Sin. 2015, 44, 82–90. [Google Scholar]
  46. Chen, W.; Liu, L.; Liang, Y. Retail Center Recognition and Spatial Aggregating Feature Analysis of Retail Formats in Guangzhou Based on POI Data. Geogr. Res. 2016, 35, 703–716. [Google Scholar]
  47. Wang, X.; Wang, J.; Zhu, Q. Identification of Hollowing Phenomenon in Commercial Space of Six District of Beijing Based on Checking-in Data. Urban Dev. Stud. 2018, 25, 77–84. [Google Scholar]
  48. Hu, Y.; Zhang, J.; Liu, Z.; Lin, A. The Research of the Middle Reaches of the Yangtze River’s Spatial Contact Based on the Gravity Model and the Urban Flow. Mod. Urban Res. 2016, 1, 52–57. [Google Scholar]
  49. Min, J. The Spatial Pattern and Driving Factors of Public Service Facilities Lands in Mountainous City: A Case of Chongqing. Master’s Thesis, Southwest University, Chongqing, China, 2017. [Google Scholar]
  50. Song, R.; Zhou, S.; Ye, X. Spatial Pattern and Hierarchical Development of China’s Cruise Passenger Market under the Dual-Circulation Pattern: A Revision and Application Based on the Gravity Model. World Reg. Stud. 2022, 1, 1–20. [Google Scholar]
  51. Peeters, D.; Thomas, I. Distance Predicting Functions and Applied Location-Allocation Models. J. Geogr. Syst. 2000, 2, 167–184. [Google Scholar] [CrossRef]
  52. Liu, H.; Zheng, T.; Nie, J. On the Spatial Allocation of the Quantity and Diversity of Basic Urban Public Service Facilities: A Case Study of Wuhan Inner City. Plan. Stud. 2021, 45, 84–91. [Google Scholar]
  53. Shen, L.; Zhang, C.; Li, H.; Wang, Y. Interaction between Commuting Modes and Job-Housing Imbalance in Metropolis: An Empirical Study by Bayesian-Tobit Analysis in Beijing. Prog. Geogr. 2018, 37, 1277–1290. [Google Scholar]
  54. Chang, L. Research on the Optimized Layout of Educational Land Based on the Equalization of Public Service Facilities in Guangzhou. Master’s Thesis, Guangdong University of Technology, Guangzhou, China, 2020. [Google Scholar]
  55. Wang, X.; Tang, Y. Research on Suitability Evaluation Index System of Normal and Epidemic Space Conversion Facing Public Health Emergency. Urban Rural Plan. 2020, 4, 21–27, 36. [Google Scholar]
  56. Liu, X.; Wang, Y.; Li, M. Theory, Method and Technological Application of Territorial Spatial Development Suitability Evaluation. J. Geo-Inf. Sci. 2021, 23, 2097–2110. [Google Scholar]
  57. Li, H.; Wang, Z. Application of the Land Suitable Evaluation Based on Model Builder in Mountainous Cities’ Regulatory Detailed Planning: A Case Study of Regulatory Detailed Planning in Jiangdong District, Wushan County, Chongqing Municipality. J. Hum. Settl. West China 2016, 31, 17–23. [Google Scholar]
  58. Tobler, W.R. A Computer Movie Stimulating Urban Growth in the Detroit Region. Econ. Geogr. 1970, 46, 234–240. [Google Scholar] [CrossRef]
  59. Goodchild, M.F. The Validity and Usefulness of Laws in Geographic Information Science and Geography. Ann. Assoc. Am. Geogr. 2004, 94, 300–303. [Google Scholar] [CrossRef] [Green Version]
  60. Zhu, A.; Lv, G.; Zhou, C.; Qin, C. Geographic Similarity: Third Law of Geography? J. Geo-Inf. Sci. 2020, 22, 673–679. [Google Scholar]
  61. Tang, G.; Li, J.; Xiong, L.; Na, J. Scientific Attributes and Expression Methods of Geographical Boundary. Acta Geogr. Sin. 2021, 76, 2841–2852. [Google Scholar] [CrossRef]
  62. Sun, W.; Fu, Y.; Zheng, S. Local Public Service Provision and Spatial Inequality in Chinese Cities: The Role of Residential Income Sorting and Land-use Conditions. J. Reg. Sci. 2017, 57, 547–567. [Google Scholar] [CrossRef]
Figure 1. The integrated framework of this article.
Sustainability 14 07565 g001
Figure 2. Urban plan of Urumqi city center.
Sustainability 14 07565 g002
Figure 3. Distribution of M&H and residential sites of Urumqi’s city center.
Sustainability 14 07565 g003
Figure 4. The distribution and variation between two periods of residents. (a) Current; (b) Shortterm future; (c) Variations between periods.
Sustainability 14 07565 g004
Figure 5. Kernel density of the M&H facilities in the study area. (a) Hospitals; (b) primary M&H institutions.
Sustainability 14 07565 g005
Figure 6. Spatial accessibility distribution of land for hospitals in each street/town. (a) Current; (b) Short–term future.
Sustainability 14 07565 g006
Figure 7. Coverage of primary M&H services in the study area. (a) Current; (b) Short-term future.
Sustainability 14 07565 g007
Figure 8. Urgency of services in residential areas without primary M&H coverage. (a) Current; (b) Short-term future.
Sustainability 14 07565 g008
Figure 9. Spatial accessibility of residential areas under primary M&H coverage. (a) Current; (b) Short-term future.
Sustainability 14 07565 g009
Figure 10. The results of evaluating the suitability of M&H land in the study area. (a) Sustainability level of M&H land; (b) Sustainability level of M&H land combined with the urban plan.
Sustainability 14 07565 g010
Table 1. Regulations on the classification and setup of M&H facilities (provincial capital city) 1.
CategoriesTypesService Scope (km)Construction Land Area per Capita (m2/Population)
HospitalsGovernmentalRegional(By level)0.03
Municipal(By level)0.10
County level(By level)0.20
Private/20.15
Primary M&H institutionsM&H centers1Should be on the land independently
M&H stations0.3Can be on land with other facilities
Professional M&H institutionsEmergency centers(By level)3500–8000 in total
Blood banks(By level)/
Maternity and child health centers(By level)13,000–25,000 in total
CDC(By level)3500–6000 in total
1 Data source: “Urban Public Service Facilities Planning Standards” (GB 50442-20XX).
Table 2. Statistics on the number of residents in each district (county) within the study area.
District (County)Area (km2)Population (1000 People)
CurrentShort-Term Future
Tianshan District183.11570.1576.5
Shayibak District313.80927.71018.2
Xinshi District256.601133.11094.3
Shuimogou District132.36603.3524.0
Toutunhe District268.65115.6126.4
Midong District268.87356.4361.7
Urumqi County81.6420.325.5
Total1505.033726.4
Table 3. Suitability index of M&H land in the study area.
ElementsFactors/UnitSuitability Level
123456789
NaturalHeight (m)>1060989–1060915–989837–915756–837678–756560–678522–560<522
Slope (%)>2015–2013–1511–139–117–95–73–5<3
AspectNWNENWEWSESSFLAT
SocialPopulation (Alpha Value)5252–6868–7878–8989–9999–109109–120120–136136–194
Per Capita Occupancy of M&H Land (m2)>1.921.68–1.921.44–1.681.20–1.440.96–1.200.72–0.960.48–0.720.24–0.48<0.24
Amount of Accessible M&H Land Per Capita (m2)>1.201.08–1.200.96–1.080.84–0.960.72–0.840.60–0.720.48–0.600.24–0.48<0.24
Service Gaps of Primary M&H Institutions (Population)00–500500–10001000–20002000–40004000–60006000–80008000–10,000>10,000
Distance to Nearest Subway Station (m)>40003000–40002500–30002000–25001500–20001000–1500800–1000500–800<500
Distance to Nearest Bus Station (m)>20001750–20001500–17501250–15001000–1250750–1000500–750250–500<250
EcologicalDistance to Nearest Body of Water (m)<300 or
>4500
4000–45003500–40003000–35002500–30002000–25001500–20001000–1500<1000
Distance to Nearest Park (m)<300 or
>4500
4000–45003500–40003000–35002500–30002000–25001500–20001000–1500<1000
Table 4. Weights of factors for evaluating the suitability of M&H land.
ElementsWeight of ElementsFactorsWeight of Factors
Natural0.1488Height0.0442
Slope0.0803
Aspect0.0243
Social0.7854Population0.0527
Per Capita Occupancy of M&H Land0.0938
Amount of Accessible M&H Land Per Capita0.1915
Service Gap of Primary M&H Institutions0.2658
Distance to Nearest Subway Station0.1229
Distance to Nearest Bus Station0.0587
Ecological0.0658Distance to Nearest Water0.0329
Distance to Nearest Park0.0329
Publisher’s Note: MDPI stays neutral with regard to jurisdictional claims in published maps and institutional affiliations.

