Article

Green Mining Strategy Selection via an Integrated SWOT-PEST Analysis and Fuzzy AHP-MARCOS Approach

School of Resources & Safety Engineering, Central South University, Changsha 410083, China
*
Author to whom correspondence should be addressed.
Sustainability 2022, 14(13), 7577; https://doi.org/10.3390/su14137577
Submission received: 18 May 2022 / Revised: 16 June 2022 / Accepted: 20 June 2022 / Published: 21 June 2022
(This article belongs to the Topic Green Mining)

Abstract

:
Deciding on an appropriate development strategy is one of the most crucial aspects of the mining industry’s green transition. This research introduces a novel integrated decision support model that can be applied to analyze various environmental factors and determine development strategies. In this study, a strengths, weaknesses, opportunities, and threats (SWOT) analysis is employed from multiple perspectives, including political, economic, social, and technological (PEST), to assess the internal and external factors that influence green mining. The fuzzy analytic hierarchy process (AHP) is used to analyze the factor weights quantitatively, and the fuzzy Measurement of Alternatives and Ranking according to Compromise Solution (MARCOS) method is used to rank and select development strategies. According to the results, “grasp the trend of green development and improve the protection and exploitation level of mineral resources” is found to be the final optimal strategy. Comparative analysis and sensitivity analysis confirmed the accuracy of the model and the case study results.

1. Introduction

Global companies are driven to make a green transformation due to escalating ecological degradation and pollution [1]. Under the government’s severe resource and environmental policies, as well as the fiercely competitive market, green development has become an unavoidable trend [2]. The green development model is an important path towards “intensive and economical utilization of resources, reduction of environmental damage, improvement of labor productivity, and enhancement of sustainable development capabilities” [3]. A healthy ecological environment has become the focus of the government and society more than ever [4]. Mining, as an industry that pollutes and destroys the environment, is much worse [5,6]. It has become a critical industry to address as part of the process of achieving green development. Mining not only provides employment and income, but it is also the pillar of the energy supply chain [7]. Mining companies used to focus on mining productivity and profit margins, with the environment being the least important issue. This development model resulted in the continuing deterioration of the mining area’s ecological environment, significant waste of mineral resources [8,9], and negative social consequences. The situation is changing due to the background of the gradual depletion of resources and the growing popularity of green concepts. Resources and environmental protection have now been elevated to become the top priority in mining, based on the construction of a long-term sustainable profit model [10].
As mining activities involve the whole life cycle from exploration to production, closure, and restoration, it makes the green transformation of mines a multi-dimensional, long-term process [11]. Traditional technologies and conceptions have given way to a new, more sustainable production model in this process [12]. Developed mining countries such as in Europe and the United States put forward the concept with the same connotation as green mining as early as the 19th century, but, initially, it was limited to the greening of the mining environment [13]. In China, the specific concept of green mining was first proposed by Qian in 2003 for coal mines [14]. Subsequently, the government proposed a series of policy requirements for green practices in mines. The overall goal of establishing a fundamental pattern of green mines was put forward in 2009 in China [15]. Later, in 2016, it was proposed to form a new pattern of green mines and the establishment of 661 green mine pilot units was approved [16]. In 2018, the green mine construction standards of nine major industries were proposed, and the green mine construction began to be standardized [17]. Nowadays, the fundamental pattern of green mine construction has a general outline, but it is confronting complicated political, economic, social, and technological considerations at home and abroad in its new stage of growth and promotion. In recent years, with the dual background of building an innovative country and a green development strategy, some new concepts, such as developing smart mines and tailless mines [18], have been proposed. Some challenges, such as deep mining, the comprehensive utilization of resources, and ecological restoration, have made partial breakthroughs and innovations [19], and the release and implementation of a series of policy incentive documents have forced mining enterprises to re-examine their development model, promote the establishment of green mine transformation, and gain a competitive edge [20].
Due to differences in mine scale, category, area, and other factors, decision makers in mining companies have gaps in the transformation strategies they can choose as a part of the process of pursuing green transformation [21]. Therefore, it is not only technology that drives green transformation but also the planning and selection of development strategies [22]. However, because the mining industry is such a complicated system, strategic planning and decision making are challenging [23]. It is necessary for mining companies to analyze their internal and external influencing factors and implement the right strategy at the right time and place in order to maintain dynamic competitiveness [24], which can only be achieved through holistic strategic planning. There are few such studies in the context of China’s mining development. Therefore, from this perspective, this study uses SWOT as the most basic tool for strategic analysis and selection. After the introduction, the second part of the article presents the literature review. The third part introduces the methodology and proposes an AHP-MARCOS strategic decision analysis model based on SWOT-PEST analysis, and the fourth part presents a case study. The next section compares three methods, namely MARCOS, FTOPSIS, and FMABAC, to verify the accuracy of the case analysis and conduct a sensitivity analysis. Finally, the conclusions and prospects of this study are presented.

2. Literature Review

SWOT analysis is a well-known analysis method in modern strategic management and planning. Using the SWOT analysis method to make strategic decisions based on the research objectives and current environment of the research object can make full use of strengths, eliminate weaknesses, seize opportunities, and deal with threats [25], resulting in a positive match between internal and external factors [26]. The SWOT analysis was developed in the 1960s [27] and is now extensively utilized in various industries, such as construction, energy, e-commerce, etc. Yuan [28] provided critical strategies for construction waste management in the construction industry based on SWOT analysis. Terrados et al. [29] conducted strategic planning for renewable energy development with the help of a SWOT analysis tool. Zhao et al. [30] introduced SWOT analysis to explore strategies for high-level development of China’s e-commerce industry. Novikov [31] employed SWOT to analyze the high-tech strategic development of manufacturing enterprises. Kolbina [32] and Bohari et al. [33] conducted a SWOT analysis of the food business. SWOT analysis is applicable in the energy sector. Liu et al. [34] identified the influencing factors of the low-carbon economy development of mining companies through SWOT analysis, proposed a framework structure for developing a low-carbon economy, and constructed a new development model of mines. Nikolaou and Evangelino [35] used SWOT tools to analyze the problems faced in the practice of environmental management in Greek mines. Jiskani et al. [36] used a multi-criteria-based SWOT analysis of sustainable planning for the mining and mineral industry in Pakistan. The environmental factors of traditional SWOT analysis are complex. To classify the complex factors clearly and provide a reference for subsequent strategy formulation, Dong et al. [37] integrated the variables of the selected environmental factors into politics, the economy, society, and technology by introducing the PEST tool, which provides a clear direction for the analysis of SWOT environmental factors [38].
A single SWOT analysis, on the other hand, can give a subjective qualitative assessment of development competitiveness [39], which is the foundation for strategy formulation. However, a single SWOT analysis cannot completely evaluate the strategic decision-making process [40] since it is impossible to determine the relative influence of various factors on strategic decision making by quantifying the importance of these factors. Therefore, many researchers have extensively combined SWOT analysis with other quantitative evaluation approaches. Multi-criteria decision making (MCDM) is the most used method, such as the analytic hierarchy process (AHP), the analytical network (ANP), etc., which determines the relative significance of the various factors in the proposed strategy [41] and overcomes the shortcomings of traditional SWOT analysis. Considering that real-life decision-making processes are frequently ambiguous, fuzzy logic may be used in MCDM. The AHP technique has become the most prominent MCDM method in mining research due to its ease of use, high repeatability, support for group decision making, and ability to apply to fuzzy sets [42]. In addition, the AHP technique allows the SWOT model to be incorporated into the hierarchy to quantify the factors [43]. According to studies, combining the SWOT analysis approach with the fuzzy AHP method helps handle decision-making challenges in a variety of sectors. For example, Erdogan and Kara [44] integrated SWOT and Fuzzy AHP models to analyze Turkey’s maritime transport strategy options, Buyukozkan et al. [45] studied healthy tourism strategy options, and Solangi et al. [46] explored Pakistan’s sustainable energy strategic planning. Most of the above studies are based on case studies, showing that SWOT combined with the AHP methods can be successfully applied to case studies. It is reasonable to use SWOT analysis combined with Fuzzy AHP method for quantitative research in this study.
For strategic decision making, this study employs a new ranking method, Measurement of Alternatives and Ranking According to Compromise (MARCOS), which was proposed by Stevic et al. [47] in 2020 and was subsequently improved by Stankovic et al. [48]. Despite the fact that the MARCOS method is a relatively new method, due to its advantages of stability and applicability in different MCDM methods, scientific articles using the MARCOS method have been published frequently in recent years and it has been applied in a variety of fields [49,50], but its application in the mining field is very limited. The use of the MARCOS approach in the mining area, as well as embedding PEST into a SWOT tool for a full internal and external factor analysis to create the Fuzzy AHP hierarchy, are the contributions and originality of this research.
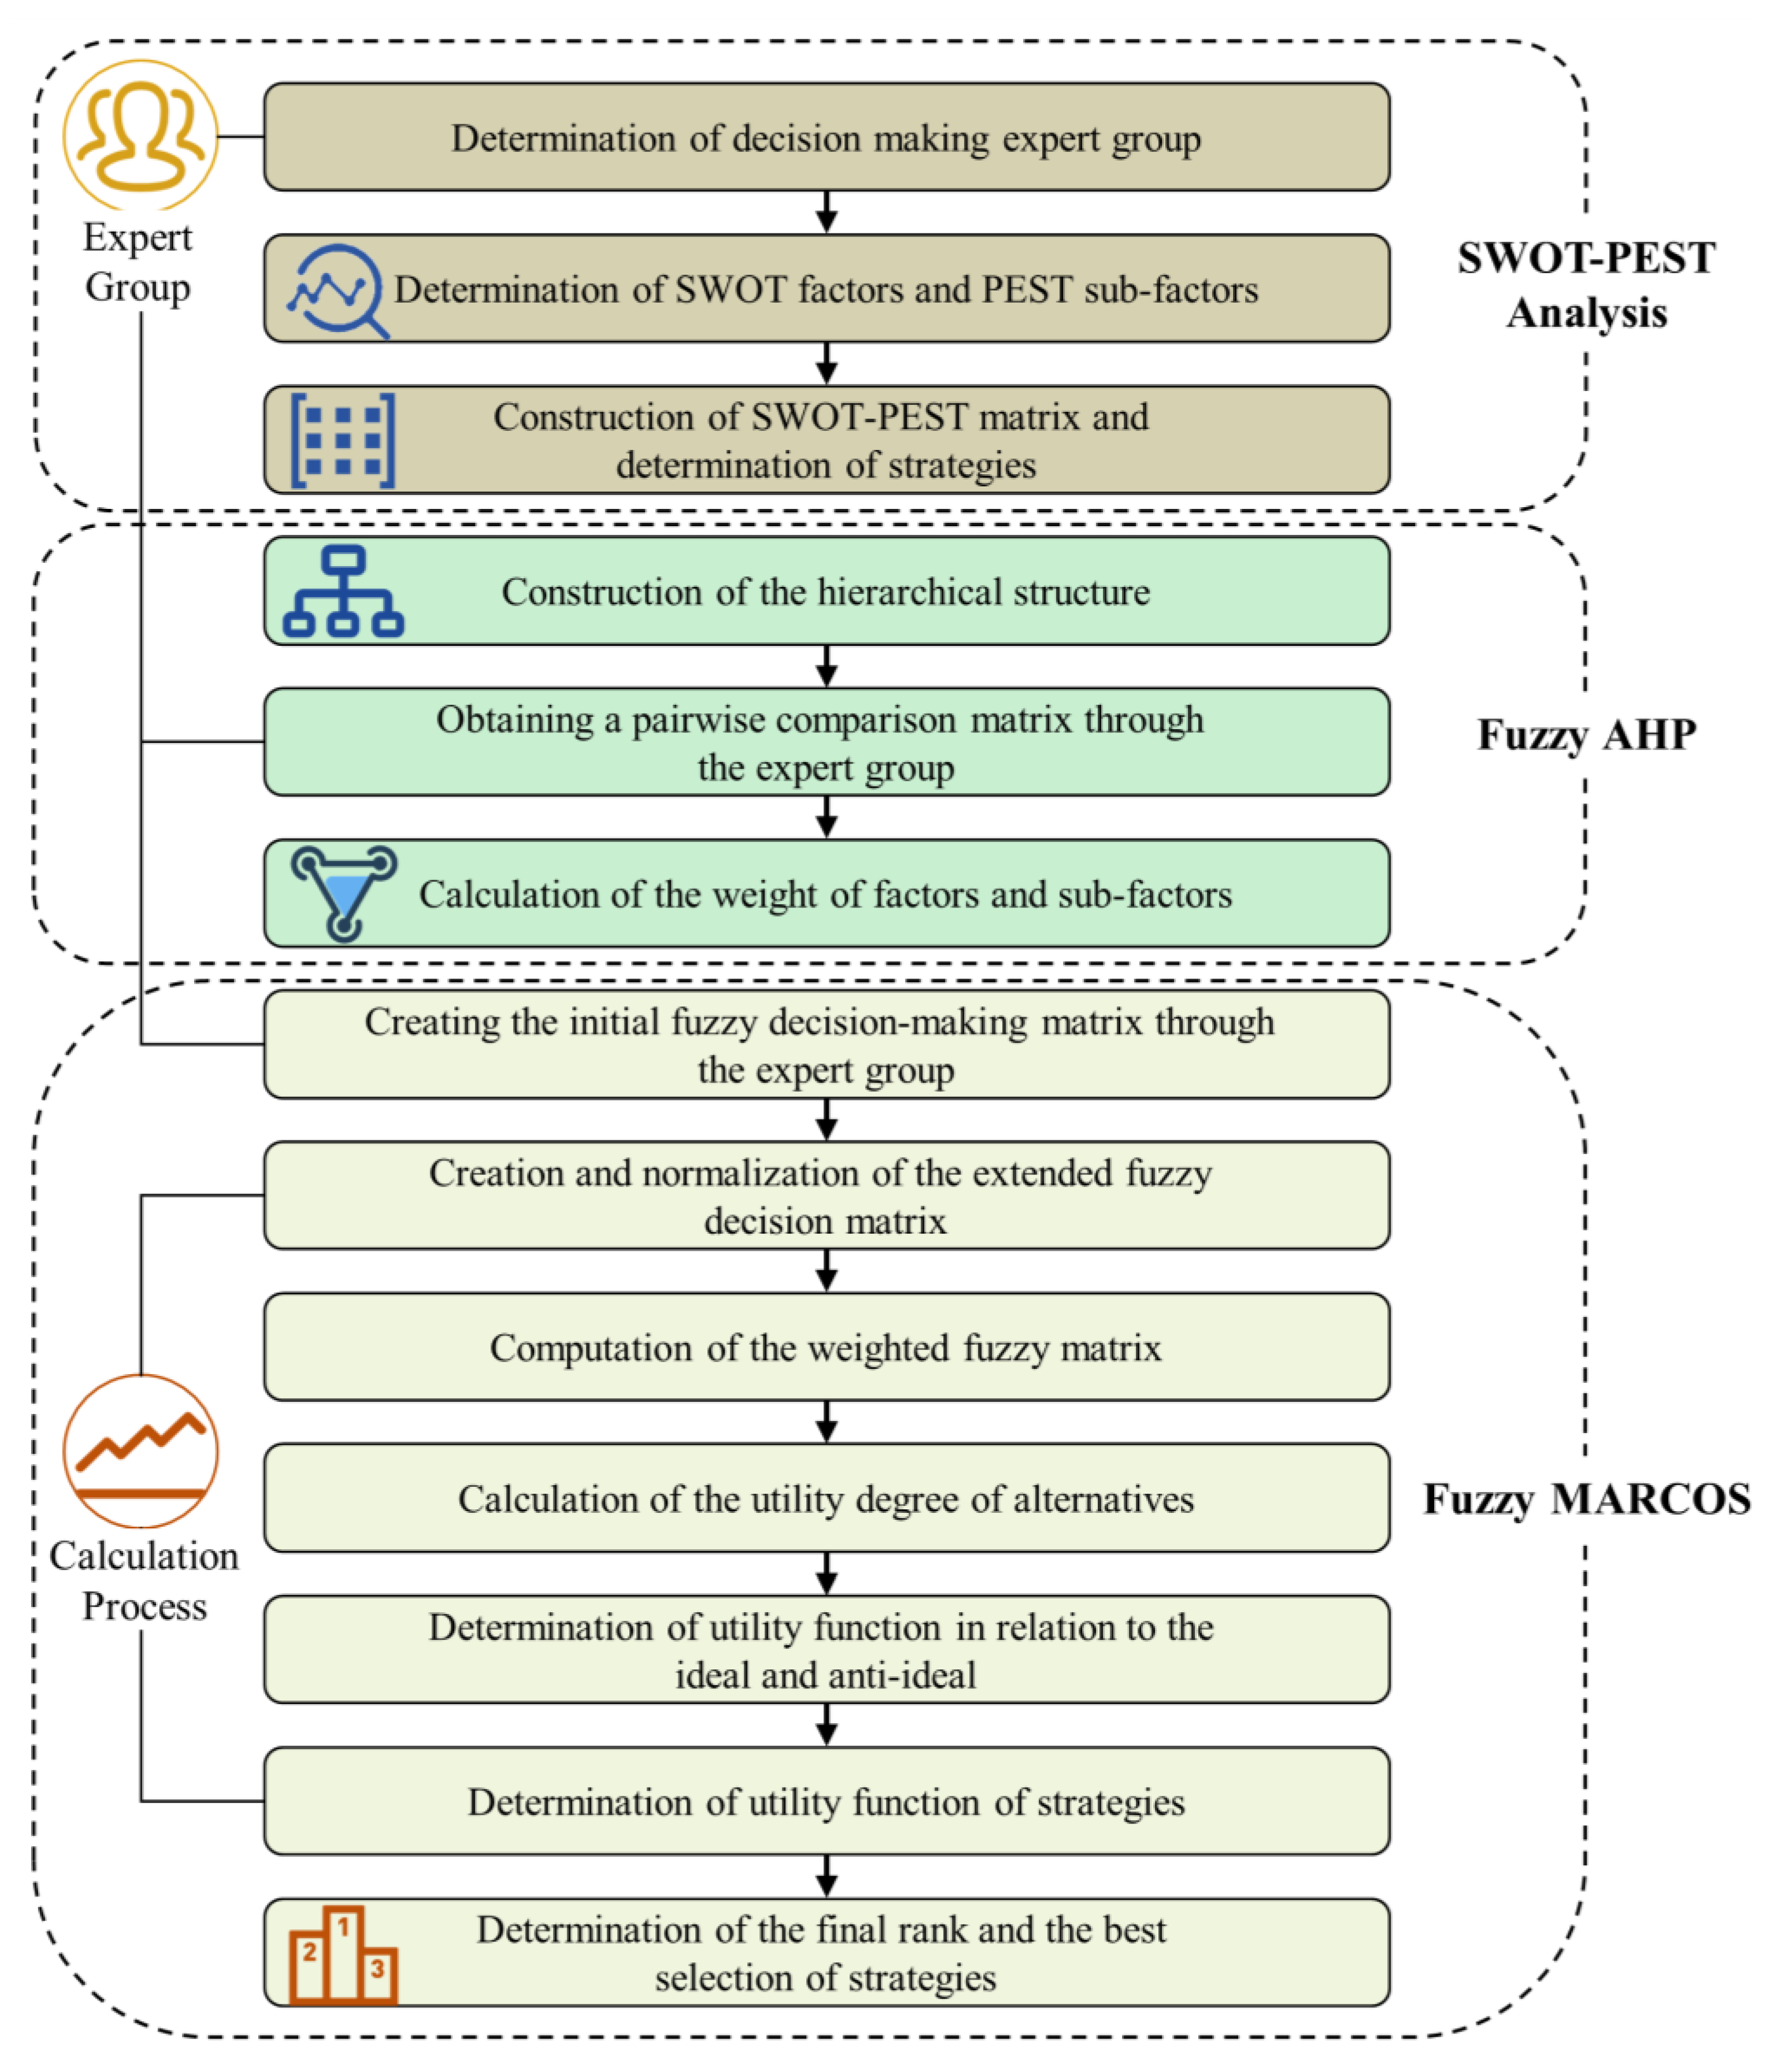
3. Methodology

This section presents the implemented analytical model, the proposed decision-making method, and other preparations to deepen the connection between the theoretical frameworks. First, the SWOT-PEST analysis method is described, then the Fuzzy set theory is introduced, further introducing the complete steps of Fuzzy AHP, and finally the Fuzzy MARCOS method and its steps are described. In the proposed method, AHP is used to obtain criterion weights, and MARCOS is employed to evaluate and rank the alternatives. AHP is easy to use, repeatable, and supports group decision making in a hierarchical structure, while MARCOS is characterized by flexibility when considering compromise solutions based on relative importance. The combination of two methods makes the model less complex even when there are a large number of criteria or alternatives. Figure 1 depicts the phases of the proposed integrated decision model.

3.1. SWOT-PEST Analysis

SWOT analysis is a useful technique for environmental analysis. It can summarize the internal and external situations of the research object, as well as examine its strengths, weaknesses, opportunities, and threats. It can lead to several more scientific and comprehensive observations. This approach can be used as a guide for developing strategic plans.
PEST analysis is a method for macro-environmental analysis that utilizes environmental scanning to investigate four factors in the total environment: political, economy, society, and technology. It is one of the most significant models for macro-environmental analysis. It assesses the impact of these factors on strategic objectives and strategy formulation by using factor analysis in four aspects to comprehend the macro environment as a whole.
It is not appropriate to analyze an object’s development just based on external or internal aspects when there are several contributing factors. As shown in Table 1 and Figure 2, this work develops a SWOT-PEST matrix analysis model from the perspective of a comprehensive paradigm to obtain numerous environmental factors. The SWOT-PEST analysis approach combines SWOT and PEST analysis, in which internal factors (strengths and weaknesses) and external macro-environmental factors (opportunities and threats) are included for systematic investigation and analysis. Policy, economy, society, and technology are put into the SWOT analysis framework to consider and systematically analyze the strengths, weaknesses, opportunities, and threats to obtain a comprehensive and clear overview of the environmental factors at hand, and to serve as a foundation for strategy formulation.

3.2. Utilized Fuzzy-Based Method

3.2.1. Preliminaries of Fuzzy Set Theory

To cope with the uncertainty or ambiguity of objects, L.A. Zadeh developed the fuzzy set theory in 1965 [51].
A fuzzy set A ˜ = { ( x , μ A ˜ ( x ) ) | x X } is a set of ordered pairs, X is a subset of real numbers R, where μ A ˜ ( x ) is called the membership function, which assigns each object x a membership level from zero to one [52].
Fuzzy set theory has been widely employed to handle practical situations in which decision makers must examine and deal with inaccurate data since its conception. Different fuzzy numbers can be chosen depending on multiple realities. TFN is a specific case of trapezoidal fuzzy numbers that occurs when the two most promising values of a trapezoidal fuzzy number are the same value. Due to its computational simplicity and ability to enable representation and information processing in fuzzy environments [53], triangular fuzzy numbers (TFNs) are employed in many applications. TFNs are typically employed to record the ambiguity of parameters relevant to the decision-making process. They are represented by boundaries rather than clear numbers to reflect the uncertainty decision makers encounter in pairwise comparison matrices. The membership function of a triangular fuzzy number, denoted as A ˜ = ( l   , m   u ) , is as follows
μ A ˜ ( x ) = { 0   i f   x l x l m l   i f   l x m u x u m i f   m x u 0     i f   x u
A triangular fuzzy number A ˜ is a possible range with upper and lower bounds, where m is the most likely value [54]. Consider two TFNS, A ˜ = ( a 1 ,   a 2 ,   a 3 ) and B ˜ = ( b 1 ,   b 2 ,   b 3 ) , the main operational laws [55] for two triangular fuzzy numbers A and B are as follows
A ˜ B ˜ = ( a 1 ,   a 2 ,   a 3 ) ( b 1 ,   b 2 ,   b 3 ) = ( a 1 + b 1 ,   a 2 + b 2 ,   a 3 + b 3 )
A ˜ B ˜ = ( a 1 ,   a 2 ,   a 3 ) ( b 1 ,   b 2 ,   b 3 ) = ( a 1 b 1 ,   a 2 b 2 ,   a 3 b 3 )
λ A ˜ = λ ( a 1 ,   a 2 ,   a 3 ) = ( λ a 1 ,   λ a 2 ,   λ a 3 ) λ > 0 ,   λ R
A ˜ 1 = ( 1 a 3 ,   1 a 2 ,   1 a 1 )

3.2.2. Fuzzy AHP Approach

There are several improved models for fuzzy AHP. Reference [56] compares the advantages and disadvantages of different Fuzzy AHP methods. This study adopts the method proposed by Chang [57], which has been applied in various fields because of its low computational complexity and wide applicability. Let A ˜ = ( a ˜ i j ) m × n be a fuzzy pairwise comparison matrix, where a ˜ i j = ( l i j ,   m i j ,   u i j ) . The steps of Chang’s method can be described as follows:
Step 1: Calculate the value of the fuzzy synthetic extent with respect to the i-th object of the k-level index as follows
V ˜ i k = j = 1 n a ˜ i j k [ i = 1 n j = 1 n a ˜ i j k ] 1 ,   i = 1 ,   2 ,   ,   n
Step 2: Calculate the degree of possibility between two fuzzy synthetic extent values. The degree of possibility is defined as follows
P ( V 1 > V 2 ) = h e i g h t ( V 1 V 2 ) = { 0   i f   l 2 u 1 l 2 u 1 ( m 1 u 1 ) ( m 2 l 2 ) o t h e r w i s e 1   i f   m 1 m 2
Step 3: The degree of possibility for a fuzzy number to be greater than the other k fuzzy numbers can be defined as follows
P ( V V 1 ,   V 2 ,   ,   V k ) = P [ ( V V 1 )   a n d   ( V V 2 )   a n d     a n d   ( V V k ) ]   = min P ( V V i ) i = 1 ,   2 ,   ,   k
Step 4: Assume that d ( C i ) = min P ( V i > V k ) for k = 1, 2, …, n (ik). Then the weight vector can be given as follows
W C = [ d ( C 1 ) ,   d ( C 2 ) ,     , d ( C n ) ] T
where Ci (i = 1, 2, …, n).
Step 5: The normalized weight vector needs to be obtained through normalization
W C = [ d ( C 1 ) ,   d ( C 2 ) ,     , d ( C n ) ] T
Step 6: Repeat the procedures above to obtain the weight Wi of the next level indicator; then the total weight of the indicator is calculated as follows
T W i = W C × W i

3.2.3. Fuzzy MARCOS Approach

The Measurement of Alternatives and Ranking according to Compromise Solution (MARCOS) is a new multi-criteria analysis method. The MARCOS approach is based on a predetermined connection between alternatives and their reference values, which represent ideal and anti-ideal points. For decision making, the MARCOS method employs a utility function, which represents alternatives to ideal and anti-ideal solutions. The optimal alternative is the one that is closest to the ideal solution while being the farthest from the anti-ideal solution. A fuzzy version of the MARCOS method was proposed by Torkayesh, AE et al. [58]. The steps of the method are as follows:
Step 1: The decision maker constructs an initial decision matrix based on the linguistic terms of the alternatives under multiple criteria.
Step 2. Construct an extended initial fuzzy matrix by defining ideal (AI) and anti-ideal (AAI) solutions.
The anti-ideal solution (AAI) and the ideal solution (AI) are obtained by applying Equations (12) and (13)
A ˜ ( A A I ) = { min   i x i j i f   j B max   i x i j i f   j C
A ˜ ( A I ) = { max   i x i j i f   j B min   i x i j i f   j C
where B represents the benefit criterion that needs to be maximized, and C represents the cost criterion that needs to be minimized.
Step 3: Normalize the initial fuzzy decision matrix. Depending on the criteria involved, normalize using Equation (14)
n ˜ = ( n i j l ,   n i j m ,   n i j u ) = { ( x i d l x i j u ,   x i d l x i j m ,   x i d l x i j l ) i f   j C ( x i j l x i d u ,   x i j m x i d u ,   x i j u x i d u ) i f   j B
where l, m, u are the parameters in the triangular fuzzy number, respectively.
Step 4: Calculate the weighted fuzzy matrix V ˜ by multiplying the normalized matrix n ˜ by the weight coefficient w ˜ j of the indicator according to Equation (15).
v ˜ i j = ( v i j l ,   v i j m ,   v i j u ) = n ˜ i j w ˜ j = ( n i j l × w j l ,   n i j m × w j m ,   n i j u × w j u )
Step 5: The calculation of the S ˜ i matrix implies the sum of values by rows (alternatives), including the anti-ideal and ideal solution by applying Equation (16)
S ˜ i = i = 1 n v ˜ i j
Step 6: Calculation of the utility degree of alternatives K ˜ i . The utility degrees of an alternative in relation to the anti-ideal and ideal solution are obtained by using Equations (17) and (18).
K ˜ i = ( s ˜ i s ˜ a i ) = ( s i l s a i u ,   s i m s a i u ,   s i u s a i u )
K ˜ i + = ( s ˜ i s ˜ i d ) = ( s i l s i d u ,   s i m s i d u ,   s i u s i d u )
Step 7: Calculate the fuzzy matrix T ˜ i and D ˜ by using Equations (19) and (20)
T ˜ i = t ˜ i = ( t i l ,   t i m ,   t i u ) = K ˜ i + K i + = ( k ˜ i l + k ˜ i + l , k ˜ i m + k ˜ i + m , k ˜ i u + k ˜ i + u )
D ˜ = ( d l ,   d m ,   d u ) = max i t ˜ i j
Step 8: Defuzzify the fuzzy number D ˜ by using Equation (21)
d f d e f = l + 4 m + u 6
Step 9: Determine the utility functions for the ideal and anti-ideal solutions via Equations (22) and (23)
f ( K ˜ i + ) = K ˜ i d f d e f = ( k i l d f d e f ,   k i m d f d e f ,   k i u d f d e f )
f ( K ˜ i ) = K ˜ i + d f d e f = ( k i + l d f d e f ,   k i + m d f d e f ,   k i + u d f d e f )
where K ˜ i , K ˜ i + , f ( K ˜ i + ) , f ( K ˜ i ) should be defuzzified.
Step 10: Determine the utility functions of alternatives: utility functions f(Ki) of alternatives are obtained through Equation (24)
f ( K i ) = K i + + K i 1 + 1 f ( K i + ) f ( K i + ) + 1 f ( K i ) f ( K i )
Step 11: Rank the alternatives according to their final utility value.

4. Case Study

In this section, the applicability of the proposed model is demonstrated through a case study. All countries throughout the world are developing sustainable development models that are tailored to their own needs, and the mining sector is experiencing a transformation towards sustainable green development and has achieved certain results in the past few years. Through the establishment of a long-term policy mechanism, mine resources and environmental problems have been improved to a certain extent. Today, China has innovatively developed and adopted modern mining technologies, implemented green concepts in mines, issued a series of green mine construction guidelines, and set up some green mine demonstration sites. It is necessary to determine an appropriate development strategy for the green transformation of mines under this trend.

4.1. SWOT-PEST Analysis of Green Mining in China

China’s green mining development strategy is influenced by the combination of internal and external environments. This study adopts the PEST-embedded SWOT analysis method to identify the internal and external factors of the slow progress of green mine construction, and construct a specific SWOT analysis matrix. Through the analysis, various major strengths and opportunities for the development of green mining technology, as well as weaknesses and threats in the development process of green mining, are discovered.
To provide data for strategy analysis, we conducted extensive literature research on relevant themes and approaches. Based on the survey results, as shown in Figure 3, an analysis matrix with four strengths, four weaknesses, four opportunities, and four threats was identified by employing a SWOT-PEST analysis. Green mining strategies were given based on interviews with the expert group. DM1 has more than three decades of experience in the mining industry, specializing in mining development in China. DM2 has extensive experience in the Chinese mining sector. DM3 has extensive experience in researching the sustainable development of China’s mining industry. Each of the three professionals has significant mining expertise and experience.

4.2. Determining the Weights of Criteria by Fuzzy AHP

The evaluation criteria for the alternatives must be defined initially in Fuzzy AHP. We constructed a hierarchical model (Figure 4) containing the objective layer, the criterion layer, the sub-criteria layer, and the strategy layer, as shown in Figure 3, with one objective, four criteria, sixteen sub-criteria, and eight methods, based on the influencing factors identified by the SWOT-PEST study.
Followed by the identification of the criteria and sub-criteria, different priority weights for each criterion and sub-criteria are determined by linguistic comparison terms and their equivalent triangular fuzzy numbers (TFN), which are defined by Khazaeni [53] in Table 2.
Table 3, Table 4, Table 5, Table 6 and Table 7 show the fuzzy comparison matrices for the criterion and sub-criteria and the calculated weights. The consistency check results show that all calculated C.R. values satisfy C.R. < 0.1. Therefore, all evaluations obtained from the panel are consistent. There is no need to repeat the evaluation process.
The standard weight results obtained by the fuzzy AHP method are shown in Table 8. Furthermore, Figure 5 shows the distribution of the SWOT indicator weights based on overall weights.

4.3. Ranking the Strategies by Fuzzy MARCOS

The determined set of suitable strategies given in Table 5 is used in this section. The expert group evaluated alternative strategies based on the SWOT-PEST sub-criteria using the language terms listed in Table 9 [48]. A consensus process was applied during the evaluations. The evaluations of the expert group concerning the strategies are given in Table 10.
For the SWOT-PEST model, the S and W factors are benefit-type, and the W and T factors are cost-type. Therefore, the fuzzy anti-ideal solution and the fuzzy ideal solution are obtained by using Equations (12) and (13); then the extended initial fuzzy matrix is constructed, and the extended initial fuzzy matrix is then normalized using Equation (14).
The weighted fuzzy matrix V ˜ is obtained through Equation (15), where the overall weights of the SWOT factors given in Table 8 are used, and S ˜ i , representing the sum of the elements of the weighted fuzzy matrix, is obtained using Equation (16), as shown in Table 11 below.
The utility degree of K ˜ i , K ˜ i + in relation to the anti-ideal and ideal solution are calculated by Equations (17) and (18), and, in addition, the fuzzy matrix T ˜ i value is obtained by Equation (19). It is necessary to use Equation (20) to find the maximum ti and D ˜ = (1.800, 2.710, 3.588), and then use Equation (21) to defuzzify the number D ˜ to obtain the number d f d e f = 2.705.
According to the obtained utility degree K ˜ i + and d f d e f , the utility function f ( K ˜ i + ) about the ideal can be obtained by applying Equation (22), and similarly, according to the obtained utility degree K ˜ i and d f d e f , the utility function f ( K ˜ i ) about the anti-ideal can be obtained by applying Equation (23): it is shown in the following Table 12.
Defuzzify K ˜ i , K ˜ i + , f ( K ˜ i + ) , and f ( K ˜ i ) by Equation (21) to obtain sharp values K i , K i + , f ( K i + ) , and f ( K i ) . Finally, the utility function f ( K i ) of the alternatives is obtained by Equation (24), and the alternatives are sorted according to the value of the utility function. The final results are shown in Table 13, and the strategies are ranked as S1 > S4 > S3 > S6 > S2 > S8 > S5 > S7. A comparative and sensitivity analysis was performed to confirm these results and is shown in the next section.
The results indicate that the most important dimensions that mines should focus on are the strengths and opportunities associated with GM. The criteria weights obtained through the fuzzy AHP method are shown in Table 3, with a total percentage of 52% for strengths and weaknesses and 48% for opportunities and threats. It shows that internal (strengths and weaknesses) factors and external (opportunities and threats) factors have almost equal importance. Table 10 and Figure 5 show that SP, SE, OS, TS, and ST are the five factors with the highest global weights, indicating that with increased government policy support (SP), positive economic conditions (SE), and a surging demand for resources (OS), Chinese mining companies should take its innovative national strategy as a starting point and make improving its R&D capacity for green technology innovation in mines a development priority (ST) in order to avoid being caught in a global mining environmental pollution problem in the long term (TS). The GMS ranking order indicates that the three most important digital conversion strategies are S1, S4, and S3. These are “Grasp the trend of green development and improve the protection and development level of mineral resources”, “Strengthen technological research and development, improve technological innovation capabilities, and focus on the development of green technologies”, and “Absorb the advanced organization and management experience of developed countries in the mining industry, and standardize and improve the mine green guarantee mechanism”.

5. Validation of Results and Sensitivity Analysis

Result validation and sensitivity analysis are carried out in two processes in this section.

5.1. Comparison with Other Approaches

It is necessary to compare the results obtained by Fuzzy MARCOS with those acquired by using other fuzzy methods in order to validate the results of this study [47]. Therefore, two methods, fuzzy MABAC (Multiple Attribute Boundary Approximate Area Comparison) and TOPSIS (Technique for Order Performance Through Similarity to Ideal Solutions), are used to test the accuracy of the results obtained by the fuzzy MARCOS method.
The results of the comparative analysis are shown in Figure 6; the y-axis represents the ranking, with shorter histograms indicating higher rankings. Comparing the ranking of the fuzzy MARCOS method and the fuzzy TOPSIS method, the change in the ranking results of the eight strategies is the exchange of two groups of adjacent strategies. Comparing the fuzzy MARCOS method and the fuzzy MABAC method, the change in the ranking results of the eight strategies is the order of the last three strategies, and the other orders are the same.
The overall results show that there is little difference between the ranking results of these strategies. The results of the fuzzy MARCOS method are basically the same as those of FMABAC and FTOPSISs. It can be seen that the results obtained by the fuzzy MARCOS method are accurate.

5.2. Sensitivity Analysis

The sensitivity analysis is conducted by changing the weights of criteria to evaluate the impact of individual criteria on prioritization [59]. Therefore, this study changed the weights of the SWOT criteria to investigate the impact of changing the criteria weights on GMS’s prioritization. For this purpose, five cases are determined by changing the weight of the SWOT criteria. In one case, the weights of the four SWOT criteria are set to be equal (0.250), and in the other four cases, only one criterion was set to be relatively important (0.400) [60], while the others remained the same (0.200). Different cases of SWOT criteria weights are given in Table 14.
Then, the fuzzy MARCOS method is applied to the weights determined for each case, and, furthermore, the utility function f(K) value is updated according to the weights. Table 15 presents the GMS utility function values obtained. Based on the updated utility function value, a ranking of the GMS is obtained. Table 16 shows the new ranking order of GMS under different cases. Here, to compare with the initial study, C0 is added to indicate the preliminary results of the study.
Figure 7 presents the distribution of the GMS rankings from an overall perspective. The results obtained show that there is little variation in the prioritization among these cases, and these small differences do not affect the validity of the study. The initial results of this study using the fuzzy MARCOS method can be confirmed. Furthermore, “Grasp the trend of green development and improve the protection and exploitation level of mineral resources” is the most appropriate GMS in all cases.

6. Conclusions

In view of the importance of the mining industry’s green transformation and the driving force of strategic planning for the green transformation, it is essential to take measures to conduct research on the strategic decision making of green mine construction. Accordingly, this study supports this decision making by constructing a new SWOT-PEST matrix and a decision support model. The proposed decision support model and the SWOT-PEST matrix are validated using China’s green mining construction case. The SWOT-PEST tool was used to conduct a comprehensive analysis of internal and external driving and hindering factors, resulting in the identification of four main criteria and 16 sub-criteria. Then the interaction of these factors was studied, and eight macro strategies were formulated. The group expert decision making based on fuzzy terms is introduced to make the decision-making process more scientific and rational. A comprehensive selection of strategies is carried out using two steps: the fuzzy AHP and fuzzy MARCOS method based on SWOT-PEST analysis. Firstly, the importance and weight of SWOT-PEST factors are determined by fuzzy AHP. Then, the recently proposed Fuzzy MARCOS method is adopted for strategy ranking. Finally, the fuzzy TOPSIS and the fuzzy MABAC methods are used to verify the results of the fuzzy MARCOS method. The impact of the SWOT factor weights on the results is evaluated by sensitivity analysis, which verifies the robustness of the proposed method. This paper’s major contributions can be summarized as follows:
  • To the best of the authors’ knowledge, this paper is the first combined method of study using quantitative SWOT-PEST analysis based on the combined fuzzy AHP and fuzzy MARCOS methods.
  • The SWOT-PEST, a combined analysis tool, is used for the first time to create a hierarchical index system for selecting green mining development strategies, which provides a systematic quantitative framework for selecting green mining development strategies and fills a research gap in this area.
  • A case study was carried out concerning the mining industry in China. For green mining, policy support is the prerequisite, technological innovation is the key link, and organization and management are the basic guarantees.
This study provides a systematic quantitative framework for selecting green mining strategies. The model can be applied not only in the mining sector, but also in other industries by analyzing distinct factors and strategies. In the future, it is possible to investigate whether and how to formulate an extended version of the fuzzy analysis.

Author Contributions

Conceptualization, P.W. and G.Z.; methodology, P.W.; software, P.W.; validation, P.W., G.Z. and Y.L.; formal analysis, P.W.; investigation, P.W.; resources, G.Z.; data curation, P.W.; writing—original draft preparation, P.W.; writing—review and editing, G.Z.; visualization, P.W.; supervision, G.Z.; project administration, G.Z.; funding acquisition, G.Z. All authors have read and agreed to the published version of the manuscript.

Funding

This research was funded by the National Key Research and Development Program of China (2018YFC0604606).

Institutional Review Board Statement

Not applicable.

Informed Consent Statement

Not applicable.

Data Availability Statement

The data presented in this study are available upon request from the corresponding author.

Acknowledgments

The authors would like to express their sincere gratitude to the industrial experts. The authors are grateful for the valuable comments of anonymous reviewers, who helped to improve the manuscript greatly.

Conflicts of Interest

The authors declare no conflict of interest.

References

  1. Cheba, K.; Bak, I.; Szopik-Depczynska, K.; Ioppolo, G. Directions of green transformation of the European Union countries. Ecol. Indic. 2022, 136, 15. [Google Scholar] [CrossRef]
  2. Chen, J.H.; Jiskani, I.M.; Lin, A.G.; Zhao, C.C.; Jing, P.X.; Liu, F.J.; Lu, M.Y. A hybrid decision model and case study for comprehensive evaluation of green mine construction level. Dev. Sustain. 2022. [Google Scholar] [CrossRef]
  3. Xu, R.; Chen, X.D.; Zhang, F.F. Green Technology Innovation and Sustainable Development Based on Data Fusion Mining. Ekoloji 2019, 28, 1825–1833. [Google Scholar]
  4. Wang, Z.M.; Zhou, W.; Jiskani, I.M.; Luo, H.T.; Ao, Z.C.; Mvula, E.M. Annual dust pollution characteristics and its prevention and control for environmental protection in surface mines. Sci. Total Environ. 2022, 825, 153949. [Google Scholar] [CrossRef]
  5. Wang, Y.; Wu, X.L.; He, S.Y.; Niu, R.Q. Eco-environmental assessment model of the mining area in Gongyi, China. Sci. Rep. 2021, 11, 18. [Google Scholar] [CrossRef]
  6. Jang, H.; Topal, E. Transformation of the Australian mining industry and future prospects. Min. Technol. 2020, 129, 120–134. [Google Scholar] [CrossRef]
  7. Zhu, R.Q.; Lin, B.Q. Energy and carbon performance improvement in China’s mining Industry: Evidence from the 11th and 12th five-year plan. Energy Policy 2021, 154, 8. [Google Scholar] [CrossRef]
  8. Chen, J.H.; Jiskani, I.M.; Chen, J.L.; Hui, Y. Evaluation and future framework of green mine construction in China based on the DPSIR model. Sustain. Environ. Res. 2020, 30, 10. [Google Scholar] [CrossRef]
  9. Guo, W.B.; Guo, M.J.; Tan, Y.; Bai, E.H.; Zhao, G.B. Sustainable Development of Resources and the Environment: Mining-Induced Eco-Geological Environmental Damage and Mitigation Measures-A Case Study in the Henan Coal Mining Area, China. Sustainability 2019, 11, 4366. [Google Scholar] [CrossRef] [Green Version]
  10. Jiskani, I.M.; Cai, Q.X.; Zhou, W.; Lu, X.; Shah, S.A.A. An integrated fuzzy decision support system for analyzing challenges and pathways to promote green and climate smart mining. Expert Syst. Appl. 2022, 188, 116062. [Google Scholar] [CrossRef]
  11. Zhou, Y.L.; Zhou, W.; Lu, X.; Jiskani, I.M.; Cai, Q.X.; Liu, P.; Li, L. Evaluation Index System of Green Surface Mining in China. Min. Metall. Explor. 2020, 37, 1093–1103. [Google Scholar] [CrossRef]
  12. Markard, J.; Raven, R.; Truffer, B. Sustainability transitions: An emerging field of research and its prospects. Res. Policy 2012, 41, 955–967. [Google Scholar] [CrossRef]
  13. Shang, D.L.; Yin, G.Z.; Li, X.S.; Li, Y.J.; Jiang, C.B.; Kang, X.T.; Liu, C.; Zhang, C. Analysis for Green Mine (phosphate) performance of China: An evaluation index system. Res. Policy 2015, 46, 71–84. [Google Scholar] [CrossRef]
  14. Qian, M.G. Technological system and green mining concept. Coal Sci. Technol. Mag. 2003, 4, 1–3. [Google Scholar]
  15. Ministry of Natural Resources of China (MNR). National Mineral Resources Planning (2008–2015). Available online: http://www.gov.cn/zwgk/2010-08/23/content_1686388.htm (accessed on 18 April 2022).
  16. Ministry of Natural Resources of China (MNR). Notice of the Ministry of Land and Resources on the List of the Fourth Batch of National Pilot Units for Green Mines. Available online: http://www.mnr.gov.cn/gk/tzgg/201408/t20140801_1991297.html (accessed on 18 April 2022).
  17. Ministry of Natural Resources of China (MNR). Announcement of the Ministry of Natural Resources on Issuing 9 Industry Standards including the “Code for Green Mine Construction in the Non-metallic Mining Industry”. Available online: http://gi.mnr.gov.cn/201804/t20180418_1768058.html (accessed on 18 April 2022).
  18. Wang, G.F.; Xu, Y.X.; Ren, H.W. Intelligent and ecological coal mining as well as clean utilization technology in China: Review and prospects. Int. J. Min. Sci. Technol. 2019, 29, 161–169. [Google Scholar] [CrossRef]
  19. Qi, R.; Liu, T.Y.; Jia, Q.X.; Sun, L.; Liu, J.Y. Simulating the sustainable effect of green mining construction policies on coal mining industry of China. J. Clean. Prod. 2019, 226, 392–406. [Google Scholar] [CrossRef]
  20. Wang, S.F.; Sun, L.C.; Huang, L.Q.; Li, X.B.; Shi, Y.; Yao, J.R. Non-explosive mining and waste utilization for achieving green mining in underground hard rock mine in China. Trans. Nonferr. Met. Soc. China 2019, 29, 1914–1928. [Google Scholar] [CrossRef]
  21. Jiskani, I.M.; Moreno-Cabezali, B.M.; Rehman, A.U.; Fernandez-Crehuet, J.M.; Uddin, S. Implications to secure mineral supply for clean energy technologies for developing countries: A fuzzy based risk analysis for mining projects. J. Clean. Prod. 2022, 358, 132055. [Google Scholar] [CrossRef]
  22. Jiskani, I.M.; Cai, Q.X.; Zhou, W.; Lu, X. Assessment of risks impeding sustainable mining in Pakistan using fuzzy synthetic evaluation. Res. Policy 2020, 69, 101820. [Google Scholar] [CrossRef]
  23. Prosser, C.D. Geoconservation, Quarrying and Mining: Opportunities and Challenges Illustrated Through Working in Partnership with the Mineral Extraction Industry in England. Geoheritage 2018, 10, 259–270. [Google Scholar] [CrossRef]
  24. Khaba, S.; Bhar, C. Quantifying SWOT analysis for the Indian coal mining industry using Fuzzy DEMATEL. Benchmarking 2017, 24, 882–902. [Google Scholar] [CrossRef]
  25. Abdel-Basset, M.; Mohamed, M.; Smarandache, F. An Extension of Neutrosophic AHP-SWOT Analysis for Strategic Planning and Decision-Making. Symmetry-Basel 2018, 10, 116. [Google Scholar] [CrossRef] [Green Version]
  26. Khan, M.I. Evaluating the strategies of compressed natural gas industry using an integrated SWOT and MCDM approach. J. Clean. Prod. 2018, 172, 1035–1052. [Google Scholar] [CrossRef]
  27. Andrews, K.R. The Concept of Corporate Strategy; Dow Jones-Irwin: Homewood, IL, USA, 1965. [Google Scholar]
  28. Yuan, H.P. A SWOT analysis of successful construction waste management. J. Clean. Prod. 2013, 39, 1–8. [Google Scholar] [CrossRef]
  29. Terrados, J.; Almonacid, G.; Hontoria, L. Regional energy planning through SWOT analysis and strategic planning tools. Impact on renewables development. Renew. Sustain. Energy Rev. 2007, 11, 1275–1287. [Google Scholar] [CrossRef]
  30. Zhao, J.K.; Liu, H.L.; Xue, W.X. PEST Embedded SWOT Analysis on China’s E-Commerce Industry Development Strategy. J. Electron. Commer. Organ. 2019, 17, 55–68. [Google Scholar] [CrossRef]
  31. Novikov, S.V. Strategic analysis of the development of high-technology manufacturing facilities. Russ. Eng. Res. 2018, 38, 198–200. [Google Scholar] [CrossRef]
  32. Kolbina, O. SWOT analysis as a strategic planning tool for companies in the food industry. Probl. Econ. Transit. 2015, 57, 74–83. [Google Scholar] [CrossRef]
  33. Bohari, A.M.; Hin, C.W.; Fuad, N. The competitiveness of halal food industry in Malaysia: A SWOT-ICT analysis. Geogr.-Malays. J. Soc. Space 2013, 9, 1–9. [Google Scholar]
  34. Liu, Z.W.; Zhao, J.H.; Gao, P.Z. Exploration for the Low-carbon Economic Development Model of Large-scale Coal Enterprises Based on the SWOT Model. In Proceedings of the 1st International Conference on Energy and Environmental Protection (ICEEP 2012), Hohhot, China, 23–24 June 2012. [Google Scholar]
  35. Nikolaou, I.E.; Evangelinos, K.I. A SWOT analysis of environmental management practices in Greek Mining and Mineral Industry. Res. Policy 2010, 35, 226–234. [Google Scholar] [CrossRef]
  36. Jiskani, I.M.; Shah, S.A.A.; Cai, Q.X.; Zhou, W.; Lu, X. A multi-criteria based SWOT analysis of sustainable planning for mining and mineral industry in Pakistan. Arab. J. Geosci. 2020, 13, 1108. [Google Scholar] [CrossRef]
  37. Dong, H.; Liu, Z.G.; Kong, K.; Li, T.; Ma, Q.L. Evaluation of Input-Output Efficiency of Sports Industry Based on SWOT-PEST Model. J. Math. 2021, 2021, 11. [Google Scholar] [CrossRef]
  38. Pan, Y.J.; Peng, K.; Peng, H.X.; Zhang, J.; Zeng, M.; Huang, C.S. Evaluation Model and Empirical Study on the Competitiveness of the County Silicon Crystal Industry. Sustainability 2019, 11, 360. [Google Scholar] [CrossRef] [Green Version]
  39. Antony, J. A SWOT analysis on Six Sigma: Some perspectives from leading academics and practitioners. Int. J. Product. Perform. Manag. 2012, 61, 691–698. [Google Scholar] [CrossRef]
  40. Arslan, O.; Er, I.D. SWOT analysis for safer carriage of bulk liquid chemicals in tankers. J. Hazard. Mater. 2008, 154, 901–913. [Google Scholar] [CrossRef]
  41. Shahin, A.; Mahbod, M.A. Prioritization of key performance indicators: An integration of analytical hierarchy process and goal setting. Int. J. Product. Perform. Manag. 2007, 56, 226–240. [Google Scholar] [CrossRef]
  42. Jiskani, I.M.; Cai, Q.X.; Zhou, W.; Shah, S.A.A. Green and climate-smart mining: A framework to analyze open-pit mines for cleaner mineral production. Res. Policy 2021, 71, 102007. [Google Scholar] [CrossRef]
  43. Oreski, D. Strategy development by using SWOT-AHP. TEM J. 2012, 1, 283–291. [Google Scholar]
  44. Erdogan, A.; Kara, G. Determining the maritime transportation policy of Turkey. Int. J. Marit. Eng. 2019, 161, 437–448. [Google Scholar] [CrossRef]
  45. Buyukozkan, G.; Mukul, E.; Kongar, E. Health tourism strategy selection via SWOT analysis and integrated hesitant fuzzy linguistic AHP-MABAC approach. Socio-Econ. Plan. Sci. 2021, 74, 14. [Google Scholar] [CrossRef]
  46. Solangi, Y.A.; Tan, Q.M.; Mirjat, N.H.; Ali, S. Evaluating the strategies for sustainable energy planning in Pakistan: An integrated SWOT-AHP and Fuzzy-TOPSIS approach. J. Clean. Prod. 2019, 236, 14. [Google Scholar] [CrossRef]
  47. Stevic, Z.; Pamucar, D.; Puska, A.; Chatterjee, P. Sustainable supplier selection in healthcare industries using a new MCDM method: Measurement of alternatives and ranking according to COmpromise solution (MARCOS). Comput. Ind. Eng. 2020, 140, 15. [Google Scholar] [CrossRef]
  48. Stankovic, M.; Stevic, Z.; Das, D.K.; Subotic, M.; Pamucar, D. A New Fuzzy MARCOS Method for Road Traffic Risk Analysis. Mathematics 2020, 8, 457. [Google Scholar] [CrossRef] [Green Version]
  49. Brkovic, N. A Novel Integrated FUCOM-MARCOS Model for Evaluation of Human Resources in a Transport Company. Logistics 2020, 4, 14. [Google Scholar]
  50. Ulutas, A.; Karabasevic, D.; Popovic, G.; Stanujkic, D.; Nguyen, P.T.; Karakoy, C. Development of a Novel Integrated CCSD-ITARA-MARCOS Decision-Making Approach for Stackers Selection in a Logistics System. Mathematics 2020, 8, 1672. [Google Scholar] [CrossRef]
  51. Zadeh, L.A. Fuzzy set. Inf. Control 1965, 8, 338–353. [Google Scholar] [CrossRef] [Green Version]
  52. Kim, Y.; Chung, E.S. Fuzzy VIKOR approach for assessing the vulnerability of the water supply to climate change and variability in South Korea. Appl. Math. Model. 2013, 37, 9419–9430. [Google Scholar] [CrossRef]
  53. Khazaeni, G.; Khanzadi, M.; Afshar, A. Fuzzy adaptive decision making model for selection balanced risk allocation. Int. J. Proj. Manag. 2012, 30, 511–522. [Google Scholar] [CrossRef]
  54. Chen, J.F.; Hsieh, H.N.; Do, Q.H. Evaluating teaching performance based on fuzzy AHP and comprehensive evaluation approach. Appl. Soft Comput. 2015, 28, 100–108. [Google Scholar] [CrossRef]
  55. Lee, S. Determination of Priority Weights under Multiattribute Decision-Making Situations: AHP versus Fuzzy AHP. J. Constr. Eng. Manag. 2015, 141, 9. [Google Scholar] [CrossRef]
  56. Buyukozkan, G.; Kahraman, C.; Ruan, D. A fuzzy multi-criteria decision approach for software development strategy selection. Int. J. Gen. Syst. 2004, 33, 259–280. [Google Scholar] [CrossRef]
  57. Chang, D.Y. Applications of the extent analysis method on fuzzy AHP. Eur. J. Oper. Res. 1996, 95, 649–655. [Google Scholar] [CrossRef]
  58. Torkayesh, A.E.; Zolfani, S.H.; Kahvand, M.; Khazaelpour, P. Landfill location selection for healthcare waste of urban areas using hybrid BWM-grey MARCOS model based on GIS. Sustain. Cities Soc. 2021, 67, 16. [Google Scholar] [CrossRef]
  59. Božanić, D.; Tešić, D.; Kočić, J. Multi-criteria FUCOM—Fuzzy MABAC model for the selection of location for construction of single-span bailey bridge. Appl. Manag. Eng. 2019, 2, 132–146. [Google Scholar] [CrossRef]
  60. Wang, Y.; Xu, L.; Solangi, Y.A. Strategic renewable energy resources selection for Pakistan: Based on SWOT-Fuzzy AHP approach. Sustain. Cities Soc. 2020, 52, 14. [Google Scholar] [CrossRef]
Figure 1. The proposed methodology of the research.
Sustainability 14 07577 g001
Figure 2. SWOT-PEST matrix.
Sustainability 14 07577 g002
Figure 3. SWOT-PEST analysis matrix of China’s green mining industry.
Sustainability 14 07577 g003
Figure 4. Hierarchical structure model of SWOT-PEST matrix.
Sustainability 14 07577 g004
Figure 5. The overall weight distribution of SWOT-PEST factors.
Sustainability 14 07577 g005
Figure 6. Rank of alternatives with different fuzzy methods.
Sustainability 14 07577 g006
Figure 7. The comparison of the ranked orders of the GMSs in different cases.
Sustainability 14 07577 g007
Table 1. PEST-embedded SWOT analysis.
PESTSWOT
StrengthsWeaknessesOpportunitiesThreats
PoliticsSPWPOPTP
EconomySEWEOETE
SocietySSWSOSTS
TechnologySTWTOTTT
Table 2. Fuzzy Fundamental Scale.
Linguistic TermFuzzy NumberTriangular Fuzzy ScaleReciprocal Fuzzy Scale
Equally significant (ES) 1 ˜ (1, 1, 1)(1, 1, 1)
Weakly more significant (WMS) 3 ˜ (1, 3, 5)(1/5, 1/3, 1)
Strongly more significant (SMS) 5 ˜ (3, 5, 7)(1/7, 1/5, 1/3)
Very strongly significant (VSS) 7 ˜ (5, 7, 9)(1/9, 1/7, 1/5)
Absolutely significant (AS) 9 ˜ (7, 9, 9)(1/9, 1/9, 1/7)
Table 3. The fuzzy comparison matrix of criteria with respect to the objective.
CriteriaSWOTCriteria Weight
SES VSSSMS0.353
WSMSESWMS 0.164
O ESWMS0.273
T AS ES0.210
(C.R. = 0.001 < 0.1).
Table 4. The fuzzy comparison matrix of sub-criteria with respect to criteria S.
Sub-CriteriaSPSESSSTRelative Weight
SPESWMS 0.377
SE ESSMS 0.286
SSVSS ESSMS0.117
STSMSWMS ES0.220
(C.R. = 0.043 < 0.1).
Table 5. The fuzzy comparison matrix of sub-criteria with respect to criteria W.
Sub-CriteriaWPWEWSWTRelative Weight
WPESWMSVSS 0.166
WE ES SMS0.291
WS SMSESSMS0.170
WTWMS ES0.373
(C.R. = 0.045 < 0.1).
Table 6. The fuzzy comparison matrix of sub-criteria with respect to criteria O.
Sub-CriteriaOPOEOSOTRelative Weight
OPESWMSSMS 0.221
OE ESMSSMS0.217
OS ESWMS0.338
OTVSS ES0.224
(C.R. = 0.073 < 0.1).
Table 7. The fuzzy comparison matrix of sub-criteria with respect to criteria T.
Sub-CriteriaTPTETSTTRelative Weight
TPES VSSSMS0.131
TESMSESWMS 0.257
TS ESWMS0.430
TT AS ES0.182
(C.R. = 0.039 < 0.1).
Table 8. Weights of criteria and sub-criteria.
CriteriaCriteria WeightSub-CriteriaRelative WeightOverall Weight
S0.353SP0.377 0.134
SE0.286 0.101
SS0.117 0.041
ST0.220 0.078
W0.164WP0.166 0.027
WE0.291 0.048
WS0.170 0.028
WT0.373 0.061
O0.273WP0.221 0.060
OE0.217 0.059
OS0.338 0.092
OT0.224 0.061
T0.210TP0.131 0.028
TE0.257 0.054
TS0.430 0.090
TT0.182 0.038
Table 9. Valuation scale for strategies.
Linguistic TermTFN
Extremely poor (EP)(1, 1, 1)
Very poor (VP)(1, 1, 3)
Poor (P)(1, 3, 3)
Medium poor (MP)(3, 3, 5)
Medium (M)(3, 5, 5)
Medium good (MG)(5, 5, 7)
Good (G)(5, 7, 7)
Very good (VG)(7, 7, 9)
Extremely good (EG)(7, 9, 9)
Table 10. Evaluation of green mining strategies by the group of experts.
GMSSPSESSSTWPWEWSWTOPOEOSOTTPTETSTT
S1EGEGEGEGMGGGMGEGEGGEGMGEGGMG
S2MMGMGGMGMGGVGEGEGEGVGGGVGMG
S3EGMGMGEGGGEGMGEGEGEGGMEGMGG
S4EGVGEGEGGEGVGGEGEGEGEGPEGEGM
S5GVGGGGVGEGGVGEGVGVGVGVGGM
S6EGGGEGEGGEGEGEGVGEGEGEGVGGG
S7MGVPVGPEGMGEGGMGVPMMPEGVGEGMG
S8MGMGMGGMGGVGEGEGEGGEGEGGM
Table 11. The sum of the elements of the weighted fuzzy matrix.
S ˜ i ( s ˜ i l ,   s ˜ i m ,   s ˜ i u ) S ˜ i ( s ˜ i l ,   s ˜ i m ,   s ˜ i u )
S ˜ a a i (0.387, 0.443, 0.561) S ˜ 5 (0.590, 0.665, 0.795)
S ˜ 1 (0.632, 0.786, 0.844) S ˜ 6 (0.603, 0.717, 0.791)
S ˜ 2 (0.559, 0.686, 0.764) S ˜ 7 (0.446, 0.502, 0.633)
S ˜ 3 (0.608, 0.733, 0.819) S ˜ 8 (0.590, 0.660, 0.825)
S ˜ 4 (0.647, 0.761, 0.894) S ˜ a i (0.700, 0.841, 1.000)
Table 12. Obtained K ˜ i + , K ˜ i , and T ˜ i values.
I K ˜ i + K ˜ i T ˜ i f ( K ˜ i + ) f ( K ˜ i )
1(0.632, 0.935, 1.206)(1.126, 1.775, 2.181)(1.758, 2.710, 3.387)(0.416, 0.656, 0.806)(0.234, 0.346, 0.446)
2(0.559, 0.816, 1.092)(0.996, 1.549, 1.974)(1.554, 2.364, 3.066)(0.368, 0.572, 0.730)(0.206, 0.302, 0.404)
3(0.608, 0.871, 1.170)(1.084, 1.654, 2.116)(1.692, 2.525, 3.285)(0.401, 0.611, 0.782)(0.225, 0.322, 0.432)
4(0.647, 0.905, 1.277)(1.153, 1.719, 2.310)(1.800, 2.624, 3.588)(0.426, 0.635, 0.854)(0.239, 0.335, 0.472)
5(0.590, 0.791, 1.136)(1.052, 1.502, 2.055)(1.642, 2.293, 3.192)(0.389, 0.555, 0.760)(0.218, 0.292, 0.420)
6(0.603, 0.853, 1.130)(1.075, 1.619, 2.044)(1.677, 2.472, 3.175)(0.397, 0.599, 0.756)(0.223, 0.315, 0.418)
7(0.446, 0.597, 0.905)(0.795, 1.134, 1.637)(1.241, 1.732, 2.542)(0.294, 0.419, 0.605)(0.165, 0.221, 0.335)
8(0.590, 0.785, 1.179)(1.051, 1.490, 2.132)(1.641, 2.275, 3.310)(0.389, 0.551, 0.788)(0.218, 0.290, 0.436)
Table 13. Final results of fuzzy MARCOS method and ranking of the GMS.
GMS K i + K i f ( K i + ) f ( K i ) f ( K i ) Order
S10.9301.7350.6410.3440.7681
S20.8191.5270.5650.3030.5765
S30.8771.6360.6050.3240.6723
S40.9241.7230.6370.3420.7572
S50.8151.5190.5620.3010.5697
S60.8571.5990.5910.3170.6394
S70.6231.1610.4290.2300.3158
S80.8181.5240.5630.3020.5746
Table 14. Different weights of the SWOT criteria in different cases.
CriteriaInitial ValueC1C2C3C4C5
S0.3530.2500.4000.2000.2000.200
W0.1640.2500.2000.4000.2000.200
O0.2730.2500.2000.2000.4000.200
T0.2100.2500.2000.2000.2000.400
Table 15. The weights of the SWOT factors in different cases.
FactorsRelative WeightC0C1C2C3C4C5
SP0.377 0.134 0.094 0.151 0.075 0.075 0.075
SE0.286 0.101 0.072 0.114 0.057 0.057 0.057
SS0.117 0.041 0.029 0.047 0.023 0.023 0.023
ST0.220 0.078 0.055 0.088 0.044 0.044 0.044
WP0.166 0.027 0.042 0.033 0.066 0.033 0.033
WE0.291 0.048 0.073 0.058 0.116 0.058 0.058
WS0.170 0.028 0.043 0.034 0.068 0.034 0.034
WT0.373 0.061 0.093 0.075 0.149 0.075 0.075
OP0.221 0.060 0.055 0.044 0.044 0.088 0.044
OE0.217 0.059 0.054 0.043 0.043 0.087 0.043
OS0.338 0.092 0.085 0.068 0.068 0.135 0.068
OT0.224 0.061 0.056 0.045 0.045 0.090 0.045
TP0.131 0.028 0.033 0.026 0.026 0.026 0.052
TE0.257 0.054 0.064 0.051 0.051 0.051 0.103
TS0.430 0.090 0.108 0.086 0.086 0.086 0.172
TT0.182 0.038 0.046 0.036 0.036 0.036 0.073
Table 16. The obtained f(K) and strategy ordering in different cases.
GMSC0C1C2C3C4C5
f(Ki)Orderf(Ki)Orderf(Ki)Orderf(Ki)Orderf(Ki)Orderf(Ki)Order
S10.76810.80310.82710.79310.80210.7791
S20.57650.61860.54370.62640.67150.6296
S30.67230.74320.71830.72520.76730.7602
S40.75720.72230.74520.66530.77120.7013
S50.56970.62350.60650.59370.64470.6455
S60.63940.66640.68240.60350.71240.6654
S70.31580.30880.27280.35580.27280.3398
S80.57460.60570.54460.60160.65460.6177
Publisher’s Note: MDPI stays neutral with regard to jurisdictional claims in published maps and institutional affiliations.

