Article

A New Longevity Design Methodology Based on Consumer-Oriented Quality for Fashion Products

ENSAIT, ULR 2461-GEMTEX-Génie et Matériaux Textiles, University of Lille, F-59000 Lille, France
*
Author to whom correspondence should be addressed.
Sustainability 2022, 14(13), 7696; https://doi.org/10.3390/su14137696
Submission received: 17 May 2022 / Revised: 17 June 2022 / Accepted: 21 June 2022 / Published: 24 June 2022

Abstract

:
Design for longevity is known as an eco-design opportunity and could help to reduce the environmental footprint of energy-free items. However, extending the lifespan of products is not always desirable and the focus should be on achieving an optimal lifespan. Operationally, recommendations for design for longevity usually refer to durability, repairability, upgradability or emotional attachment. The use of high-quality and robust material is frequently stated, although it is not obvious what high-quality material is. Based on a quality by design approach, this study aims to propose a methodology to design for optimal longevity with a consumer-oriented approach. To do so, it includes data collection of product quality and manufacturing processes and then embeds consumers’ knowledge. These are combined into data analysis to help to highlight relationships and the most appropriate quality contributors. This methodology relies on three-steps: first, a single quality score which includes consumers’ knowledge; secondly, a multi-scale reverse-engineering process; and finally a data analysis using principal component analysis. The originality of such a proposal is that it enables the consumers’ knowledge to be considered in the identification of appropriated quality contributors. The proposed methodology is implemented in the fashion sector as it is said to be the second most polluting one. Moreover, given the huge variety of materials and production processes available in textiles, the selection of the most suitable recommendations to support a longer lifespan is very complex. The presented case study involves 29 T-shirts and reveals the mechanical-related strengths to be the main quality contributors.

1. Introduction

The fashion industry has been described as the second most polluting in the world by the UN Conference on Trade and Development [1,2]. Even if this ranking is subject to debate, it is clear that the textile sector generates significant effects. Driven by population growth and economic development, the fashion industry’s impact on climate change is estimated to 8–10% of global carbon emissions [3] and to have increased by 35% in about ten years [4]; 20% of industrial water pollution is due to textile and dyeing processes [3], and 20 to 35% of primary micro-plastics come from the textile sector, making it the leading contributor to these emissions [5,6]. Some of these environmental effects are definitely related to the manufacturing phase, however they are in fact spread over the entire life cycle of products, and therefore manufacturers and consumers have the ability to contribute to reducing the environmental impact. Scientific studies demonstrate that practices have changed and consumption of clothing has increased substantially [7]; on average, consumers buy 60% more clothes today than 15 years ago and keep them half as long [8]. As a result, fashion brands are producing almost twice as much as they did 20 years ago, while at the same time product usage has decreased and more than 50% of our wardrobe would simply not be worn.
The fashion sector splits its environmental impact between the manufacturing phase, which includes textile production, garment production and transport, and the use and the end-of-life phases. Such an impact partly depends on the product’s lifespan and consumer behavior, and was shown to be essentially induced by the manufacturing and the use phases [9,10,11]. The manufacturing chain consists in transforming raw material, usually cotton or synthetic fibers, into a garment. It involves five processing stages: fiber production; yarn production (including preparation and spinning); fabric production (knitting or weaving); wet treatment processes (including preparation, dyeing and finishing); and making-up. The fiber production, the yarn preparation and the wet treatment are energy and materials demanding processes. Thus they dominate most of the impact categories [10,11,12,13,14]. The use phase consists in wearing and caring for the clothes. Ultimately, the environmental impact of this phase is almost exclusively influenced by the product lifespan and the consumer behavior and is highly induced by the washing frequency, the wash temperature, the detergent used and the drying method [9,13,15].
To face the environmental challenges, the fashion industry can rely on operational principles of the circular economy by capturing the full value of clothing during and after use, reducing process losses, or by promoting and designing for longevity [16,17,18,19,20,21]. However, the notion of longevity, i.e., the product lifetime, is complex and its meaning varies regarding the setting in which it is being used. Cox et al. [22] formulates two dimensions for the longevity: the product nature and the product nurture. The first is related to the intrinsic quality and the functionality aspects of the product, while the second reflects the willingness of consumer to keep the product, the balance between nature and nurture being variable across product categories. Considering the product lifetime as the amount of time from purchase to disposal, Sandin et al. [12] estimated that doubling the use per garment eliminates almost 50% of the impact, regardless of the impact category. However, given the huge number of raw materials and the variety of manufacturing processes used to transform them into clothing, it is not possible to define a unique recommendation for producing products with a longer lifespan. Furthermore, the lifespans of textile products are strongly influenced by consumer behaviors and usages.
Relying on the simultaneous observation of input and output data, quality by design helps to determine critical characteristics, such as the material and process-oriented, to achieve a meaningful and predefined quality [28,29]. Based on QbD, we propose to combine a clothing longevity index with the materials and manufacturing processes and then identify the main quality contributors. In order to determine and quantify the links between the different material and manufacturing factors, our proposed system relies on multivariate analysis. It offers description methods by simultaneous exploration and allows the identification of a structure in a data set. These techniques have demonstrated their abilities to describe, highlight and evaluate existing relationships in a set of data in many domains [30]. In textile and fashion-related research, Hamdi et al. [31] proposed an approach, based on PCA, to investigate the relationships between the drape of a woven fabric and three of its structural parameters: weight, thickness, bending rigidity (in weft, warp and skew directions). The testing of 55 fabrics enabled the warp and skew bending rigidity to be highlighted as the most relevant. Hamdi et al. also relied on the PCA results to define a pattern of “drapability”. Umair’s et al. [32] research focused on the use of PCA for a simultaneous optimization of four fabric properties: the crimp, the flexural rigidity, the bending modulus and the air permeability. Eight plain and twill woven fabrics, made from cotton, with carded and combed yarns having different twist levels, were tested. The multi-response optimization was performed stepwise and finally highlighted the woven pattern as significant. Other examples are found in Bertaux et al. [33] and Bacci’s et al. [34] studies. Both investigated the tactile properties of fabrics and integrated a human consideration into their research. Bertaux et al. [33] focused on the relationships between the friction and tactile properties for fabrics, while Bacci’s et al. study [34] aimed to provide manufacturers with sensory profiles of traditional wool fabrics. These two investigations rely on subjective sensory assessments and objective measurements. However, since the advantage of the PCA is to reduce the dimensionality of a dataset with numerical variables [35], the consideration of such subjective information adds complexity in the analysis. Bertaux et al. [33] used the ranking of fabrics to provide numerical values for sensory assessments; Bacci’s et al. study [34] used a 15-point scale to provide numerical ratings based on the panelists’ evaluations. In both cases, human consideration is shown to be integrable in PCA. A limitation is that such studies involved the training of a relatively small panel. For a larger integration of human knowledge, consumers should be considered. However, consumers, without specific training, use their own words, based on their experience, to describe their perception [36]. In this situation, it is highly recommended to rely on linguistic scale. Thus, fuzzy multi-criteria decision-making, based on fuzzy inference systems [37], emerges as a very suitable technique [38] to deal with such an issue. As an example, Zeng’s et al. study [39] aimed at modelling the relationship between objective and subjective fabric hand evaluations and between manufacturing parameters and objective fabric hand features. In the developed methodology, fuzzy techniques, principal component analysis and other data analysis techniques are combined; human knowledge and objective measurements are used in a complementary way for selecting relevant physical features and extracting rules.
To deal with these issues, studies have mainly adopted a user-centered approach [23,24,25,26] and resulted in general principles such as: designing of “timeless styles”, manufacturing using “high quality fabrics” [23] and the involvement of the consumers to add functional and emotional value [24,26]. Considering that design precedes production, Morseletto et al. [27] emphasized the need to set targets for different types of designs. Thus, targets for design for longevity could include quality protocols and physical parameters. However, to the best of our knowledge, no study has been conducted to answer the question: what is a high-quality fabric with regard to longevity? How could the technical lifetime be increased? The research question therefore focuses on how to identify relationships between product quality and physical parameters, manufacturing processes and consumers’ insight. In this paper, a methodology based on the quality by design (QbD) approach is proposed. It aims to investigate how to connect these three factors to support the design for longevity.
To investigate the relationship between product quality, structural properties and manufacturing information and consumers’ insight, this study proposes to rely on an existing clothing longevity index which is computed from quality measurements and e consumer perception. The originality of our proposal is that the investigated relationship emerges from a unique quality score instead of a diversity of measurements and that it introduces a consumer dimension into the calculation. Thus, the identified parameters that contribute to quality for longevity intend to better meet consumer needs and expectations. Given that the T-shirt is a representative product on the European market [9,11], a comprehensive implementation was carried out on this product. This paper is structured as follows: Section 2 describes the methods involved, detailing the data collection processes and the selected multivariate analysis tool. It also describes the T-shirt case study. Section 3 focuses on the implementation of the proposed methodology and leads to the identification of quality contributors. Section 4 includes discussion and Section 5 concludes the paper.

2. Materials and Methods

Our approach, based on QbD, aims to identify and quantify the relationships between the clothing quality and the manufacturing processes in order to highlight the most relevant parameters (Figure 1). Such quality, as an output indicator, should be a polymorphous object built, at least, on the consumer’s perspective [40]. However, the evaluation of textile quality is generally based on standardized tests which deal with specific quality issues and do not reflect multiple real-life stresses. These tests lead to heterogeneous results with varying units of measurement and orders of magnitude of evaluation, and since they can be numerous, they are not convenient to use in an eco-design process. As longevity is a multi-factorial and complex concept, it should integrate all dimensions of product quality. To do so, we rely on a previous study in which a single product- and consumer- dependent index, known as consumer-oriented quality (CoQ), has been developed to quantify clothing longevity [41]. It enables multiple textile qualities to be aggregated according to the significance that the consumer attaches to them. In this paper, such a longevity index is combined with the manufacturing parameters to highlight the critical ones, i.e., those that mainly affect the quality and longevity of the product. The aim is thus to provide a suitable decision support system for eco-design, considering consumer needs and practices.

2.1. Consumer-Oriented Quality (CoQ) Computation Method

For an easier reading, the computation method of the CoQ longevity index, developed in previous studies [41,42,43], is briefly described.
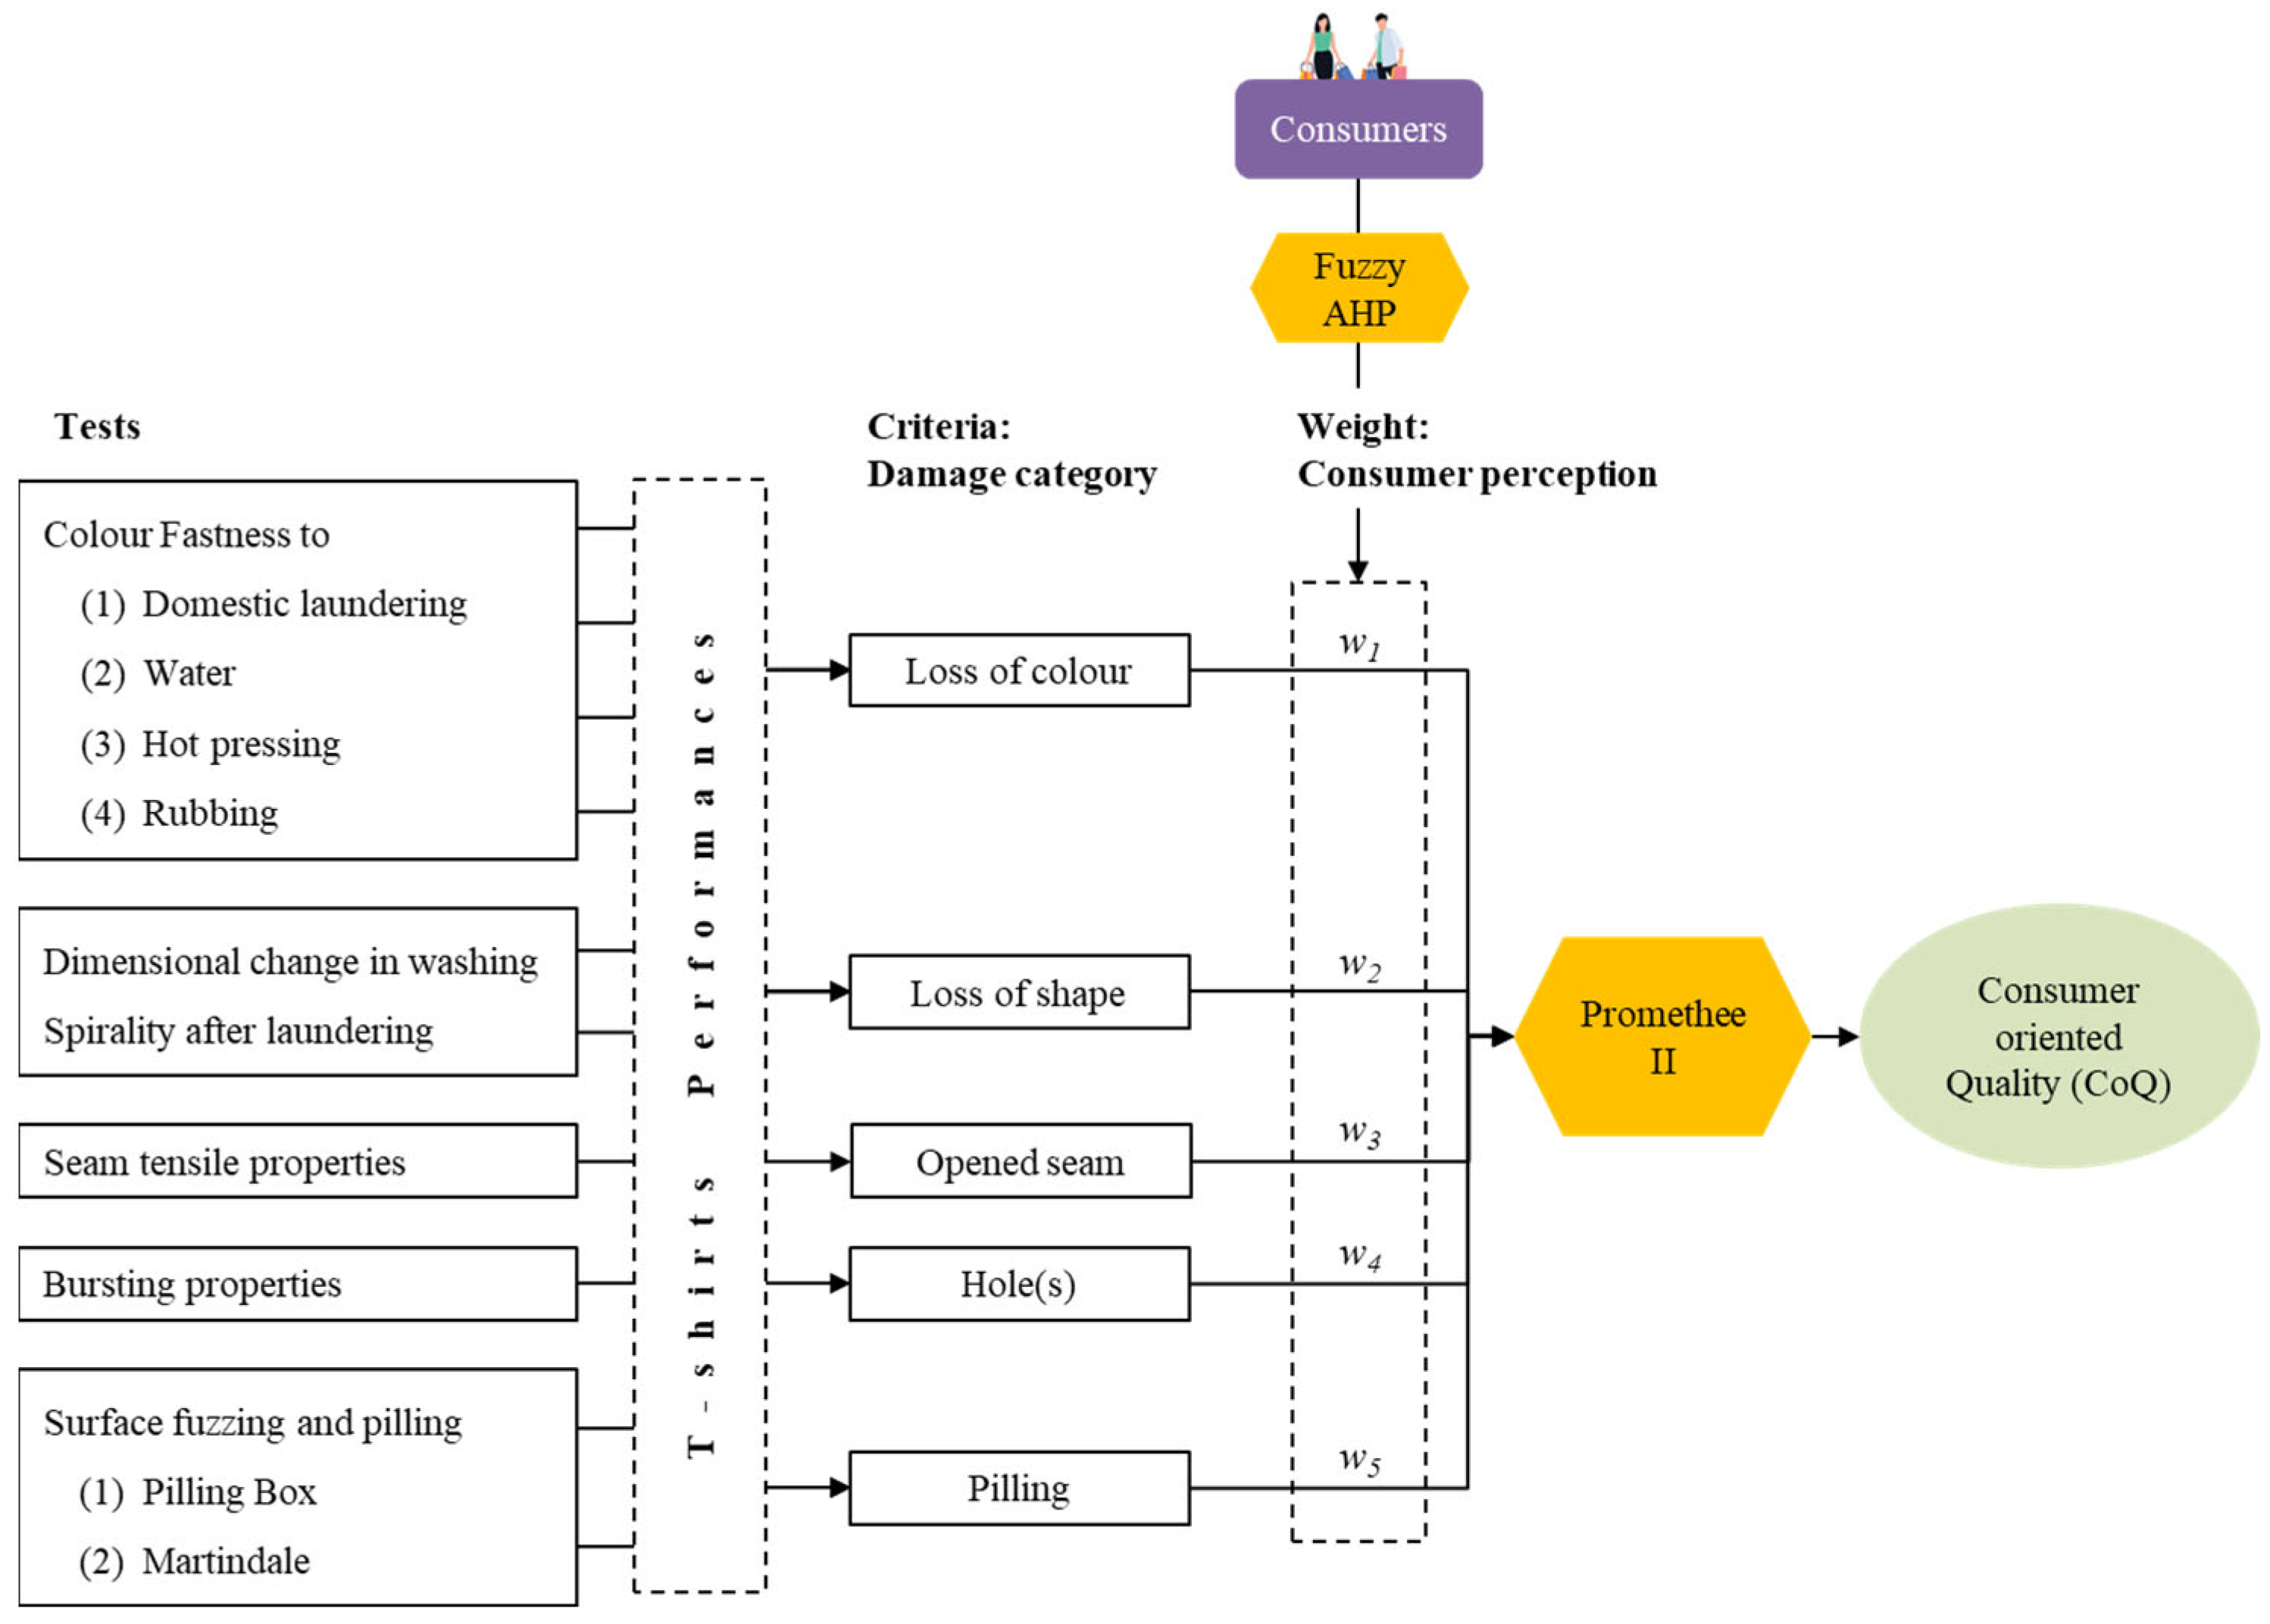
The proposed CoQ score aims at giving a better estimation of the clothing longevity from the knowledge of objective ageing factors. Such knowledge was extracted from an online consumer survey which dealt with the product-related ageing factors [41]. Consumers were asked whether specific damage (such as loss of color, loss of shape, pilling, etc.) influenced the decision to dispose of the item. In the T-shirt case, five damage categories involved in the disposal decision were suggested and weighted. By descending order of relevancy, these included the hole(s), the loss of shape, the opened seam, the loss of color and the pilling [41].
The investigated T-shirts’ longevity is strongly connected to their ability to resist these five stresses and to the relative importance of each in the disposal decision. It thus requires a specific laboratory test procedure that enables the T-shirts’ performances to be assessed. Since the objective is to reflect the product longevity, the tests’ selection was made to target the constraints of use. Clothing items are exposed to many varied physical and chemical stresses from the time they are manufactured to the time they are worn, dressed and laundered. Exposure to light, water and various mechanical or chemical stresses (rubbing, tensile stress, bending, sweat, deodorant, perfume, detergent, etc.) are all factors of alteration that contribute to the ageing of products. Based on our textile expertise, literature review [44,45,46,47,48,49] and companies’ standards, a short standards list was suggested to consider these conditions of use (Table 1).
The CoQ score is then computed from these performances according to the consumers’ perception of deterioration (Figure 2).

2.2. Collection of Manufacturing Parameters

As introduced, our proposed approach consists in combining the quality score (CoQ) with the manufacturing parameters. In order to obtain these manufacturing parameters for the considered products, a reverse engineering (RE) approach has been implemented.
RE aims at the understanding of how a product is built and how it works through the analysis of its structure and function. The process consists in the extraction of knowledge from a physical product without any technical details [50]. Different approaches are available [51]: material, geometrical, design, etc. and literature about computer aided reverse engineering is prolific. However, to the best of our knowledge, there is no specific RE process for fashion products identified in the literature. Thus, a multiscale approach is developed from the end-product to the fabric yarn. The fiber scale was deliberately left out of this study, since the reverse engineering approach is not suitable to get back to it. A number of attempts have been carried out, and it consists of extracting fibers individually by a manual process which is time-consuming and complicated for numerous yarns and products.
As introduced in Section 1, the manufacturing phases of textile products can be separated into two consecutive steps: the textile and the garment production. The textile production includes the fiber production and processing, the yarn and the fabric formation and the finishing [9]; it consists in the manufacturing of a finished panel of fabric. The garment production consists of cutting and sewing this panel into the final product [9]. Each process confers specific features to the end product. For instance, staple fibers are non-continuous fibers of relatively short length which are arranged in parallel, drafted and twisted together to finally form a long and continuous yarn [52]. Thus, a yarn could be thick or thin with varying degrees of resistance according to the intended application. Once the yarn is produced, it can be knitted. The knitting process consists in forming intermeshing loops (the stitches) called wales (loops counted horizontally) and courses (loops counted vertically) using needles [53]. The number of needles per inch is the gauge and describes the fineness of the fabric. A variety of structures also exists and enables the combination of forms and of textures and colors [53].
Based on such knowledges and on standards, the list of parameters in Table 2 is proposed. It corresponds to structural rather than process-oriented parameters. They have the advantage of being directly and reliably measurable.

2.3. Identification of Quality Contributors

Identifying the quality contributors consists in looking for relationships between testing, manufacturing and consumer data with a large number of variables. In this context, multivariate statistic methods are particularly suitable, especially for their ability to find and quantify the most relevant features between heterogeneous data. Multivariate statistics deals with variables observation and offers appropriated methods for identification problems [63]. Among these methods, Principal Component Analysis (PCA) is the most appropriate to deal with quantitative data. The principle of PCA is the dimension reduction in a dataset while retaining maximum informative value of the input data. Thus, it summarizes the information of a huge dataset of correlated variables in a few pseudo variables called Principal Components (PCs) that are not correlated [35,64,65,66].

2.4. Case Study: T-Shirt

The proposed methodology was implemented on 29 T-shirts bought in stores of different retailers during 2018. Three raw materials (cotton, polyester and flax) were considered according to their percentage breakdown in the European clothing consumption [9,67]. T-shirts were selected to encompass both the fields of manufacturing and quality perception. All were tested and reverse engineered to collect their performances and manufacturing parameters. In the following, the collected data, the CoQ score, and the manufacturing parameters are discussed.

3. Results

In this section, the proposed methodology is implemented in the case of the T-shirt. First, the consumer interest in an overall quality score computation is highlighted (Section 3.1). Then, a brief population overview is proposed before to provide deeper details at the yarn, fabric and machine scales (Section 3.2.1, Section 3.2.2, Section 3.2.3 and Section 3.2.4 respectively). Finally, Section 3.3 deals with the implementation of the PCA for the identification of the critical quality contributors.

3.1. Computed Consumer-Oriented Quality Score

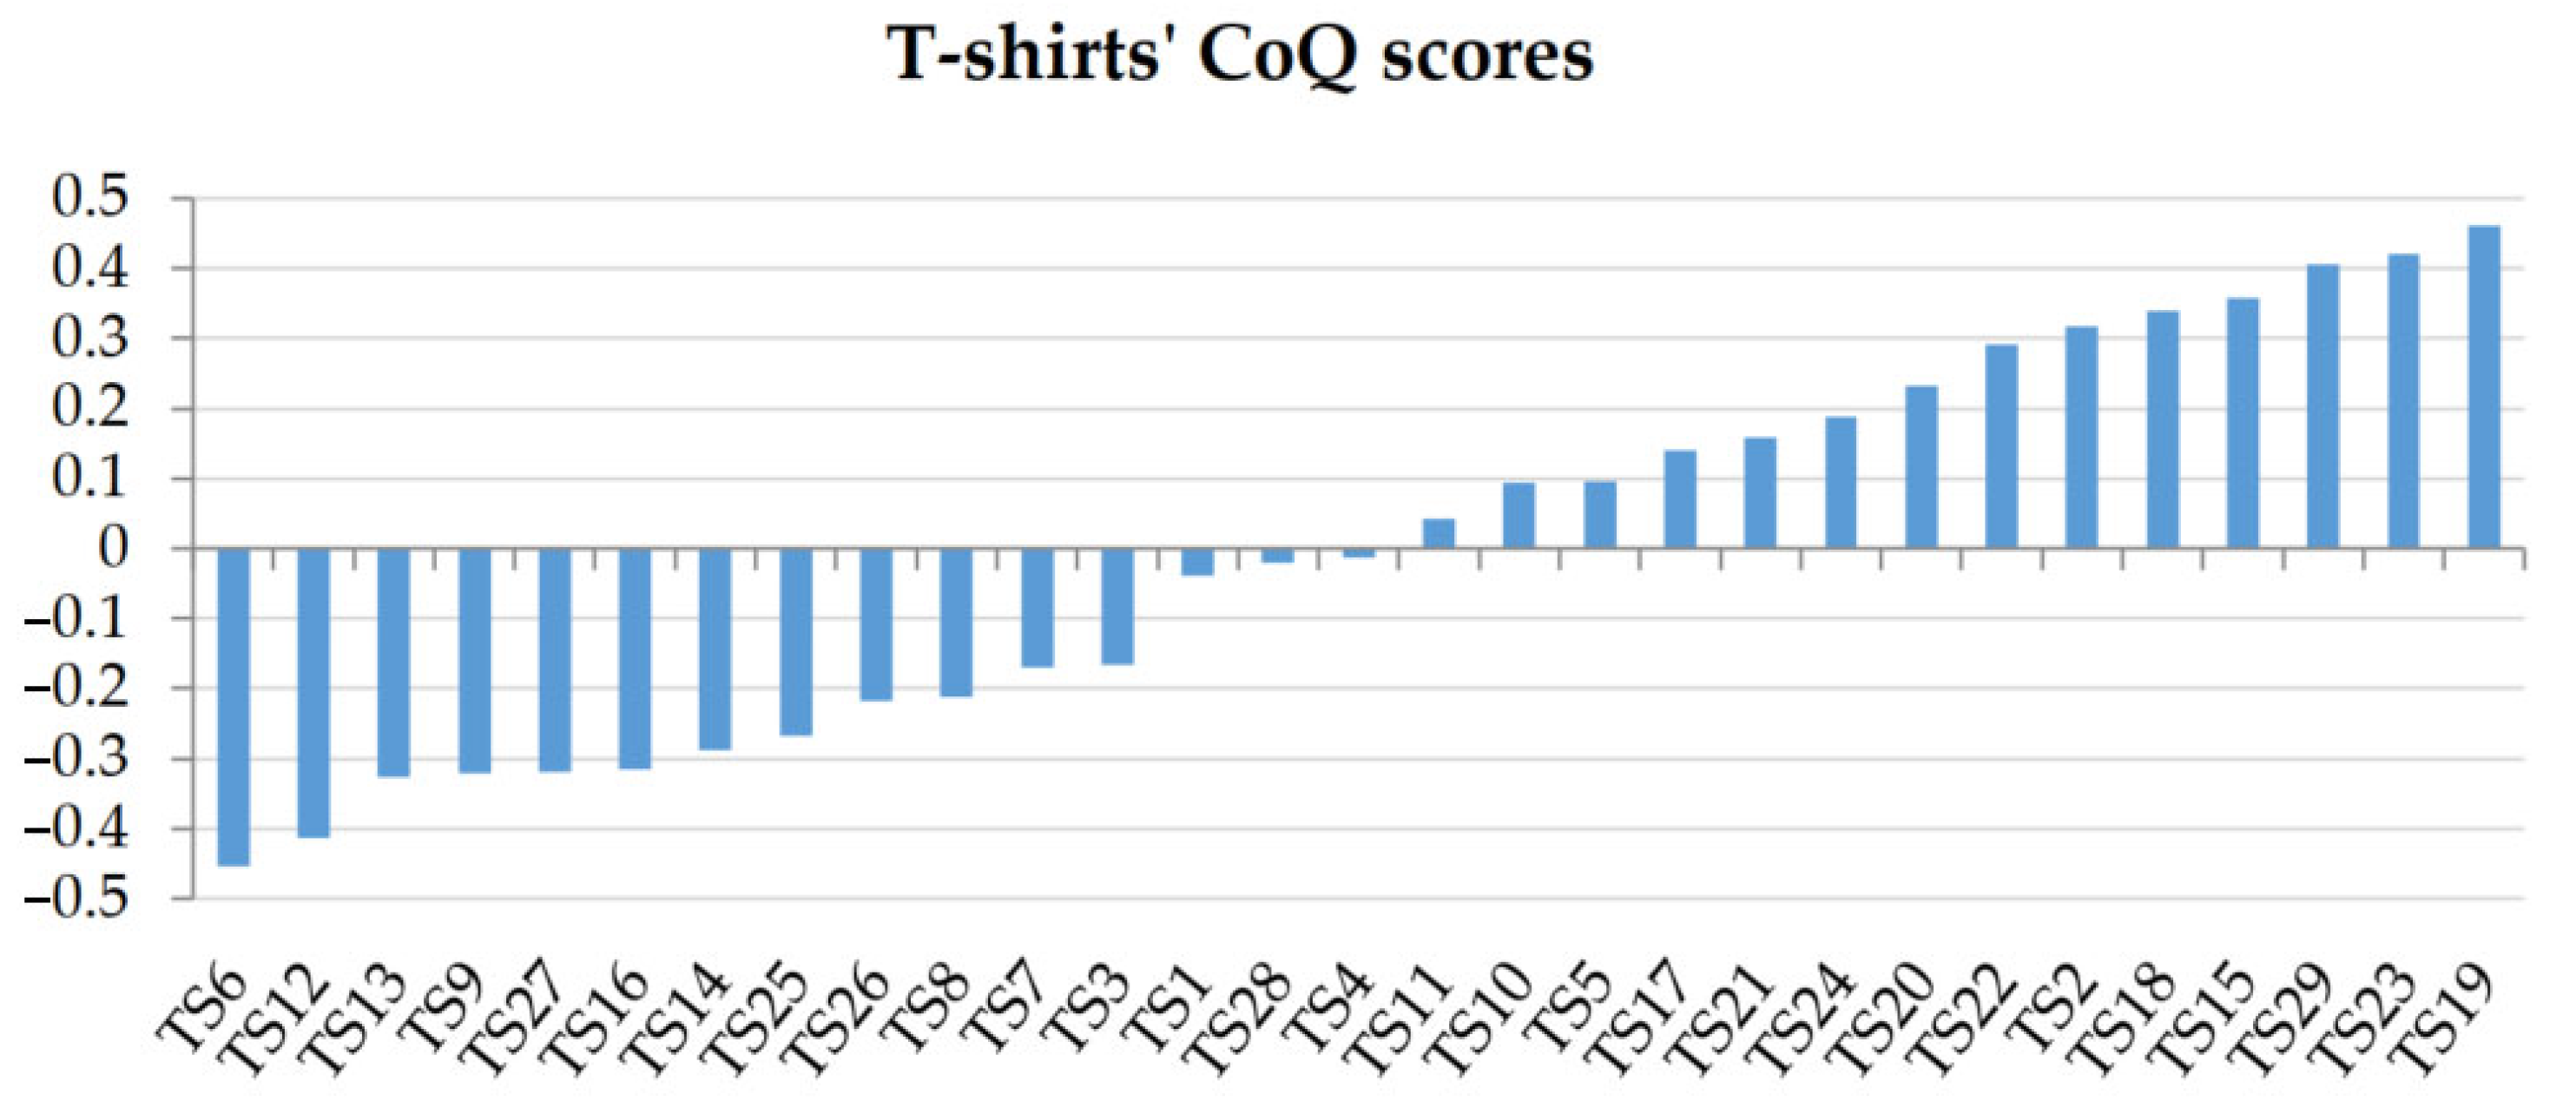
The implementation of the laboratory tests procedure enabled the definition of the T-shirt’s performances for each specific quality and the computation of the CoQ score. The CoQ score was computed using the PROMETHEE II method (Preference Ranking Organization Method for Enrichment Evaluations), which is a complete ranking method [68,69]. T-shirts are thus scored and ranked following their overall quality. For each T-shirt (here referred to as TS from 1 to 29), the CoQ score value is obtained by the computed net flow, where the highest value corresponds to the best quality (Figure 3).
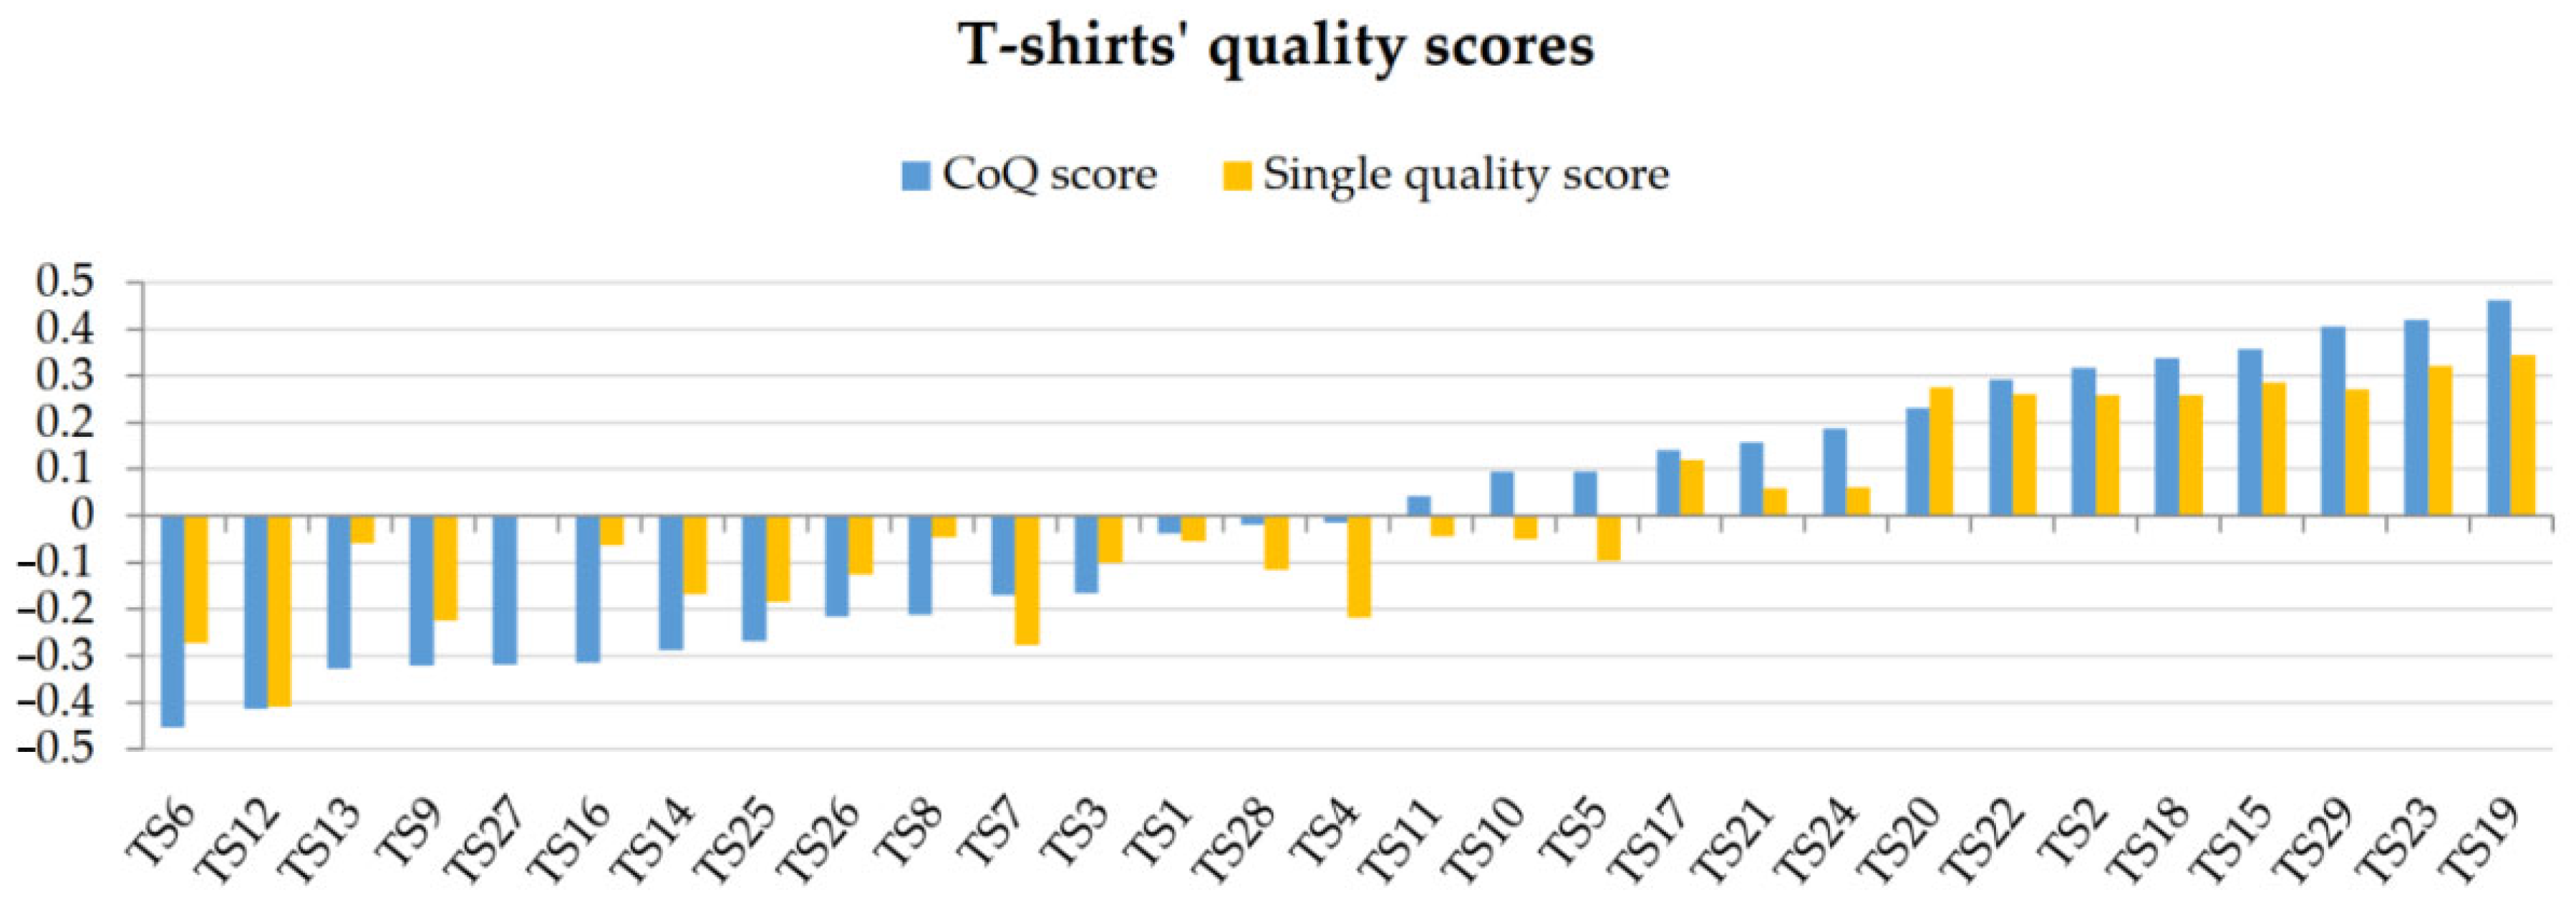
The main contribution of our proposal is that the CoQ score includes consumer knowledge. In order to quantify the impact of this integration, these results (Figure 3) were compared with a single quality score that was also computed through PROMETHEE II without weighting the performances with the consumer perception (Figure 4).
Such a comparison highlights significant results discrepancies. The scores obtained with and without the consumer integration differ significantly for some T-shirts (e.g., TS4, TS13 and TS27) and involve substantial modification of the ranking. The CoQ score also offers a wider range of values and thus allows a greater products distinction. Thus, we can conclude that the consumer awareness has a non-negligible influence and should provide a better understanding of a “perceived quality” by appropriately weighing the strengths and weaknesses of products.

3.2. Manufacturing and Structural Parameters

Following the process suggested in Table 2, the 29 T-shirts were reverse engineered. In Section 3.2.1 a brief population overview is proposed, and then the Section 3.2.2, Section 3.2.3 and Section 3.2.4 provide deeper details at the yarn, fabric and machine scales, respectively.

3.2.1. T-Shirts Population: An Overview

Table 3 presents the distribution of the T-shirts’ features according to composition, structure and processes. Some elements clearly emerge as very typical of the T-shirt design: ring spinning and weft knitting are the main manufacturing processes, and jersey is the most knitted structure.

3.2.2. Fabric Yarn

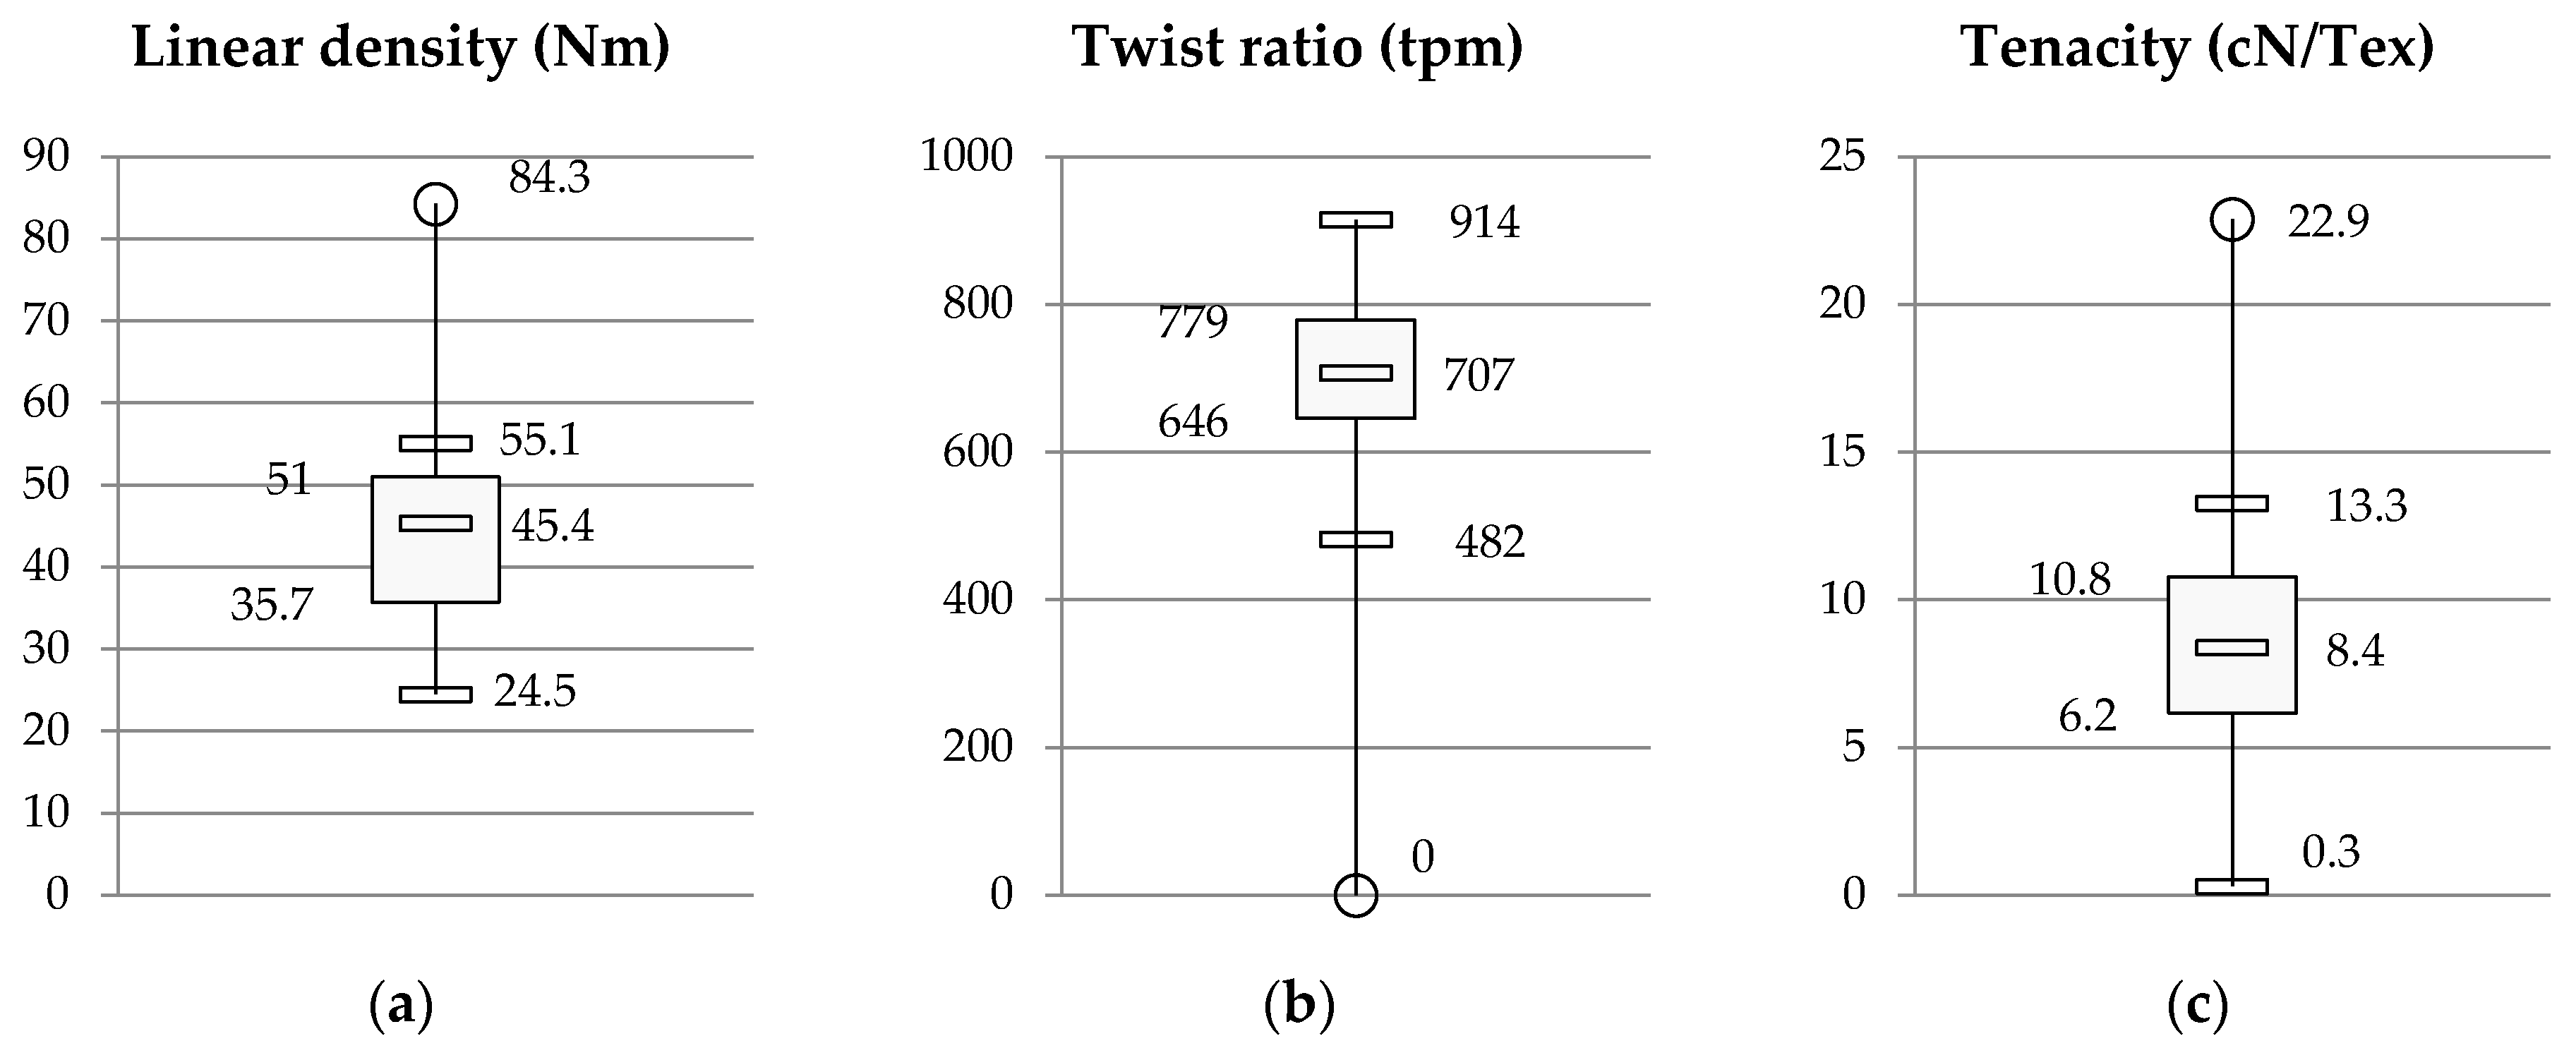
In this section, characteristics of the fabrics’ yarns are presented with the aim of appreciating the range and diversity of each attribute. Thus, the results are presented in box plot form. Figure 5a–c illustrate the obtained linear density, twist ratios and tenacity, respectively. The range of linear density varies from 24 Nm to 84 Nm. The low values, corresponding to the thicker yarn, are from flax wet spun yarns, the upper outlier, represented by the circle, corresponds to a polyester multifilament yarn. In between, cotton and polyester are equally represented. The box plot reveals a left-skewed distribution, meaning that there is less dispersion between 45 and 55 Nm. The twist ratio’s distribution varies from 482 to 915 tr/m with a median of 710 tr/m. The outlier corresponds to the above-mentioned multifilament yarn, which has no torsion. The low values also come from flax products. Finally, tenacity’s values go from 0.3 to 22.9 cN/Tex. Weak yarns were observed independently of the composition, and the minimum value was obtained with the multifilament yarn, since its twist-free nature does not allow any mechanical strength. The higher values were obtained from polyester and flax yarns, with 22.9 and 18 cN/Tex respectively, while the maximum value from cotton is 13 cN/Tex. The median value is 8.3 cN/Tex, which is more representative of cotton.

3.2.3. Main Fabric

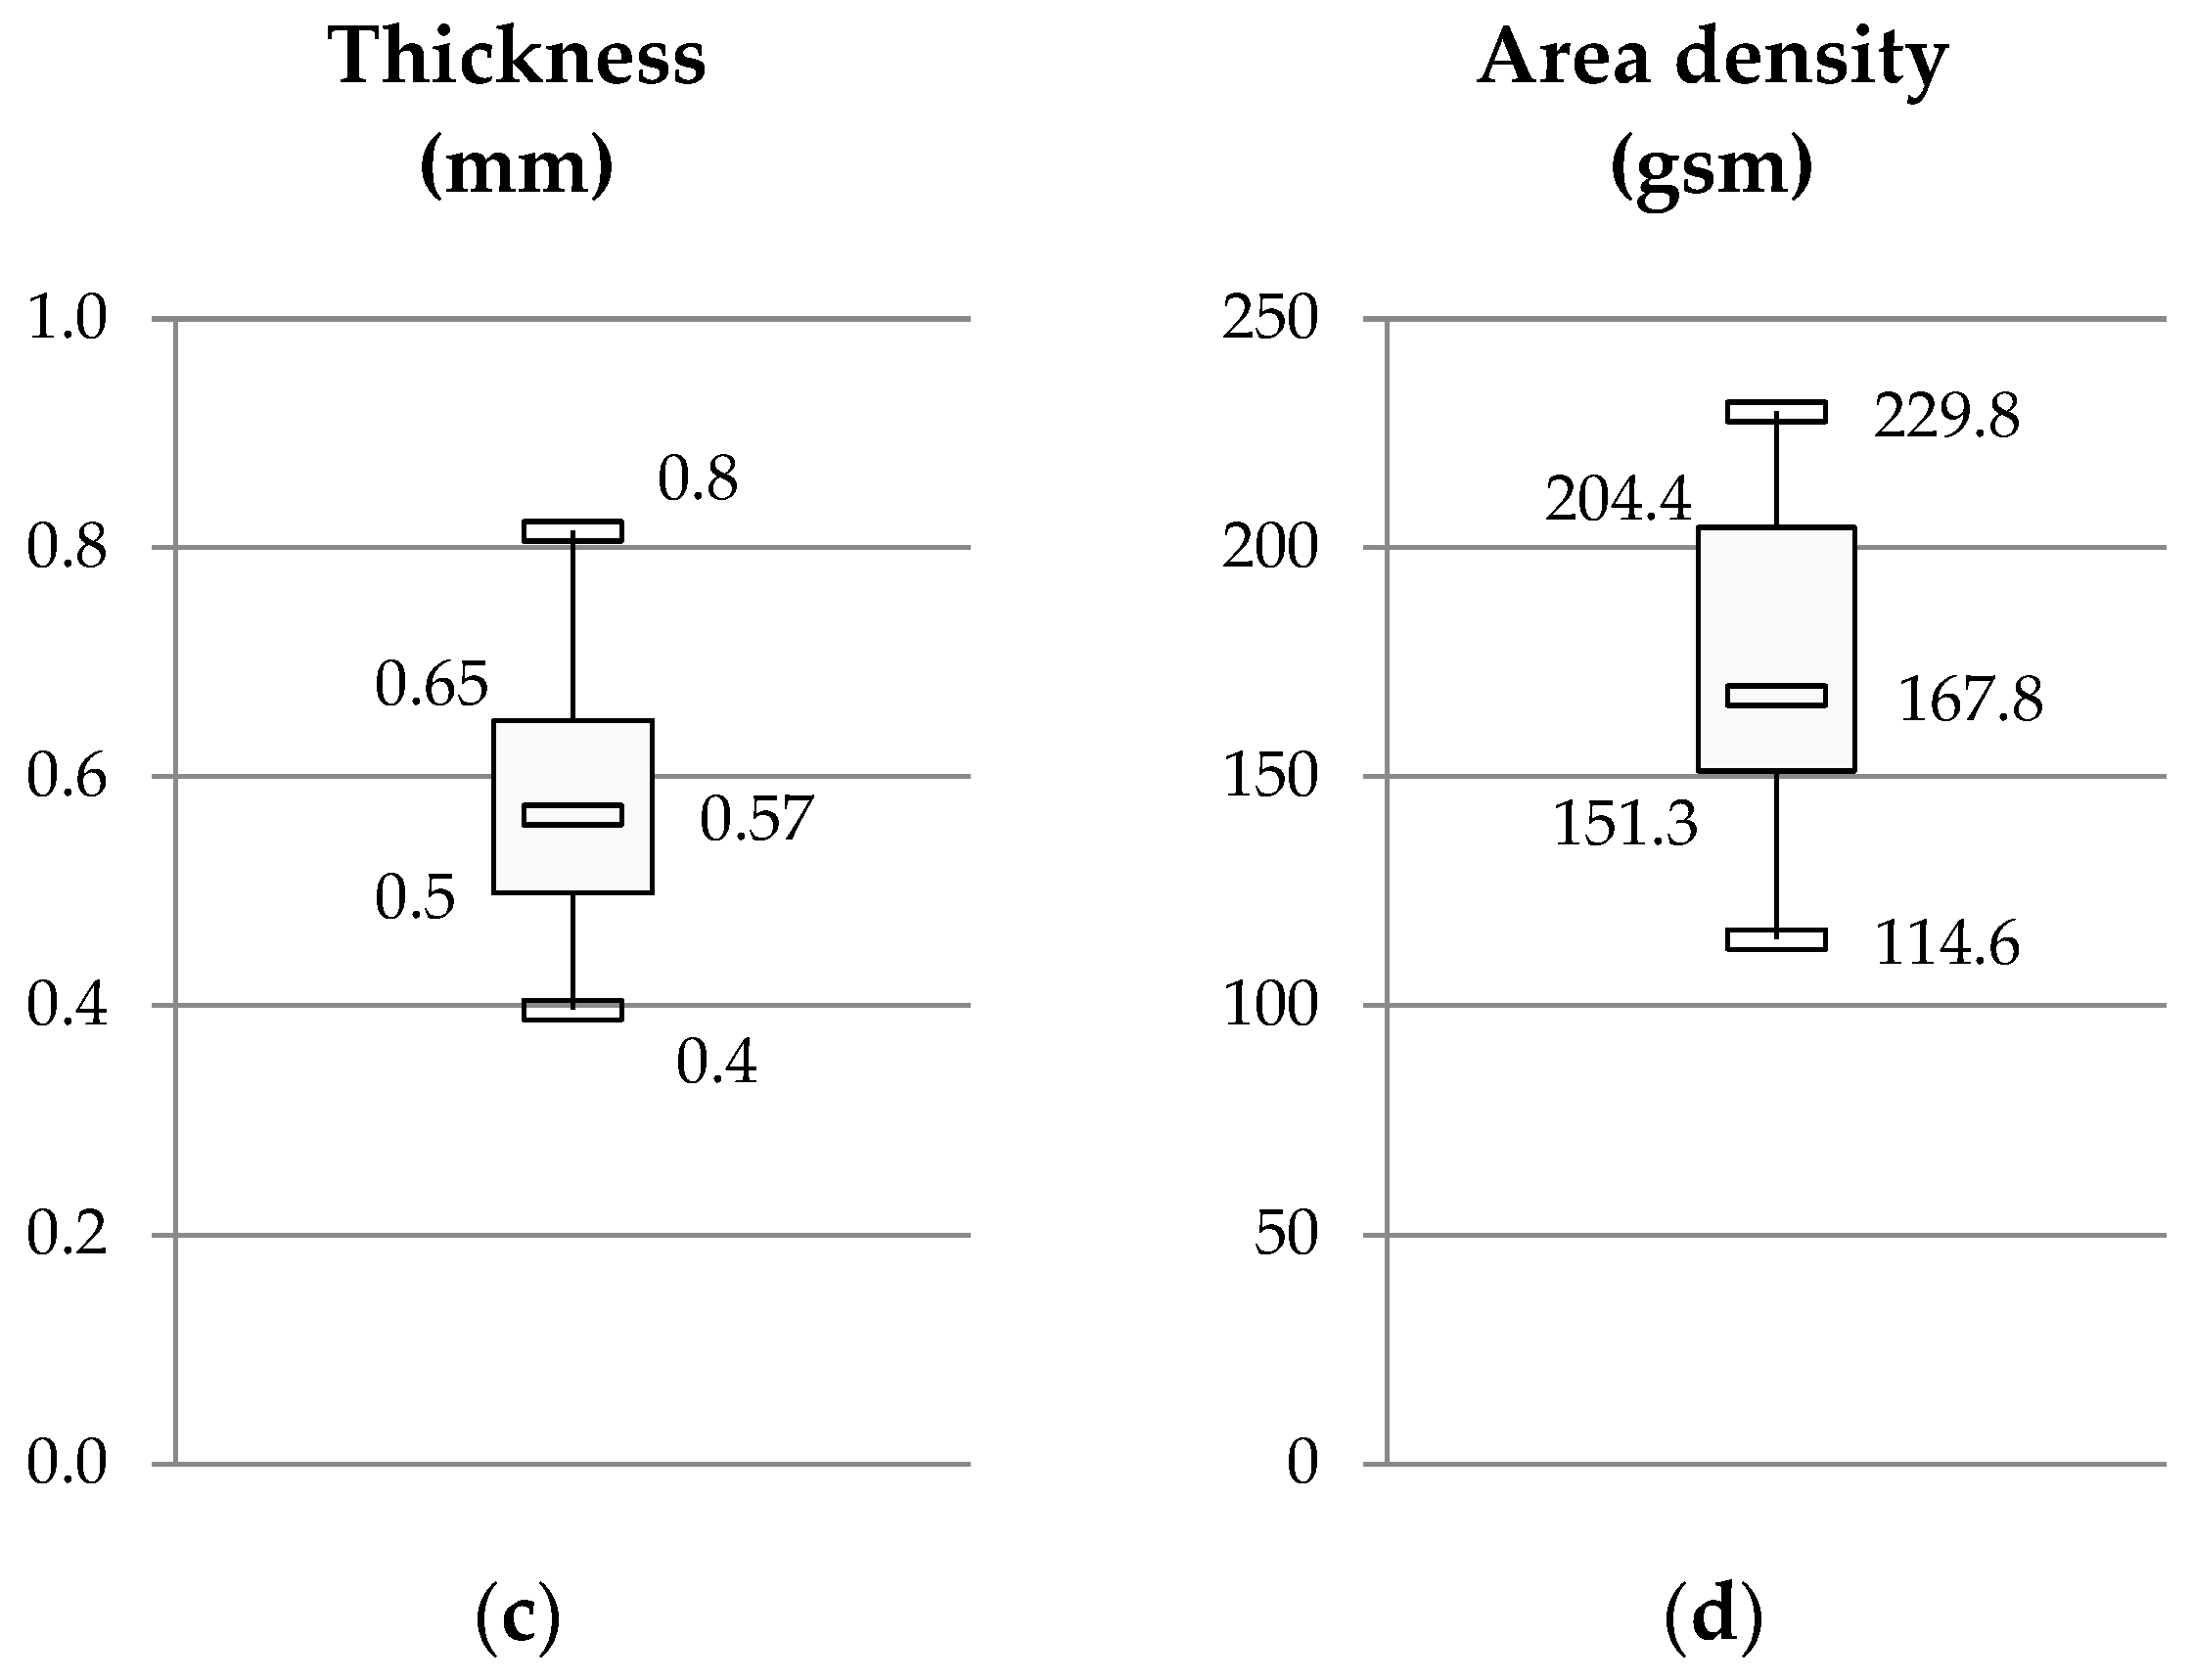
In this section, a focus is on the main fabric attributes. Figure 6a–d illustrate the stitches’ density, stitch length, thickness and area density. Stitches’ density lowest values come from flax products being the most opened structures; therefore, they have higher yarn consumption per loop. Compact structures independently come from cotton and polyester T-shirts. The stitches density varies from 750 to 2700 spi2, the highest value, which comes from a polyester product and corresponds to the minimum stitch length. Since stitches density and stitch length are partially and inversely correlated, opposite skewness is observed. The dispersion of stitch length is smaller than the stitches density’s one, varying from 0.24 to 0.55 cm/loop and mainly from 0.24 to 0.32 cm/loop. The upper values, from 0.4 to 0.55 cm/loop, come from flax and ribbed cotton T-shirts. Although it partially relies on linear density, these T-shirts are also thicker and heavier. Thickness varies from 0.4 to 0.8 mm with a median value of 0.57 mm and area density from 115 to 230 g/m2, with a median of 168 g/m2.

3.2.4. Machine Parameters

Starting from the end-product, finding all of the machine parameters is complex. However, machine parameters influence fabric attributes, and it therefore appears useful to consider this scale too. Models exist, but they are neither exhaustive nor systematically suitable. Since Ucar et al. [57] developed a model for cotton knitted fabrics, the machine gauge could be computed to obtain the distribution in Figure 7. Being associated to a range of linear density, the dispersion is narrow, with a median value of 28 needles per inch.

3.3. Identification of Critical Quality Contributors

The identification of the relationship between the manufacturing and structural parameters and the CoQ score relies on a PCA. The PCA method is implemented following a two steps process: the first involves the selection of the variables and the second involves the validation of the results.

3.3.1. Variables Selection

For an easier understanding and analysis of the results, it is recommended to perform the PCA on numerical and uncorrelated data. Thus, a pre-treatment of the obtained data is required to select the most suitable dataset.
First, the variables which are qualitative or which do not provide differing information are not considered in the PCA:
  • the yarn and fabric manufacturing processes, which are both qualitative;
  • structure, which is qualitative and implied in the stitch length;
  • the direction of twist, which is identical for all yarns (Z twist direction was found);
  • the number of single yarns twisted together, which is also identical for all.
To highlight whether strong correlations exist, the Pearson correlation coefficients (Table 4) were calculated for the remaining variables. The stitches, the wales and courses densities are some fabric features which depend on the knitting parameters, and they logically correlated with each other. Thus, only the stitches density and the gauge are considered, and both provide information at the fabric and machine scales.
The parameters finally selected were related to fabric yarn (linear density, twist ratio, and tenacity), to seam density, to main fabric (stitches density, stitch length, thickness and area density), to knitting machine (gauge), and to quality.
To discuss the contribution of the CoQ score in this methodology, we propose two versions of the PCA, the first one includes the whole T-shirts’ test performances and the second one replaces this set of measures with the CoQ score. In both cases, the variables of the twenty-nine T-shirts were processed in PCA.

3.3.2. Validation of the PCA Process

In data analysis, it is important to check if the method is suitable to deal with the considered dataset. Thus, a KMO measure and a Barlett’s p-value test of sphericity were undertaken on our data [66,70,71].
The obtained results of 0.58 and 0.73, respectively, for the KMO and of 2 × 10⁻²² (<0.05) for the p value demonstrate that the PCA method is appropriate for our dataset. Thus, PCA is implemented on normalized data using R software.

3.3.3. Interpretation

The two first Principal Components (PC1, PC2) obtained with the PCA enable the total variance to be explained at:
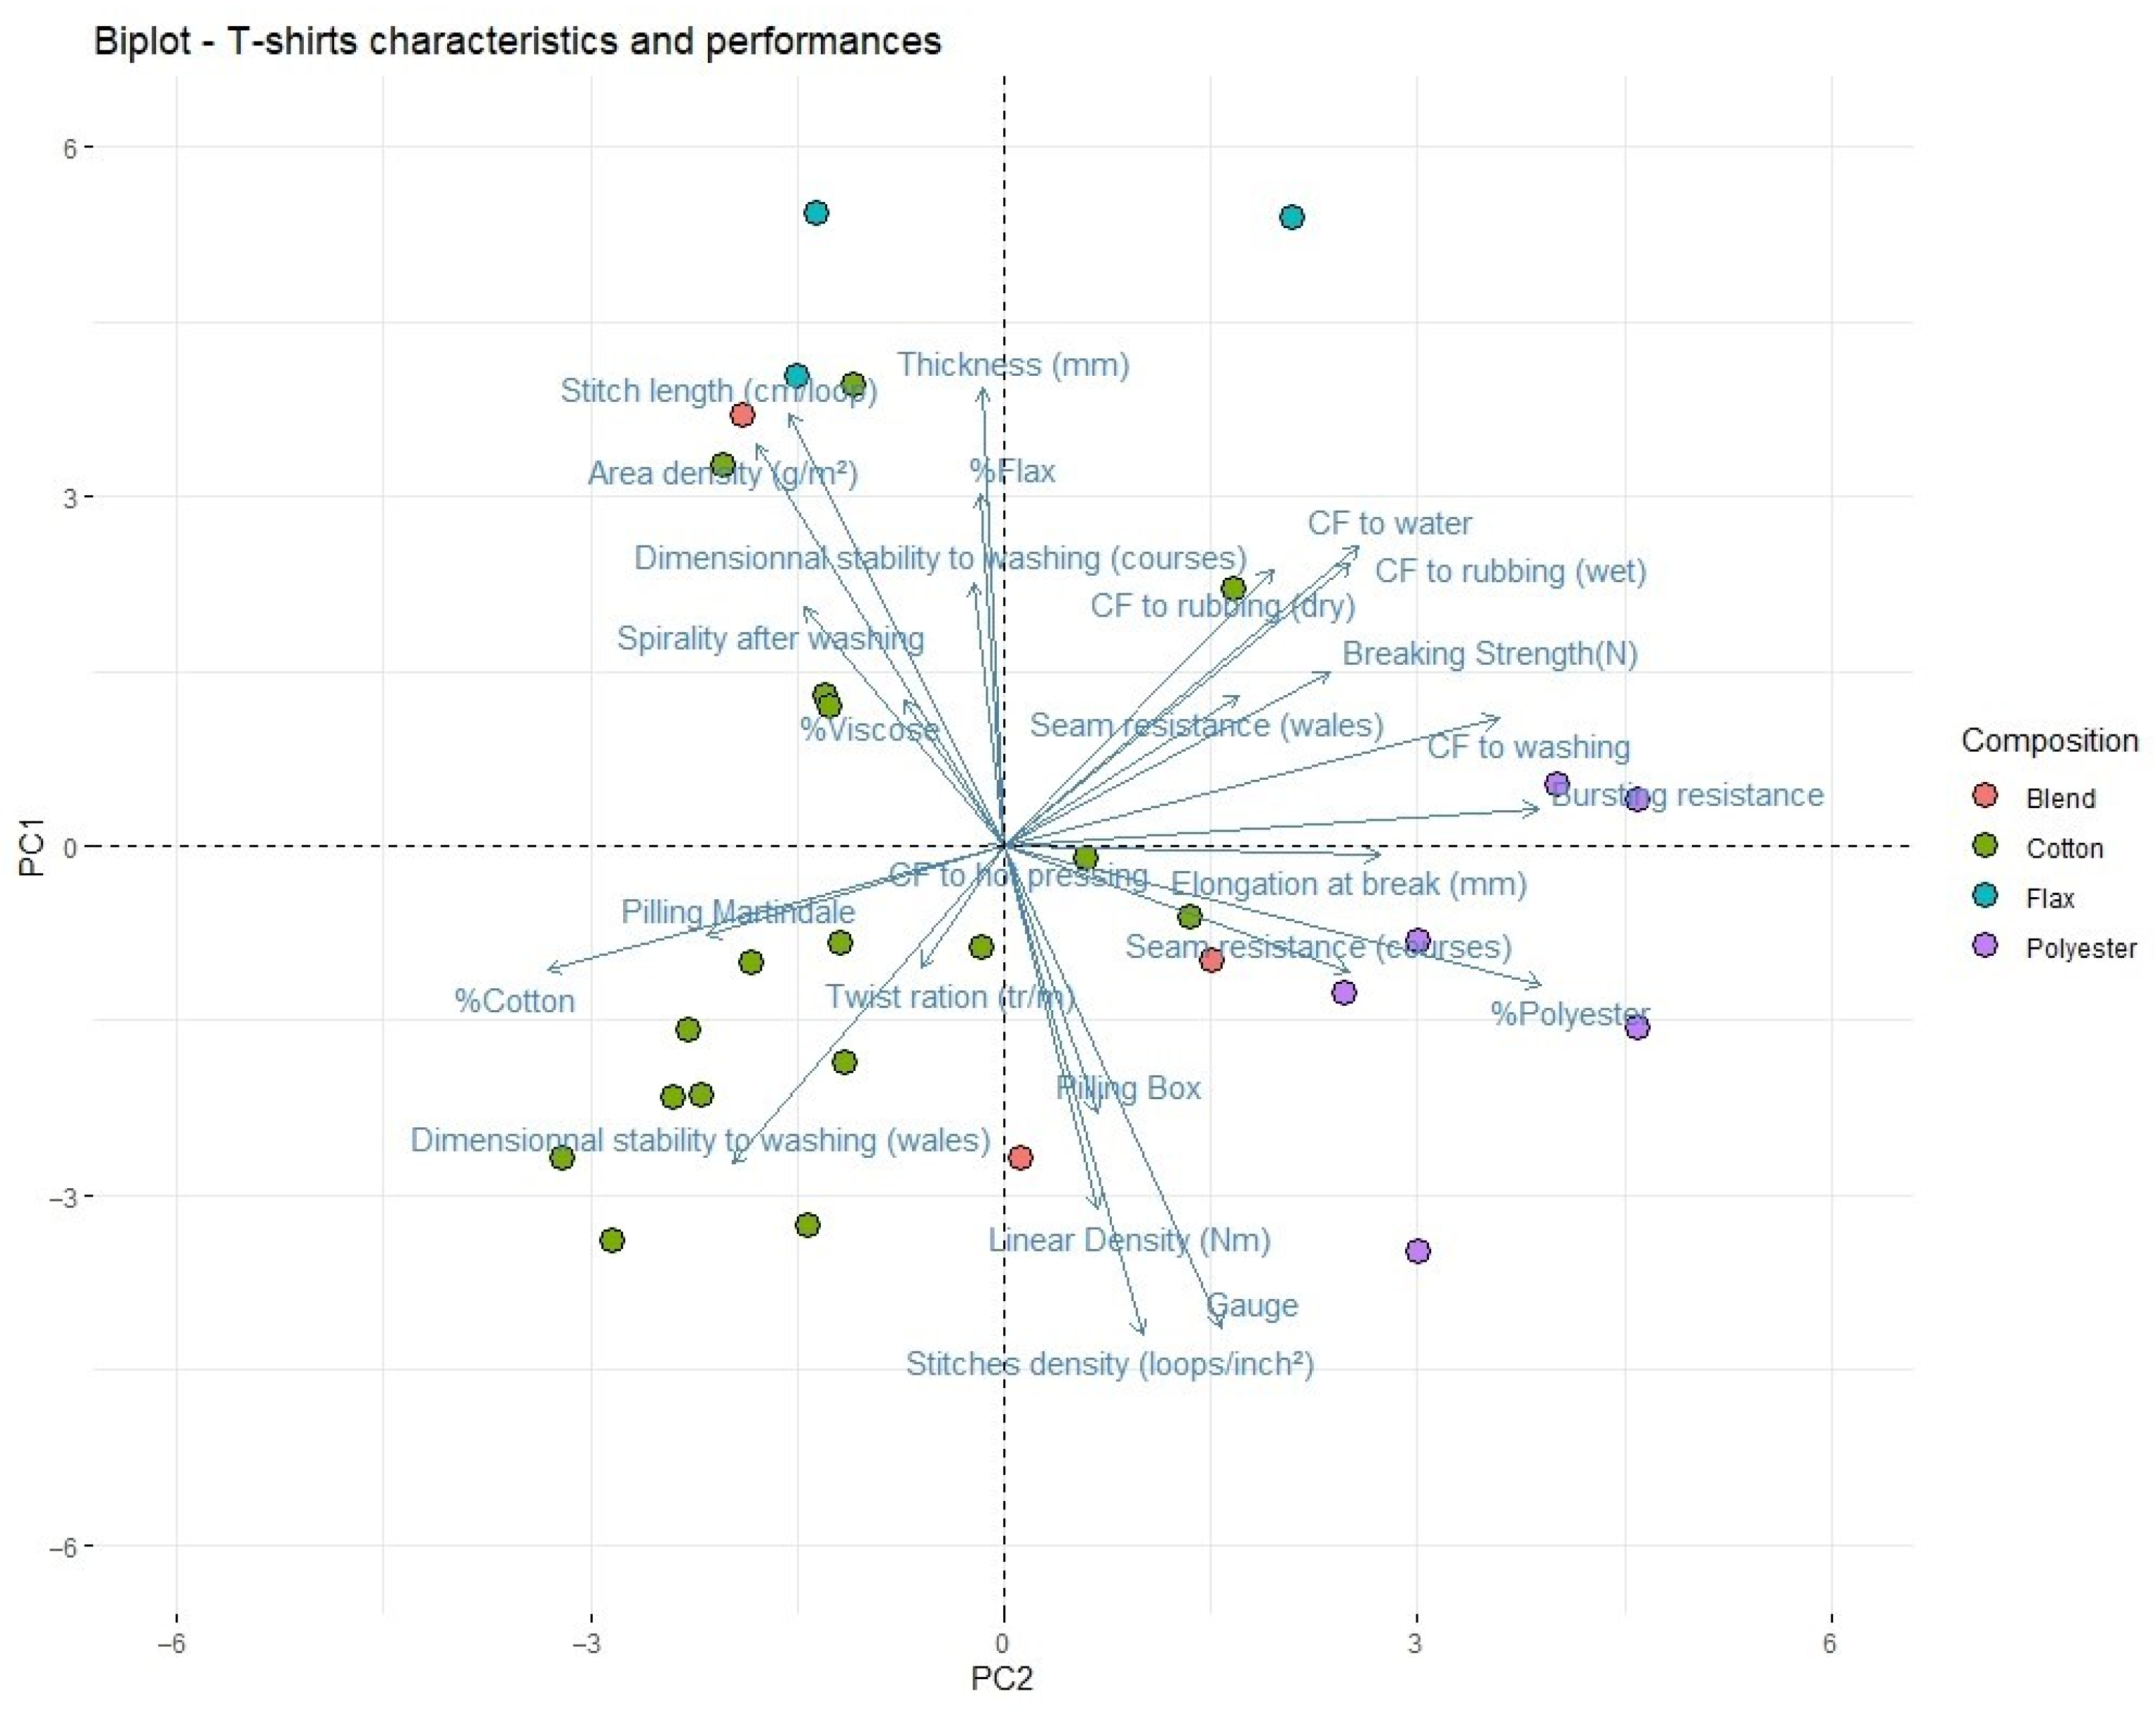
  • 45.9% considering the whole set of test measurements (Figure 8);
  • 60.9% considering the use of the single CoQ score (Figure 9).
The relations between the first two PCs and the dataset features can be seen in Figure 8 and Figure 9, respectively. Each variable is represented by a vector whose coordinates are the projection on the two PCs.
In both cases, the x-axis, PC1, seems to be related to composition, as the cotton and polyester percentage are relatively well established on the axis. However, it also appears that mechanical performances such as bursting resistance (Figure 8) or yarn tenacity and elongation at break (Figure 9) are well represented. The y-axis, PC2, only appears to be correlated with the gauge, the stitches’ density, the area density, the thickness and the stitch length, and tend to represent the fabric’s structures.
The T-shirts are represented by colored dots according to their composition. In both representations, some composition-based clusters appear. Only the blended T-shirts are spread out according to their percentage of cotton. These representations also demonstrate important characteristics of the T-shirts:
  • Statistically, the cotton products seem not to be related to any structural parameters. However, being the most represented category and with a wide range of characteristics, no obvious observations appear.
  • The polyester products are knitted on the finest gauges and consequently are thinner and the denser. Combined with a high yarn tenacity and elongation at break, the polyester products appear to be the most resistant to bursting.
  • The flax products are made from the thicker yarns and represent the highest values of area density and thickness. One of them presents a good yarn tenacity, however, due to technical limits they are also characterized by low stitches density values, which transcribes an opened structure.
However, with more than ten independent performances to consider, the Figure 8 does not clearly highlight the most relevant features of the products to obtain an overall quality.
The CoQ score-based PCA (Figure 9) enables strong correlation to be identified. The consumer-oriented quality score (CoQ Score) appears to be strongly correlated with the yarn tenacity and elongation at break. Since polyester yarns performed well in these two categories, it suggests that the polyester composition was related to the CoQ score. Consequently, it can be stated that the quality of the end-product not only comes from its fabric structure but also the yarn features and more specifically its tenacity and elongation potential.

4. Discussion

The yarn tenacity and elongation appear highly correlated to the consumer-oriented quality score. Previous works have demonstrated that loss of shape and holes were the most critical damage leading to the disposal decision [41]. Thus, the high correlation between the CoQ score and a mechanical-related strength, such as the yarn tenacity, confirms our expectations. To go further, we should also notice that while the flax and the polyester structures are both high tenacity fibers [72], the flax and polyester T-shirts present highly contrasted performances and CoQ scores. A difference comes from the huge gap in the stitches’ density: the stitches’ density of a polyester T-shirt is twice that of flax and offers more friction points, which helps the structure to resist mechanical stresses [73]. Based on these observations, a high tenacity yarn with good elongation capacity and a dense structure appear as the most significant parameters contributing to the consumer-oriented quality. To design a textile for longevity, the operational implementation of these features in the manufacturing process requires the use of long and/or high tenacity fibers [74], the highest possible gauge (according to linear density), and a small stitch length to increase the tightness. Such results confirm and complement those of previous studies, which focused on spirality and concluded that a high stitches density preserves the fabric shape [75,76,77]. The knitting process should also not involve a high number of feeders and, on a circular machine, the direction of rotation should take into account the yarn’s direction of twist to avoid spirality [75].
However, these recommendations emerge from a limited T-shirts population. A wider variety of raw materials and technologies is available. Thus, an appropriated selection based on materials or manufacturing processes could be relevant for a better reliability of the analysis. Some material clusters seem to arise on the introduced bi-plot (Figure 9) and could be confirmed through a wider investigation. Furthermore, it has to be stressed that these findings are not suitable for all product categories (i.e., shirts, jackets, pants…). They reflect the expected improvements for a T-shirt as a knitted product facing five weighted stresses. Therefore, these results cannot be representative for woven or functionalized products, for which the expectations would be different.
In addition, the quality contributors are investigated based on the CoQ score, i.e., from the product quality and the consumer perception. Based on He et al. [40], upstream perspectives could be considered such as the marketing and competitive requirements of the enterprises and the design requirements of engineers. In such a case the output quality should be polymorphous and could better transcribe aspects such as reliability, safety, durability, economic ability, and aesthetic properties. Also, to enrich the consumer consideration, kinesthetic and emotional values, which are part of the design process [78], could be added to the “rational” values considered in our current study. It also could enable products to be distinguished according to their purpose.
Considering that product quality and lifespan consistently influence the environmental impact evaluation, these recommendations could help to improve life cycle assessment (LCA). Indeed, the environmental effects of short and long lifespan products mainly result from sensitivity analysis and do not take into account changes in the manufacturing processes [12,15]. However, De Saxcé et al. [19] demonstrated how assigning a specific lifespan to the corresponding manufacturing chain is essential. The highlighted parameters could guide the development of appropriated life cycle inventories (LCI) to improve the LCA of long lifespan products and complement the results of Allwood et al. [79], which highlight the additional environmental impacts that the manufacturing of such products could generate.

5. Conclusions

In this study, a new methodology to support design for longevity of textile material is proposed. Our approach relies on the investigation of relationships between the manufacturing and structural parameters of products and a consumer-oriented quality (CoQ) score. Such a CoQ score, developed first in a preliminary study, aims to evaluate clothing longevity. It is a single product- and consumer-dependent index which enables multiple textile qualities to be aggregated according to the significance that the consumer attaches to them. This CoQ score is then combined in a PCA to manufacturing and structural parameters that were collected through a multiscale reverse engineering process. In order to obtain the technical information of the market product, reverse engineering is conducted. It consists of extracting the knowledge of its manufacturing process from a physical product. Thus, a multiscale approach is developed including the end-product, the fabric and the yarn. Eighteen parameters, both quantitative and qualitative, are considered. Finally, the identified quality contributors result from process, product and consumer data and thus aim to better integrate the users’ needs and perceptions into design for longevity strategies.
The proposed methodology was implemented on 29 T-shirts. In this case study, nine structural and manufacturing parameters were combined to the CoQ score in PCA. Mechanical-related strengths result as the main quality contributors, and the analysis reveals that a high tenacity yarn with good elongation capacity and a tight structure provides a better CoQ score. These results are consistent with the computed consumers’ perception to deterioration, which highlights mechanical-related damage as the most significant. The practical implementation of these features requires the use of long and/or high tenacity fibers, the highest possible gauge (according to linear density), and a small stitch length to increase the tightness.
Finally, as a perspective, it should be appropriate to consider more materials and manufacturing processes to improve the relevancy and the reliability of this study. The textile sector is complex, diversified and offers plenty of solutions to produce “equivalent” products. Thus, to go further, environmental impact assessments should be associated with the study’s conclusions to evaluate the potential environmental benefits. Additionally, it could be of major interest to add complementary and intangible considerations to take perceived quality into account. As it is a complex concept, the enrichment could be polymorphous and include aspects such as reliability, safety, economic ability, and aesthetic properties.

Author Contributions

Conceptualization, R.B., S.T., L.K. and A.P.; methodology, R.B., S.T., L.K. and A.P.; software, R.B., S.T. and L.K.; validation, R.B., S.T., L.K. and A.P.; formal analysis, R.B., S.T., L.K. and A.P.; investigation, R.B., S.T., L.K. and A.P.; resources, R.B., S.T., L.K. and A.P.; data curation, R.B.; writing—original draft preparation, R.B., S.T., L.K. and A.P.; writing—review and editing, R.B., S.T., L.K. and A.P.; visualization, R.B., S.T., L.K. and A.P.; supervision, S.T., L.K. and A.P.; project administration, S.T., L.K. and A.P.; funding acquisition, S.T., L.K. and A.P. All authors have read and agreed to the published version of the manuscript.

Funding

This research was funded by the French Region Hauts-de-France and EcoTLC (Refashion). Its publication is supported by the EcyTwin project, the Interreg V FWVL program and the FEDER.

Institutional Review Board Statement

Not applicable.

Informed Consent Statement

Not applicable.

Data Availability Statement

Not applicable.

Conflicts of Interest

The authors declare that they have no conflict of interest.

References

  1. UNEP. UN Alliance For Sustainable Fashion Addresses Damage of ‘Fast Fashion’. 2019. Available online: https://www.unenvironment.org/news-and-stories/press-release/un-alliance-sustainable-fashion-addresses-damage-fast-fashion (accessed on 17 March 2020).
  2. UNEP. UN Launches Drive to Highlight Environmental Cost of Staying Fashionable. 2019. Available online: https://news.un.org/en/story/2019/03/1035161 (accessed on 17 March 2020).
  3. Niinimäki, K.; Peters, G.; Dahlbo, H.; Perry, P.; Rissanen, T.; Gwilt, A. The environmental price of fast fashion. Nat. Rev. Earth Environ. 2020, 1, 189–200. [Google Scholar] [CrossRef] [Green Version]
  4. Quantis. Measuring Fashion: Environmental Impact of the Global Apparel and Footwear Industries Study; Quantis: Lausanne, Switzerland, 2018. [Google Scholar]
  5. Boucher, J.; Friot, D. Microplastiques Primaires Dans les Océans: Évaluation Mondiale des Sources; UICN: Gland, Switzerland, 2020. [Google Scholar]
  6. Herrmann, S. A New Textiles Economy: Redesigning Fashion’s Future. Ellen MacArthur Foundation, Rapport, 150. 2017. Available online: http://www.ellenmacarthurfoundation.org/publications (accessed on 17 March 2020).
  7. Anguelov, N. The Dirty Side of the Garment Industry. Fast Fashion and Its Negative Impact on Environment and Society; CRC Press: Boca Raton, FL, USA, 2015. [Google Scholar]
  8. Remy, N.; Speelman, E.; Swartz, S. Style That’s Sustainable: A New Fast-Fashion Formula; McKinsey & Company: New York, NY, USA, 2016; Available online: https://www.mckinsey.com/business-functions/sustainability/our-insights/style-thats-sustainable-a-new-fast-fashion-formula (accessed on 17 March 2020).
  9. Beton, A.; Dias, D.; Farrant, L.; Gibon, T.; Le Guern, Y.; Desaxce, M.; Perwuelz, A.; Boufateh, I. Environmental Improvement Potential of Textiles (IMPRO-Textiles); Wolf, O., Kougoullis, J., Cordella, M., Dodd, N., Eds.; JRC Scientific And Policy Reports; European Commission: Brussels, Belgium, 2014. [Google Scholar]
  10. Cotton Incorporated. LCA Update of Cotton Fiber and Fabric Life Cycle Inventory; Cotton Incorporated: Cary, NC, USA, 2017. [Google Scholar]
  11. Roos, S.; Sandin, G.; Zamani, B.; Peters, G. Environmental Assessment of Swedish Fashion Consumption Five Garments—Sustainable Futures; Mistra Future Fashion: Göteborg, Sweden, 2015. [Google Scholar]
  12. Sandin, G.; Roos, S.; Spak, B.; Zamani, B.; Peters, G. Environmental Assessment of Swedish Clothing Consumption: Six Garments—Sustainable Futures; Mistra Future Fashion: Göteborg, Sweden, 2019. [Google Scholar]
  13. Steinberger, J.K.; Friot, D.; Jolliet, O.; Erkman, S. A spatially explicit life cycle inventory of the global textile chain. Int. J. Life Cycle Assess. 2009, 14, 443–455. [Google Scholar] [CrossRef]
  14. Zhang, Y.; Liu, X.; Xiao, R.; Yuan, Z. Life cycle assessment of cotton T-shirts in China. Int. J. Life Cycle Assess. 2015, 20, 994–1004. [Google Scholar] [CrossRef]
  15. Ellebaek Larsen, S.; Hansen, J.; Knudsen, H.H.; Wenzel, H.; Larsen, H.F.; Moller Kristensen, F. EDIPTEX—Environmental Assessment of Textiles. 2007. Available online: http://orbit.dtu.dk/en/publications/ediptex--environmental-assessment-of-textiles(fa09875a-d870-47d7-bcc1-b6be72c992bf).html (accessed on 17 March 2020).
  16. Bakker, C.; Schuit, C.S. The Long View: Exploring Product Lifetime Extension; United Nations Environment Programme: Nairobi, Kenya, 2017; pp. 1–74. [Google Scholar]
  17. Böckin, D.; Willskytt, S.; André, H.; Tillman, A.; Söderman, M.L. How product characteristics can guide measures for resource efficiency—A synthesis of assessment studies. Resour. Conserv. Recycl. 2020, 154, 104582. [Google Scholar] [CrossRef]
  18. Cooper, T. Beyond Recycling: The Longer Life Option; The New Economics Foundation: London, UK, 1994. [Google Scholar]
  19. De Saxce, M.; Pesnel, S.; Perwuelz, A. LCA of bed sheets—Some relevant parameters for lifetime assessment. J. Clean. Prod. 2012, 37, 221–228. [Google Scholar] [CrossRef]
  20. Murray, A.; Skene, K.; Haynes, K. The Circular Economy: An Interdisciplinary Exploration of the Concept and Application in a Global Context. J. Bus. Ethics 2017, 140, 369–380. [Google Scholar] [CrossRef] [Green Version]
  21. Suarez-Eiroa, B.; Fernandez, E.; Méndez-Martinez, G.; Soto-Oñate, D. Operational principles of circular economy for sustainable development: Linking theory and practice. J. Clean. Prod. 2019, 214, 952–961. [Google Scholar] [CrossRef]
  22. Cox, J.; Griffith, S.; Giorgi, S.; King, G. Consumer understanding of product lifetimes. Resour. Conserv. Recycl. 2013, 79, 21–29. [Google Scholar] [CrossRef]
  23. Cooper, T.; Hill, H.; Kininmonth, J.; Townsend, K.; Hughes, M. Design for Longevity: Guidance on Increasing the Active Life of Clothing; WRAP: London, UK, 2013. [Google Scholar]
  24. Laitala, K.; Boks, C.; Klepp, I.G. Making Clothing Last: A Design Approach for Reducing the Environmental Impacts. Int. J. Des. 2015, 9, 93–107. [Google Scholar]
  25. Niinimäki, K.; Hassi, L. Emerging design strategies in sustainable production and consumption of textiles and clothing. J. Clean. Prod. 2011, 19, 1876–1883. [Google Scholar] [CrossRef]
  26. Maldini, I.; Stappers, P.J.; Gimeno-martinez, J.C.; Daanen, H.A.M. Assessing the impact of design strategies on clothing lifetimes, usage and volumes: The case of product personalisation. J. Clean. Prod. 2019, 210, 1414–1424. [Google Scholar] [CrossRef]
  27. Morseletto, P. Targets for a circular economy. Resour. Conserv. Recycl. 2020, 153, 104553. [Google Scholar] [CrossRef]
  28. Lionberger, R.A.; Lee, S.L.; Lee, L.; Raw, A.; Yu, L.X. Quality by Design: Concepts for ANDAs. AAPS J. 2008, 10, 268–276. [Google Scholar] [CrossRef] [PubMed] [Green Version]
  29. Yu, L.X.; Amidon, G.; Khan, M.A.; Hoag, S.W.; Polli, J.; Raju, G.K.; Woodcock, J. Understanding Pharmaceutical Quality by Design. AAPS J. 2014, 16, 771–783. [Google Scholar] [CrossRef] [Green Version]
  30. Afifi, A.; May, S.; Clark, V.A. Chapter 1: What is multivariate analysis? In Computer-Aided Multivariate Analysis, 4th ed.; Taylor & Francis: Abingdon, UK, 2003; Available online: https://books.google.fr/books?id=Gejr3I40mHsC (accessed on 17 March 2020).
  31. Hamdi, T.; Ghith, A.; Fayala, F. A principal component analysis (PCA) method for predicting the correlation between some fabric parameters and the drap. AUTEX Res. J. 2014, 14, 10–15. [Google Scholar] [CrossRef] [Green Version]
  32. Umair, M.; Shaker, K.; Ahmad, N.; Hussain, M.; Jabbar, M.; Nawab, Y. Simultaneous Optimization of Woven Fabric Properties Using Principal Component Analysis. J. Nat. Fibers 2017, 14, 846–857. [Google Scholar] [CrossRef]
  33. Bertaux, E.; Lewandowski, M.; Derler, S. Relationship between Friction and Tactile Properties for Woven and Knitted Fabrics. Text. Res. J. 2007, 77, 387–396. [Google Scholar] [CrossRef]
  34. Bacci, L.; Camilli, F.; Drago, S.; Magli, M.; Vagnoni, E.; Mauro, A.; Predieri, S. Sensory evaluation and instrumental measurements to determine tactile properties of wool fabrics. Text. Res. J. 2012, 82, 1430–1441. [Google Scholar] [CrossRef]
  35. Jollife, I.T.; Cadima, J. Principal component analysis: A review and recent developments. Philos. Trans. R. Soc. A Math. Phys. Eng. Sci. 2016, 374. [Google Scholar] [CrossRef]
  36. Muñoz, A.M. Universal, product and attribute specific scaling and the development of common lexicons in descriptive analysis. J. Sens. Stud. 1997, 13, 57–75. [Google Scholar] [CrossRef]
  37. Zadeh, L.A. Fuzzy Sets. Inf. Control 1965, 8, 338–353. [Google Scholar] [CrossRef] [Green Version]
  38. Kahraman, C.; Onar, S.C.; Oztaysi, B. Fuzzy Multicriteria Decision-Making: A Literature Review. Int. J. Comput. Intell. Syst. 2015, 8, 637–666. [Google Scholar] [CrossRef] [Green Version]
  39. Zeng, X.; Koehl, L.; Sanoun, M.; Bueno, M.A.; Renner, M. Integration of human knowledge and measured data for optimization of fabric hand. Int. J. Gen. Syst. 2004, 33, 243–258. [Google Scholar] [CrossRef]
  40. He, Y.; Tang, X.; Chang, W. Technical Decomposition Approach of Critical to Quality Characteristics for Product Design for Six Sigma. Qual. Reliab. Eng. Int. 2010, 26, 325–339. [Google Scholar] [CrossRef]
  41. Benkirane, R.; Thomassey, S.; Koehl, L.; Perwuelz, A. A consumer-based textile quality scoring model using multi-criteria decision making. J. Eng. Fiber. Fabr. 2019, 14, 1–12. [Google Scholar] [CrossRef] [Green Version]
  42. Benkirane, R.; Thomassey, S.; Koehl, L.; Perwuelz, A. Standards Selection Approach for Clothing Longevity Indicators. In Proceedings of the 4th PLATE 2021 Virtual Conference, Limerick, Ireland, 26–28 May 2021; p. 7. [Google Scholar]
  43. Benkirane, R.; Thomassey, S.; Koehl, L.; Perwuelz, A. A Performance and Consumer-based Lifespan Evaluation for T-shirt Eco-design. In Proceedings of the 3rd PLATE 2019 Conference, Berlin, Germany, 18–20 September 2019; pp. 59–63. [Google Scholar]
  44. Bide, M. Testing textile durability. In Understanding and Improving the Durability of Textiles; Annis, P.A., Ed.; Woodhead Publishing Limited: Cambridge, UK, 2012; pp. 126–142. [Google Scholar]
  45. Fulton, M.; Rezazadeh, M.; Torvi, D. Tests for evaluating textile aging. In Advanced Characterization and Testing of Textiles; Jackson, D., Webber, S., Eds.; Woodhead Publishing: Cambridge, UK, 2018; pp. 93–125. [Google Scholar]
  46. Ray, S.C. Process control in knitting. In Process Control in Textile Manufacturing; Woodhead Publishing Limited: Cambridge, UK, 2013; pp. 243–264. [Google Scholar]
  47. Saville, B.P. Serviceability. In Physical Testing of Textiles, 1st ed.; Saville, B.P., Ed.; The Textile Institute Book Series; Woodhead Publishing Limited: Cambridge, UK, 1999; pp. 184–208. [Google Scholar]
  48. Shaw, A. Durability of protective clothing. In Understanding and Improving the Durability of Textiles; Annis, P.A., Ed.; Woodhead Publishing Limited: Cambridge, UK, 2012; pp. 174–183. [Google Scholar]
  49. Nayak, R.K.; Padhye, R. The care of apparel products. In Textiles and Fashion: Materials, Design and Technology; Sinclair, R., Ed.; Elsevier Ltd.: Amsterdam, The Netherlands, 2015; pp. 799–822. [Google Scholar]
  50. Raja, V. Introduction to reverse engineering. In Reverse Engineering: An Industrial Perspective; Fernandes, K.J., Ed.; Springer: Berlin/Heidelberg, Germany, 2008; p. 242. [Google Scholar]
  51. Das Gupta, S.; Mukhopadhyay, R.; Baranwal, K.C.; Bhowmick, A.K. Reverse engineering concepts. In Reverse Engineering of Rubber Products: Concepts, Tools, and Techniques; CRC Press: Boca Raton, FL, USA, 2013; pp. 109–132. [Google Scholar]
  52. Elhawary, I.A. Fibre to yarn: Staple-yarn spinning. In Textiles and Fashion: Materials, Design and Technology; Sinclair, R., Ed.; Elsevier Ltd.: Amsterdam, The Netherlands, 2015; pp. 191–212. [Google Scholar]
  53. Power, E.J. Yarn to fabric: Knitting. In Textiles and Fashion: Materials, Design and Technology; Sinclair, R., Ed.; Elsevier Ltd.: Amsterdam, The Netherlands, 2015; pp. 289–305. [Google Scholar]
  54. FD CEN ISO/TR 11827; Textiles—Composition Testing—Identification of Fibres. ISO: London, UK, 2016.
  55. NF EN ISO 5084; Textiles. Determination of Thickness of Textiles and Textile Products. ISO: London, UK, 1996.
  56. NF EN 12127; Textiles. Fabrics. Determination of Mass per Unit Area Using Small Samples. ISO: London, UK, 1998.
  57. Ucar, N.; Ertugrul, S. Predicting Circular Knitting Machine Parameters for Cotton Plain Fabrics Using Conventional and Neuro-Fuzzy Methods. Text. Res. 2002, 72, 361–366. [Google Scholar] [CrossRef]
  58. NF EN 14971; Textiles—Knitted Fabrics—Determination of Number of Stitches per Unit Length and Unit Area. AFNOR: Paris, France, 2006.
  59. NF EN 14970; Textiles—Knitted Fabrics—Determination of Stitch Length and Yarn Linear Density in Weft Knitted Fabrics. AFNOR: Paris, France, 2006.
  60. NF ISO 4915; Textiles—Stitch Types—Classification and Terminology. AFNOR: Paris, France, 2015.
  61. NF G 07-079; Textiles—Testing Threads—Determining the Twisting of Threads by Untwisting/Retwisting with a Double Re-Test. AFNOR: Paris, France, 2011.
  62. NF EN ISO 2062; Textiles—Yarns from Packages—Determination of Single-End Breaking Force and Elongation at Break Using Constant Rate of Extension (CRE) Tester. ISO: London, UK, 2010.
  63. Mardia, K.V.; Kent, J.T.; Bibby, J. Introduction. In Multivariate Analysis; Academic Press. Inc.: London, UK, 1979; p. 518. [Google Scholar]
  64. Jolliffe, I.T.; Morgan, B. Principal component analysis and exploratory factor analysis. Stat. Methods Med. Res. 1992, 1, 69–95. [Google Scholar] [CrossRef]
  65. Lebart, L.; Morineau, A.; Piron, M. Analyse en composantes principales. In Statistique Exploratoire Multidimensionnelle; Dunod: Paris, France, 1995; pp. 32–57. [Google Scholar]
  66. Mardia, K.V.; Kent, J.T.; Bibby, J.M. Principal component analysis. In Multivariate Analysis; Academic Press Inc.: London, UK, 1979; p. 518. [Google Scholar]
  67. WRAP; Gray, S. Mapping Clothing Impacts in Europe: The Environmental Cost; WRAP: London, UK, 2017. [Google Scholar]
  68. Brans, J.P. L’ingénièrie de la décision; Elaboration d’instruments d’aide à la décision. La méthode PROMETHEE. In L’Aide à la Décision: Nature, Instruments et Perspectives d’Avenir; Nadeau, R., Landry, M., Eds.; Presses de l’Université Laval: Québec, Canada, 1982; pp. 183–213. [Google Scholar]
  69. Brans, J.P.; Vincke, P.; Mareschal, B. How to select and how to rank projects: The PROMETHEE method. Eur. J. Oper. Res. 1986, 24, 228–238. [Google Scholar] [CrossRef]
  70. Kaiser, H.F. An index of factorial simplicity. Psychometrika 1974, 39, 31–36. [Google Scholar] [CrossRef]
  71. Tripathi, M.; Singal, S.K. Use of Principal Component Analysis for parameter selection for development of a novel Water Quality Index: A case study of river Ganga India. Ecol. Indic. 2019, 96, 430–436. [Google Scholar] [CrossRef]
  72. Sinclair, R. (Ed.) Understanding textile fibres and their properties: What is a textile fibre? In Textiles and Fashion; Elsevier Ltd.: Amsterdam, The Netherlands, 2015; pp. 3–27. [Google Scholar]
  73. Mee-sung, C.; Ashdown, S.P. Effect of Changes in Knit Structure and Density on the Mechanical and. Text. Res. J. 2000, 12, 1033–1045. [Google Scholar]
  74. Ramey, H.H.; Lawson, R.; Worley, S. Relationship of cotton fiber properties to yarn tenacity. Text. Res. J. 1977, 685–691. [Google Scholar] [CrossRef]
  75. De Araujo, M.D.; Smith, G.W. Spirality of knitted fabrics—Part I: The nature of spirality. Text. Res. J. 1989, 247–256. [Google Scholar] [CrossRef]
  76. Kothari, V.K.; Singh, G.; Roy, K.; Varshney, R. Spirality of cotton plain knitted fabrics with respect to variation in yarn and machine parameters. Indian J. Fibre Text. Res. 2011, 36, 227–233. [Google Scholar]
  77. Oinuma, R.; Takeda, H. Spirality in plain-jersey fabrics knitted of three-ply cotton yarns. J. Text. Mach. Soc. Japan 1988, 39, 65–71. [Google Scholar] [CrossRef]
  78. Geršak, J. Key issues in developing a garment collection. In Design of Clothing Manufacturing Processes; The Textile Institute Book Series; Woodhead Publishing Limited: Cambridge, UK, 2013; pp. 53–86. [Google Scholar]
  79. Allwood, J.M.; Laursen, S.E. Well Dressed? The Present and Future Sustainability of Clothing and Textiles in the United Kingdom; University of Cambridge: Mill Lane, CA, USA, 2006. [Google Scholar]
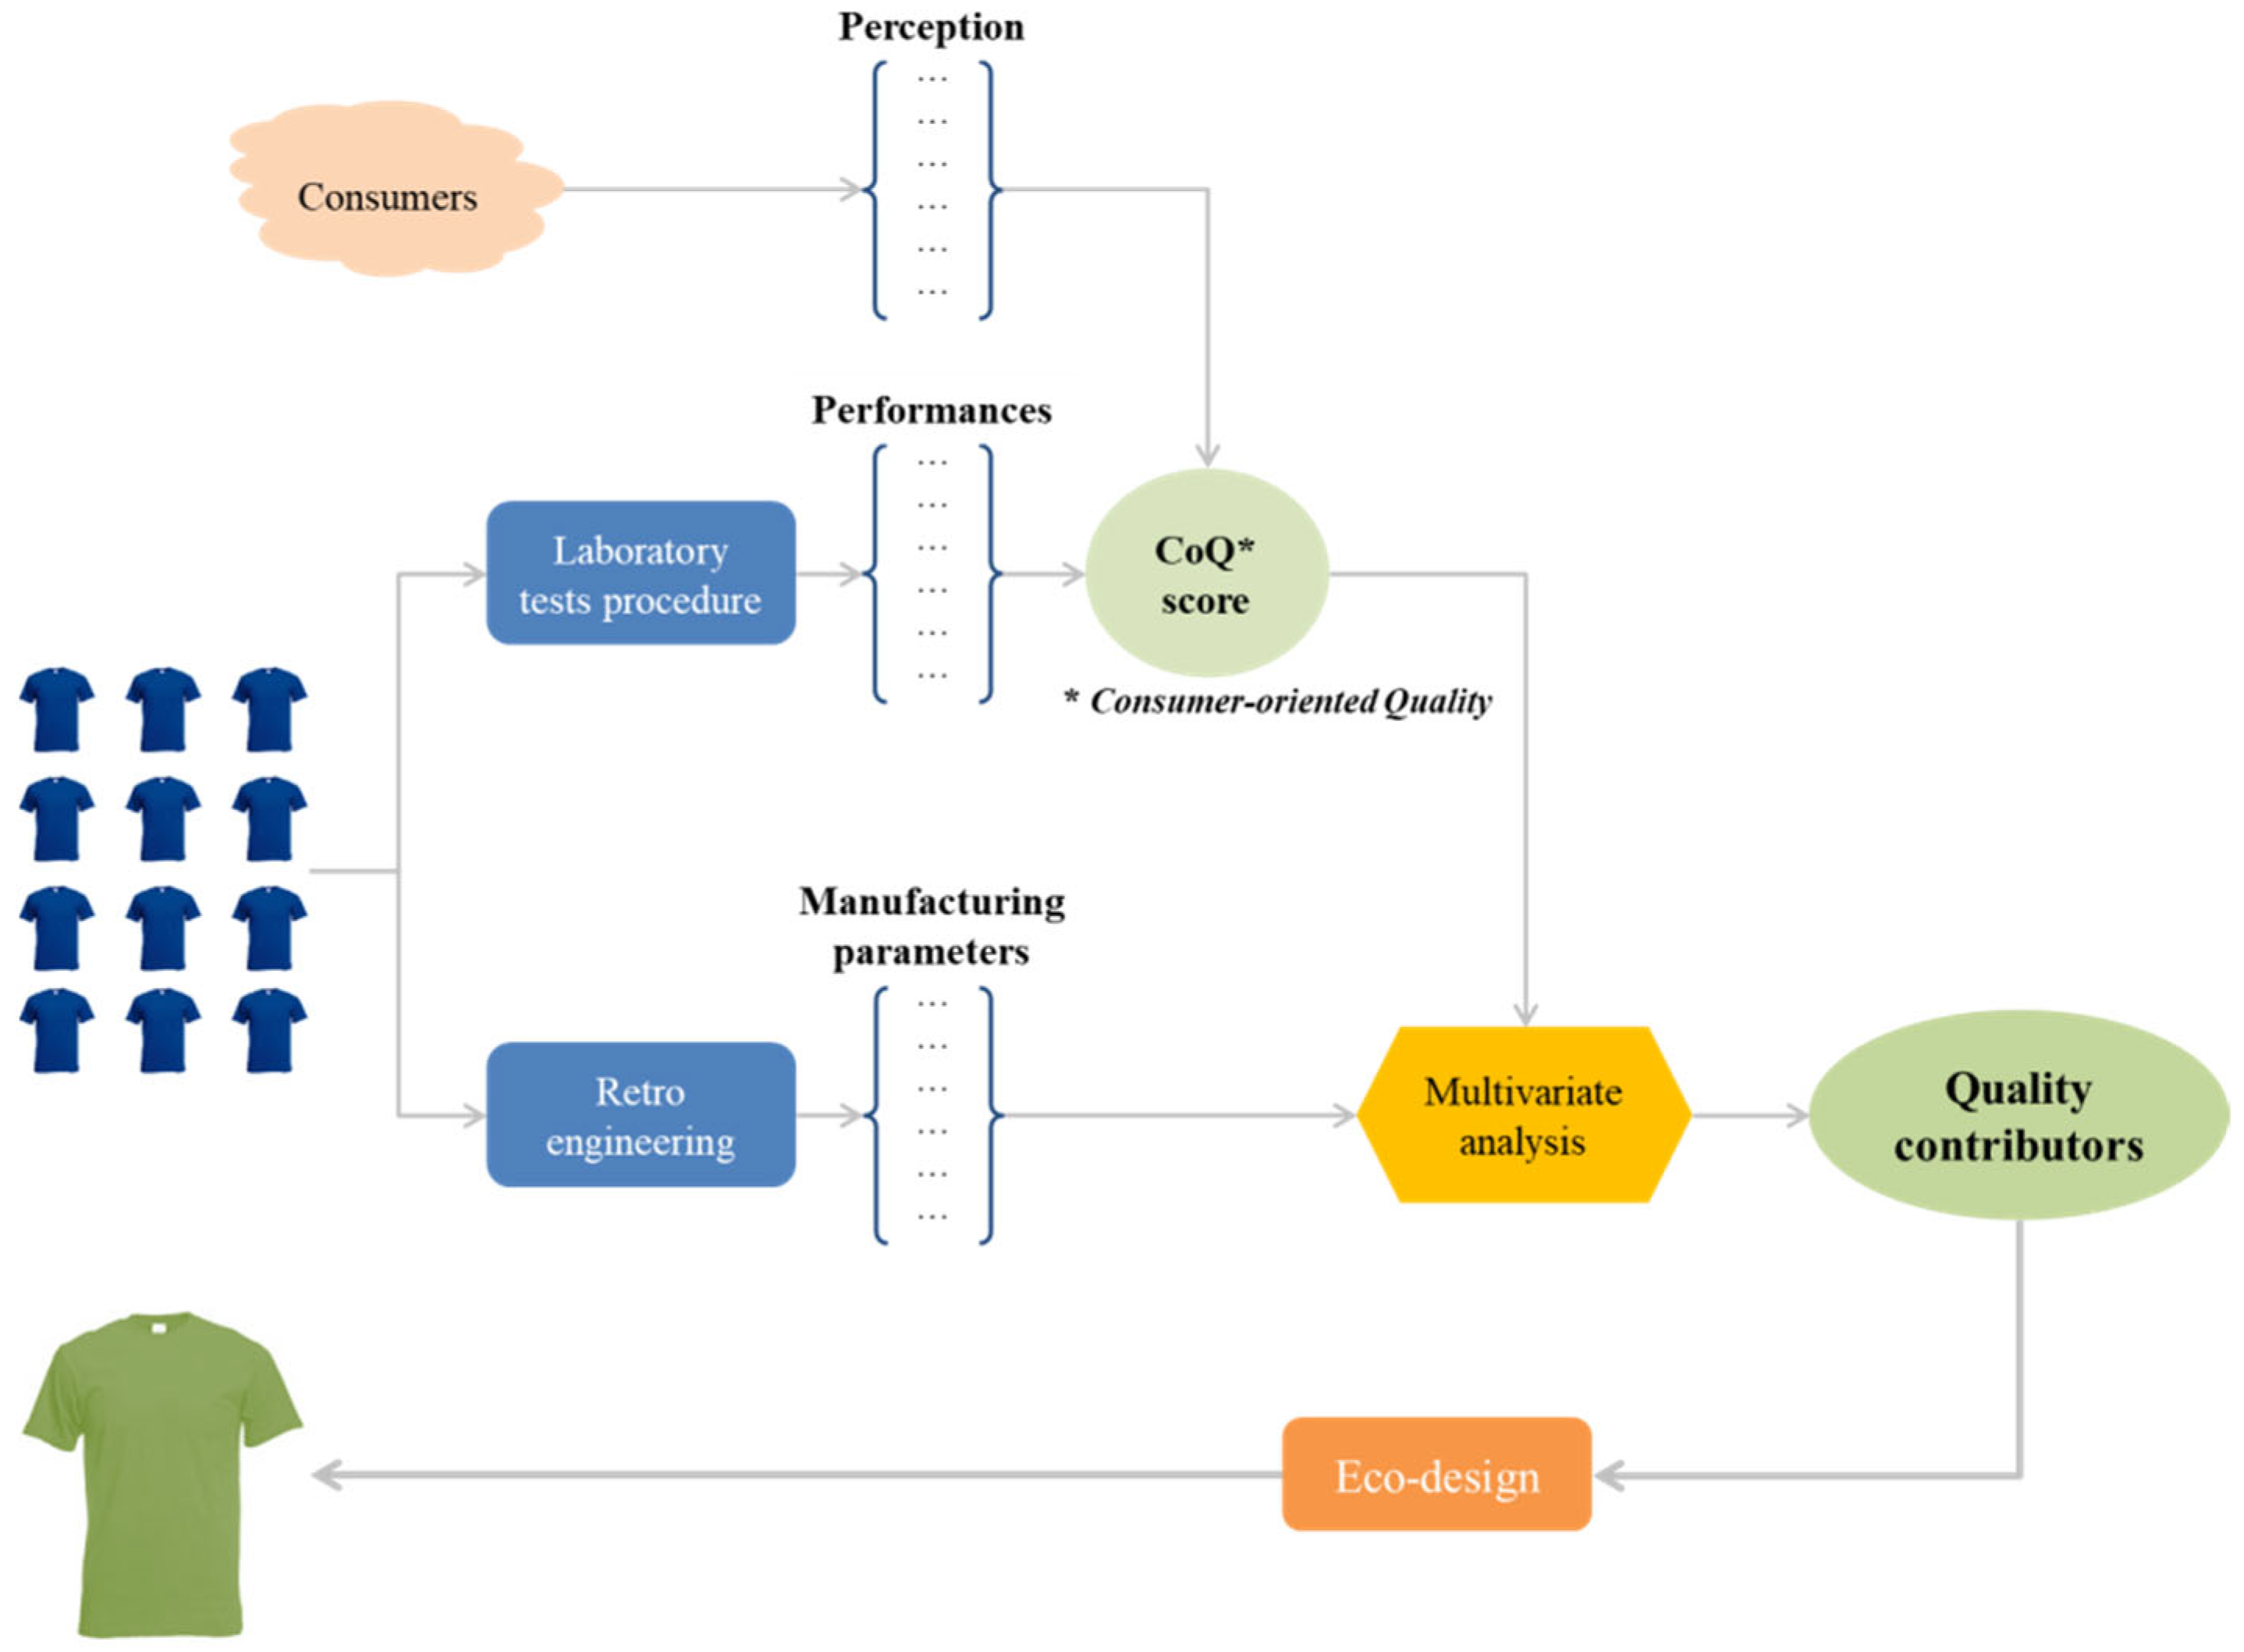
Figure 1. Quality contributors’ identification process.
Sustainability 14 07696 g001
Figure 2. Consumer-oriented quality score computation method.
Sustainability 14 07696 g002
Figure 3. T-shirts’ consumer-oriented quality score.
Sustainability 14 07696 g003
Figure 4. Consumer-oriented Quality and single quality scores comparison.
Sustainability 14 07696 g004
Figure 5. (a) Fabric yarn, linear density; (b) Fabric yarn, twist level; (c) Fabric yarn, tenacity.
Sustainability 14 07696 g005
Figure 6. (a) Main fabric, stitches density; (b) Main fabric, stitch length; (c) Main fabric thickness; (d) Main fabric area density.
Sustainability 14 07696 g006aSustainability 14 07696 g006b
Figure 7. Knitting machine computed gauge.
Sustainability 14 07696 g007
Figure 8. PCA bi-plot based on T-shirts structural parameters and quality test measurements.
Sustainability 14 07696 g008
Figure 9. PCA bi-plot based on T-shirts structural parameters and CoQ score.
Sustainability 14 07696 g009
Table 1. List of selected tests.
TestDirection of MeasurementUnitBest Grade
Loss of color
Color fastness to domestic laundering /5To be maximized
Color fastness to water
Color fastness to ironing
Color fastness to dry rubbing
Color fastness to wet rubbing
Loss of shape
Dimensional changes in washing and dryingWales%To be minimized
Courses
Spirality after laundering %
Opened seam
Seam tensile propertiesWales%To be maximized
Courses
Hole(s)
Bursting resistance (pneumatic method) kPaTo be maximized
Pilling
Surface fuzzing and pilling
(Pilling box)
/5To be maximized
Surface fuzzing and pilling
(Martindale)
Table 2. Manufacturing data collection process.
Collected DataUnitData Collection Process
End-Product
 Composition%FD CEN ISO/TR 11,827 [54]
 Manufacturing process-
 ThicknessmmNF EN ISO 5084 [55]
 Area densitygsmNF EN 12,127 [56]
Knitted fabric
 Structure (pattern)-Visual observation
 Machine gaugeneedle/inchComputed from [57]
 Wale densitywales/inchNF EN 14,971 [58]
 Courses densitycourses/inch
 Stitches density 1stitches/inch2
 Stitch length 2cm/loopNF EN 14,970 [59]
Side seam
 Seam type-NF ISO 4915 [60]
 Number of sewing threads-
 Seam densityseam/inch
Fabric yarn
 Manufacturing process-
 Number of single yarns twisted together-
 Linear densityNm (km/kg)NF EN 14,970 [59]
 Twist ratioTpmNF G 07-079 [61]
 TenacitycN/TexNF EN ISO 2062 [62]
 Elongation at breakmmNF EN ISO 2062 [62]
1 The «stitches density» refers to the total number of loops (stitches) per surface unit in the knitted fabric. 2 The «stitch length» corresponds to the length of yarn in a knitted loop.
Table 3. T-shirts overview.
Number of T-Shirts(%)
Composition
Cotton1758.6
Polyester620.8
Flax310.3
Blend310.3
Main fabric manufacturing process
Weft knitting2689.6
Warp knitting310.3
Structure
Jersey2482.7
Ribs 1 × 126.9
Undefined310.3
Yarn manufacturing process
Ring Spinning (RS)2069
Rotor26.9
Multifilament yarn (MTFT)13.4
Wet Spinning (WS)310.3
Undefined310.3
Table 4. Data correlation coefficient.
ThicknessArea DensityWales per inchCourses per inchStitches DensityStitch LengthGaugeLinear DensityTwist RatioBreaking StrengthElongation at BreakTenacity
Thickness-
Area density0.69-
Wales per inch−0.76−0.82-
Courses per inch−0.65−0.570.81-
Stitches density−0.75−0.740.950.95-
Stitch length0.760.70−0.83−0.56−0.72-
Gauge−0.71−0.800.920.800.89−0.81-
Linear Density−0.53−0.680.690.790.79−0.310.72-
Twist ratio0.01−0.040.140.160.09−0.090.17−0.06-
Breaking Strength0.210.14−0.23−0.36−0.32−0.06−0.17−0.440.03-
Elongation at break0.10−0.140.13−0.060.00−0.270.14−0.130.300.58-
Tenacity0.11−0.080.02−0.11−0.08−0.200.11−0.190.280.910.71-
Publisher’s Note: MDPI stays neutral with regard to jurisdictional claims in published maps and institutional affiliations.