Article

A Novel PV Maximum Power Point Tracking Based on Solar Irradiance and Circuit Parameters Estimation

1
Mechatronics Engineering Department, School of Engineering, The University of Jordan, Amman 11942, Jordan
2
Electrical Engineering Department, Faculty of Engineering, Jordan University of Science and Technology, Irbid 22110, Jordan
*
Author to whom correspondence should be addressed.
Sustainability 2022, 14(13), 7699; https://doi.org/10.3390/su14137699
Submission received: 27 April 2022 / Revised: 8 June 2022 / Accepted: 23 June 2022 / Published: 24 June 2022
(This article belongs to the Special Issue Electric Power Systems towards Sustainability)

Abstract

:
This research paper presents a novel maximum power point taking (MPPT) algorithm. The algorithm uses an adaptive calculation block to estimate the solar irradiance and the PV I–V curve circuit parameters based on the PV panel’s measured output current and voltage. In the proposed algorithm, the output power does not oscillate around the maximum power point (MPP) compared to conventional MPPT methods. Moreover, the proposed algorithm does not require expensive solar irradiance sensors compared with trackers that depend on measured solar irradiance. In addition, the proposed MPPT can handle the fast variation in solar irradiance. The PV panel nonlinear I–V curve was modeled using a single-diode PV. The algorithm with the adaptive block was tested separately to verify the ability of the system to estimate the solar irradiance and the circuit parameters. The solar system was then simulated using MATLAB/Simulink to evaluate the robustness of the proposed method under steady-state and during sudden changes in solar irradiance and load. The proposed solar system reaches the steady-state in 8 ms after a step-change in the solar irradiance. In the worst-case scenario, the proposed system achieves a relative error of around 2.64% in estimating the solar irradiance at 600 W/m2 with an efficiency of 99.3%.

1. Introduction

Renewable energy sources (RESs) are being used for electrical energy production and penetrating the power networks due to economic and environmental concerns [1,2]. Photovoltaic (PV) or solar systems, which convert solar energy directly into electrical energy, are an essential aspect of RESs. However, PV power generation is variable and dependent on environmental conditions. The PV is effectively used by transmitting the total available power to the load using a maximum power point tracking (MPPT) algorithm [3]. In order to implement MPPT for RESs, power electronics are essential [4].
The issue with PV power generating systems is optimizing the output power and efficiency while operating in various weather situations. Controlling the PV output power by altering the duty cycle of a DC–DC converter requires MPPT control algorithms [5,6,7]. A PV module with nonlinear I–V and P–V curves has a unique maximum power point (MPP) under uniform irradiance levels [8]. However, a PV module may be exposed to numerous environmental conditions such as clouds, dust, rain, and shadows, resulting in varying amounts of solar irradiance [9,10], which is referred to as partial shading conditions (PSC). PSCs cause many peaks in the I–V and P–V characteristics curves, with several local maxima (LMPP) and one global maximum (GMPP) [11,12,13].
Open circuit voltage (VOC) and short circuit current (ISC) are MPPT techniques based on the linearity between the voltage at MPP (VMP) and VOC and between the current at MPP (IMP) and ISC [14,15]. The open-circuit voltage (OCV) technique uses the linear relationship between open-circuit voltage (VOC) and the voltage at MPP (VMP) of the PV module. On the other hand, the short circuit current technique (SCC) uses the linear relationship between ISC and IMP of the PV module. The PV module is periodically isolated from the system to measure ISC and VOC, which causes a loss of generation. Moreover, tracking of the MPP at any irradiance level may not be accurate [16]. In order to overcome these issues, the Perturbation and Observation (P&O) method achieves the MPP by applying a series of slight constant modifications to the reference voltage or current to obtain a tolerance error in the power ΔP [17]. The perturbations cause oscillation around the MPP and power losses. In addition, for a sudden change in the weather conditions, P&O could fail to track the MPP [18]. A newly formulated P&O was presented in [19], but the method is based on measured solar irradiance, which is difficult and expensive to obtain. Another approach for tracking MPP is the Incremental Conductance (Inc. Cond). The idea of Inc. Cond is to increment or decrement the reference voltage guided by the power derivative to the voltage (dP/dV). The MPP is reached when (dP/dV) is equal to zero [20]. Inc. Cond has less oscillation, fast-tracking, and better performance under a sudden change in the weather conditions than the P&O method [21]. A modified Inc. Cond was presented in [22] to improve the tracking under fast variation in solar irradiance. However, the output power oscillates around the MPP, and the efficiency does not exceed 96.4%.
Artificial intelligence (AI) techniques, such as Fuzzy Logic (FL) [23,24], Artificial Neural Network (ANN) [25], Genetic Algorithm (GA) [26], Evolutionary Algorithm (EA) [27], and Particle Swarm Optimization (PSO) [28], are used in conjunction with conventional MPPT techniques to produce better performance in terms of tracking speed and efficiency under sudden changing weather conditions. However, the output power oscillates around the MPP. Moreover, these methods have issues in terms of complexity and cost compared with conventional methods [29,30,31]. The authors [32] proposed an improved MPPT based on an adaptive block to determine the VMP and IMP. The adaptive block assumes pre-knowledge of solar irradiance and PV panel temperature. The challenge in this approach is measuring irradiance and temperature under weather conditions changes.
This paper proposes a novel MPPT technique to track the MPP under uniform solar irradiance. In the proposed MPPT, adaptive calculations based on measured (IPV, VPV) estimate the maximum power point (IMP, VMP), the short circuit current (ISC), and the open-circuit voltage (VOC). This estimation eliminates the need for solar irradiance sensors, in contrast to existing studies that utilize solar irradiance, where it is assumed that irradiance information is available through dedicated sensors. In addition, the suggested method does not fluctuate around MPP and efficiently establishes a stable state. Thus, avoiding two of the major drawbacks of similar MPPT methods, which rely on estimating the system parameters without a priori data. Namely, oscillations around MPP and poor performance under fast variations in solar irradiance.

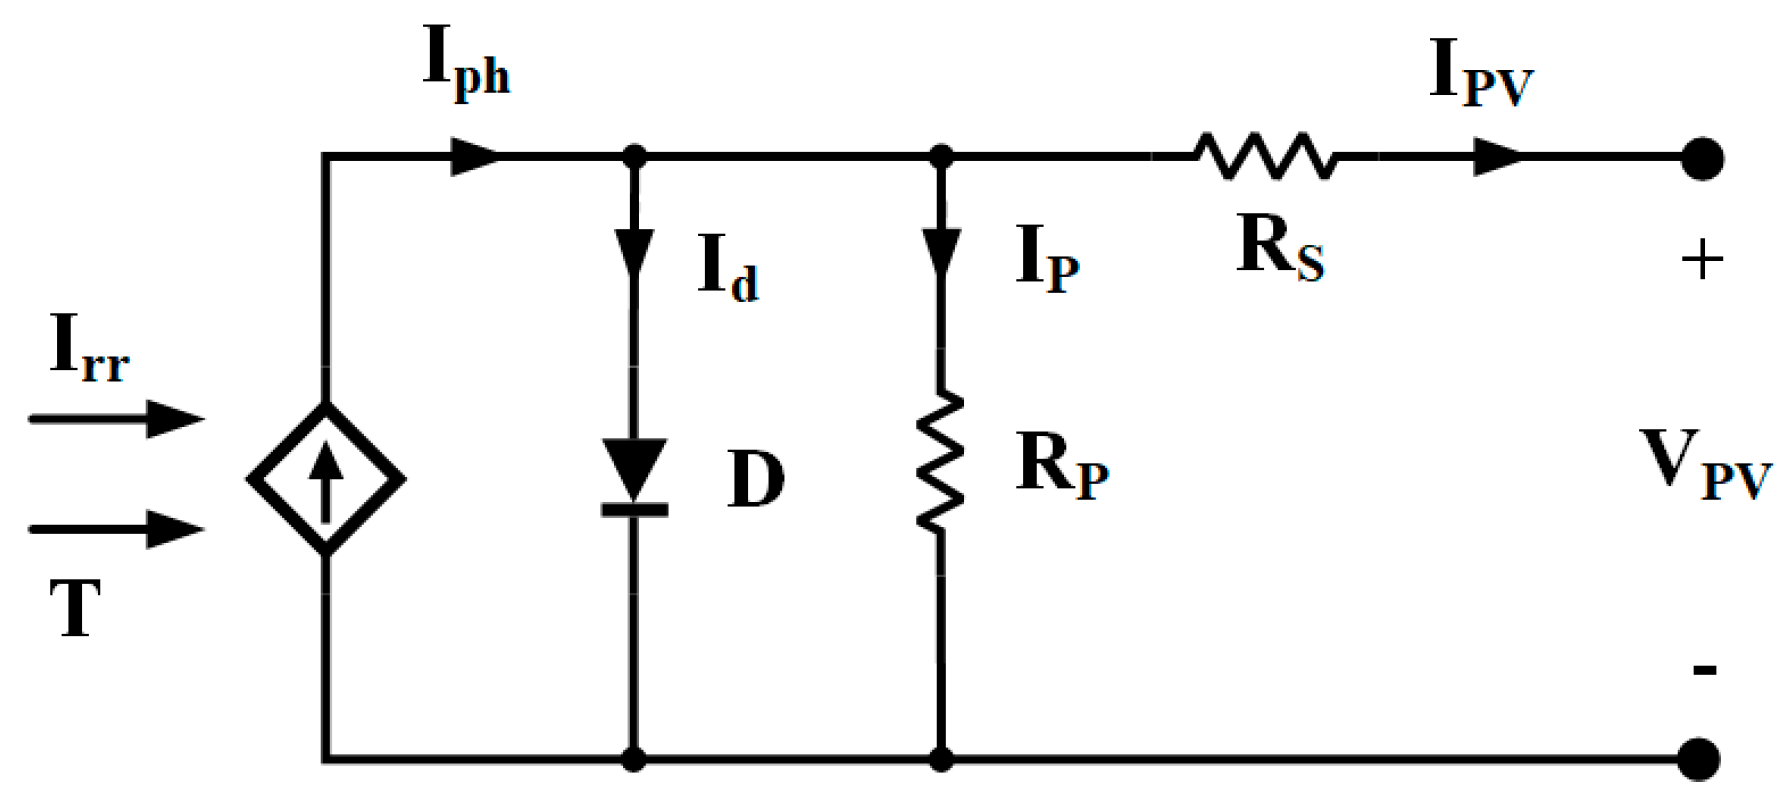
2. Modeling PV Panel

Figure 1 shows the most common model for representing a PV cell, consisting of series and parallel resistors coupled to a single diode and a current source [33,34,35].
RP is the loss caused by a minor leakage current flowing in a parallel route (high value in the range of kΩ). RS denotes the losses, including metal grid, contact, and current collecting bus losses. A diode is a semiconductor device having a pn junction that produces a cross-current [34,35,36]. The equations for a solar cell’s output current:
I P V = I p h I d I P
IPV denotes output current, Iph denotes photovoltaic current without loss, dependent on irradiance and solar cell temperature, and IP denotes current leakage in parallel resistance. Id denotes the current through the diode and can be expressed as:
I d = I o ( e q ( V P V + I P V R S ) n k T 1 )
The diode factor is n, the reverse saturation current is Io, the electron charge is q, and the Boltzmann constant is k. T denotes the pn junction temperature.
By substituting (2) in (1), the solar ‘cell’s output current is:
I P V = I p h I o [ e q ( V P V + I P V R S ) n k T 1 ] V P V + I P V R S R P  
RS is extremely small, and RP is significant; for example, the ‘manufacturer’s curve for the MSX60 indicates that RS is 8 mΩ. Then by ignoring the two internal resistances, (3) is reduced further to (4).
I P V = I p h I o [ e A V P V 1 ] I p h I o e A V P V  
where:
A = q n k T
Substituting zero PV voltage and zero PV current in (4), respectively, gives the short-circuit current (ISC) and the open-circuit voltage (VOC) [9,35].
I S C = I p h  
I o = I S C exp ( A V O C )  
The maximum power point (IMP, VMP) then could be expressed by (4) and (6) as:
I M P = I S C [ 1 e A ( V M P V O C ) ]    
A = 1 ( V M P V O C ) ln ( 1 I p m I s c )    
Using the circuit parameters VOC, ISC, IMP, and VMP, the output voltage VPV is given as:
V P V = V O C [ 1 + 1 A ln ( 1 I I S C ) ]  

3. The PV I–V Characteristics

PV ‘panels’ electrical properties are influenced by their surroundings. Because the amount of electricity generated by a single solar cell is insufficient (1–1.5 W), solar cells are attached in series to form PV panels, which may be connected in series or parallel to form a PV array [13,14]. Figure 2 depicts the I–V and P–V characteristics under varying irradiance for the PV panel used in this study. The I–V curve of a typical PV source under particular irradiance (Irr) and temperature (T) highlights three significant points: short-circuit (0, ISC), maximum power point (MPP) (VMP, IMP), and open-circuit (VOC, 0). At MPP, the current IMP has a significant variation as the solar irradiance varies and a minor variation as the temperature changes. Moreover, at MPP, the voltage VMP has a considerable variation as the temperature changes and a slight variation as the solar irradiance varies [8]. The following equations show the variation of current and voltage values (ISC, VOC, IMP, and VMP) in PV modules as a function of irradiance and temperature [31,35], where STC denotes the standard test conditions (1000 W/m2 and 25 °C).
Temperature and irradiance have an impact on short-circuit current (ISC):
I S C = I S C _ S T C I r r I r r _ S T C ( 1 + a Δ T )
Temperature and irradiance have an impact on open-circuit voltage (VOC):
V O C = V O C _ S T C ( 1 + a K Δ T ) ln ( e + b Δ I r r )
Temperature and irradiance have an impact on Maximum power current (IMP):
I M P = I M P _ S T C I r r I r r _ S T C ( 1 + a Δ T )
Temperature and irradiance have an impact on Maximum power voltage (VMP):
V M P = V M P _ S T C ( 1 + a K Δ T ) ln ( e + b Δ I r r )
where K is the temperature coefficient, a is the thermal coefficient, Irr is the irradiance (W/m2), ΔIrr is Irr − Irr_STC, T is the modules’ temperature (°C), ΔT is T − TSTC, and b represents the effect of the solar irradiance on the voltage, and it is around 0.0005 [34]. Theoretical and simulation verification of (10)–(13) were presented in [34] based on measured solar irradiance and temperature.

4. Description of the PV System

Figure 3 shows the block diagram of the PV system with the proposed MPPT technique. The system includes a PV module, DC–DC boost converter, MPPT algorithm with a low-pass filter, adaptive calculation block, Proportional–Integral (PI) controller, and Pulse–Width Modulation (PWM). Under uniform and partial shading conditions, a current-compensator controls the boost converter inductor current to operate the PV module at MPP. The MPPT algorithm generates the average inductor reference current, and then the PI controller determines the duty cycle ratio based on the inductor current error. The PWM modulates the duty cycle ratio to generate the switching signal of the boost converter.

5. The Proposed Maximum Power Point Tracking (MPPT) Algorithm

The suggested MPPT approach works by computing the circuit parameters to determine the operational I–V characteristic curve at a particular irradiance level (ISC, VOC, IMP, VMP). The adaptive block in the proposed method would estimate the irradiance at the PV module’s surface based on the PV module’s measured output current and voltage. As a result, the boost converter controller uses the predicted optimal operating point (IMP_es, VMP_es) as a reference point.
The ratio of the PV current (IPV) over the PV voltage (VPV) represents a conductance:
G = I P V V P V = 1 R   Ω 1
Under variable solar irradiance, the mapping of this conductance to IPV and VPV is not unique, i.e., the same conductance may be achieved at multiple levels of IPV and VPV. This is illustrated in Figure 4, where the conductance lines are shown on the PV I–V characteristic curves. For instance, points A, B, C, D, and E have the same conductance of G1 at different irradiance levels. The conductance, however, changes uniquely with IPV and VPV at constant solar irradiance. This may be expressed in terms of the normalized current (α):
α = I P V I S C   0 < α < 1
The value of the normalized current for a measured conductance is a function of solar irradiance. At varying sun irradiances, the conductance fluctuates as a function of the normalized current, as seen in Figure 5. Furthermore, as demonstrated in Figure 6, α is directly proportional to the PV module’s output current for a particular solar irradiance.
As illustrated in Figure 6, the value α of might change depending on the measured PV current. At IPV = 3 A, it might be K, L, or M, at solar irradiances of 1000 W/m2, 900 W/m2, and 800 W/m2, respectively. The conductance G, on the other hand, may vary for a given α. The conductance from Figure 5 might be (Ga, Gb, or Gc) at α = K, for example; nevertheless, only one of these is the proper conductance. The normalized current varies as a result of the adaptive computation and thus provides information about ISC. On the other hand, the adaptive block determines solar irradiance (10). The perturbation might be accomplished by creating a new quantity, the estimated conductance (Ges), based on the estimated solar irradiance:
G e s = I P V V O C { 1 + 1 A   log ( 1 α )   }
| G G e s |  
The normalized current α is the approximate ratio between the output current of the PV module and the short circuit current when a tolerance (17) between the measured conductance (G) and the estimated conductance is reached. The ISC (15) and, as a result, the I–V characteristics parameters, including the reference to the boost converter controller (IMP), may be calculated. A variable step-change in perturbation of α is employed in this work. When the operating point is far from MPP, there is a considerable change in α. However, when the operating point is near MPP, there is a slight disturbance in α. The proposed perturbation value Δα(n) is proportional to the difference in estimated and measured conductance ΔG(n), where the assumption is that Δα(n) = ΔG(n). Equation (18) is used to update the value of α(n). When the tolerance error in (17) is reached, α(n) will not be modified. The algorithm will compute the estimated irradiance and circuit parameters in this situation. As a result, the boost converter uses the estimated optimal operating point (IMP, VMP) as a reference point to run the PV panel at the MPP. The flowchart in Figure 7 illustrates the proposed MPPT, considering only the impact of the solar irradiance, that is ΔT = 0.
α ( n ) = α ( n 1 ) ± Δ α ( n )
At the start-up, α is initialized to 0.92, which is the typical ratio between IMP and ISC [16,37]. Moreover, the circuit parameters at the STC are defined based on the PV module. Then the algorithm detects the average output voltage VPV(n) and average current, IPV(n), of the PV panel, where n denotes the current sample. The estimated ISC(n) is then calculated based on (15). By estimating the ISC(n), one could compute the solar irradiance, Irr(n), from (10). Thus, the estimated VOC(n), IMP(n), and VMP(n) could be determined by (11), (12), and (13), respectively. Moreover, the estimated conductance, Ges(n), could be determined based on (16), and the measured conductance, G(n), could be calculated based on (14). If the difference error between Ges(n) and G(n) is less than the tolerance error ∈ (17), the estimated parameters ISC(n), VOC(n), IMP(n), and VMP(n) are equal to the circuit parameters of the PV panel and the estimated Irr(n) is equal to the solar irradiance. Otherwise, α(n) is updated based on (18) to achieve the tolerance error.

6. Simulation Test and Results

The system in Figure 3 is simulated using MATLAB/Simulink to validate the proposed MPPT method, including the solar irradiance estimation and MPP tracking. Table 1 shows the PV module parameters. The PV module produces a maximum power of 213 W with 7.35 A and 29 V at rated solar irradiance. The simulated PV panel has 60 cells connected in series with nominally rated conditions (1000 W/m2 and 25 °C). The load is modeled using a variable resistor. Table 2 shows the boost converter parameters. The inductor and capacitor are chosen to guarantee Continuous Conduction Mode (CCM) operation. The low pass filter filters the measured data with a cut-off frequency fc = 1 kHz. The PI controller is designed with a cross-over frequency of fx = 2 kHz and a phase margin of PM = 70° [38]. The resulting PI controller parameters are KP = 0.4624 and KI = 2523.6. The proposed algorithm, summarized in the flowchart in Figure 7, is verified and represented by the adaptive calculation block.
The algorithm with the adaptive block is tested to estimate the solar irradiances. The test was performed under different solar irradiance levels levels (1000 W/m2, 900 W/m2, 800 W/m2, 700 W/m2, and 600 W/m2). Figure 8 shows the actual I–V curve and the estimated curve at T = 25 °C, where the actual represents the MATLAB-provided module curve. The proposed technique successfully calculates the solar irradiance and the circuit parameters at different solar irradiance. Table 3 compares the actual I–V curve and the estimated I–V curve, where the subscript (es) represents the estimated parameters. At solar irradiance of 600 W/m2, in the worst-case scenario, the relative error (19) in the estimated solar irradiance is 2.64%, and the efficiency of the MPPT to extract the maximum power is 99.3%. The algorithm with the adaptive block is retested to estimate the solar irradiances at T = 4 °C; the proposed technique successfully calculates the solar irradiance, as summarized in Table 4, with a maximum relative error of 1.58% at 1000 W/m2.
R e l a t i v e   E r r o r = | A c t u a l E s t i m a t e d E s t i m a t e d | * 100 %
In addition, the proposed technique is tested under varying solar irradiance, varying load, and varying temperature. Figure 9 shows the actual and estimated irradiance and the output power. Initially, the load is R = 10.82 Ω, from t = 0 to t = 0.1 s the actual solar irradiance is 900 W/m2 while the estimated solar irradiance is 907.3 W/m2. Then at t = 0.1 s, a step-change in the actual soar irradiance from 900 W/m2 to 700 W/m2 is applied to the PV panel. The proposed technique successfully estimates solar irradiance with accuracy (19) of 2.18%. At t = 0.2 s, another step-change in the actual soar irradiance from 700 W/m2 to 1000 W/m2 is applied on the PV panel, and the proposed technique successfully estimates the solar irradiance. Moreover, the MP delivered to the load is 192.34 W (actual: 192.40 W), 150.15 W (actual: 150.70 W), and 212.86 W (actual: 221.86 W), at solar irradiance of 900 W/m2, 700 W/m2, and 1000 W/m2, respectively. At t = 0.3 s, the load is changed to R = 9.764 Ω. The proposed technique continues tracking the MP at 212.86 W. When the load is decreased again to R = 10.82 Ω at t = 0.4 s, the MP delivered to the load still 212.86 W. An additional decrement in the load is applied at t = 0.5 s and the MP delivered to the load does not change. In addition, the proposed technique accurately tracks the MP in a fast manner (<1 ms) under varying irradiance, as illustrated in Figure 9. Finally, at t = 0.6 s, a step change in the temperature from 25 to 45 °C is applied, and the proposed technique continues tracking the MP at 194.8 W.
Finally, the solar system dynamics are tested under sudden changes in the solar irradiance and the load. Figure 10 shows the dynamics of the load voltage (Vo), the load current (Io), the inductor current (IL), the PV voltage (VPV), and the PV currents (IPV). Initially, at solar irradiance 900 W/m2 and load R = 10.82 Ω, the load voltage and current are 45.11 V and 4.17 A, respectively. The PV Voltage and current are 28.88 V and 6.66 A, respectively, and the system operates at MPP. Following the solar irradiance, step down to 700 W/m2 at t = 0.1 s, and the PV voltage and PV current drop, as desired, to 28.61 V and 5.248 A, respectively. The output voltage reaches the steady-state 39.82 V in 8 ms. In terms of the settling time, similar behavior can be observed when the solar irradiance is stepped up back to 1000 W/m2 at t = 0.2 s. After t = 0.2 s, the solar irradiance is kept constant. The PV operates at the MPP with 212.86 W. A load step is applied at t = 0.3 s, and the load voltage and current drop to 45.08 V and 4.616 A, respectively, in 8 ms. In terms of settling time, similar behavior can be observed when the load is stepped back at t = 0.4 s. Finally, a step change in the temperature from 25 to 45 °C is applied at t = 0.4 s; the system operates at MPP.

7. Conclusions

This paper presents a novel maximum power point tracking (MPPT) algorithm for a photovoltaic (PV) system. The algorithm employs an adaptive calculation block to estimate the solar irradiance and the PV I–V curve circuit parameters. The algorithm successfully estimates the solar irradiance, circuit parameters, and the maximum power point (IMP, VMP). The proposed MPPT is non-searchable; therefore, the output power does not oscillate around the maximum power. The algorithm performance was verified using MATLAB/Simulink. The ability of the algorithm to estimate the solar irradiance and the PV I–V curve circuit parameters were examined first, where it achieved 2.7% accuracy in estimating the solar irradiance. Then, the algorithm tracking the maximum power point under variable solar irradiance and the variable load was verified, where it was able to extract 99.3% of the PV power. Finally, the solar system dynamics were tested under sudden solar irradiance and load changes, and the system successfully tracks the maximum power.

Author Contributions

Conceptualization, A.M.A.M., A.O. and A.B.; methodology, A.M.A.M., A.O. and A.B.; software, A.M.A.M., A.O. and A.B.; validation, A.O.; formal analysis, A.M.A.M., A.O. and A.B.; writing—original draft preparation, A.M.A.M., A.O. and A.B.; writing—review and editing, A.M.A.M., A.O. and A.B. All authors have read and agreed to the published version of the manuscript.

Funding

This research received no external funding.

Institutional Review Board Statement

Not applicable.

Informed Consent Statement

Not applicable.

Data Availability Statement

Not applicable.

Conflicts of Interest

The authors declare no conflict of interest.

References

  1. Dehedkar, M.N.; Murkute, S.V. Optimization of PV system using distributed MPPT control. In Proceedings of the 2018 International Conference on System Modeling & Advancement in Research Trends (SMART), Moradabad, India, 23–24 November 2018; pp. 216–220. [Google Scholar]
  2. Dincer, I. Environmental impacts of energy. Energy Policy 1999, 27, 845–854. [Google Scholar] [CrossRef]
  3. Koutroulis, E.; Blaabjerg, F. Overview of maximum power point tracking techniques for photovoltaic energy production systems. Electr. Power Compon. Syst. 2015, 43, 1329–1351. [Google Scholar] [CrossRef]
  4. Liu, Y.; Tang, Y.; Shi, J.; Shi, X.; Deng, J.; Gong, K. Application of small-sized SMES in an EV charging station with DC bus and PV system. IEEE Trans. Appl. Supercond. 2014, 25, 5700406. [Google Scholar] [CrossRef]
  5. Kumar, R.; Singh, S.K. Solar photovoltaic modeling and simulation: As a renewable energy solution. Energy Rep. 2018, 4, 701–712. [Google Scholar]
  6. Motahhir, S.; El Hammoumi, A.; El Ghzizal, A. The most used MPPT algorithms: Review and the suitable low-cost embedded board for each algorithm. J. Clean. Prod. 2020, 246, 118983. [Google Scholar] [CrossRef]
  7. Mao, M.; Cui, L.; Zhang, Q.; Guo, K.; Zhou, L.; Huang, H. Classification and summarization of solar photovoltaic MPPT techniques: A review based on traditional and intelligent control strategies. Energy Rep. 2020, 6, 1312–1327. [Google Scholar] [CrossRef]
  8. Bendib, B.; Belmili, H.; Krim, F. A survey of the most used MPPT methods: Conventional and advanced algorithms applied for photovoltaic systems. Renew. Sustain. Energy Rev. 2015, 45, 637–648. [Google Scholar] [CrossRef]
  9. Malkawi, A.; Lopes, L. A novel seamless control algorithm for a single-stage photovoltaic interface employing DC bus signaling. Int. J. Electr. Power Energy Syst. 2019, 113, 90–103. [Google Scholar] [CrossRef]
  10. Moreira, H.S.; Oliveira, T.P.; Dos Reis, M.V.G.; Guerreiro, J.F.; Villalva, M.G.; De Siqueira, T.G. Modeling and simulation of photovoltaic systems under non-uniform conditions. In Proceedings of the 2017 IEEE 8th International Symposium on Power Electronics for Distributed Generation Systems (PEDG), Florianopolis, Brazil, 17–20 April 2017; pp. 1–6. [Google Scholar]
  11. Wang, Y.; Li, Y.; Ruan, X. High-accuracy and fast-speed MPPT methods for PV string under partially shaded conditions. IEEE Trans. Ind. Electron. 2015, 63, 235–245. [Google Scholar] [CrossRef]
  12. Spertino, F.; Ahmad, J.; Di Leo, P.; Ciocia, A. A method for obtaining the IV curve of photovoltaic arrays from module voltages and its applications for MPP tracking. Sol. Energy 2016, 139, 489–505. [Google Scholar] [CrossRef]
  13. Ashouri-Zadeh, A.; Toulabi, M.; Dobakhshari, A.S.; Taghipour-Broujeni, S.; Ranjbar, A.M. A novel technique to extract the maximum power of photovoltaic array in partial shading conditions. Int. J. Electr. Power Energy Syst. 2018, 101, 500–512. [Google Scholar] [CrossRef]
  14. Ahmad, J. A fractional open circuit voltage based maximum power point tracker for photovoltaic arrays. In Proceedings of the 2010 2nd International Conference on Software Technology and Engineering, San Juan, PR, USA, 3–5 October 2010; Volume 1, p. V1-247. [Google Scholar]
  15. Noguchi, T.; Togashi, S.; Nakamoto, R. Short-current pulse-based maximum-power-point tracking method for multiple photovoltaic-and-converter module system. IEEE Trans. Ind. Electron. 2002, 49, 217–223. [Google Scholar] [CrossRef]
  16. Sher, H.A.; Murtaza, A.F.; Noman, A.; Addoweesh, K.E.; Al-Haddad, K.; Chiaberge, M. A new sensorless hybrid MPPT algorithm based on fractional short-circuit current measurement and P&O MPPT. IEEE Trans. Sustain. Energy 2015, 6, 1426–1434. [Google Scholar]
  17. Nedumgatt, J.J.; Jayakrishnan, K.B.; Umashankar, S.; Vijayakumar, D.; Kothari, D.P. Perturb and observe MPPT algorithm for solar PV systems-modeling and simulation. In Proceedings of the 2011 Annual IEEE India Conference, Hyderabad, India, 16–18 December 2011; pp. 1–6. [Google Scholar]
  18. Ishaque, K.; Salam, Z.; Lauss, G. The performance of perturb and observe and incremental conductance maximum power point tracking method under dynamic weather conditions. Appl. Energy 2014, 119, 228–236. [Google Scholar] [CrossRef]
  19. Abdel-Salam, M.; El-Mohandes, M.T.; El-Ghazaly, M. An Efficient Tracking of MPP in PV Systems Using a Newly-Formulated P&O-MPPT Method Under Varying Irradiation Levels. J. Electr. Eng. Technol. 2020, 15, 501–513. [Google Scholar] [CrossRef]
  20. Sera, D.; Mathe, L.; Kerekes, T.; Spataru, S.V.; Teodorescu, R. On the perturb-and-observe and incremental conductance MPPT methods for PV systems. IEEE J. Photovolt. 2013, 3, 1070–1078. [Google Scholar] [CrossRef]
  21. Rezk, H.; Eltamaly, A.M. A comprehensive comparison of different MPPT techniques for photovoltaic systems. Sol. Energy 2015, 112, 1–11. [Google Scholar] [CrossRef]
  22. Belkaid, A.; Colak, I.; Isik, O. Photovoltaic maximum power point tracking under fast varying of solar radiation. Appl. Energy 2016, 179, 523–530. [Google Scholar] [CrossRef]
  23. Yilmaz, U.; Kircay, A.; Borekci, S. PV system fuzzy logic MPPT method and PI control as a charge controller. Renew. Sustain. Energy Rev. 2018, 81, 994–1001. [Google Scholar] [CrossRef]
  24. Al-Majidi, S.D.; Abbod, M.F.; Al-Raweshidy, H.S. A novel maximum power point tracking technique based on fuzzy logic for photovoltaic systems. Int. J. Hydrogen Energy 2018, 43, 14158–14171. [Google Scholar] [CrossRef]
  25. Rizzo, S.A.; Scelba, G. ANN based MPPT method for rapidly variable shading conditions. Appl. Energy 2015, 145, 124–132. [Google Scholar] [CrossRef]
  26. Lasheen, M.; Rahman, A.K.A.; Abdel-Salam, M.; Ookawara, S. Performance enhancement of constant voltage based MPPT for photovoltaic applications using genetic algorithm. Energy Procedia 2016, 100, 217–222. [Google Scholar] [CrossRef] [Green Version]
  27. Tajuddin, M.F.N.; Ayob, S.M.; Salam, Z.; Saad, M.S. Evolutionary based maximum power point tracking technique using differential evolution algorithm. Energy Build. 2013, 67, 245–252. [Google Scholar] [CrossRef]
  28. Liu, Y.-H.; Huang, S.-C.; Huang, J.-W.; Liang, W.-C. A particle swarm optimization-based maximum power point tracking algorithm for PV systems operating under partially shaded conditions. IEEE Trans. Energy Convers. 2012, 27, 1027–1035. [Google Scholar] [CrossRef]
  29. Blange, R.; Mahanta, C.; Gogoi, A.K. MPPT of solar photovoltaic cell using perturb & observe and fuzzy logic controller algorithm for buck-boost DC-DC converter. In Proceedings of the 2015 International Conference on Energy, Power and Environment: Towards Sustainable Growth (ICEPE), Shillong, India, 12–13 June 2015; pp. 1–5. [Google Scholar]
  30. Radjai, T.; Gaubert, J.P.; Rahmani, L.; Mekhilef, S. Experimental verification of P&O MPPT algorithm with direct control based on Fuzzy logic control using CUK converter. Int. Trans. Electr. Energy Syst. 2015, 25, 3492–3508. [Google Scholar]
  31. Radjai, T.; Rahmani, L.; Mekhilef, S.; Gaubert, J.P. Implementation of a modified incremental conductance MPPT algorithm with direct control based on a fuzzy duty cycle change estimator using dSPACE. Sol. Energy 2014, 110, 325–337. [Google Scholar] [CrossRef]
  32. Study of Characteristics of Single and Double Diode Electrical Equivalent Circuit Models of Solar PV Module|IEEE Conference Publication|IEEE Xplore. Available online: https://ieeexplore.ieee.org/abstract/document/7503362?casa_token=UATpLRGRfV4AAAAA:EVz6Gd35RDU6E6z5O5idPZW3UnX0Nkh74522Sl4yj239Z2C-F8sPOfJBIym9Oodo5CpFA7_vtGgB (accessed on 2 April 2022).
  33. Farahani, M.; Shamsi-nejad, M.A.; Najafi, H.R. Design and construction of a digital solar array simulator with fast dynamics and high performance. Sol. Energy 2020, 196, 319–326. [Google Scholar] [CrossRef]
  34. Yilmaz, U.; Turksoy, O.; Teke, A. Improved MPPT method to increase accuracy and speed in photovoltaic systems under variable atmospheric conditions. Int. J. Electr. Power Energy Syst. 2019, 113, 634–651. [Google Scholar] [CrossRef]
  35. Mutoh, N.; Ohno, M.; Inoue, T. A Method for MPPT Control While Searching for Parameters Corresponding to Weather Conditions for PV Generation Systems. IEEE Trans. Ind. Electron. 2006, 53, 1055–1065. [Google Scholar] [CrossRef]
  36. Bellia, H.; Youcef, R.; Fatima, M. A detailed modeling of photovoltaic module using MATLAB. NRIAG J. Astron. Geophys. 2014, 3, 53–61. [Google Scholar] [CrossRef] [Green Version]
  37. Kim, J.-W.; Choi, H.-S.; Cho, B.H. A novel droop method for converter parallel operation. IEEE Trans. Power Electron. 2002, 17, 25–32. [Google Scholar]
  38. Dokić, B.L.; Blanuša, B. Power Electronics: Converters and Regulators; Springer: Berlin/Heidelberg, Germany, 2014. [Google Scholar]
Figure 1. Single-Diode equivalent circuit of PV cell.
Sustainability 14 07699 g001
Figure 2. The PV panel characteristics (a) I–V characteristics (b) P–V characteristics.
Sustainability 14 07699 g002
Figure 3. Block diagram of the designed system.
Sustainability 14 07699 g003
Figure 4. Characteristic curves with different conductance.
Sustainability 14 07699 g004
Figure 5. Conductance vs. Normalized current.
Sustainability 14 07699 g005
Figure 6. Normalized current (α) vs. PV current ( I P V ).
Sustainability 14 07699 g006
Figure 7. Flowchart of the proposed MPPT algorithm.
Sustainability 14 07699 g007
Figure 8. Actual and estimated I–V and P–V curves under various solar irradiance.
Sustainability 14 07699 g008
Figure 9. Actual solar irradiance vs. estimated solar irradiance and the power delivered to the load.
Sustainability 14 07699 g009
Figure 10. Simulation results of the dynamics for the proposed system under step changes in solar irradiance and load.
Sustainability 14 07699 g010
Table 1. PV Module Parameters.
ParameterValue
Maximum Power (PMP)212.86 W
Voltage at MP (VMP)29 V
Current at MP (IMP)7.34 A
Open Circuit Voltage (VOC)36.3 V
Short Circuit Current (ISC)8 A
Temperature Coefficient of ISC0.027%/°C
Temperature Coefficient of Power−0.23107%/°C
Table 2. Boost converter parameters.
ParameterValue
Switching frequency (fS)20 kHz
Inductor1.5 mH
Capacitor400 μ F
Table 3. Actual I–Vs curve vs. estimated I–V curves parameters at T = 25 °C.
Irr
(W/m2)
Ir_es
(W/m2)
Relative ErrorISC
(A)
ISC_es
(A)
VOC
(V)
VOC_es
(V)
IMP
(A)
IMP_es
(A)
VMP
(V)
VMP_es
(V)
PMP
(W)
PMP_es
(W)
Efficiency
1000100008.008.0036.3036.307.347.3429.0029.00212.86212.86100%
900907.30.8%7.207.2636.0636.156.656.6628.9128.88192.40192.3499.96%
800812.31.51%6.406.4935.8836.005.885.9629.2128.76171.70171.499.8%
700715.32.14%5.605.7235.7435.805.155.2529.2828.6150.70150.1599.6%
600616.32.64%4.804.9335.4635.604.424.5229.2728.43129.50128.6099.3%
Table 4. Actual I–Vs curve vs. estimated I–V curves parameters at T = 45 °C.
Irr
(W/m2)
Ir_es
(W/m2)
AccuracyISC
(A)
ISC_es
(A)
VOC
(V)
VOC_es
(V)
IMP
(A)
IMP_es
(A)
VMP
(V)
VMP_es
(V)
PMP
(W)
PMP_es
(W)
Efficiency
1000984.41.58%8.197.7233.6933.217.397.3426.5026.53195.80194.8099.49%
90090007.377.0633.5033.096.686.7426.5126.43177.10178.3099.32%
800805.80.72%6.556.3233.3232.945.966.0326.5126.31158.00158.8099.50%
700708.91.26%5.735.5633.1132.775.235.3026.5226.18138.70139.0099.78%
600610.21.67%4.914.7432.8532.554.54.5726.4726.01119.10118.9099.83%
Publisher’s Note: MDPI stays neutral with regard to jurisdictional claims in published maps and institutional affiliations.

