Article

Research on Evolution Characteristics and Factors of Nordic Green Patent Citation Network

1
College of Transportation Engineering, Dalian Maritime University, Dalian 116026, China
2
School of Maritime Economics and Management, Dalian Maritime University, Dalian 116026, China
*
Author to whom correspondence should be addressed.
Sustainability 2022, 14(13), 7743; https://doi.org/10.3390/su14137743
Submission received: 17 May 2022 / Revised: 17 June 2022 / Accepted: 22 June 2022 / Published: 24 June 2022

Abstract

:
Dealing with the environmental and climate risks caused by global warming has become a global consensus. As a sensitive area with particularly fragile ecological environment, the Nordic countries took the lead in making the commitment of “carbon neutrality” by the middle of this century. The green industry will play an important role during this process. Based on the patent data related to the green industry in Nordic countries, this paper studies the evolution characteristics and dynamic changes of influencing factors of patent citation network from 1980 to 2019 by using the social network analysis method and exponential random graph model. The research results show that: Nordic green technologies have gradually changed from passive development to active innovation from the source, and gradually diversified and subdivided in the development process; the connectivity and transitivity of the patent citation network are good and relatively stable in the evolution process; the connections of Nordic countries with non-Nordic countries are strong and gradually spread to distant regions; the awareness of patent property rights protection has gradually increased, and industry and academia are increasingly integrated, which all promote the formation of patent citation relationship.

1. Introduction

With the increasing frequency of human activities, the environmental and climate risks brought about by global warming have become increasingly significant, and the pursuit of sustainability and green growth has become a key issue for both developed and developing countries [1]. As an area that entered the sequence of developed countries earlier, the five Nordic countries are always known for their leading technology and developed economy, but their development has always been limited by the geographical location of fragile ecology. If the Nordic countries want to seek stable development, it is necessary to strengthen the concept of green development and promote sustainable ecological development. In fact, as a capitalist country with a highly developed economy and a powerhouse of science and technology, the Nordic countries have already actively carried out green actions, increased investment in green technology, and promoted the development of green industries. In recent years, Nordic countries have formulated carbon tax policies and a series of environmental protection bills gradually reducing the use of fossil energy, and continuously improving the utilization proportion of clean energy such as wind energy, nuclear energy, and geothermal energy. In addition, the treatment technology and recycling system of garbage, wastewater, and other related wastes are becoming more and more standardized. With the deepening awareness of environmental protection in Nordic countries, the development of green technology is not limited to the field of energy but is further extended to construction, transportation, agriculture, and other aspects, in order to alleviate environmental problems from multiple perspectives. In the long-term development, the Nordic countries have long been the pioneers of the global “green wave” and their achievements in green innovation are obvious to all. The data in The 2021 Global Energy Innovation Index: National Contributions to the Global Clean Energy Innovation System, published by the Information Technology & Innovation Foundation (ITIF), show that Finland, Denmark, and Sweden are the top three countries in global energy innovation index (GEII), revealing their outstanding contributions to clean energy innovation. The 2022 environmental performance index (EPI) jointly published by Yale Center for Environmental Law & Policy (Yale University) and Center for International Earth Science Information Network (Columbia University), also indicates that Denmark, Finland, Sweden, and Iceland rank in the top 10 among 180 countries, and Norway ranks in the top 20 [2]. It can be seen that the Nordic countries have shown a good sustainable development trend as a whole, and some of their experiences may be universally applicable to promote global green development.
The concept of the green industry, as stated by the United Nations Development Programme (UNDP), refers to products, equipment, services, and technologies that prevent and reduce pollution, such as solar energy, geothermal energy, wind energy, public transportation, and other transportation or other equipment, products, technologies and services that can save energy, reduce resource investment, and improve efficiency. The development of this emerging industry is inseparable from innovation, and technological and non-technological ecological innovations are the main manifestation of the innovation process of sustainable development (ecological innovation) [3]. To study the development profile and evolution of the Nordic green industry, there is a necessity to begin with its technological development process. The patent is an important information source of the development trend of technology and an important output of technological innovation which can reflect the innovation status, capability, and connection of different countries or regions and different technological fields. The patent citation information can be used to analyze technology valuation, impact, or diffusion [4]. Therefore, building a patent citation network based on patent citation information can more intuitively present the diffusion, connection, and development of technologies, and also facilitate the understanding of the technological path and related influencing factors in Nordic countries’ green industry development, so as to provide some experience and suggestions for developing countries that are backward in green industry development. At present, the academic circles have carried out networked research on technology diffusion and knowledge spillover in many fields [5,6,7], but the research on technology diffusion of green industries in the Nordic region is still relatively scarce. This paper develops a systematic analysis based on this research object, and the contributions are as follows: (1) The patent citation network of the green industry in Nordic countries is constructed, and the evolution characteristics of green industry-related patents in Nordic countries from 1980 to 2019 are analyzed from a dynamic perspective, which enriches the research on green industry. (2) The exponential random graph model is introduced to make a dynamic comparative analysis of the influencing factors of the Nordic green patent citation network, which expands the application scenario of the exponential random graph model and effectively studies the formation mechanism of the network.

2. Literature Review

Patents contain a large amount of technological innovation knowledge, and are also an important manifestation of technological innovation capabilities, providing a valuable source of information for technological development and innovation activities [8]. Academia and industry have conducted extensive research on subject cooperation [9], innovation performance [10], and other aspects in combination with these patent information, providing some policy suggestions for stimulating the innovation vitality of enterprises, industries, and countries. After the exploration of patent information has become more and more mature, the cooperation between patents and the flow of technology has received more extensive attention, and the patent citation network that highlights the technological flow and knowledge spillover has gradually entered people’s field of vision. Regarding the citation network, it was initially based on the perspective of Bibliometrics [11] to study the citation relationship between different documents. Subsequently, some scholars applied network analysis to patent citation research, which triggered a research upsurge in combining patent citation and network analysis [12]. After that, the patent citation network has played an irreplaceable role in the research on technological flow and knowledge spillover.
In the academic research process, patent citations are regarded as an important indicator that can effectively measure the reliability and validity of patents [13]. It is a useful approach to identifying the technological knowledge flow from one country, institution, or company to another [14]. When building a patent citation network, the most widely used indicator related to patent citations is the total number of citations [15], and the indicators commonly used to define the direction of patent citations are divided into forward citation and backward citation. Forward citation refers to the number of times a patent is cited by subsequent patents, which can reflect the quality of the patent [16]. Backward citation refers to the number of times this patent cites previous patent documents [17], with the advantage of being fixed over time, and can be used to assess the novelty of a technology [18]. Based on the above basic indicators, that is, the number of patent citations and the direction of patent citations, the prototype of the patent citation network can be constructed. Based on this basic network, academia has conducted further research on the patent citation network.
Some scholars have expanded the scope of patent research, focusing on multinational patent citation information. Due to the openness and accessibility of patent information, the knowledge and technological information of patents could flow without geographical restrictions, and correspond to the information exchange between different countries [19], thus the research on transnational patents is increasingly enriched. In order to avoid the duplication of international patent information collection, most scholars choose to select the information of a specific patent office to conduct international patent information research, such as EPO, USPTO, JPO, CNIPA, etc. Meanwhile, some scholars have constructed a patent citation network based on patent family information [20], which is also an effective means to study transnational patents. Additionally, there are also scholars conducting an in-depth analysis of the practical significance of patent citation networks based on the characteristics of topological networks. Some of them focus on studying the network characteristics [21] of patent citation networks such as small-world and scale-free. Some scholars have studied the technology trajectory of a specific industry in combination with the characteristics of the patent citation network [22]. Other scholars have discussed the knowledge flow of patent citation network and its practical significance from the perspectives of patent documents, affiliated institutions, technological fields, and countries [23].
After constructing the patent citation network and analyzing its characteristics, more and more scholars began to explore the factors affecting the formation of patent citation relationship, that is, the formation mechanism of patent citation relationship.
At this stage, most scholars have seen the impact of patent-related attribute characteristics on patent citation [24]. With the deepening of the research on patent citation relationship especially by social network analysis method, some scholars have found that some local or overall structural features of the patent citation network itself or others will have an impact on the citation relationship [21]. At the same time with the research on the influencing factors of patent citation, there is also a heated discussion on the research methods. At the beginning of the research, the statistical inference method of patent citation is based on attribute data and the independence hypothesis. Most scholars choose to use logit regression [25], logistic regression [26], and Zero-Inflated Poisson regression [27] for analysis. At this stage, regression analysis is often combined with the independence hypothesis, that is, multiple independent variables are required to be relatively independent and there cannot be high linear correlation, so as to avoid the problem of “multicollinearity”, otherwise the significance test of variables will lose its significance and the prediction function of the model will also fail. However, the basic unit of patent citation network analysis is the relationship between patent pairs. In this case, it is unreasonable to set the independence hypothesis. Subsequently, some scholars put forward some methods to solve the correlation test between attributes and relational variables. The most common method is Quadratic Assignment Procedure (QAP) [28], which can include attribute data through a certain form of network transformation, study the similarity between a network and multiple networks, and solve the correlation evaluation between relational data to a certain extent. However, this method still has some problems for more complex scenario applications. For example, it cannot carry out mixed measurements based on weighted and binary attribute features. In order to solve the problems of QAP and other models, some scholars have introduced the Exponential Random Graph Model (ERGM) into the discussion of patent citation network [29]. ERGM can directly model the network mechanism, rather than acting as an agent of the dependence between observations. Meanwhile, it can comprehensively consider the endogenous and exogenous variables formed by the network, and verify whether there is model degradation by adding dependencies, which greatly improves the accuracy of parameter estimation.
In addition, by combing the literature related to the green industry, it can be found that most of the early scholars linked it to horticulture, nursery, and other related industries [30], and the research scope was relatively limited. With the increasingly severe environmental problems, the concept of the green industry has gradually matured, and more and more scholars have expanded the connotation and extension of “green industry” from the traditional agriculture and forestry to the industry and service and equated “green industry” with environment-friendly and sustainable industry, including energy conservation, emission reduction, renewable energy, green transportation, green agriculture, and other industries. On this basis, a large number of scholars focus on green innovation [31], green economy [32], and green performance [33], which are inseparable from the development of green technology. When analyzing the diffusion, development, and innovation of green technology, many scholars use patent data. Some scholars have studied energy storage technology [34], solar photovoltaic [35], green building [36], green agriculture [37], and other related fields by combining patent citation network.
In a word, there are still some research gaps in the research on Nordic green patent citation network: (1) The current research is lacking in the analysis of the patent citation network from the perspective of dynamic evolution. At present, the characteristic analysis of the patent citation network mostly focuses on the static perspective. Although it can intuitively show the current situation of technology development and the network characteristics, it is difficult to reflect on the evolution process and changes in patent citation network and its technology diffusion. (2) The research method of influencing factors of patent citation network is relatively backward. At present, the research on the influencing factors of patent citation network mostly focuses on the traditional regression model and quadratic assignment procedure. In these studies, there is often a lack of consideration of the endogenous variables of the network, and there is a certain problem of model degradation. The exponential random graph model has been used in the research of network mechanisms in many fields such as medicine [38], R & D cooperation [39], and population mobility [40]. It considers the endogenous and exogenous variables of the network, and can effectively improve the accuracy of variable result estimation. However, there is still a certain gap in the research of patent citation network. (3) The research on the evolutionary process of the whole green industry is relatively scarce. At present, most of the research on the green industry focuses on a certain technology or a certain field, but few scholars study the technological flow of the green industry from the overall perspective. Therefore, based on the above research status and research gaps, this paper focuses on the development of the green industry in Nordic countries, analyzes the dynamic evolution of its technological flow from the perspective of the patent citation network, and introduces ERGM to study the influencing factors of the network.

3. Data Sources and Research Methods

3.1. Data Collection and Processing

3.1.1. Data Sources and Retrieval Strategies

Since this paper analyzes the transnational flow of technology, in order to maintain a certain degree of consistency, reliability, and comparability, it is necessary to choose one patent system instead of several patent systems from different patent offices [41], and as a technological indicator, US patents are considered the most reliable [42]. Therefore, considering the quality and publicity of patents [43], this study uses the patents granted by the United States Patent and Trademark Office (USPTO) from 1980 to 2019 as the initial data set. The specific processing steps of the data are as follows.
First, extract all patents whose nationality of the first patent application is the Nordic countries (Sweden, Denmark, Norway, Finland, Iceland) from the data set. Second, refer to the IPC and other classification systems to define the data range [44]. Combined with the Green Inventory issued by WIPO, which includes alternative energy production, transportation, energy conservation, waste management, agriculture/forestry, administrative, regulatory or design aspects, and nuclear power generation, the patent classification list related to green industries [45] can be determined. Then search and screen the patents of the green industry in Nordic countries through the selected IPC classification number to obtain the “Nordic Green Patent”. Finally, take the Nordic green patent as the benchmark data, retrieve its citing and cited patents, delete the patents unrelated to the green industry, and obtain the citing and cited patent data of Nordic green patents.

3.1.2. Data Analysis

Through data processing and analysis, the overview of Nordic green patents is shown in Figure 1.
It can be seen from Figure 1 that the number of Nordic green patents has increased significantly since 2010. Therefore, the period 2010–2019 is divided into one stage for research. At the same time, considering the comparability of periods, each decade from 1980 to 2009 is taken as a time window to study its evolution characteristics. This paper consists of four stages: 1980–1989, 1990–1999, 2000–2009, and 2010–2019 and studies the citations of Nordic green patents in each stage. Combined with the Nordic green patents and their citing patents and cited patents in each stage, this paper builds the Nordic green patent citation network at each stage and explores the flow and evolution characteristics of Nordic green patents in international technological activities.
By further analyzing the Nordic green patent and its citing and cited data in four stages, the statistical results are obtained and shown in Table 1.
From Table 1, it can be seen that in the early stage, green patents have just emerged. Although the number is small, the patents have a great influence and have been cited by subsequent patents more than 13 times on average, which has played a fundamental role in the development of Nordic green technology. In the later stage, the number of patents shows a blowout trend especially from 2010 to 2019. At this stage, the patent foundation is relatively solid, and citing patents is more than seven times on average. Many patent documents are cited, indicating that the early patents played an important supporting role in the development of later technologies, which reflects the continuity of the patent citation relationship and conforms to the objective laws of technological development.

3.2. Social Network Analysis

Social network analysis (SNA) is a method to study social relations and structures, mainly focusing on the internal network between different social actors [46]. It is a quantitative analysis method developed by sociologists based on mathematical methods, graph theory, etc. It can not only describe the aggregation degree and average path of the network as a whole but also examine the interaction between nodes, which provides strong technological support for further insight into the characteristics of the patent network. Some scholars have applied social network analysis to patent network analysis [12], and some scholars have further combined it with patent citation data for analysis [47]. At this stage, it is relatively mature to study the patent citation network through the social network analysis method. Using this method to study the evolution of the patent citation network also has its advantages. The evolution characteristics of the network can be shown from the statistical indicators and its visual presentation. In this study, the social network analysis method is mainly used to analyze the citation relationship of green patents in Nordic countries in the whole network, and study the evolution law of the Nordic green patent citation network from the perspectives of topological network characteristics, core nodes, and core network.

3.2.1. Topological Network Analysis

Topological network analysis refers to using various methods to describe the topology structure of the network. Assessing node importance from the perspective of topology is a common method in patent research [48], and network topology analysis can provide information for a better understanding of the structure of large-scale networks and the process of knowledge propagation in patent citation networks [49]. This paper studies the overall characteristics of the network from the following measures.
  • Network scale: It refers to the number of nodes and edges in the network, indicating the coverage scale of the network.
  • Average degree: It refers to the average number of connections between any node in the network and other nodes, including the out-degree (the number of times it is cited by other nodes) and the in-degree (the number of times it is citing other nodes), indicating the influence range of network nodes.
  • Network diameter: It refers to the maximum value of the shortest path between any two nodes in the network, indicating the reach-ability between nodes.
  • Average path length: It refers to the average value of the shortest path between any two nodes in the network, indicating the accessibility, transitivity, and connectivity of nodes.
  • Clustering coefficient: It refers to the degree of interconnection between adjacent nodes of a node. For a single node, the clustering coefficient is the ratio of the actual number of connected edges between its adjacent nodes to the number of edges connected when all adjacent nodes are connected to each other. For the overall network, the clustering coefficient value is the average of the clustering coefficients of a single node. In order to study the characteristics of the overall network, this paper adopts the overall network clustering coefficient, which reveals the degree of aggregation between network nodes.
  • Connected component: It refers to the number of weakly connected independent sub-networks in the network, indicating how many small groups that are more closely connected exist in the network.

3.2.2. Analysis of Key Nodes

The analysis of key nodes is mainly based on the measurement of degree values. By analyzing the out-degree and in-degree of nodes, this paper selects the top-ranked hubs and authorities in the network. The hub refers to a node with a high out-degree, that is, a node cited by many other nodes. In this study, it represents an upstream patent. The authority refers to a node with a high in-degree, that is, a node that citing many nodes. In this study, it represents a downstream patent.

3.2.3. Core Network Analysis

Due to the wide research scope, long time span, large amount of data, and sparse overall network, the network visualization effect including all nodes often cannot show the key characteristics. Based on this situation, this paper simplifies the network through k-core and extracts the core nodes and their edges in the network in order to better study the core characteristics of the network.

3.3. Exponential Random Graph Model and Variable Selection

3.3.1. Research Model Construction

The exponential random graph model (ERGM) comprehensively considers the endogenous factors such as network topology and the exogenous factors such as node attributes and node relationship covariates. The Markov chain Monte Carlo maximum likelihood estimation (MCMC MLE) is used to estimate the variable parameters, and the probability graph based on endogenous and exogenous factors is constructed through multiple iterations. The general form of ERGM is:
  P ( Y = y ) = ( 1 c ) exp {   k = 1 k θ k z k ( y ) }  
where Y is the simulation network generated by the model, y is the observation network, and P ( Y = y ) is the same probability between the model network and the observation network. 1 c is a normalized constant that ensures that the probability is always between 0 and 1 and that the sum of the probabilities of all possible networks is 1. Z k is the network statistics (i.e., network endogenous attributes, node attributes and node relationship covariates). θ k is the parameter corresponding to the network statistics, and k is the number of network statistics.
The final output parameter estimation result of the exponential random graph model is essentially a non-standardized logistic regression coefficient, which can be considered as the influence of model variables on the probability of forming edges and networks between network nodes. The significance test of the coefficient refers to the t distribution. The method to evaluate the fitting effect of the model refers to Akaike Information Criterion (AIC) and Bayesian Information Criterion (BIC) [50,51], and the basic formulas are:
A I C = 2 p 2 L L
B I C = p l n ( N ) 2 L L
where, LL is the log-likelihood estimation result of the model, p is the number of parameters in the model, and N is the sample size. In the process of parameter estimation, the model with smaller AIC and BIC is regarded as the better fitting.

3.3.2. Selection of Model Variables

In this paper, the citation relationship of Nordic green patents is studied by using network data and an exponential random graph model. ERGM holds that the network relationship is self-organized, which is affected not only by the network structure but also by the attributes of actors (the characteristic attributes of individuals) and other exogenous attributes (other relationships between actors). Based on its characteristics that endogenous and exogenous variables can be considered comprehensively, and considering the characteristics of Nordic green patents studied in this paper, the variables affecting the citation relationship of Nordic green patents are divided into three categories: network endogenous structure variables, node attribute variables, and node relationship covariates. According to these three kinds of variables, the static network forming factors in each stage are studied and dynamically compared.
The research variables selected in this paper are shown in Table 2.

4. Result Analysis

4.1. Evolution Characteristics of Nordic Green Patent Citation Network

This paper constructs a directed and unweighted citation network based on patent documents. The nodes represent patent documents. The edges represent citations between patent documents, and it points from the cited patent (upstream patent, technological foundation) to the citing patent (downstream patent, technological development), and the weight of the edge is 1. Based on the patent citation networks in four stages, this paper analyzes the evolution characteristics of the Nordic green patent citation network.

4.1.1. Evolution Analysis of Topological Network

By analyzing the four-stage patent citation networks, the topological measures are shown in Table 3.
It can be seen from Table 3 that the scale of the patent citation network is continuously expanding, and the number of nodes and edges has increased by about 1.5 times. The average degree, network diameter, and clustering coefficient are relatively stable with a slight change. The average path length is always at a low value, and the transitivity between nodes in the networks is always good. From the perspective of the connected component, there are many weakly connected sub-networks in the patent citation networks, indicating that the small groups have formed among patents, which increased sharply from 2010 to 2019. This may be because with the advancement of technology, the technological direction of patents is increasingly refined, and the citing and cited patents are highly targeted, which has promoted the formation of multiple small groups.

4.1.2. Evolution Analysis of Key Nodes

To further analyze the key nodes of the network, this paper uses Pajek to extract the hubs and authorities of the patent citation network, as shown in Table 4.
As can be seen from Table 4, in the first and second stages, the hubs and authorities of the Nordic green patent citation networks are mainly aimed at the prevention and control of mercury pollution, such as removing mercury vapor from exhaust gas (4273747A), extracting and recovering mercury from gas (4233274A), controlling mercury emissions (6855859B2), etc. This is mainly due to the accumulation of highly concentrated mercury-based air pollutants in Nordic countries located at high latitudes, and their diets are inseparable from fish and aquatic products, which is considered to be the main way of human methylmercury exposure [53]. Therefore, the Nordic countries have attached great importance to the prevention and control of mercury pollution as early as the end of the twentieth century, and the related technologies have also flourished. At the same time, it also shows that the early green industry in Nordic countries still focused on the most basic aspects of waste gas and wastewater treatment. The development of the green industry is narrow and belongs to passive green development, rather than technological innovation from the source. In the third stage, the clean energy utilization dominated by wind turbines (4357542A, 4565929A, 7061133B1) has become the hubs and authorities, which shows that the development of green industry in Nordic countries has changed from passive development to active development, and technological innovation is carried out from the source of energy consumption. The development of clean energy-related technologies is also inseparable from the “carbon tax” policy successively carried out by the Nordic countries in the late 20th century. This policy has been gradually strengthened and has greatly changed the energy consumption structure of the Nordic countries in the third stage. In other words, as an effective environmental and economic policy tool, “carbon tax” has played a positive role in reducing carbon emissions, decreasing energy consumption, and changing the energy consumption structure of Nordic countries. The patents which are hubs and authorities in the fourth stage have been effectively combined with artificial intelligence, such as robot cleaning device (10149430B2), autonomous surface cleaning robot (7761954B2), and other related patents, which shows that the combination of Nordic green industry and automation technology has gradually penetrated into all aspects of life.
Through further research on some hubs and authorities, it is found that 7361209B1, 8034163B1, and 7731780B1 all come from the same patent family, which indicates that there is a phenomenon of “prosperity for all” in patent citations, that is, patents in the same patent family may have similar technological influence or based on a similar technological foundation.

4.1.3. Evolution Analysis of Core Network

Since the patent citation network is a large sparse network, the overall network visualization effect is poor. In order to further show the core structure of the patent network, this paper simplifies the patent citation network by using the condition “k-core ≥ 4”, and constructs the patent citation core networks in different periods by using the Fruchterman Reingold layout algorithm [54], and divides the patent clusters according to the weakly connected relationship, which is shown in different colors, as shown in Figure 2.
After analyzing the patents of each cluster, it can be seen that:
First, the number of core patent clusters is gradually increasing. As can be seen from Figure 2, in each stage, there are several large patent clusters formed by a large number of patents with close relations, which represent the core compositions of the patents related to the Nordic green industry. The four stages form 7, 9, 19, and 27 clusters respectively, showing an obvious increasing trend, indicating that the Nordic green patent citation relationships are increasingly active and more closely connected.
Second, the technological fields of core patents are increasingly diversified. By analyzing the core patent clusters, it can be found that the technological directions of the patents in the same cluster are relatively similar. By analyzing the technological directions involved in the clusters at different stages, we can find that these technological directions gradually extend from traditional wastewater and gas treatment to green agriculture, renewable energy, and some other aspects, which means that the technological development of Nordic green patents is increasingly diversified and refined. Specifically, the core patents from 1980 to 1989 mainly include technologies such as nuclear reactor fuel element assembly, gas separation, biofuel, industrial wastewater treatment, and waste incineration. The core patents from 1990 to 1999 mainly involve technologies of gas separation, mobile source emission reduction, fixed waste treatment, photovoltaic power generation, etc. The core patents from 2000 to 2009 are mainly related to technologies of carbon capture and storage, green agricultural irrigation, nuclear reactor fuel element assembly, heat recovery, wind power generation, etc. The core patents from 2010 to 2019 mainly consist of technologies such as hybrid vehicle transmission, mobile source emission reduction, wind power generation, thermal energy storage, green nanometer, etc.
Third, the use of clean energy has always been the focus of the Nordic green industry. It has been involved in the core patents citation network at all stages, but the technological development has changed over time. Nuclear power generation started early and was one of the most important clean energy sources in the Nordic countries in the early years, but with the repeated occurrence of nuclear accidents, the Nordic countries gradually adopted other clean energy sources to replace nuclear energy for safety reasons. Biomass energy is also a clean energy and its application started earlier. However, unlike nuclear energy, biomass power generation technology has not weakened significantly over time. Instead, it continues to iterate and gradually forms a “Nordic model”, which not only solves waste management problems but also ensures power supply. Photovoltaic power generation and wind power technology have developed rapidly in recent years, and are likely to be the focus of clean energy in the Nordic countries in the future, which is inseparable from a series of preferential policies issued by the Nordic countries to encourage the use of these clean energy.
Fourth, the star topology in the core patent cluster has gradually increased, showing the importance of core patents has increased. From 1980 to 1989, there is no star topology in the seven core patent clusters, indicating that the importance of each patent in the clusters is relatively equal. With the passage of time, the star topology has gradually increased, and a small number of patents are frequently cited by other patents, while some patents are rarely cited, which reveals that there are more core patents in the core patent cluster, and a few patents have played a supporting role in the core patent cluster. The emergence of the star topology also shows that the part of patent citation networks presents the phenomenon of the “Matthew effect” or “propensity link”, and the core patents in the star topology in each period have brought a more lasting impact.

4.2. Influencing Factors of Nordic Green Patent Citation Network

4.2.1. Model Estimation

This paper selects the core citation network of Nordic green patents in four stages as the basic data, takes the network data added with node attributes and node relationship covariates as the research object, and uses the statnet package in R to estimate the parameters of the model, so as to explore the factors forming the network in each stage. The specific meanings of the terms have been introduced above.
In this paper, the variables are added step by step to observe the fitting effect of different models. The results show that the AIC and BIC of the model with node attribute variables, endogenous structure variables, and node relationship covariates are the smallest, which means the fitting effect is the best, and it is closer to the real network. Therefore, this paper uses that model to analyze the results, and summarizes the parameter estimation data of the four stages as shown in Table 5. Through vertical comparison, this paper analyzes the changes in influencing factors of the Nordic green patent citation network.

4.2.2. Analysis of Parameter Estimation Results

It can be seen from Table 5 that the variables affecting the Nordic Green Patent Citation Network show a certain trend. Through comparative analysis, it can be concluded that the dynamic changes of influencing factors of the Nordic green patent citation network are as follows:
(1)
The influence of network endogenous structure variables on the Nordic green patent citation relationship is relatively stable.
Twopath and transitiveties are significant in all stages, and the variation range is small, indicating that the connectivity and transitivity of the network are good. The Nordic green patent citation network always tends to be a closed triangular structure, and the composition of the network is also relatively stable. In the process of technology development, it pays more attention to the retroactive citation of technological foundations and has a good awareness of intellectual property protection.
Gwodegree is always significantly negative, indicating that not most nodes in the network can achieve network out-connections with a high probability, but only a few popular nodes have more out-connections [55], that is, there is always a preference for highly cited patents. As “star patents” in the Nordic green patent citation network, these highly cited patents play a key role in promoting the formation of citation relationship. At the same time, it should also be noted that in the four stages of this study, this variable shows a significantly decreasing trend, which provides a certain direction for the prediction of the future evolution trend of the network. The dominant position of highly cited patents in the network may soon disappear, and the resulting phenomenon of preferential attachment may also be weakened accordingly. The cited frequency of patents may be more balanced rather than focusing on highly cited patents, and Nordic green technology may develop toward a more diversified direction.
(2)
The node attribute variables that have an impact on the Nordic green patent citation relationship are gradually increasing.
The number of claims has gradually played a significant role in the formation of patent citation relationship. Overall, patents with a large number of claims have a greater probability of citing the technological foundation because of the standardization and preciseness of the application process. As for the cited probability, in the second and third stages, the patents with more claims are less likely to be cited, which reflects that the patents in the network are still in the state of their own business in the early stage, and the strategies adopted by patent applicants or patentees in patent citation are more inclined to actively avoid the claim scope of competitors [56], resulting in a lower cited probability for patents with more claims. In the fourth stage, with the vigorous development of green technology, the significant negative impact of the number of claims on the cited probability gradually disappears, indicating that the Nordic green industry began to adjust their strategies from competition to cooperation, which is also beneficial to the innovation of Nordic green technology.
The influence of the number of non-patent references on the formation of the Nordic green patent citation relationship has gradually changed from negative to positive. Although early patents still had a negative impact on the formation of patent citation relationship due to the disconnection between practice and theory, in the process of the development of Nordic green patents, the disconnection gradually decreases. During patent application, the substitution effect of non-patent documents and patent documents gradually weakens and the complementary effect gradually becomes apparent. This is inseparable from the huge funds invested by the Nordic countries to support environmental education and pollution research, as well as the deepening of industry-university cooperation, so as to further reflect the practical value of non-patent documents to patents. The cooperation between academia and industry will have positive implications for the further formation of the Nordic patent citation relationship and the innovation and diffusion of Nordic green technology.
The influence of patent family size on patent citation network is increasingly significant and gradually shows a positive impact. This shows that during the evolution of the network, patent applicants or patentees gradually become more aware of the layout and protection of intellectual property rights in multiple national patent offices, and they often spend a lot of energy on the layout in multiple regions, so the patents with a larger family size always have a greater value, which promotes the formation of patent citation relationship. In the subsequent development of the Nordic green patent citation network, the positive contribution of the patent family size to the patent citation relationship will be further manifested.
The regional heterogeneity effect is always significant, and the heterogeneous effect of the first three stages gradually increases, but it decreases in the fourth stage. It shows that the patents related to the Nordic green industry have always maintained active connections with countries or regions outside Northern Europe. Through the analysis of the original data, it can be found that this connection is mainly concentrated in the United States in the early stage. With the continuous development of relevant technologies and the increasingly severe climate problems, the Nordic countries have maintained such technological exchanges and cooperation with more countries outside the Nordic region. At the same time, it should also be noted that with the increasingly prominent environmental problems in the Arctic, the Nordic countries are facing consistent challenges and problems in similar location conditions, which also promotes the close connection between the Nordic countries in green industry-related technologies.
In the process of network evolution, the homogeneity effect between highly cited patents gradually shows a significantly negative phenomenon, which shows that the connection between highly cited patents is not close. As can be seen from the above analysis of the evolution characteristics of the Nordic green patent citation network, the technological fields involved in Nordic green patents are increasingly diversified, the technological directions are gradually subdivided, and there is an obvious clustering phenomenon. The negative homogeneity of cited frequency further indicates that each technological direction has a certain “leader”, that is, the highly cited patents in this direction or in this field. These patents play a prominent role in their respective “small groups”, but the patent citation relationship between different “small groups” is not close, which also indicates the development trend of technological differentiation of the Nordic green industry to a certain extent.
(3)
The influence of node relationship covariates on the Nordic green patent citation relationship is gradually significant.
The influence of patent technology network on patent citation relationship is always insignificant, indicating that whether patent citation pairs are in the same technological field will not have a significant impact on patent citation relationship. This may be because green technology itself is a complex technological field, its technological foundation covers a variety of related technologies and can involve many fields in the process of development. Therefore, there are no obvious barriers and obstacles between technological fields. With the continuous differentiation and development of green technology, the impact of the patent technology network on patent citation relationship may be gradually significant in the later evolution process.
The distance network has no significant impact in the first three stages, but it is significantly positive in the fourth stage. It shows that the distance does not have a great impact on the formation of the Nordic green patent citation relationship in the early stage, which is related to the fact that both the regions of technology source and diffusion are relatively fixed in these stages. With the continuous development of economic globalization and the increasing regional expansion of environmental problems, the pursuit of “carbon neutral” and green development has become a global issue. Under this background, the original relatively fixed technology diffusion regions may have been relatively saturated, while there is still some space for technology diffusion in distant countries. Thus, in the fourth stage, the farther the distance, the more likely the technology diffusion will occur, that is, the patent citation relationship will be formed. After analyzing the original data, it can be seen that in the fourth stage, the radiation range of Nordic green patents has been greatly expanded, and the radiation distance has also shown an obvious extension. This evolution characteristic is consistent with the positive impact of the distance network on patent citation relationship. According to the theory of technology diffusion, the positive impact of distance network on patent citation relationship may continue and is likely to usher in a period of rapid development, which provides an opportunity for a series of developing countries in East Asia, North Africa, and other regions to develop green technologies.
The impact of the time difference network on the patent citation relationship in the first three stages is not significant. This may be because in the early stage of technology development, green technology is still in the stage of exploration and development, and the sequence of publication years cannot fully represent the patent value. Therefore, the difference in patent publication years in these three stages cannot significantly impact the citation relationship. It is not until the fourth stage that the time difference network has a significant positive impact on the citation relationship, which is mainly due to the fact that the development of green technology has gradually entered the mature stage, the value of early patents is gradually reflected, and the impact on existing patents is also gradually manifested. Reflected in the patent citation network, the earlier the patent is, the more likely it is to be cited, and the easier it is to form the connection between the nodes in the patent citation network. In the subsequent development process, there may be a tendency to cite patents with time proximity due to the innovation of green technology, but with the further passage of time, the impact of the time difference network on patent citation relationship may return to positive again until the arrival of the next change.

4.2.3. Robustness Test

In order to prove the robustness of the model, the goodness-of-fit (Gof) is selected in this paper to test the fitting degree of the model [57], and the Edge-wise Shared Partners (ESP), a network structure indicator, is chosen to verify the matching between the simulated network and the real network. The specific test results are shown in Figure 3. In the figure, the black line represents the statistical results of the real network, and the box line diagram with the connected gray line represents the statistical results of the simulated network. As shown in Figure 3, the statistical results of the Nordic green patent core citation network and its simulated network in four stages do not show a large deviation, indicating that the simulated network constructed by the model can fit the real network well, and the estimation results of the exponential random graph are robust.

5. Conclusions and Prospects

5.1. Research Conclusions

This paper analyzes the Nordic green patent citation data from 1980 to 2019 using social network analysis, constructs the Nordic green patent citation network at each stage from three perspectives of topological network characteristics, core nodes, and core network, and analyzes the evolutionary characteristics of the Nordic green patent citation network under each perspective. The research shows that:
(1)
The technological fields involved in the patent citation network extend from the traditional wastewater and waste gas treatment to the utilization of clean energy and gradually interact with artificial intelligence. In other words, the development of the Nordic green industry has gradually changed from passive development to active innovation, indicating a change in its green development concept.
(2)
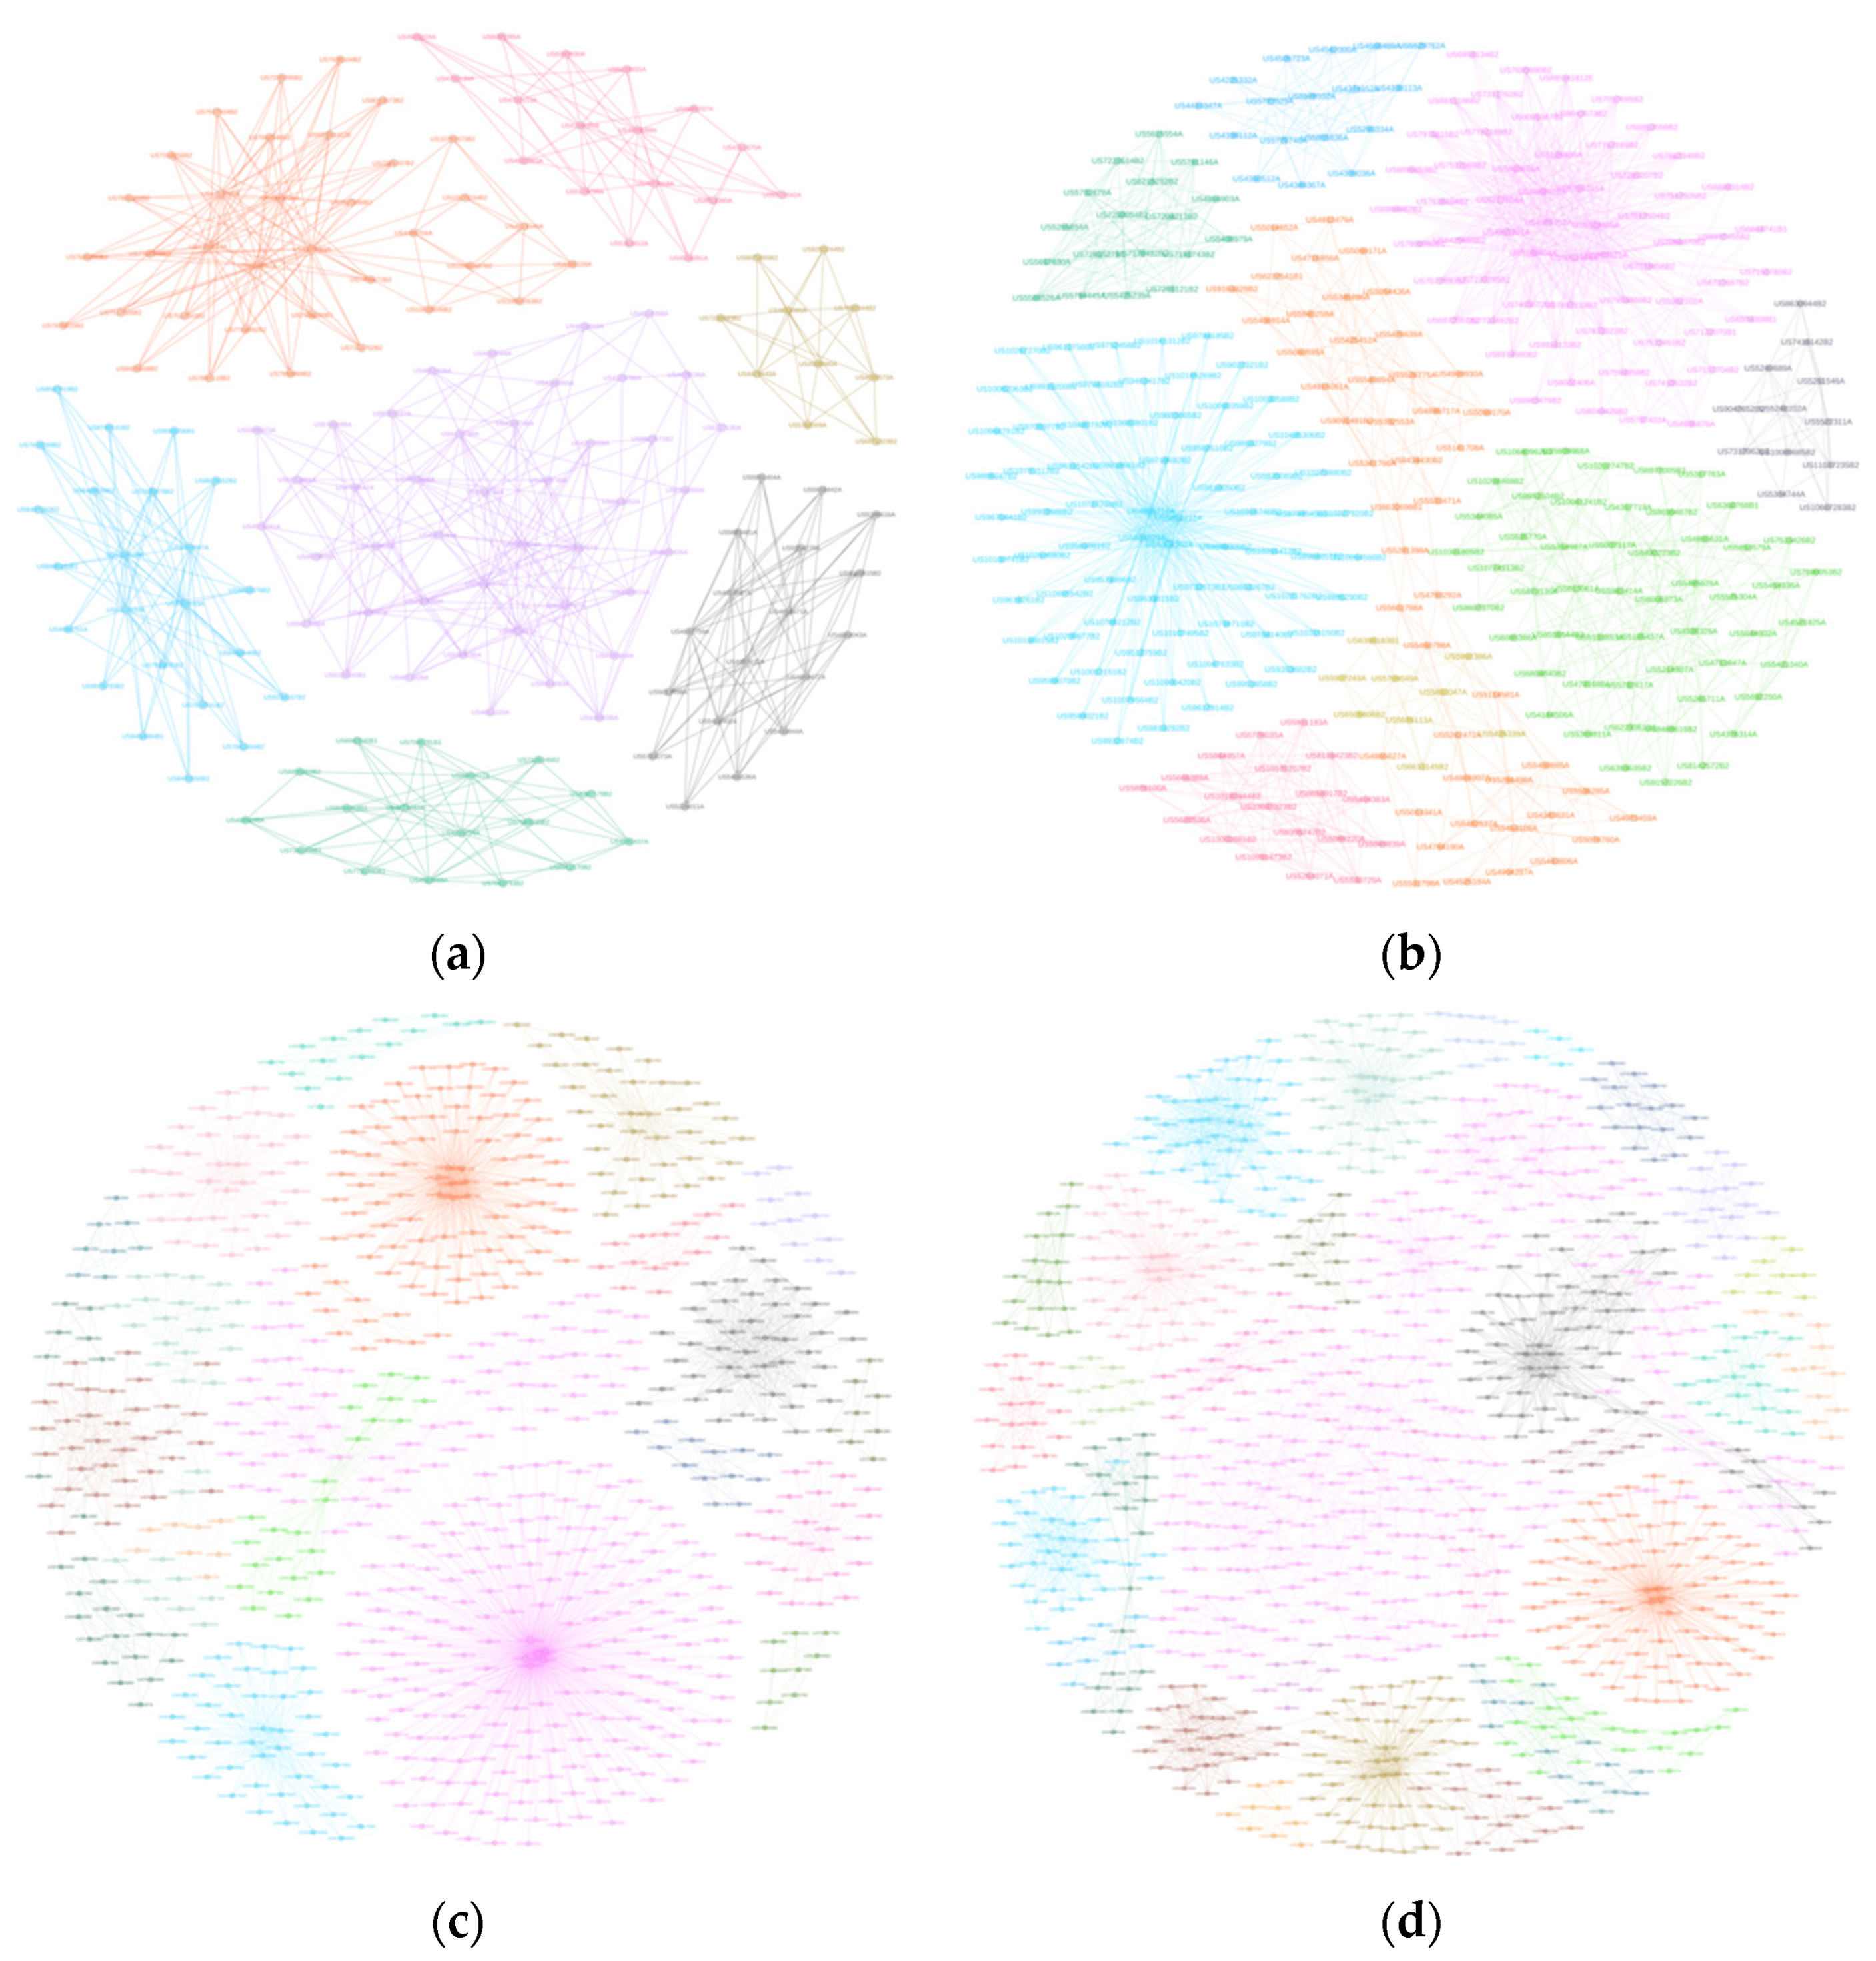
More relatively independent small groups are formed in the network, and a certain clustering effect is formed among patents of the same technological subject. With the passage of time, the number of small groups gradually increases, indicating that the technological subjects involved in Nordic green patents are increasingly diversified.
(3)
The core network shows an obvious cluster distribution, and the increase in the number of clusters indicates that the fields involved in core patents are becoming more and more abundant. The star topology in the clusters also indicates that there is a certain “propensity link” phenomenon for core patents.
In addition, this paper constructs an exponential random graph model to study the influencing factors of the Nordic green patent citation network in each stage in terms of endogenous structure variables, node attribute variables, and node relationship covariates, and conducts a dynamic comparative analysis of the network influencing factors from 1980 to 2019. The research shows that:
(1)
The Nordic green patent citation network has good connectivity and transitivity, always maintains a closed triangular structure, and is relatively stable in the evolution process.
(2)
The regional heterogeneity effect is always significant, and there is still space for long-distance technology diffusion. Nordic green industry-related patents always tend to form citation relationships with the relevant patents outside the region, and they do not exclude the exchanges and cooperation with countries or regions outside the region in green technology. And after the technology gradually matures, its diffusion range will gradually expand.
(3)
The nodes in the network tend to cite highly cited patents, but the connection between highly cited patents is not close. With the patent network gradually showing the trend of diversification and differentiation, several “small groups” have been formed gradually. The “Star patents” within the small groups are more likely to be cited, but the connection between different “small groups” is not close.
(4)
The higher the awareness of patent property protection, the more conducive to promoting the formation of patent citation relationship. No matter further improving patent claims or laying out patents in multiple patent offices, the deepening awareness of patent property protection can both be reflected. With the gradual standardization of the patent application process, patent applicants will be more inclined to adopting an active information disclosure strategy to avoid being in a disadvantageous position in litigation that may arise later due to incomplete information disclosure [58], which will further improve the probability of forming patent citation relationship.
(5)
In the process of technology diffusion, the integration of industry and academia is conducive to the formation of green patent citation relationship. In the development of Nordic green patents, the substitution effect between non-patent documents and patent documents has gradually weakened and the complementary effect has increasingly strengthened, and the integration of industry and academia has promoted the development of patent citation network.

5.2. Policy Implications

By analyzing the evolution characteristics and influencing factors of the Nordic Green Patent Citation Network, it can be found that the evolution process of its green industry is also worth learning by other developing countries with relatively backward green industry development. Therefore, based on the above conclusions, this paper proposes the following countermeasures for the green industry development in developing countries.
(1)
Strengthen industry–university cooperation.
The positive significance of industry–university cooperation in promoting technological innovation, mobility, and diffusion has become a consensus in academia. In the field of the green industry, the positive effect brought by industry–university cooperation has been verified again. At present, in order to enhance the innovation efficiency and diffusion speed of green industry-related technologies, it is more necessary to promote industry–university cooperation and the orderly docking of technology and knowledge. Specifically, on the one hand, the government should play a leading role in providing financial support for environmental education, pollution research, and other related green technologies, so as to improve the research level of universities and research institutes in related fields. On the other hand, universities should determine the development direction and cooperation focus in combination with their disciplinary advantages, development priorities, and capability structure. Furthermore, universities should also match the capability structure with the determined cooperation objectives based on the knowledge structure and technological capacity level of the cooperation subjects, so as to form a specialized division of labor pattern and differentiated development for different types of industry–university cooperation and innovation. In this process, a long-term mechanism of industry–university cooperation can be set up to actively promote the establishment of industry–university cooperative laboratories and university innovation practice bases related to green industries, to promote the further integration of green technology development at the theoretical and practical levels, and to accelerate the transformation of scientific and technological achievements.
(2)
Enhance the protection of patent property rights.
Strengthening the protection of patent property rights can effectively stimulate the vitality of market innovation, and promote the formation of patent citation relationships, so as to enhance technology diffusion and dissemination and the development of the green industry. To be specific, first, publicity and education should be strengthened to enhance the awareness of each subject in patent property protection. Second, corresponding laws and regulations should be improved to protect the legitimate rights and interests of the patentees. Third, a service platform for patent property rights is also supposed to be built. In doing so, the establishment of a service mechanism for the transformation of scientific and technological achievements combining the disclosure of scientific and technological inventions, business value evaluation, patent design application, and patent marketing should be paid much attention to in order to protect the scientific and technological innovation achievements. Fourth, training on relevant contents of patent property rights should be actively carried out, and the standardized behavior of patent applicants in the application process should be improved. Fifth, the filing of the application subjects’ core patents and important patents in multinational patent offices ought to be encouraged, and the protection of patent property rights ought to be enhanced so as to accumulate strength for the international exchange and cooperation of green technologies in various countries.
(3)
Strengthen international technological exchanges and cooperation.
Promoting sustainable green industry development has long become a global issue. On the one hand, in the initial stage of green industry development, it is necessary to strengthen international cooperation with leading countries in the green industry. Taking the Nordic countries as an example, the developing countries are confronted with some environmental problems today such as air pollution, lack of water resources, sewage purification, and so on, which have also been faced and addressed by the Nordic and other developed countries before. So, the technological exchange and cooperation between developing countries and Nordic countries in the green industry can effectively solve the existing problems. In addition, from the perspective of technology diffusion theory and practical development, there is still much space for cooperation between developing countries and Nordic countries, and there is still great potential for the development of green industries. Therefore, in the subsequent development process, countries with relatively backward green industry development can actively encourage their academia and industries to carry out technological exchanges with the relevant subjects in the Nordic countries, and vigorously promote the formation of technological cooperation in various fields. On the other hand, technological exchanges and cooperation with neighboring countries, especially those with similar geographical conditions should be further promoted. Neighboring countries or countries with similar geographical conditions often face common environmental problems and challenges. Technological exchanges with regional countries can help to learn from advanced experience, more specifically solve existing problems in relevant regions, avoid the occurrence of “acclimatization”, form a joint force in promoting regional green development, and alleviate national, regional, and even global environmental problems point by point. In order to better promote international technological exchange and cooperation, the government can actively play a leading role in building a favorable business environment, increasing the attraction of foreign investment, and encouraging academia and industries to actively carry out academic seminars and technological exchange activities.

5.3. Research Prospect

The patent citation network for the green industry is a complex knowledge system, involving the coordination and interaction of various factors such as technology, region, policy, region, and other factors. Although this paper has analyzed the evolutionary characteristics and influencing factors of the Nordic green patent citation network, it is still difficult to make an absolutely comprehensive interpretation and analysis. The research shortcomings of this paper and the prospect of the subsequent research work are as follows.
(1)
The research sample has certain limitations and can be further expanded in the follow-up study. The analysis of the green patent citation relationship in this paper mainly studies the Nordic countries. When selecting the research object, this paper mainly takes into account the environmental vulnerability of the Nordic region and the progressiveness of green industry development. However, when processing the data, it is found that the United States, Germany, Japan, and other countries also have outstanding performance in the technological development of the green industry. In the subsequent study, the scope of the research objects and the corresponding sample collection can be further expanded to include other countries with better development of green industries and countries with greater development potential.
(2)
The study of influencing factors still has limitations, and more variables can be included for discussion. In this paper, when studying the factors influencing the formation of patent citation relationship, several factors concerning endogenous structure, node attributes, and node relationship covariates have been included for discussion, but still not to the extent of being comprehensive. In the subsequent research process, more variables can be included in the ERGM for more comprehensive analysis and discussion.

Author Contributions

Conceptualization, Z.L., Y.W. and Z.D.; methodology, Z.D.; software, Y.W.; validation, Z.L., Y.W. and Z.D.; formal analysis, Y.W.; investigation, Y.W. and Z.D.; resources, Z.L. and Z.D.; data curation, Y.W.; writing—original draft preparation, Y.W. and Z.D.; visualization, Y.W.; supervision, Z.L. and Z.D.; project administration, Z.L.; writing—review and editing, Y.W. and Z.D. All authors have read and agreed to the published version of the manuscript.

Funding

This research was funded by the National Social Science Foundation of China [19FZZB013; 20VHQ012]; Liaoning Revitalization Talents Program [XLYC2004008].

Institutional Review Board Statement

Not applicable.

Informed Consent Statement

Not applicable.

Data Availability Statement

Not applicable.

Conflicts of Interest

The authors declare no conflict of interest.

References

  1. Benhaim, F.; Clarke, R.J. The green growth race. Organ. Econ. Coop. Dev. Obs. 2009, 273, 47. [Google Scholar]
  2. Wolf, M.J.; Emerson, J.W.; Esty, D.C.; de Sherbinin, A.; Wendling, Z.A. 2022 Environmental Performance Index; Yale Center for Environmental Law & Policy: New Haven, CT, USA, 2022. [Google Scholar]
  3. Rennings, K. Redefining innovation—Eco-innovation research and the contribution from ecological economics. Ecol. Econ. 2000, 32, 319–332. [Google Scholar] [CrossRef]
  4. Karki, M.M.S. Patent citation analysis: A policy analysis tool. World Pat. Inf. 1997, 19, 269–272. [Google Scholar] [CrossRef]
  5. Lee, S.; Kim, W. The knowledge network dynamics in a mobile ecosystem: A patent citation analysis. Scientometrics 2017, 111, 717–742. [Google Scholar] [CrossRef]
  6. You, D.; Park, H. Developmental trajectories in electrical steel technology using patent information. Sustainability 2018, 10, 2728. [Google Scholar] [CrossRef]
  7. Ferrari, V.E.; da Silveira, J.M.F.J.; Dal-Poz, M.E.S. Patent network analysis in agriculture: A case study of the development and protection of biotechnologies. Econ. Innov. New Technol. 2021, 30, 111–133. [Google Scholar] [CrossRef]
  8. Li, X.; Chen, H.; Zhang, Z.; Li, J.; Nunamaker, J.F. Managing knowledge in light of its evolution process: An empirical study on citation network-based patent classification. J. Manag. Inf. Syst. 2009, 26, 129–154. [Google Scholar] [CrossRef]
  9. Freeman, C. Networks of innovators: A synthesis of research issues. Res. Policy 1991, 20, 499–514. [Google Scholar] [CrossRef]
  10. Chen, Z.; Guan, J. The impact of small world on innovation: An empirical study of 16 countries. J. Informetr. 2010, 4, 97–106. [Google Scholar] [CrossRef]
  11. Cronin, B. The citation process. Role Significance Cit. Sci. Commun. 1985, 46, 86–87. [Google Scholar]
  12. Yoon, B.; Park, Y. A text-mining-based patent network: Analytical tool for high-technology trend. J. High Technol. Manag. Res. 2004, 15, 37–50. [Google Scholar] [CrossRef]
  13. Albert, M.B.; Avery, D.; Narin, F.; McAllister, P. Direct validation of citation counts as indicators of industrially important patents. Res. Policy 1991, 20, 251–259. [Google Scholar] [CrossRef]
  14. Yang, G.C.; Li, G.; Li, C.Y.; Zhao, Y.-H.; Zhang, J.; Liu, T.; Chen, D.-Z.; Huang, M.-H. Using the comprehensive patent citation network (CPC) to evaluate patent value. Scientometrics 2015, 105, 1319–1346. [Google Scholar] [CrossRef]
  15. Coombs, J.E.; Bierly, P.E., III. Measuring technological capability and performance. RD Manag. 2006, 36, 421–438. [Google Scholar] [CrossRef]
  16. Trajtenberg, M. A penny for your quotes: Patent citations and the value of innovations. Rand J. Econ. 1990, 12, 172–187. [Google Scholar] [CrossRef]
  17. Harhoff, D.; Scherer, F.M.; Vopel, K. Citations, family size, opposition and the value of patent rights. Res. Policy 2003, 32, 1343–1363. [Google Scholar] [CrossRef]
  18. Barirani, A.; Agard, B.; Beaudry, C. Discovering and assessing fields of expertise in nanomedicine: A patent co-citation network perspective. Scientometrics 2013, 94, 1111–1136. [Google Scholar] [CrossRef]
  19. Ye, X.; Zhang, J.; Liu, Y.; Su, J. Study on the measurement of international knowledge flow based on the patent citation network. Int. J. Technol. Manag. 2015, 69, 229–245. [Google Scholar] [CrossRef]
  20. TNakamura, H.; Suzuki, S.; Kajikawa, Y.; Osawa, M. The effect of patent family information in patent citation network analysis: A comparative case study in the drivetrain domain. Scientometrics 2015, 104, 437–452. [Google Scholar] [CrossRef]
  21. Chai, K.C.; Yang, Y.; Sui, Z.; Chang, K.-C. Determinants of highly-cited green patents: The perspective of network characteristics. PLoS ONE 2020, 15, e0240679. [Google Scholar] [CrossRef]
  22. Malhotra, A.; Zhang, H.; Beuse, M.; Schmidt, T. How do new use environments influence a technology’s knowledge trajectory? A patent citation network analysis of lithium-ion battery technology. Res. Policy 2021, 50, 104318. [Google Scholar] [CrossRef]
  23. Li, X.; Chen, H.; Huang, Z.; Roco, M.C. Patent citation network in nanotechnology (1976–2004). J. Nanopart. Res. 2007, 9, 337–352. [Google Scholar] [CrossRef]
  24. Petruzzelli, A.M.; Rotolo, D.; Albino, V. Determinants of patent citations in biotechnology: An analysis of patent influence across the industrial and organizational boundaries. Technol. Forecast. Soc. Chang. 2015, 91, 208–221. [Google Scholar] [CrossRef] [Green Version]
  25. Bakker, J. The log-linear relation between patent citations and patent value. Scientometrics 2017, 110, 879–892. [Google Scholar] [CrossRef]
  26. Criscuolo, P.; Verspagen, B. Does it matter where patent citations come from? Inventor vs. examiner citations in European patents. Res. Policy 2008, 37, 1892–1908. [Google Scholar] [CrossRef]
  27. Lee, Y.G.; Lee, J.D.; Song, Y.I.; Lee, S.-J. An in-depth empirical analysis of patent citation counts using zero-inflated count data model: The case of KIST. Scientometrics 2007, 70, 27–39. [Google Scholar] [CrossRef]
  28. Lee, W.J.; Lee, W.K.; Sohn, S.Y. Patent network analysis and quadratic assignment procedures to identify the convergence of robot technologies. PLoS ONE 2016, 11, e0165091. [Google Scholar] [CrossRef] [Green Version]
  29. Chakraborty, M.; Byshkin, M.; Crestani, F. Patent citation network analysis: A perspective from descriptive statistics and ERGMs. PLoS ONE 2020, 15, e0241797. [Google Scholar] [CrossRef]
  30. Hall, C.R.; Hodges, A.W.; Haydu, J.J. The economic impact of the green industry in the United States. HortTechnology 2006, 16, 345–353. [Google Scholar] [CrossRef]
  31. Sun, Y.; Bi, K.; Yin, S. Measuring and integrating risk management into green innovation practices for green manufacturing under the global value chain. Sustainability 2020, 12, 545. [Google Scholar] [CrossRef] [Green Version]
  32. Li, J.; Pan, S.Y.; Kim, H.; Linn, J.H.; Chiang, P.-C. Building green supply chains in eco-industrial parks towards a green economy: Barriers and strategies. J. Environ. Manag. 2015, 162, 158–170. [Google Scholar] [CrossRef] [PubMed]
  33. Pipatprapa, A.; Huang, H.H.; Huang, C.H. The role of quality management & innovativeness on green performance. Corp. Soc. Responsib. Environ. Manag. 2017, 24, 249–260. [Google Scholar]
  34. Aaldering, L.J.; Song, C.H. Tracing the technological development trajectory in post-lithium-ion battery technologies: A patent-based approach. J. Clean. Prod. 2019, 241, 118343. [Google Scholar] [CrossRef]
  35. Wang, Y.; Urban, F.; Zhou, Y.; Chen, L. Comparing the technology trajectories of solar PV and solar water heaters in China: Using a patent lens. Sustainability 2018, 10, 4166. [Google Scholar] [CrossRef] [Green Version]
  36. Li, Y.; Rong, Y.; Ahmad, U.M.; Wang, X.; Zuo, J.; Mao, G. A comprehensive review on green buildings research: Bibliometric analysis during 1998–2018. Environ. Sci. Pollut. Res. 2021, 28, 46196–46214. [Google Scholar] [CrossRef]
  37. Liu, L.; Bai, X.; Jiang, Z. The generic technology identification of saline–alkali land management and improvement based on social network analysis. Clust. Comput. 2019, 22, 13167–13176. [Google Scholar] [CrossRef]
  38. Loyal, J.D.; Chen, Y. Statistical network analysis: A review with applications to the coronavirus disease 2019 pandemic. Int. Stat. Rev. 2020, 88, 419–440. [Google Scholar] [CrossRef]
  39. Ma, Y.; Yang, X.; Qu, S.; Kong, L. Research on the formation mechanism of big data technology cooperation networks: Empirical evidence from China. Scientometrics 2022, 127, 1273–1294. [Google Scholar] [CrossRef]
  40. Zhang, W.; Chong, Z.; Li, X.; Nie, G. Spatial patterns and determinant factors of population flow networks in China: Analysis on Tencent Location Big Data. Cities 2020, 99, 102640. [Google Scholar] [CrossRef]
  41. Ahuja, G.; Katila, R. Technological acquisitions and the innovation performance of acquiring firms: A longitudinal study. Strateg. Manag. J. 2001, 22, 197–220. [Google Scholar] [CrossRef]
  42. Leydesdorff, L.; Kushnir, D.; Rafols, I. Interactive overlay maps for US patent (USPTO) data based on International Patent Classification (IPC). Scientometrics 2014, 98, 1583–1599. [Google Scholar] [CrossRef] [Green Version]
  43. Hall, B.H.; Jaffe, A.B.; Trajtenberg, M. The NBER Patent Citation Data File: Lessons, Insights and Methodological Tools; NBER Working Papers; National Bureau of Economic Research: Washington, DC, USA, 2001. [Google Scholar]
  44. Borgstedt, P.; Neyer, B.; Schewe, G. Paving the road to electric vehicles—A patent analysis of the automotive supply industry. J. Clean. Prod. 2017, 167, 75–87. [Google Scholar] [CrossRef]
  45. Cecere, G.; Corrocher, N.; Gossart, C.; Ozman, M. Technological pervasiveness and variety of innovators in Green ICT: A patent-based analysis. Res. Policy 2014, 43, 1827–1839. [Google Scholar] [CrossRef]
  46. Wasserman, P.D. Advanced Methods in Neural Computing; John Wiley & Sons, Inc.: Hoboken, NJ, USA, 1993. [Google Scholar]
  47. Lee, P.C.; Su, H.N.; Wu, F.S. Quantitative mapping of patented technology—The case of electrical conducting polymer nanocomposite. Technol. Forecast. Soc. Chang. 2010, 77, 466–478. [Google Scholar] [CrossRef]
  48. You, H.; Li, M.; Hipel, K.W.; Jiang, J.; Ge, B.; Duan, H. Development trend forecasting for coherent light generator technology based on patent citation network analysis. Scientometrics 2017, 111, 297–315. [Google Scholar] [CrossRef]
  49. Hung, S.W.; Wang, A.P. Examining the small world phenomenon in the patent citation network: A case study of the radio frequency identification (RFID) network. Scientometrics 2010, 82, 121–134. [Google Scholar] [CrossRef]
  50. Schwarz, G. Estimating the dimension of a model. Ann. Stat. 1978, 6, 461–464. [Google Scholar] [CrossRef]
  51. Akaike, H. Information theory and an extension of the maximum likelihood principle. In Selected Papers of Hirotugu Akaike; Springer: New York, NY, USA, 1998; pp. 199–213. [Google Scholar]
  52. Cho, T.S.; Shih, H.Y. Patent citation network analysis of core and emerging technologies in Taiwan: 1997–2008. Scientometrics 2011, 89, 795–811. [Google Scholar] [CrossRef]
  53. Nickel, S.; Hertel, A.; Pesch, R.; Schröder, W.; Steinnes, E.; Uggerud, H.T. Correlating concentrations of heavy metals in atmospheric deposition with respective accumulation in moss and natural surface soil for ecological land classes in Norway between 1990 and 2010. Environ. Sci. Pollut. Res. 2015, 22, 8488–8498. [Google Scholar] [CrossRef]
  54. Fruchterman, T.M.J.; Reingold, E.M. Graph drawing by force-directed placement. Softw. Pract. Exp. 1991, 21, 1129–1164. [Google Scholar] [CrossRef]
  55. Schmid, C.S.; Chen TH, Y.; Desmarais, B.A. Generative dynamics of supreme court citations: Analysis with a new statistical network model. Political Anal. 2021, 1–20. [Google Scholar] [CrossRef]
  56. Wagner, S.; Wakeman, S. What do patent-based measures tell us about product commercialization? Evidence from the pharmaceutical industry. Res. Policy 2016, 45, 1091–1102. [Google Scholar] [CrossRef] [Green Version]
  57. Del Castillo, E.; Meyers, A.; Chen, P. Exponential random graph modeling of a faculty hiring network: The IEOR case. IISE Trans. 2020, 52, 43–60. [Google Scholar] [CrossRef]
  58. Alcácer, J.; Gittelman, M.; Sampat, B. Applicant and examiner citations in US patents: An overview and analysis. Res. Policy 2009, 38, 415–427. [Google Scholar] [CrossRef]
Figure 1. The number of Nordic green patents.
Sustainability 14 07743 g001
Figure 2. Evolution of the patent core citation network. (a) 1980–1989, (b) 1990–1999, (c) 2000–2009, (d) 2010–2019.
Sustainability 14 07743 g002
Figure 3. Robustness test of ERGM estimation results. (a) 1980–1989, (b) 1990–1999, (c) 2000–2009, (d) 2010–2019.
Sustainability 14 07743 g003
Table 1. Descriptive statistics of Nordic green patents from 1980 to 2019.
Nordic Green PatentsCited PatentsAverage Cited PatentsCiting PatentsAverage Citing Patents
1980–198995616221.7012,66013.24
1990–1999118451824.3815,55413.14
2000–2009160012,3877.7420,15712.60
2010–2019401228,9367.2188122.20
Table 2. ERGM variables and annotations.
Type of VariablesVariablesAnnotations
Network endogenous structure variablesedgesThe constant term of the model which is equivalent to the network density, and reflects the basic tendency of the network nodes to form relationships
twopathThe open triangle structure that patent I cites patent j and patent j cites patent k, indicating the connectivity of the patent citation network
transitivetiesThe closed triangle structure that patent I cites patent j, patent j cites patent k, and patent I cites patent k, reflecting a certain degree of transitivity
gwodegreeThe distribution of the nodes’ out-degree, which can reflect the activity of nodes in the network
Node attribute variablesnodecov.claimsThe number of patent claims, representing the scope of protection given by the patent or patent application in scientific terms which mainly reflects the boundary of technology exclusivity
nodecov.referencesThe number of citations to scientific and technological documents other than patent documents which shows the dependence of patents on existing technologies
nodecov.familyThe size of the patent family, that is, the number of patents of the same family, reflecting the patent value
absdiff.regionWhether the country of the first applicant of the patent is a Nordic country, reflecting the heterogeneous effect of geography
nodematch.citedFrequency of patent cited, reflecting the homogeneous effect of cited frequency and the “rich club” phenomenon
Node relationship covariatesedgecov.fieldWhether there is a similarity in the technological field between different nodes. If the technological fields of patent I and patent j are the same, the value is assigned to 1, otherwise, the value is assigned to 0 (the first four digits of the main IPC number of the patent are classified as a technological field [52])
edgecov.yearTime difference between different patent publication years
edgecov.distanceThe distance between countries to which different patents belong
Table 3. Topological measures of patent citation network.
Number of NodesNumber of EdgesAverage DegreeNetwork DiameterAverage Path LengthClustering CoefficientConnected Component
1980–198912,69214,0971.11151.7540.010440
1990–199917,74520,4731.15451.9970.010516
2000–200925,98332,2551.24161.9740.013591
2010–201929,44936,8661.25271.8430.0161551
Table 4. The hubs and authorities in the patent citation network.
1980–19891990–19992000–20092010–2019
HubsAuthoritiesHubsAuthoritiesHubsAuthoritiesHubsAuthorities
14889698A7361209B15024685A7833322B24477690A6465979B16255793B110433697B2
24273747A8034163B15993521A7724492B25545853A6873080B17332890B210209080B2
34233274A7731780B15012159A7767169B24357542A6891303B27613543B210149430B2
44443417A6855859B25180404A7077890B24565929A7061133B18396592B29295362B2
54583999A8293196B14955991A7638104B24853565A6525265B17761954B29405294B2
Table 5. Comparison of parameter estimation of ERGM from 1980 to 2019.
1980–19891990–19992000–20092010–2019
edges−3.013 ***−3.801 ***−6.362 ***−4.916 ***
(0.249)(0.183)(0.133) (0.081)
nodeicov.claims−0.0010.007 ***0.007 ***−0.009 ***
(0.003)(0.002)(0.001) (0.002)
nodeocov.claims−0.008−0.018 ***−0.008 ***−0.001
(0.004)(0.003)(0.002) (0.001)
nodeicov.references−0.002 **−0.003 ***0.002 ***0.002 ***
(0.001)(0.001)(0.001) (0.001)
nodeocov.references−0.014−0.067 ***−0.010 ***−0.001
(0.011)(0.011)(0.001) (0.001)
nodeicov.family−0.0060.007 **0.013 ***0.006 ***
(0.005)(0.002)(0.001) (0.001)
nodeocov.family0.003−0.001−0.020 ***0.008 ***
(0.003)(0.003)(0.002) (0.001)
absdiff.region0.688 ***1.022 ***3.128 ***0.582 ***
(0.152)(0.124)(0.087) (0.039)
nodematch.cited0.138−0.043−0.255 ***−1.417 ***
(0.094)(0.073)(0.058) (0.081)
gwodeg−4.973 ***−2.886 ***−2.450 ***−0.686 ***
(0.472)(0.349)(0.155) (0.135)
twopath−0.456 ***−0.305 ***−0.088 ***−0.372 ***
(0.046)(0.021)(0.004) (0.012)
transitiveties1.624 ***1.678 ***1.520 ***2.542 ***
(0.083)(0.052)(0.053) (0.072)
edgecov.field−0.1090.069−0.0430.001
(0.096)(0.066)(0.058) (0.044)
edgecov.distance0.437−0.107−0.0670.292 ***
(0.269)(0.222)(0.100) (0.081)
edgecov.year−0.0030.006−0.0080.011 ***
(0.006)(0.006)(0.006) (0.003)
AIC390710,17532,44937,892
BIC402910,31732,61838,067
** p < 0.01, *** p < 0.001.
Publisher’s Note: MDPI stays neutral with regard to jurisdictional claims in published maps and institutional affiliations.

