Article

Evaluation of the Thermal Environmental Effects of Urban Ecological Networks—A Case Study of Xuzhou City, China

1
College of Architecture, Anhui Science and Technology University, Bengbu 233000, China
2
School of Geography and Tourism, Qufu Normal University, Qufu 276800, China
*
Author to whom correspondence should be addressed.
Sustainability 2022, 14(13), 7744; https://doi.org/10.3390/su14137744
Submission received: 19 April 2022 / Revised: 30 May 2022 / Accepted: 1 June 2022 / Published: 24 June 2022
(This article belongs to the Special Issue Sustainability Challenges in Urban Heat Island Mitigation Strategies)

Abstract

:
Urban heat islands (UHIs) constitute an important ecological problem in cities. Ecological space has a positive effect on UHI mitigation, which can be effectively organized in the form of ecological networks. In this study, the framework for structural UHI improvement based on ecological networks considering the source-corridor model is proposed to examine the spatial threshold of the thermal effect of ecological network factors. Additionally, the cooling mechanism of each constituent element in the ecological network context is further explored. The results demonstrate that (1) an obvious cold and heat island spatial aggregation distribution exists in the Xuzhou main urban area, and land of the same land use type exhibits the dual thermal environmental properties of cold and heat islands through its spatial distribution and characteristics. Ecological space is the main bearing area of cold islands. (2) The ecological network in the main urban area of Xuzhou city occurs at a moderately complex level, and the overall network efficiency is acceptable; the network connectivity is low, while the network loop distribution is uneven. (3) Ecological networks represent an effective spatial means to improve overall UHI patterns. The ecological source area cooling threshold is 300 m, and the optimal threshold is 100 m, while the ecological corridor width threshold is 500 m and 60 m, respectively. (4) Within the optimal threshold in the context of ecological networks, the temperature of ecological sources in category G land is influenced by NDBI and FVC; ecological corridors are mainly influenced by NDBI. The results can provide a quantitative basis for urban ecological network planning considering UHI improvement and a reference for urban thermal environment research within different ecological substrates and planning and control systems in other countries and regions worldwide.

1. Introduction

Rapid urbanization exacerbates the urban heat island (UHI) effect [1,2]. In urbanized areas, the intensive construction of various types of urban facilities [3,4] and the high degree of impervious surface erosion in ecological land [5,6] destroy the original organizational form and structure of various spaces [7,8,9], which results in high solar radiation absorption [10,11,12] and ecological patch fragmentation [13,14,15], eventually leading to the deterioration of the urban thermal environment [16,17,18] and the normal functioning of the urban ecosystem’s regulation ability [19,20,21,22]. Ecological spaces produce the urban cold island effect, and the generated cold air source is an important potential cooling factor for a given city [23,24]. An ecological network can organize various ecological spaces with cooling effects to establish a complete ecosystem [25,26,27], and a spatial structure system for urban thermal landscape pattern improvement can then be formed. Moreover, the cooling effect of ecological spaces can be extended from functional to structural aspects. Therefore, quantitative research on the thermal environmental effects of urban ecological networks is of great significance for scientific ecological land deployment, heat island effect mitigation, and ecosystem service function stabilization.
The ecological space within a given city provides citizens with basic social functions, such as recreation and leisure [28,29,30], and important ecological service functions [31,32,33]. In the field of urban planning, ecological spatial planning and layout design more notably consider social service functions [34,35]. The sustained heat release effect is one of the important ecological service functions of urban ecological spaces [36]. Generally, the spatial pattern [37,38], structure and form [39], land occupation scale [40], landscape composition [41], surrounding construction [42] and other characteristic factors of ecological land can influence the cooling effect, and the cooling effect of individual ecological patches such as parks, green areas, and water bodies exhibits a certain distance threshold and reflects the efficiency characteristics of distance reduction [43,44]. At the present stage, research on ecological service functions considering urban thermal environment improvement primarily focuses on two levels. At the first level, a single patch in the ecosystem is typically adopted as the research object, and the cooling effect is quantitatively studied [45,46]. At the second level, the relationships between the internal configuration, mode, layout, and structure of ecological land and the urban thermal environment are explored [9,47,48,49]. These studies emphasizing a single ecological land class or ontology are less focused on the overall thermal effect of ecological space, and characterization of the macro-scale relationship between the urban ecological network and overall urban thermal landscape pattern is lacking. However, urban construction land and ecological spaces are changing [50,51]. Considering the land use efficiency, quantification of the thermal environmental effect threshold of urban ecological spaces, construction of urban cold source structures with high structural and functional connectivity levels based on the ecological network structure, and maximization of the ecological network cooling effect should be strategic priorities for urban thermal environment improvement.
Remote sensing images are common basic data for thermal environment research. With the use of remote sensing technology, the split- and mono-window algorithms and other methods can be effectively employed for surface temperature inversion [52,53]. According to existing research, the mono-window algorithm achieves a satisfactory consistency with surface temperature measurements [54]. In the urban and ecological planning field, many theoretical models and technical methods have been developed to construct ecological networks, such as morphological spatial pattern analysis (MSPA) [55], the minimum cumulative resistance (MCR) model [56], graph theory [57], the resistance model and circuit theory [58,59]. Considering research content differences, the comprehensive use of various methods to construct ecological networks has become a common research path [60,61]. Among these methods, the identification and selection of ecological sources and simulation of ecological corridors can be effectively realized via MSPA and MCR models [62] to generate diagrams of ecological networks.
The existing research carriers on urban thermal environment are mainly concentrated in large cities such as Beijing [49], Shanghai [63], Nanjing [64], Chongqing [65], Wuhan [66], or in hot regions [67], arid regions [68] and cold regions [69] with special geographical locations that are not universal in terms of urban scale and natural conditions. Xuzhou is a typical resource-based city with a medium urban population size and urbanization area in China, and the overall LST shows a warming trend [70,71,72]. After urbanization recovery and growth, the urban ecological space has experienced the slash destruction and restoration process due to resource exploitation, and eco-city transformation has finally been realized [73,74]. In the process of urban transformation, ecological space has assumed an important cooling function, and Xuzhou itself has good ecological conditions. By integrating the cooling effect of ecological resources, the cooling effect of the ecological network can be more fully exerted. Choosing Xuzhou as an example, this paper used Landsat satellite data and land use data, employed the single-window algorithm to retrieve the land surface temperature (LST), applied landscape connectivity analysis, ecological resistance surface analysis and other methods to construct the main urban ecological network and further explored the thermal environmental effect threshold and spatial optimization strategy of urban ecological networks through spatial analysis methods. The purpose was to provide support for functional optimization of urban ecological networks, decision-making references for urban thermal landscape pattern improvement, and constructive ideas for the rational and sustainable development of resource-based cities.

2. Materials and Methods

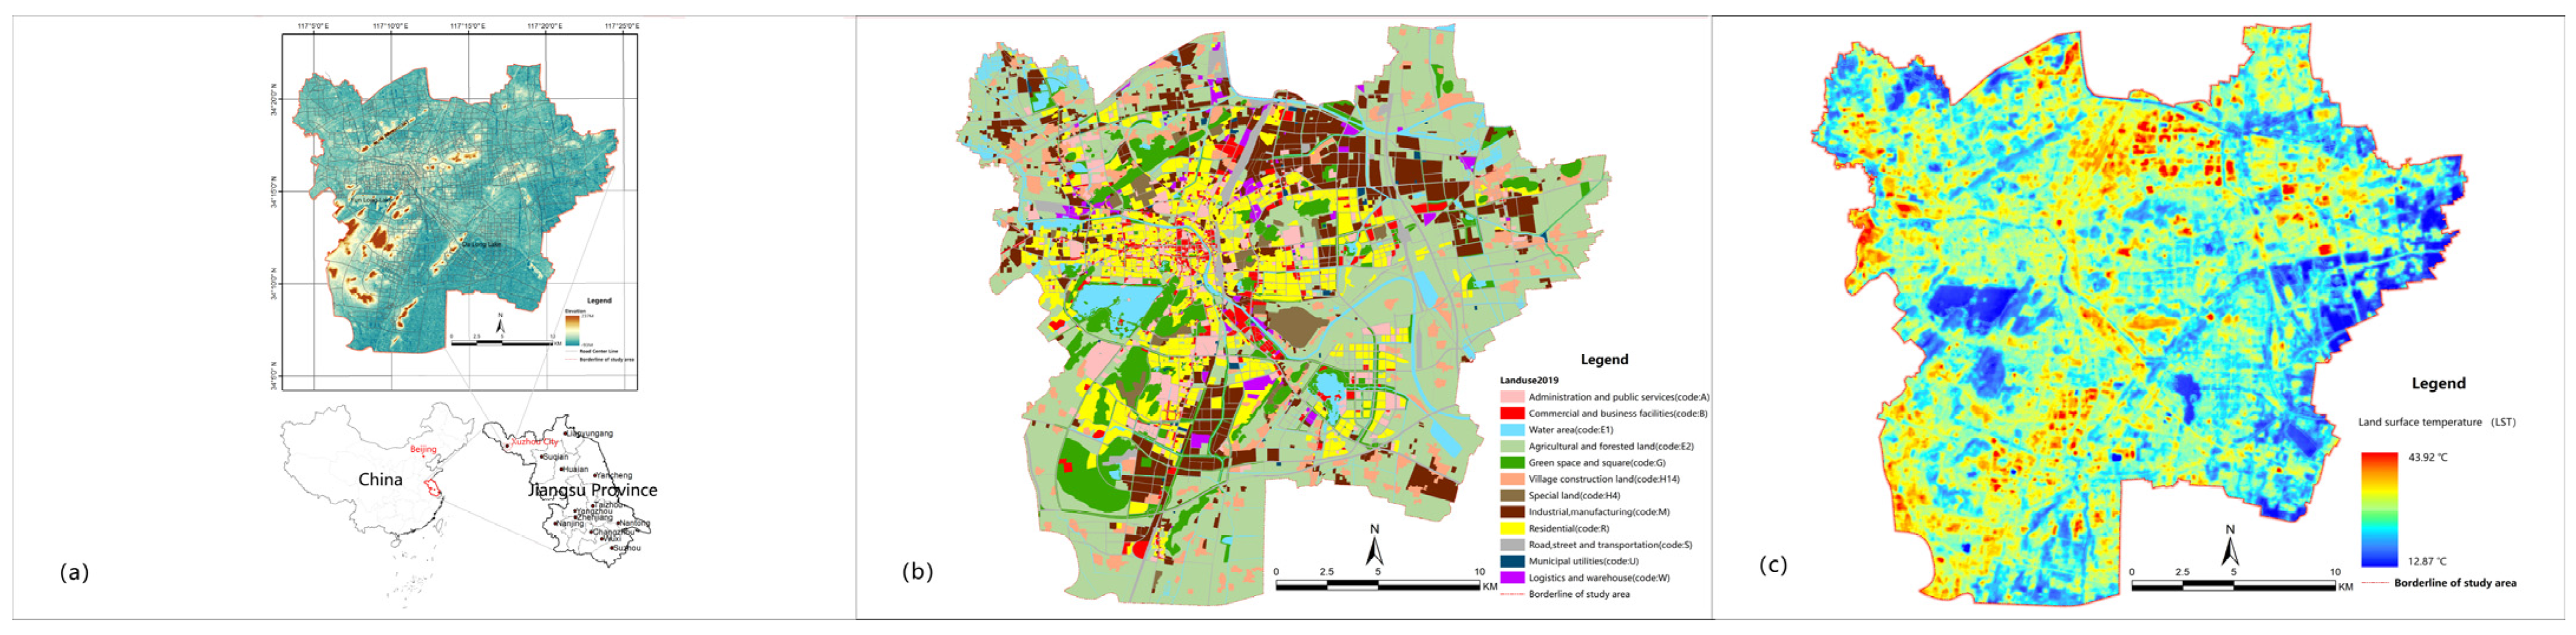
2.1. Overview of the Study Area

Xuzhou is located in northwestern Jiangsu Province and the southeastern North China Plain. The geographical coordinates are 33°43′~34°58′ N and 116°22′~118°40′ E. The city covers an area of 11,258 km2 and belongs to the warm temperate semi-humid monsoon climate zone with four distinct seasons. The annual average temperature reaches 14 °C, and the annual average precipitation ranges from approximately 800 to 930 mm. Since urbanization growth was resumed in Xuzhou in 1995, the urbanization level increased from 19.8%, lower than the global level and average level in China, to 65.63% in 2020, which is higher than the average level in China, with a total urban population of 9.0839 million people in 2020, and the urban built-up area increased from 59.1 km2 in 1995 to 289.6 km2 in 2020. The green coverage rate of urban built-up areas also increased from 33.1% in 1995 to 43.1% in 2020. After rapid urbanization [75] and subsequent ecological construction transformation in this resource-exhausted city [76], Xuzhou has become a UN Habitat Award city, but there remains an obvious heat island effect in the main urban area, and the UHI effect is increasing year by year [77,78]. The scope of this study was defined as the main urban area of Xuzhou city determined by the Xuzhou City Master Plan (2007–2020) (revised in 2017), which includes Gulou District, Quanshan District, Yunlong District, Tongshan District, Xincheng District and the Economic and Technological Development Zone, with an area of approximately 573.2 km2 and an average terrain elevation of 35.1 m in the study area (Figure 1a). The study scope includes urban built-up areas, water bodies, suburban villages, agricultural and forestland areas, etc.

2.2. Data Sources and Processing

Combined with common data and research accuracy requirements in urban thermal environment research, Landsat image data were retrieved from the Geospatial Data Cloud Platform (http://www.gscloud.cn, accessed on 1 October 2021) of the Computer Network Information Center, Chinese Academy of Sciences, for LST retrieval. According to existing research on the urban thermal environment, a Landsat 8 satellite image recorded during transit through the main urban area of Xuzhou at 10:49 (GMT + 8) on 27 September 2019 was selected, with a row number of 122 and a column number of 36. Regarding ecological network construction, elevation data for Xuzhou city (Figure 1a) and the current state map of construction land in the main urban area of Xuzhou city in 2019 were mainly selected, and vector classification was performed according to current urban planning and management land classification standards in China, i.e., Urban Land Classification and Planning and Construction Land Standards (GB50137-2011). The lands are “administration and public services land” (code “A”), “commercial and business facilities land” (code “B”), “green space and square” (code G), “industrial land” (code “M”), “residential land” (code “R”), “road, street and transportation land” (code “S”), “municipal utilities land” (code “U”), “logistics and warehouse” (code “W”), “village construction land” (code “H14”), “special land” (code “H4”), “water area” (code E1), and “agricultural and forested land” (code E2), respectively. The land use spatial distribution and categories are shown in Figure 1b.

2.3. Methods

2.3.1. Land Surface Temperature (LST)

The inversion accuracy of the single-window algorithm indicates the highest consistency with ground-measured data. The improved mono-window (IMW) algorithm proposed by Wang, Fei, Qin, and Zhihao [53] was used to obtain the LST through remote sensing image data inversion, in which the daily relative humidity was 55% and the average temperature was 28.51 °C in the study area. The LST inversion equation can be expressed as follows:
T s = { a × ( 1 C D ) + [ b × ( 1 C D ) × C + D ] × T s c e n o r D × T a } C
where C and D are intermediate parameters, C = τ × ε , D = ( 1 τ ) × [ 1 + ( 1 ε ) × τ ] , and a and b are constants. Moreover, Ts is the actual surface temperature (K), τ is the atmospheric transmittance, and ε is the surface emissivity, which can be estimated with the method of Sobrino et al. and Qin Zhihao et al. [79,80] based on the normalized difference vegetation index (NDVI). Ta is the mean acting temperature of the atmosphere (K), which can be combined [80] with the surface layer atmospheric temperature T0 according to the following equation: T a = 16.0110 + 0.9262 × T 0 . Tscenor is the surface radiation brightness temperature value, which can be calculated with the following equation:
T s c e n o r = K 2 ln ( K 1 L λ + 1 )
L λ = G a i n × D N + B i a s
where Lλ is the thermal radiation brightness value, DN is the pixel grey value of the remote sensing image, Gain and Bias are preset Landsat satellite parameters, and K1 and K2 are surface radiation brightness temperature inversion constants, with K1 = 774.89 W·m−2·si−1·μm−1 and K2 = 1321.08 K. The surface temperature calculation results are shown in Figure 1c.

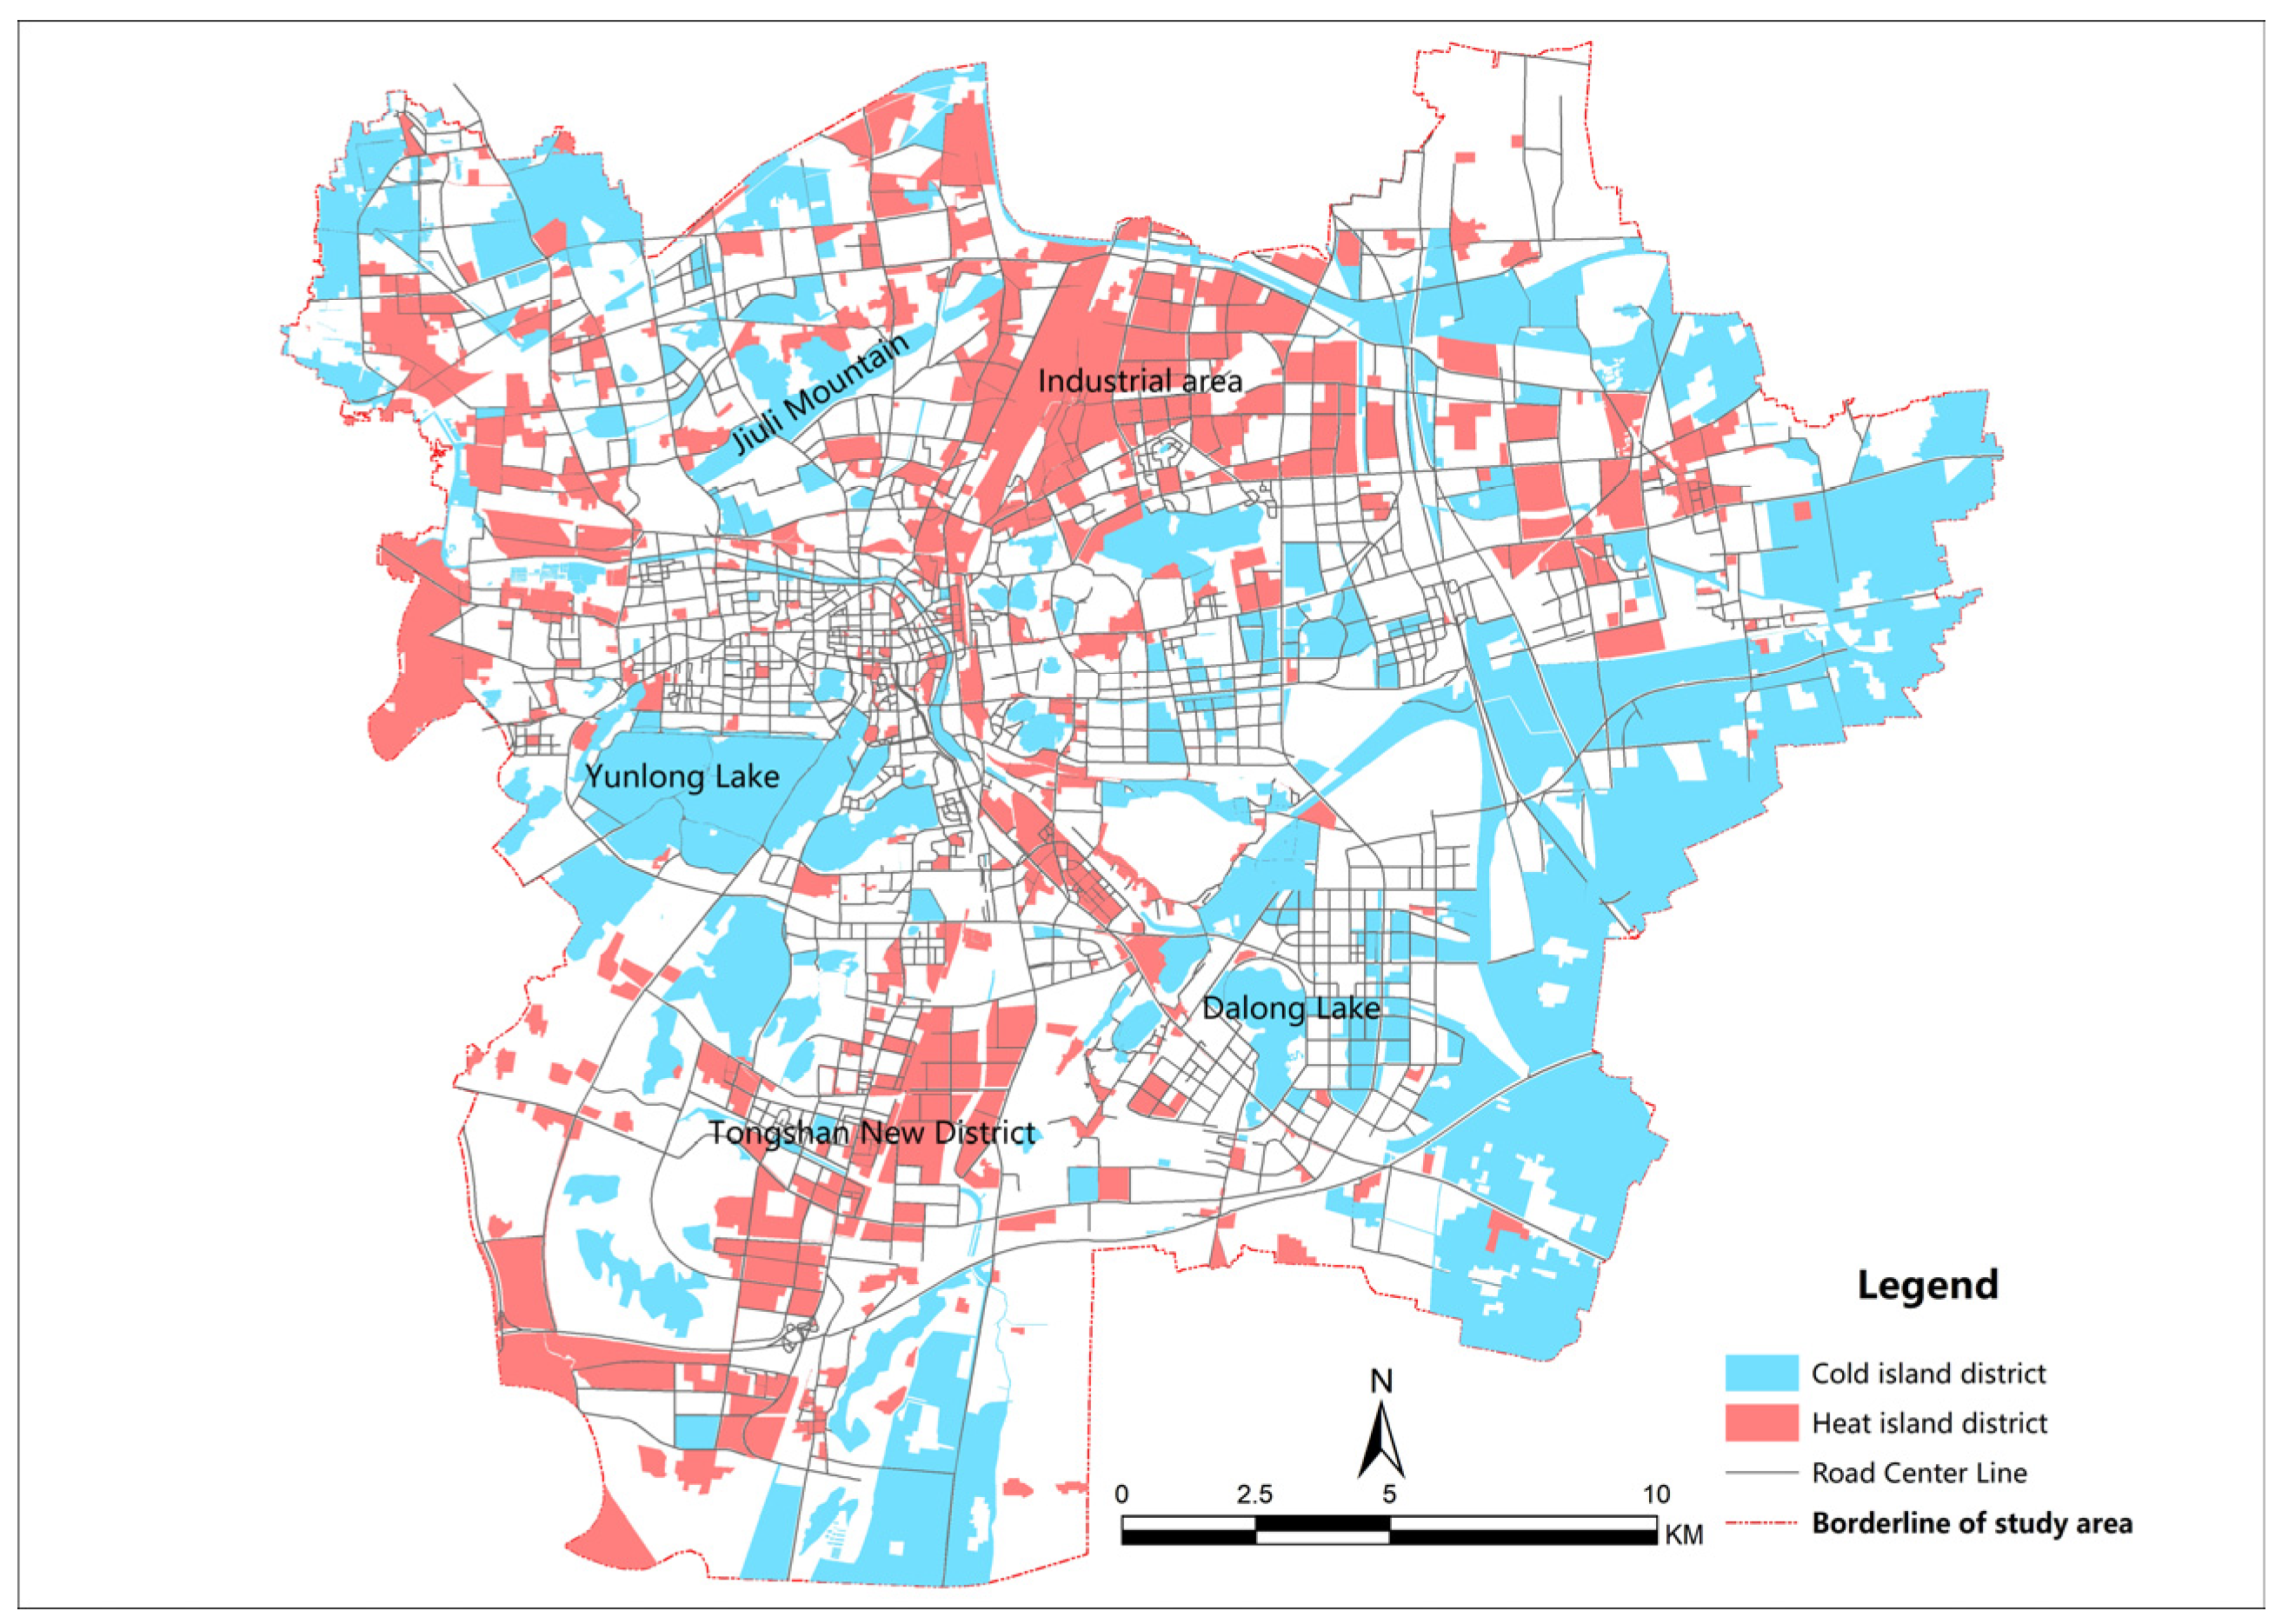
2.3.2. UHI Classification

LST normalization was used to intuitively analyze the spatial distribution of the temperature in the study area. The classification method based on robust statistics was used for LST normalization in the study area, and the LST distribution was unified within the 0–1 range [81]. The equation is as follows:
N L S T i = ( T s i T s m i n ) / ( T s m a x T s m i n )
where NLSTi is the normalized value in pixel i, Tsi is the LST in pixel i, Ts max is the maximum LST value and Ts min is the minimum LST value.
Through LST normalization, considering 0.5, 1.0 and 1.5 times the variance, the LST images of the study area were classified according to the temperature threshold calculated with the above equation [72]. The study area was divided into seven levels, including an extremely low-temperature zone (level 7), low-temperature zone (level 6), lower-temperature zone (level 5), medium-temperature zone (level 4), higher-temperature zone (level 3), high-temperature zone (level 2) and extremely high-temperature zone (level 1). The high-temperature (level 2) and extremely high-temperature (level 1) zones are heat island areas, and the extremely low-temperature and low-temperature zones are cold island areas.

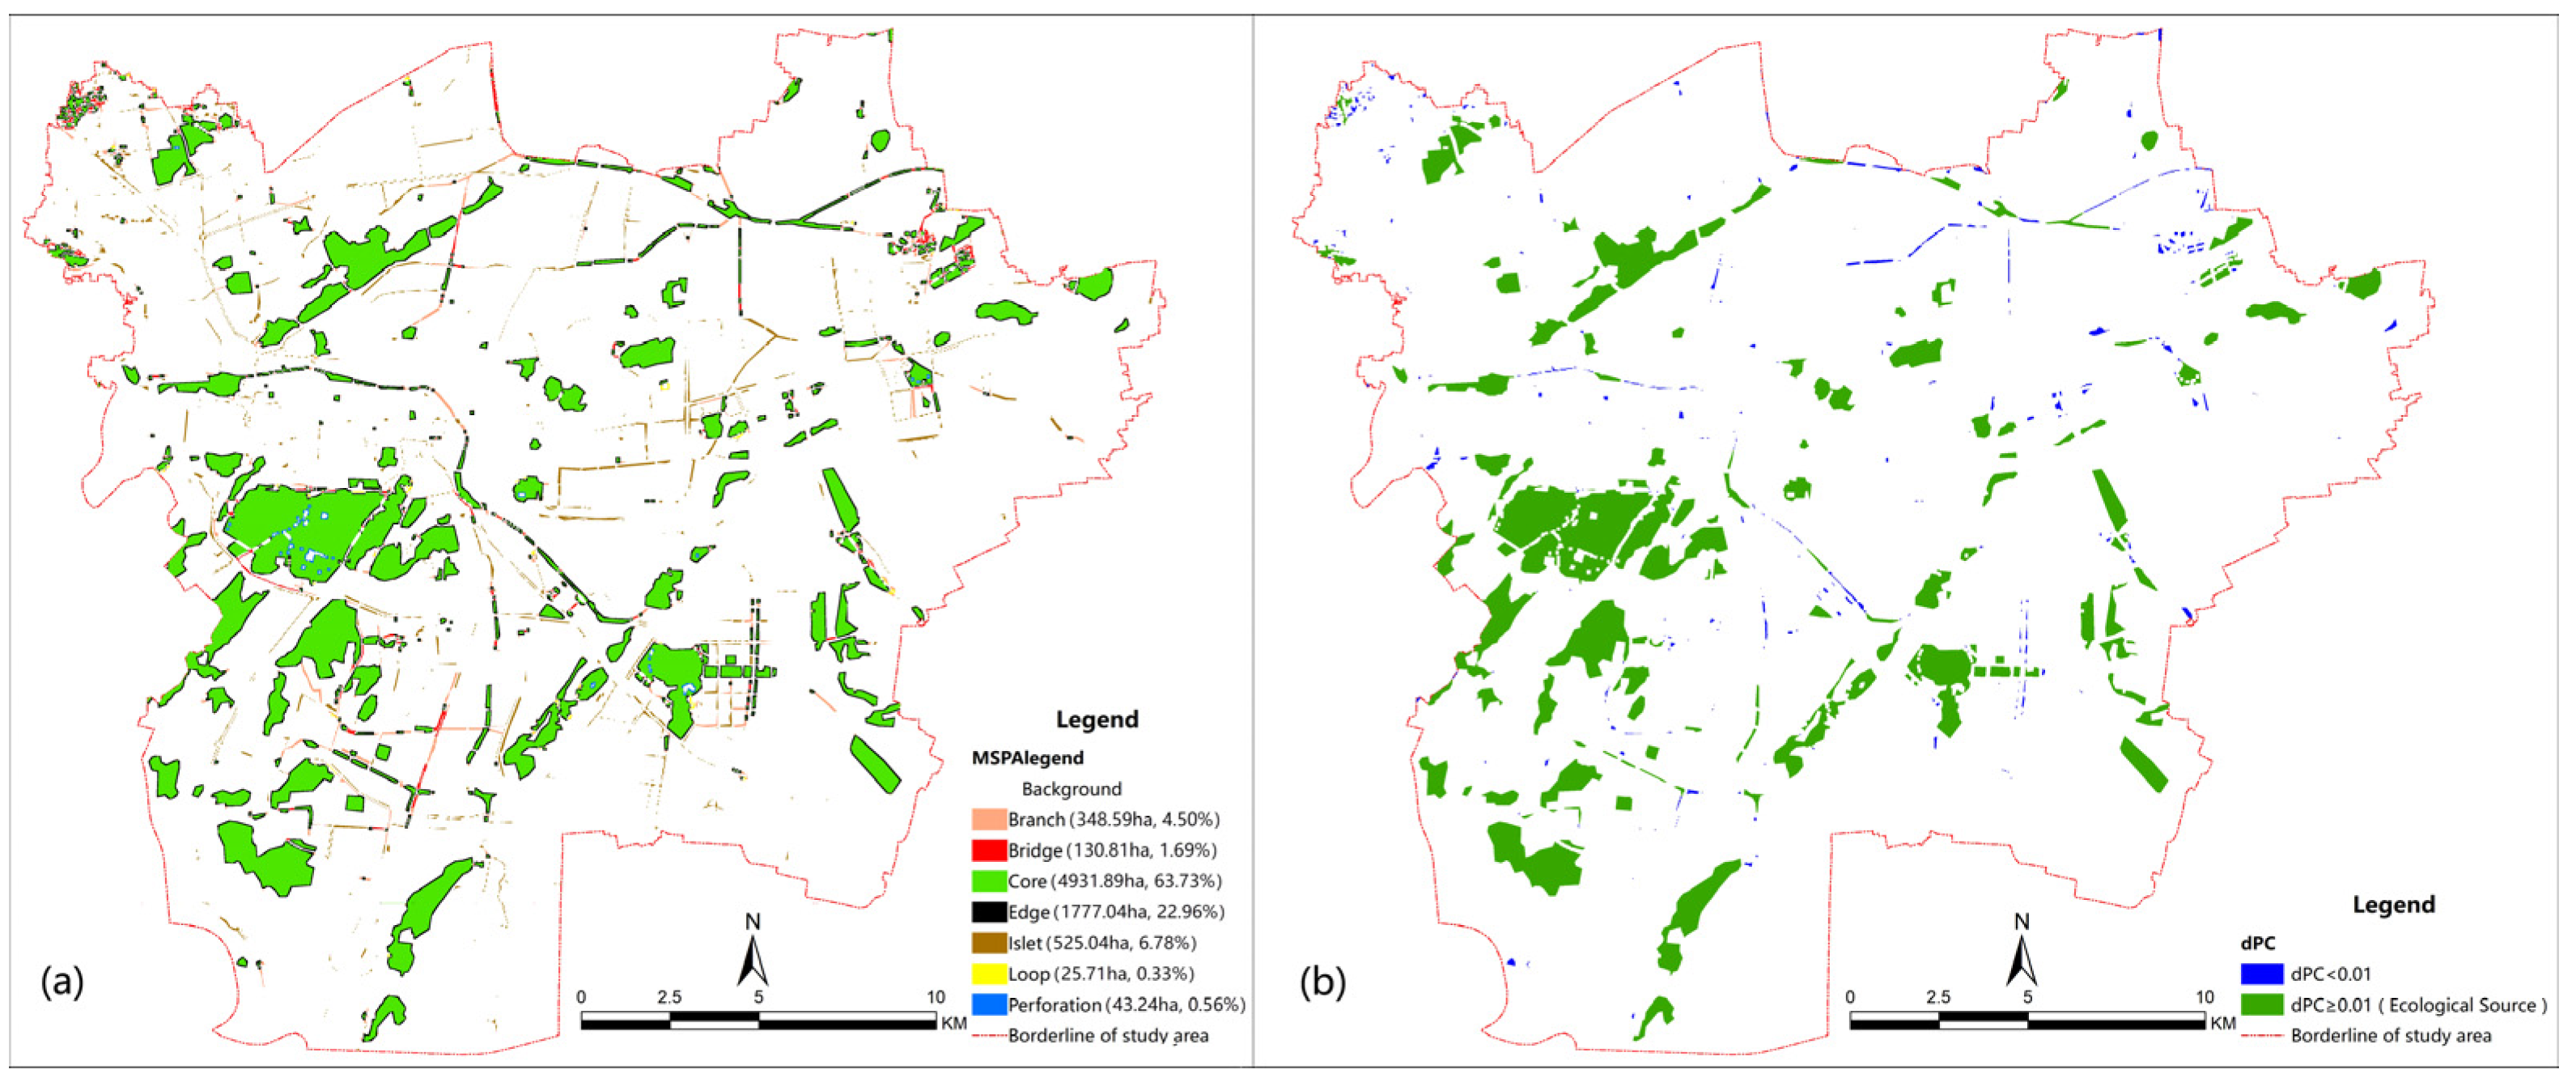
2.3.3. Construction of the Ecological Network

The construction of ecological networks has formed a research paradigm, including the identification of ecological sources and ecological corridors [82]. The purpose of ecological network identification is to construct a comprehensive network pattern including ecological sources and corridors, which can guarantee regional ecosystem services and ecological processes. The extraction process of the ecological network mainly includes determining the ecological source, constructing the ecological accumulation resistance surface, and extracting the ecological corridor [82,83]. An urban ecological patch is a carrier of the urban ecological source [84]. The ecological sources in this study are the ecological space patches such as green space, water area, agriculture and forest land that provide important ecological service functions to the city, providing a variety of ecosystem services and maintaining the stability of the ecosystem. Ecological resistance surface is the impact of landscape heterogeneity on ecological flow, briefly the size of ecological resistance [85]. Ecological corridors are the least-cost paths for ecological flow to flow from one ecological source to another ecological source through the ecological accumulation resistance surface [86]. This study uses the least-cost method to extract ecological corridors.
Based on spatial data of the land use in the main urban area of Xuzhou city in 2019, ecological source areas were selected via MSPA and the dPC value of the landscape connectivity index of the ecological space. Ecological corridors were constructed with the MCR model, and the spatial structure of the urban ecological network was determined with the source-corridor model [87] as follows:
  • Landscape connectivity analysis: Probability of connectivity index (PC)
Landscape connectivity refers to the accessibility and flexibility of specific ecological processes or biological species moving between landscape patches, which can reflect the promotion or hindrance of landscape elements in regard to specific ecological processes or species migration [88]. Combined with the evaluation effect of the landscape connectivity index [89], in this study, PC index and patch importance values were used to analyze the landscape connectivity to identify ecological source areas.
PC = i = 1 n j = 1 n p i j × a i × a j A L 2
where n is the total number of ecological space patches within the landscape, ai and aj are the land areas of ecological space patches i and j, respectively, pij is the maximum possibility of direct species migration between ecological space patches i and j, and AL is the total landscape area. The PC value ranges from 0 to 1, which is negatively correlated with the distance between land use patches. Combined with existing research, the probability value of migration between patches was set to 0.5 when the distance between patches equaled the set distance threshold [90,91].
2.
Landscape connectivity analysis: Importance value of the patch (dPC)
dPC ( % ) = 100 × P C P C r e m o v e P C
where the PC value could be obtained with Equation (1), and PCremove is the possible connectivity index of the ecological space comprising other remaining patches after patch removal. The higher the dPC value is, the more important the patch. The dPC value can be used to identify landscape patches that may play an important role in ecological space connectivity, providing an important basis for ecological source determination.
3.
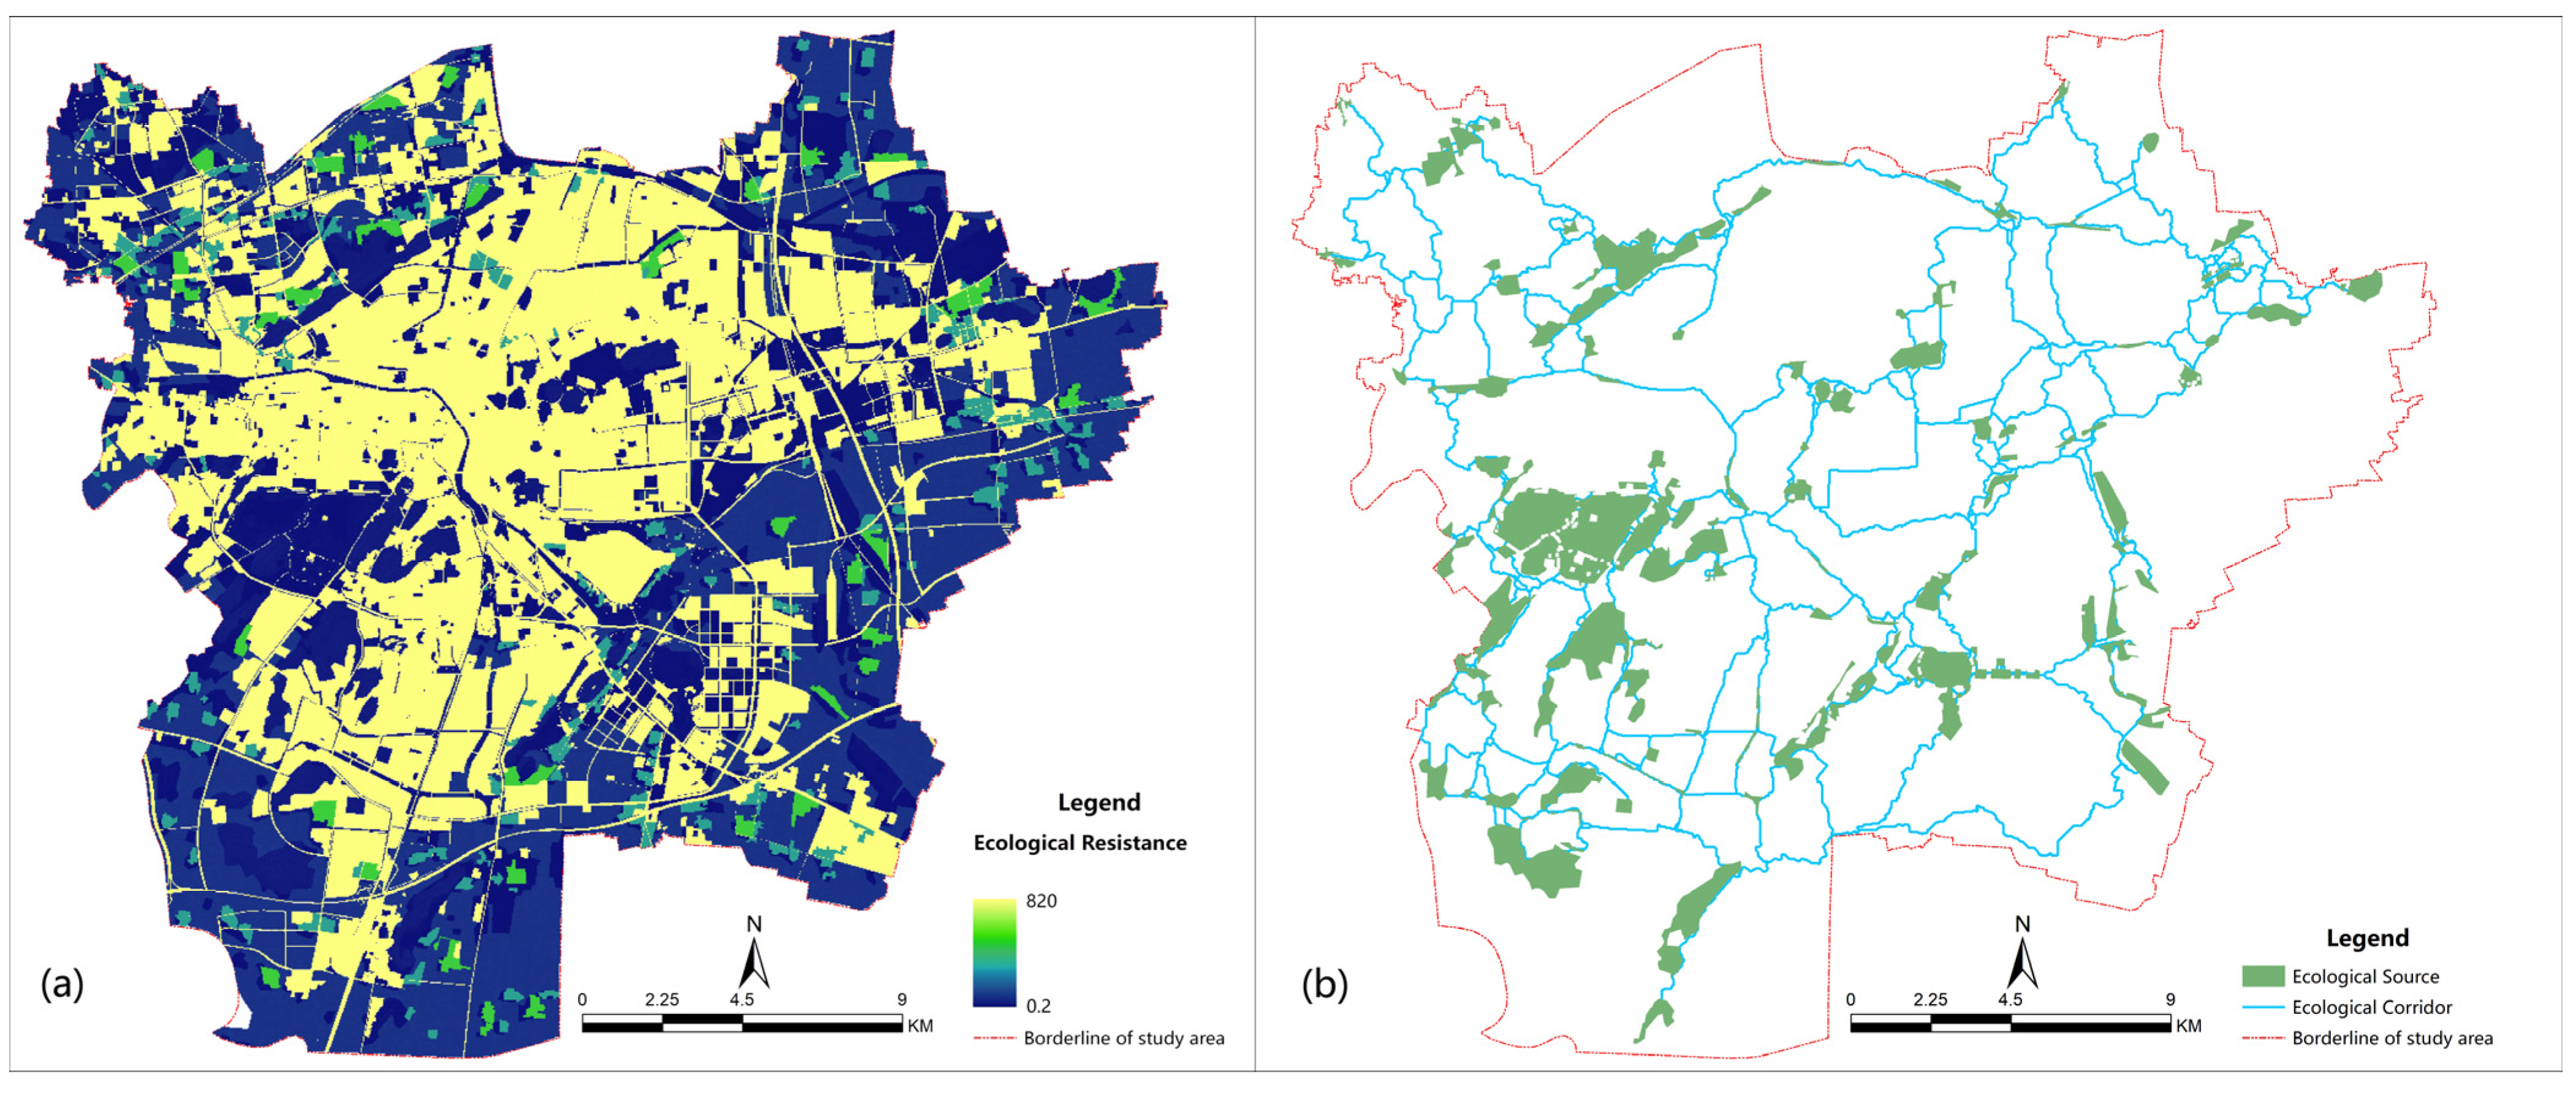
Analysis of the ecological resistance surface
The ecological resistance surface refers to the equivalent resistance value encountered by species in the ecological process of horizontal spatial movement and the flow and transmission process of ecological functions, and the minimum resistance contour line connecting various ecological sources can provide support for ecological corridor determination [92]. The MCR model mainly considers the three factors of ecological sources, distance and landscape base characteristics [93] to simulate the ecological process of species moving in horizontal space and the resistance encountered in the flow and transmission of ecological functions. This study employed the MCR model as the analysis model of the ecological resistance surface. The calculation equation is as follows:
MCR = min j = n i = m ( D i j × R i )
where MCR is the minimum resistance value, ⨍ is an unknown positive function that reflects the correlation between the MCR value at any point in space and the distance from all other sources and interface characteristics, Dij denotes the spatial distance of a given species from source i to a certain landscape unit j, Ri is the resistance of landscape i to particle motion, and the value can be determined according to the obstruction degree of landscape unit i to the considered particle. The resistance surface can be used to reflect the potential possibility and movement trend of a particle in space [94].
Based on existing research [95,96,97], ecological resistance factors and weights of the ecological space in the main urban area of Xuzhou city were comprehensively determined via the expert scoring method, the resistance factors were set as the terrain niche grade and soil cover type, and the resistance values of each factor were set at different levels (Table 1).

3. Results

3.1. Characteristics of the Surface Thermal Environment

3.1.1. Spatial Distribution Characteristics of the Thermal Environment

To clarify the characteristics of the thermal environment in the study area, it is necessary to determine the spatial distribution of cold and heat island areas and to normalize and classify the LST.
The Figure 2 shows that the spatial agglomeration of cold and heat islands in the main urban area is notable, and the scattered industrial land in the northern industrial area, Tongshan New District and northwestern Yunlong Lake are the main heat island concentration areas. The large areas of water bodies, mountains and large-scale agricultural and forestland areas in the eastern edge region are the main cold island distribution areas.
The underlying surface of each functional plot in the city varies in composition and carries different urban activities, resulting in various land use types with different heat island contributions. Statistics were obtained regarding the scale of the cold and heat island areas for the different land use types, as summarized in Table 2.
The table indicates that heat islands mainly occurred in industrial land, reaching 39.30%, and the E2 and H14 land use types were additional main land use types of the heat island effect. The G, E1 and E2 land use types were the main cold island areas. The proportion of land use type E2 reached 53.78%. However, according to the analysis data provided in the table, some areas of the G, E1 and E2 land use types were also UHI distribution areas, e.g., the heat island area of the E2 land use type even accounted for 14.59% of the total heat island area. Therefore, the cold and heat island attributes of the same type of ecological land could exhibit a dual nature.

3.1.2. LST in Candidate Ecological Land

Ecological land is the key area affecting the urban thermal environment. Since the thermal environment is closely related to factors such as location [103], self-form [104] and internal construction [40], it is necessary to further explore its spatial attributes based on the dual attributes of the thermal environment. The cold and heat island attributes of the G, E1 and E2 land use types were spatially visualized (Figure 3).
The figure reveals that the thermal environmental effects of urban ecological land mainly involved cold islands with an aggregated distribution, but cold islands were also observed in urban construction land and surrounding areas. The heat island regional form tended to be a belt-like form. In terms of the land use type, G largely includes protective green spaces along roads, E2 is surrounded by main traffic arteries (expressways), including industrial land to the northwest of Yunlong Lake and industrial and logistics warehousing land in the east, while E1 is less affected by the location.

3.2. Ecological Network

3.2.1. Ecological Sources

With the help of the Guidos Toolbox software platform, G, E1, E2 and other types of ecological land were selected as the foreground, and the foreground was divided into seven non-overlapping categories based on the principle of eight neighborhoods (Figure 4a). The core was selected as an alternative source, and the dPC value of the core was calculated as follows:
The calculated core area obtained with the MSPA method represents an important alternative area for urban ecological source areas. By calculating the core area connectivity, core areas with a dPC value greater than 0.01 could be selected as ecological source areas, and the total ecological source area in 2019 amounted to 470.55 hectares (Figure 4b). The ecological source area in the main urban area of Xuzhou varied greatly, with mountains and water bodies as the main land use types, among which the surrounding areas of Yunlong Lake, Dalong Lake and Jiuli Mountain were the key ecological source concentration areas.

3.2.2. Ecological Corridors

Combined with analysis of the ecological source area and ecological resistance surface (Figure 5), with the help of Linkage Mapper software, the MCR channel between ecological sources was visualized, and the ecological spatial corridor structure of the Xuzhou main urban area was determined (Figure 5b). The number of extracted ecological corridors in 2019 was 440, with a combined length of 201.00 km. In terms of the spatial distribution, the ecological network was relatively dense in the northeastern, southern and northwestern parts of the main urban area of Xuzhou. To quantify the network characteristics, the network measurement index was introduced [105,106]. The calculation results demonstrate that the ecological corridor network ring degree index in the main urban area of Xuzhou reached 0.28, which indicates that the ecological network exhibited a low degree of connectivity, the flow process of material and energy in the ecological network was not smooth, and the network loop distribution was uneven. The point rate index of the ecological corridor network in the main urban area of Xuzhou was calculated as 1.55, indicating that the ecological network occurred at a moderate complexity level, and the ecological sources within the ecological network could be relatively easily connected, thus enabling communication. The calculation result of the ecological corridor network connectivity index was 0.52, which indicates that more than half of the ecological sources in the main urban area were connected by ecological corridors, and the overall network efficiency was acceptable.

3.3. Thermal Environmental Effect of the Ecological Network

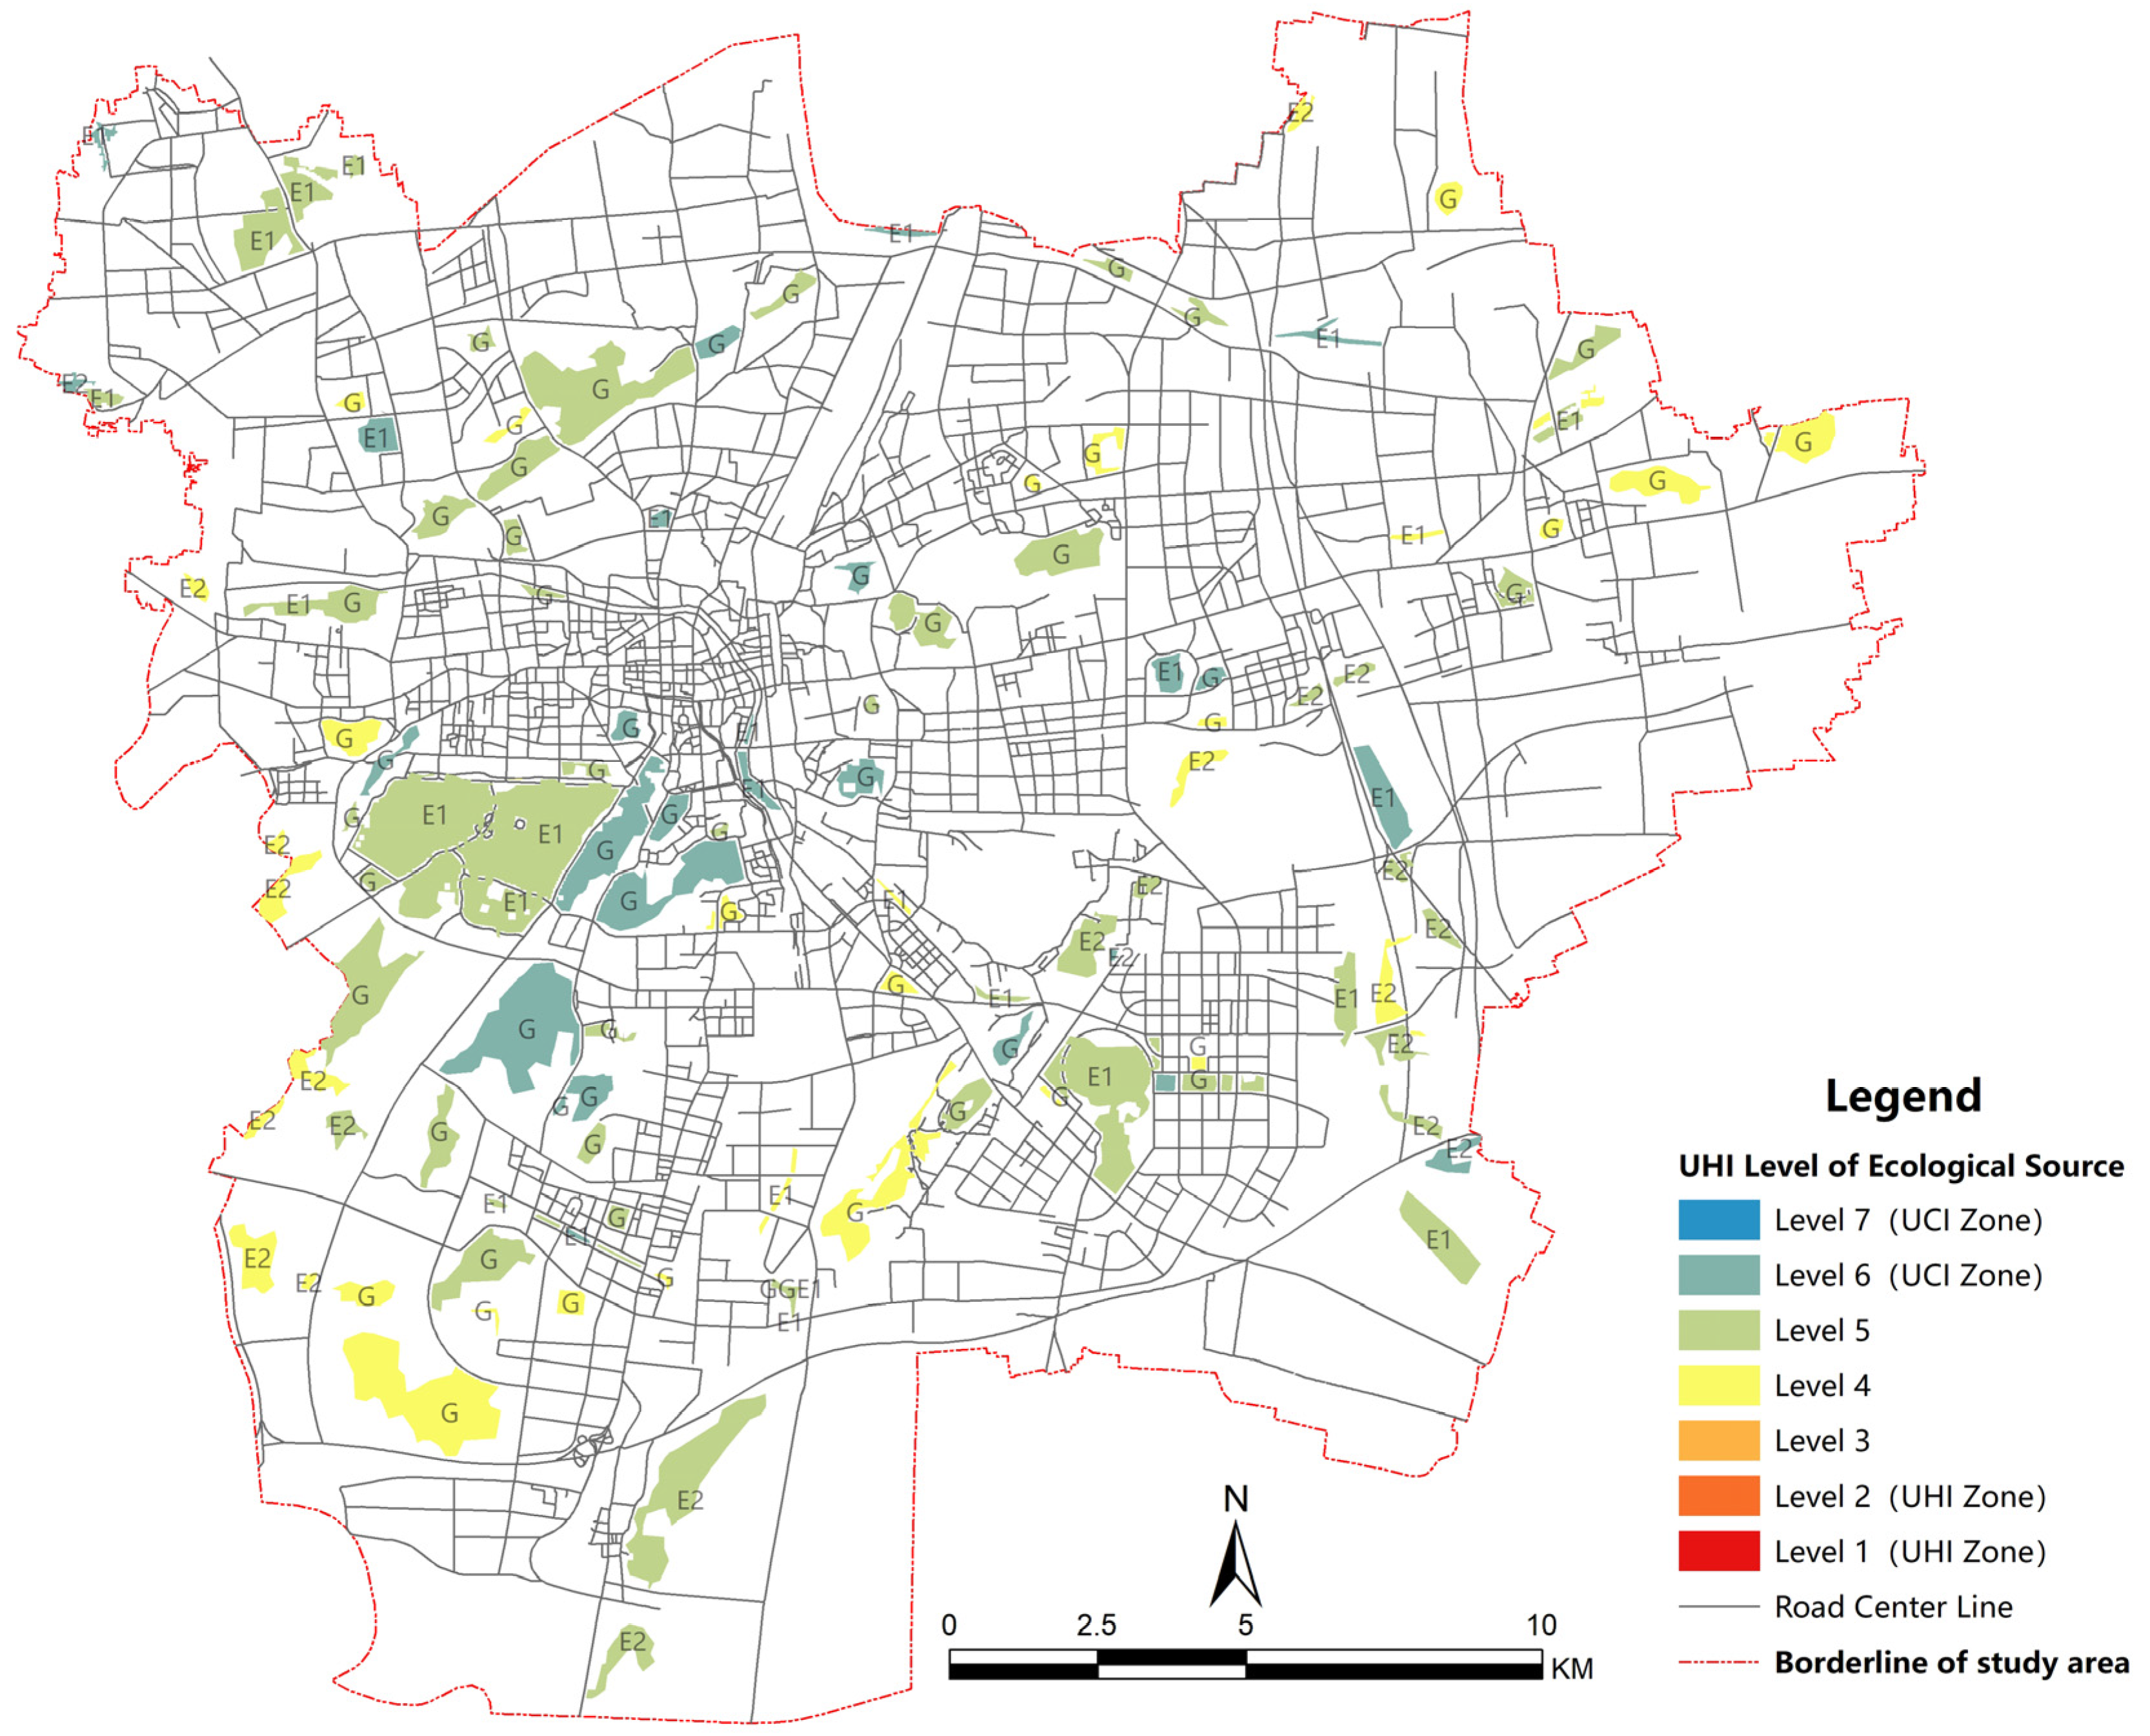
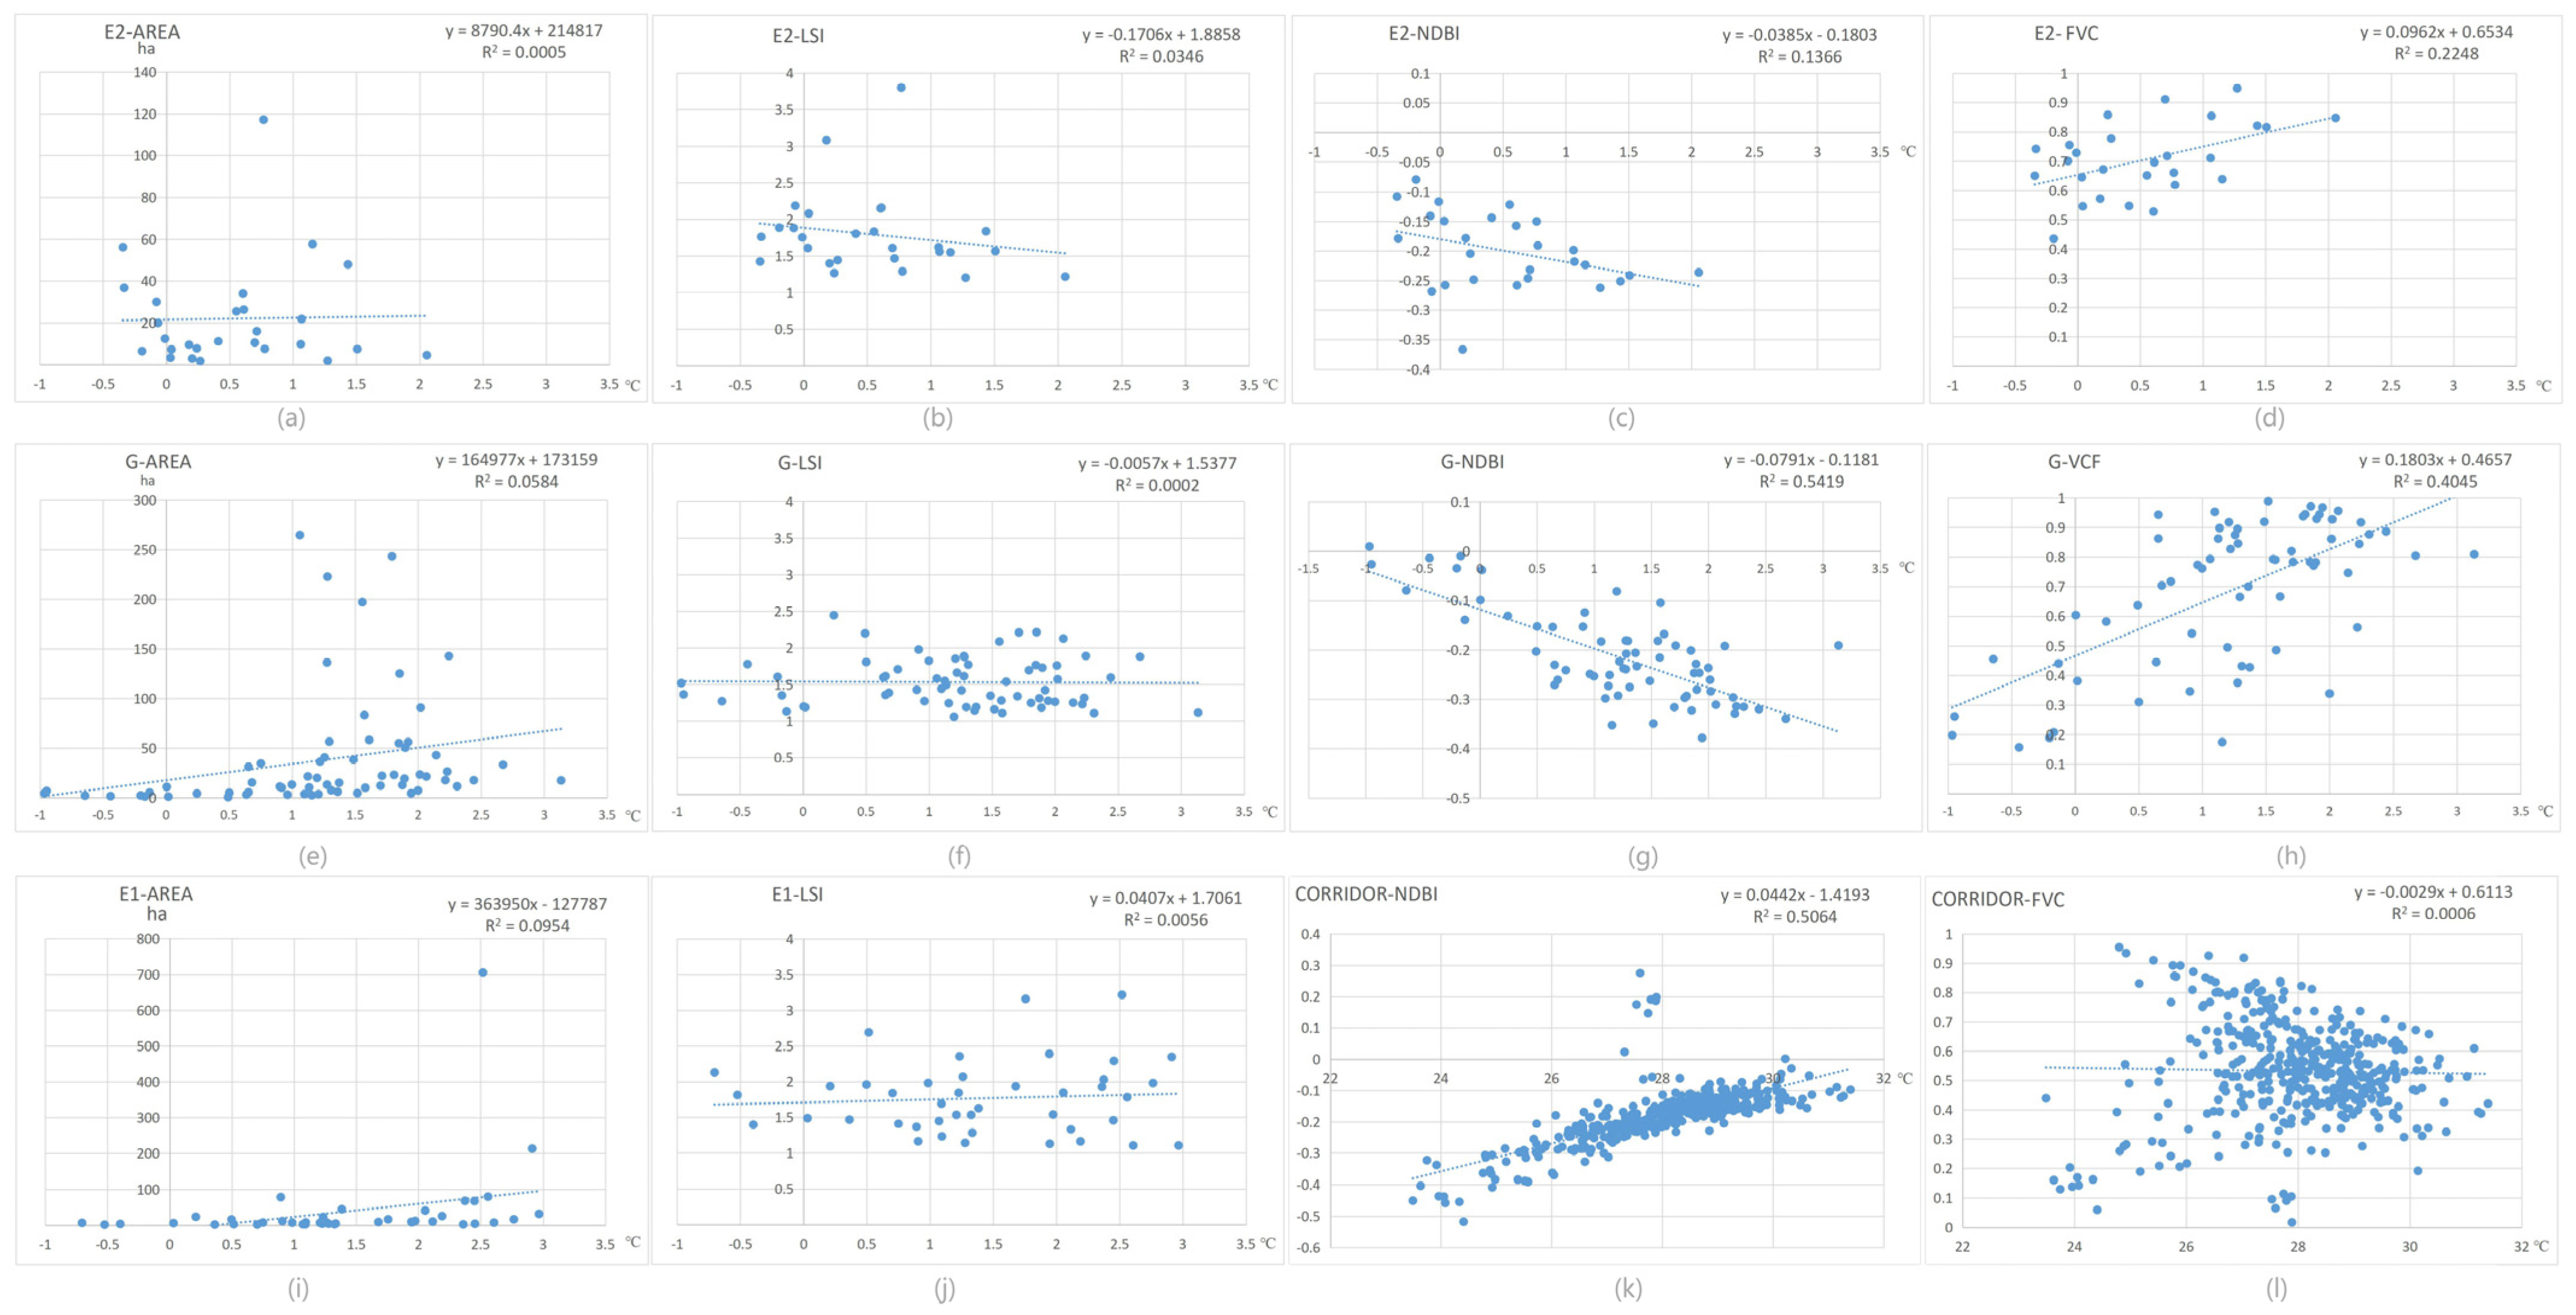
3.3.1. Thermal Environmental Effect of the Ecological Sources

On the ArcGIS platform, surface temperature and ecological source data were superimposed, surface temperature values of each source were extracted, and heat island grades were classified (Figure 6).
According to the obtained statistics on the area of each heat island grade in the ecological source area, there occurred no heat islands within the ecological source area, and the cold island area accounted for 20.35% of the total ecological source area. In the overall UHI classification, the lower-temperature area (level 5) accounted for 58.44%, the medium-temperature area (level 4) accounted for 20.82%, and the higher-temperature area (level 3) accounted for only 0.38% of the total ecological source area.
The boundary range of the thermal environmental effects of each element of the ecological network is the spatial threshold. To explore the spatial effect threshold of the thermal environment in the ecological source area, buffer analysis was introduced. Usually, the ecological source is the main landscape patch within the ecological space, which is the carrier and source of the material cycle, energy flow and ecosystem services in the ecosystem. The ecological source scale and morphological pattern correspond to different ecological service functions and service scopes. Generally, the larger the source scale is, the more complex the interface with surrounding substrates and the higher the stability and ecological value. In this study, ecological sources were evaluated based on the MSPA method and patch importance value (dPC). Therefore, when analyzing the thermal environmental effect of urban ecological sources, the thermal environmental effect boundary of ecological sources should be first defined to reasonably determine the basic width threshold and thermal environmental effect mechanism of ecological sources. In this study, the source buffer zones were determined to be 10, 20, 30, 50, 60, 80, 100, 150, 200, 300, 450 and 600 m, and the thermal environment of ecological sources within different threshold ranges was analyzed.
In ArcGIS, buffer distance thresholds of 10, 20, 30, 50, 60, 80, 100, 150, 200, 300, 450 and 600 m were used to analyze the overall multi-ring buffer zone of ecological sources, and the average LST data within each buffer range and including the source were calculated. The LST parameters under different distance thresholds from each ecological source are summarized in Table 3.
As such, the LST at different buffer distances was fitted with polynomial (Figure 7a) and logarithmic (Figure 7b) functions, with corresponding fitting equations of y = −2 × 10−05x2 + 0.0122x + 27.545 and y = 0.6512 × ln(x) + 25.762, respectively, and the R2 values were 0.9483 and 0.9490, respectively. According to R2, the fitting degrees were similar, which suitably reflects the very high correlation between the ecological source distance threshold and LST.
Through the derived polynomial fitting equation between the distance threshold of the ecological source area and the LST, the extreme value of the ecological source cooling threshold could be calculated as 305 m. Therefore, it could be preliminarily determined that the thermal environmental effect threshold of the Xuzhou ecological source area reached approximately 300 m.
According to the correlation between the ecological source distance threshold and LST, it could be determined that ecological sources always occurred in areas with a low regional temperature, and with increasing distance from the ecological source, the surface temperature exhibited a consistent and obvious increasing trend. The overall change trend of the surface temperature could be divided into three stages: the first stage involved a rapid increase in the surface temperature. According to the temperature analysis chart, the corresponding distance from the ecological source was approximately 100 m. At the second stage, the increase rate of the surface temperature declined to reach a critical value, and when the critical value was exceeded, the thermal environmental effect of the ecological corridor disappeared, which was observed at approximately 100–300 m from the ecological source. At the third stage, the surface temperature rose to the critical value and began to decline at 300 m from the ecological source. Therefore, it could be preliminarily determined that ecological sources constitute an effective point source tool to regulate and improve the urban thermal environment, and a reasonable spatial layout of the ecological source could significantly improve the urban thermal environment pattern.

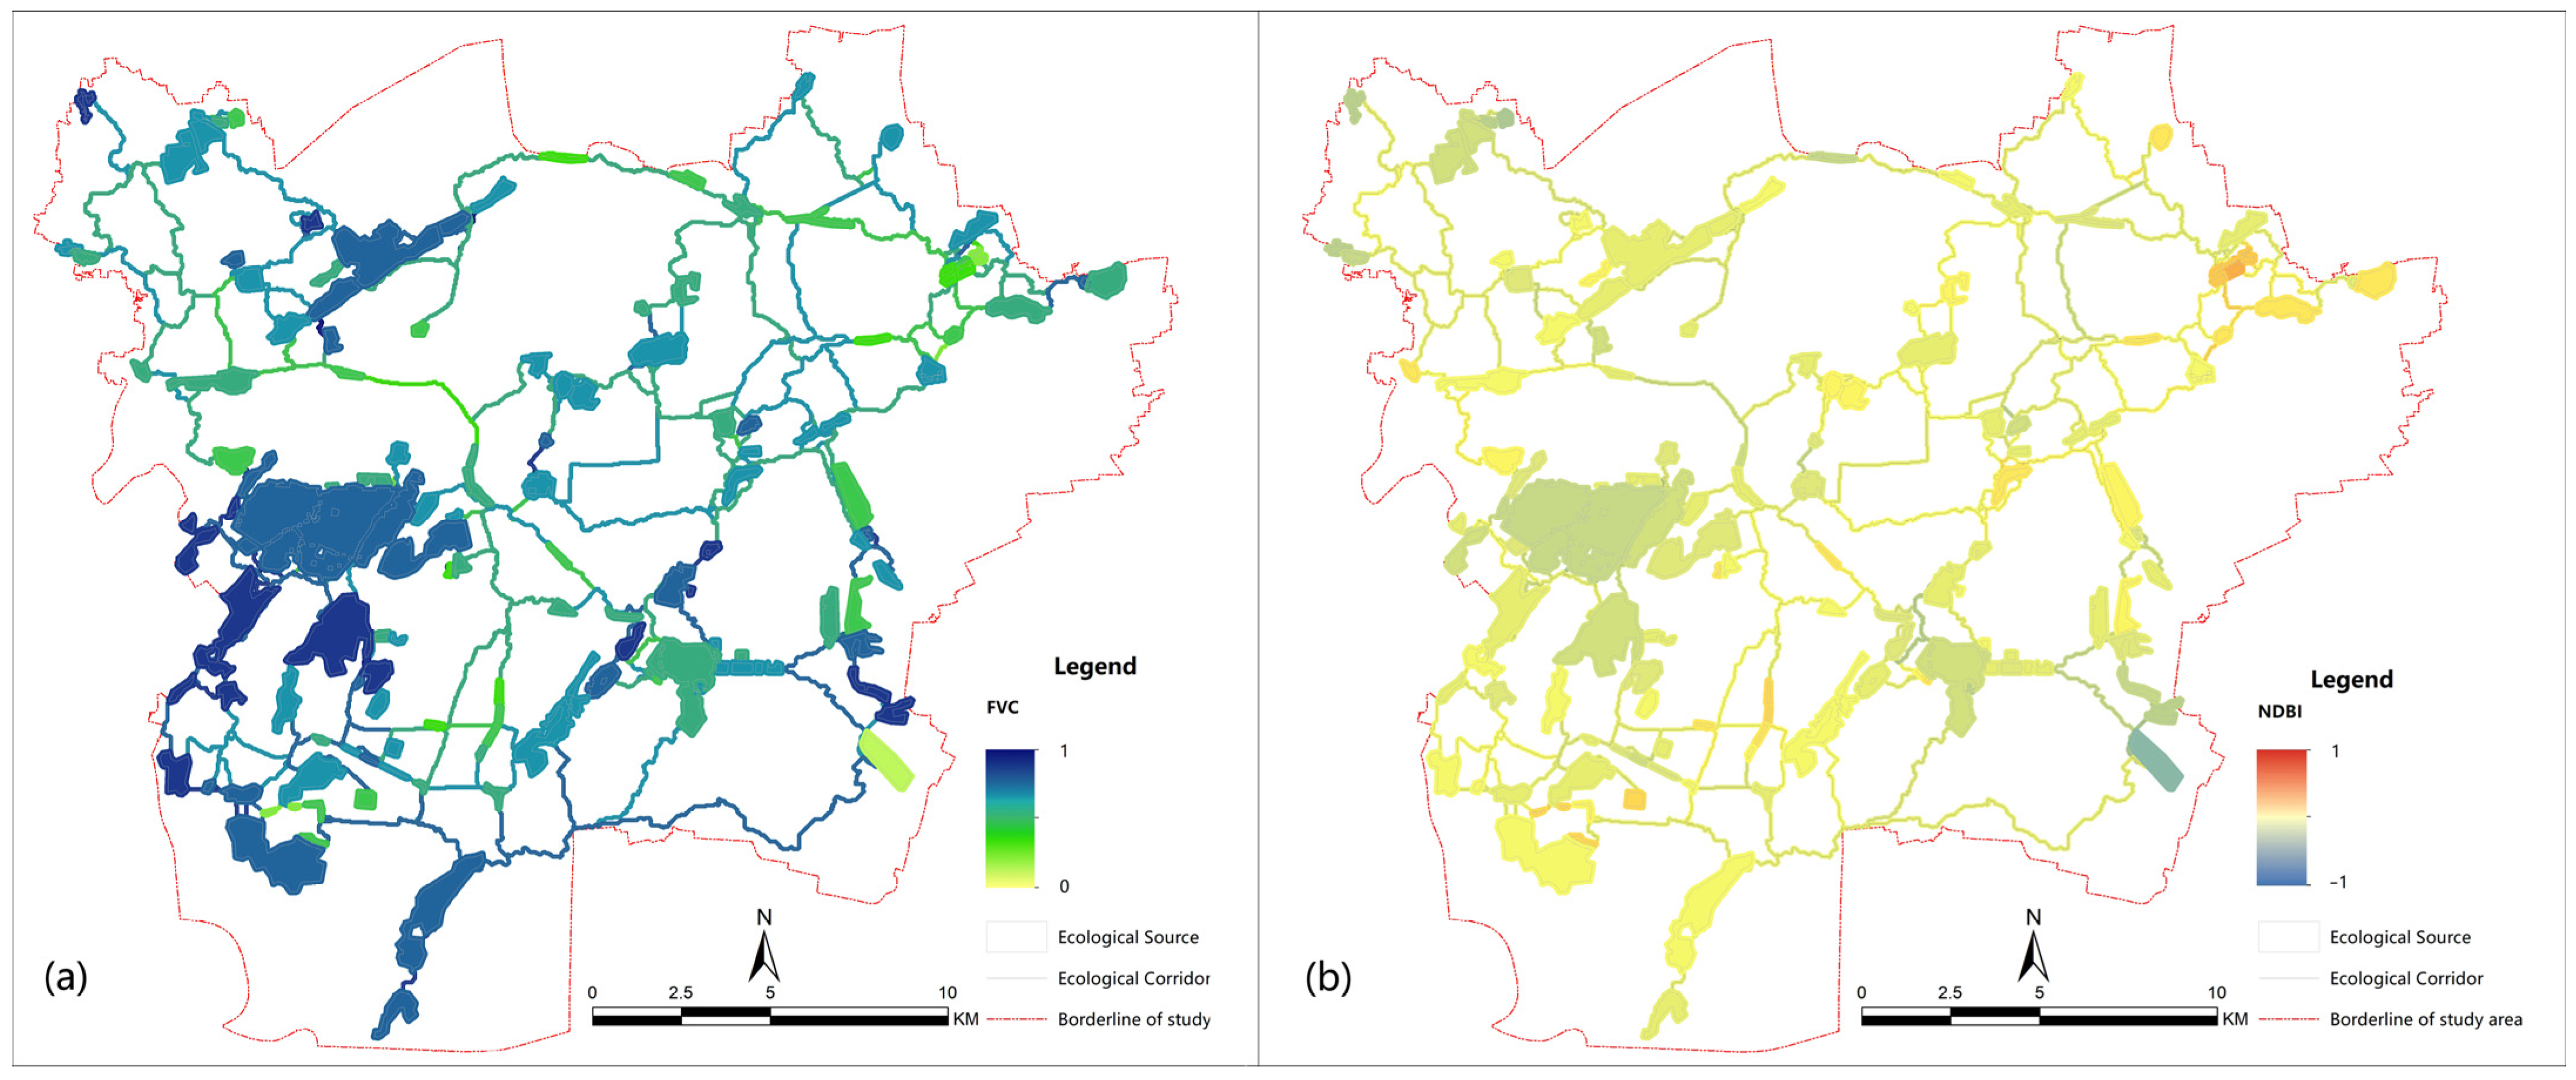
3.3.2. Thermal Environmental Effect of the Ecological Corridors

Ecological corridors can connect ecological sources, promote biological flow, reduce landscape fragmentation, and thus enhance ecosystem stability [107]. In real geographical spaces, different scale thresholds of ecological corridors correspond to various ecological service functions. Generally, the wider the corridor, the higher the corresponding ecological value is and the more interlaced the interfaces between ecological patches and surrounding substrates are, which facilitates ecological service function enhancement. However, in the main urban area, ecological corridors can be constructed based on the minimum ecological resistance, but the degree of urban construction and development can notably vary within different width threshold ranges. Hence, the correlation between the underlying surface remote sensing index and the ecological corridor temperature was not considered, and only the distance threshold of the thermal environmental effect of the ecological corridor was considered. Simultaneously, combined with improvement guidance retrieved from urban thermal environmental effect research, the basic width threshold of ecological corridors based on thermal environmental effects and ecological service functions was determined [108]. In this study, buffer zones of 10, 20, 30, 60, 100, 150, 200, 300, 450 and 600 m were determined, and the thermal environmental effects of ecological corridors within the different threshold ranges were analyzed.
In ArcGIS, choosing 10, 20, 30, 60, 100, 150, 200, 300, 450, and 600 m as the buffer distance thresholds, overall multi-ring buffer analysis of the ecological corridor was conducted, and as such, urban thermal environment parameters (LST) were superimposed, and surface temperature data were obtained in all buffer zones. The LST parameters under different distance thresholds from each ecological corridor are summarized in Table 4.
Consequently, the LST within the different corridor width ranges was fitted with polynomial (Figure 8a) and logarithmic functions (Figure 8b), with fitting equations of y = −7 × 10−06x2 + 0.007x + 27.893 and y = 0.4429 × ln(x) + 26.687, respectively, resulting in R2 values of 0.9938 and 0.9139, respectively. Based on R2, the fitting degrees were similar, which suitably reflects the very high correlation between the ecological corridor distance threshold and surface temperature.
With the derived polynomial fitting equation between the distance threshold of the ecological corridor and the LST, the extreme value of the ecological corridor cooling threshold could be calculated as 500 m. Therefore, it could be preliminarily determined that the thermal environmental effect threshold of the Xuzhou ecological corridor was 500 m.
According to the correlation between the ecological corridor distance threshold and LST, the ecological corridor always occurred in an area with a low regional temperature, and with increasing distance from the ecological corridor, the surface temperature revealed a consistent and obvious increasing trend. The overall change trend of the surface temperature could be divided into three stages: the first stage indicated a rapid increase in the surface temperature. According to the temperature analysis chart, the corresponding distance from the ecological corridor was approximately 60 m. At the second stage, the increase rate of the surface temperature decreased to reach a critical value, and when the critical value was exceeded, the thermal environmental effect of the ecological corridor disappeared, which occurred at approximately 60–500 m from the ecological corridor. At the third stage, the surface temperature increased to the critical value and thereafter declined, which was observed 500 m from the ecological corridor. Therefore, it could be preliminarily determined that the ecological corridor is an effective linear network tool for regulating and improving the urban thermal environment, and ecological corridor spatial structure construction could significantly improve the urban thermal environment pattern.

4. Discussion

4.1. Discussion on Heat and Cold Islands

Usually, the thermal environment of a city is affected by various urban activities, and the urban land carrying urban activities or functions exhibits a notable difference in thermal environment. Generally, production and residential areas are heat effect areas, and ecological lands such as water regions and green land are the main cold effect areas, as seen in the conclusions drawn from previous studies on the relationship between urban land and the thermal environment [24,109,110,111,112,113,114,115,116]. In Xuzhou, there is an obvious heat island effect. Industrial land is the main type of heat island area. Although some ecological land areas are also heat island areas, such as sporadic E2 land scattered across the industrial area in the north of the study area, ecological land is mainly affected by radiation in surrounding areas and the self-form. Therefore, this is still in line with previous research conclusions and shows that urban ecological land is a key land use and an important means to improve the urban thermal environment. Considering the land use, urban thermal environment improvement should properly consider the interconnection between various land uses and corresponding forms, participate in the balance of ecological land at the overall level of the city, and increase the proportion of ecological land within a reasonable range [113,117], considering the land use types and spatial distribution in adjacent areas of ecological land [118,119,120,121] to maximize the cooling effect of ecological land, and avoid the formation of industrial concentration areas with a single land use type. Alternatively, G, E1, E2 and other land use types should be distributed at an appropriate scale and form, with landscaped ecological land [24,67,122,123,124,125,126] in industrial concentration areas to achieve thermal environment regulation.

4.2. Relationship between the Ecological Network and Thermal Environment

Regarding the role of ecological land in improving the urban thermal environment, many studies focus on small- and medium-scale or micro-scale ecological land itself, and there is a lack of research on the relationship between ecological space and urban thermal environment at the macro-scale and overall level. Moreover, previous studies were mainly based on land use classification and explored how to improve the cooling effect of ecological land, without considering the status and role of different ecological land areas in the entire ecological network, which led to a focus on the cooling effect, ignoring its own ecological significance.
The ecological network is an effective organizational form of the ecological space that can yield a comprehensive ecological structure to coordinate various types of ecological land, which can subsequently provide the general advantage of overall ecological effect pattern improvement from a global perspective [127,128,129]. Thermal environment regulation can improve the overall thermal environment pattern. In our study, based on ecological research methods, more targeted cooling measures were formulated by constructing an ecological network and assigning different ecological land areas to their positions and roles in the ecological network. It is the combination of the ecological value of ecological land and the cooling effect. Further appropriate exploration should be conducted on factors within the land of ecological networks, such as the thermal effects of E1, E2, G and other land use types, and the focus of thermal environment regulation should be oriented towards improvement within the set threshold. The ecological source is the ecological space of the entity, and its thermal environmental effect exhibits a spatial threshold. The thermal effect of ecological sources involves internal construction and patch pattern parameters including external form and area scale. For instance, Yunlong Lake is a water area with an area of 6.76 km2, while Jiuli Mountain is a mountain covered mainly by trees. The ecological corridor is an abstract path. Although the ecological corridor also exhibits a thermal effect distance threshold, its internal composition is relatively complex, including various types of urban land, and the associated thermal environment factors are highly complex. Therefore, emphasis should be placed on heat island patch connectivity within the corridor and heat island patch fragmentation/segmentation to enhance heat exchange, further reduce the corridor temperature and improve the corridor cooling effect.

4.3. Relationship between Heat Islands and Ecological Networks

Heat islands are regional phenomena, and the heat islands in Xuzhou are scattered across many points in space. Fully matching the thermal environment with the ecological network in space is the preferred path to divide heat island patches and improve the heat island pattern. The ecological source exerts a notable cooling effect and belongs to the cold island phenomenon as a whole. Internal thermal environment improvement is not the best way to mitigate the UHI effect, and exchange between the thermal environment and heat island patches should be emphasized. The best focus for thermal environment improvement should entail the optimization of the overall ecological corridor structure and internal thermal environment improvement to exert a thermal environment improvement effect within the ecological corridor threshold. At the same time, the radiation range of the cooling effect should be further strengthened, and the spatial threshold of the thermal environmental effect should be increased; in particular, the thermal environment within 60–500 m from the corridor should be improved first to expand the cooling effect, especially the spatial integration of corridors and heat island patches, to improve the network efficiency of thermal environment improvement and optimize the overall thermal pattern.

4.4. Mechanism of Thermal Environment Effect of Ecological Network

The greening coverage level and construction level within the urban site are important factors affecting the thermal environment [130], and the FVC [9] and NDBI [131] indicators are selected to explore the mechanism of the thermal environment effect within the most effective cooling threshold of the ecological network. Since the cooling thresholds of ecological source and ecological corridor are 100 m and 60 m, respectively, the FVC and NDBI within the cooling thresholds of ecological network are counted as shown in Figure 9.
The ecological source is a face area, and the temperature difference within the 100 m threshold of the ecological source is selected as the dependent variable. Since the thermal effect of the faceted ecological space is related to its own area, geometry and other elements [105,125], the area and LSI index are added as independent variables, and the FVC and NDBI indexes of the E2 and G lands are collected as independent variables for correlation analysis, while separate statistics are conducted according to the three types of land, as shown in Figure 10a–j.
In the context of the ecological network, there is a weak correlation between the temperature difference between various ecological sources and their own scale and shape within the cooling threshold, and their own geometric shape is less sensitive to spatial thermal effects. That is, E1, E2 and G land areas selected as ecological sources are less sensitive to the spatial thermal effects of their own geometry. For E2 land areas, their own vegetation cover values are generally high and the amount of construction within the site is generally low, and the two values have less influence on the temperature difference. As for the G land areas, compared with other types of ecological sources, both their NDBI and FVC show high correlations, among which the correlation of NDBI is negative and that of FVC is positive. On the one hand, because the G land areas are located in the inner city, the construction of the surrounding sites is mainly in the built-up areas of the city, and on the other hand, the G land areas are mostly human-made ecological construction spaces, with a certain proportion of construction inside them. This leads to a strong spatial sensitivity of the cooling effect of the construction of the ecological sources mainly in the G category. Therefore, for the temperature regulation of ecological sources, the focus should be on the control of the construction and greening of G land areas.
The ecological corridor is the path of least resistance connecting ecological sources. The surface temperature within the 60 m threshold of the ecological corridor was selected as the dependent variable, and the correlation analysis was performed by collecting FVC and NDBI indicators as independent variables, as shown in Figure 10k,l.
It can be judged that the overall construction volume within the ecological corridor is low, and the temperature within the corridor reflects a good positive correlation with the construction volume, and the higher the construction volume within the ecological corridor, the higher the surface temperature, which also fits with the existing studies. For the vegetation cover in the ecological corridor, the overall value is better but reflects some spatial differences, and the correlation between green cover and surface temperature is poor—that is, in the context of the ecological network, for the ecological corridor, its own level of green cover has no significant effect on the surface temperature. Therefore, for the regulation of ecological corridor temperature, the focus should be on the control of construction volume.

4.5. Guidance for Planning

The urban ecological network is the cold source structure in the urban thermal environment system. Ecological sources and ecological corridors play a certain role in city cooling, and the spatial threshold exhibits clear spatial scale characteristics. The ecological network structure in Xuzhou city was characterized by single-pole high-quality and high-resistance evolution [73]. Within the main urban area, the ecological network structure also exhibited typical spatial and temporal differentiation characteristics, and the thermal environmental effect of ecological sources and ecological corridors reflected a certain distance threshold. However, policies must be implemented. In the current management system of urban and rural planning in China, regulatory detailed planning is the most direct administrative means for land construction, management and control and the implementation of various policies [132]. In the main urban area of Xuzhou, industrial concentration areas and ecological spaces have important spatial distributions of high- and low-temperature areas. Therefore, based on the cooling effect of urban ecological sources and ecological corridors, spatial layout optimization should be explored to improve the thermal environment through the combination of ecological networks, high-temperature patches and planning control units.
In ArcGIS, high-temperature plots, ecological networks and urban land management units (regulatory planning management units) in the main urban area were superimposed on the map, clarifying the spatial distribution of ecological networks and high-temperature areas in the different management units (Figure 11).
In 2019, the ecological network and high-temperature plots were intertwined in the main urban area, and the distribution of the ecological network and high-temperature plots was highly different between the various regulatory management units. Based on the thermal environmental effect of the ecological network, the high-temperature plots in the study area were selected, and the Tyson polygon method was used to optimize ecological network spatial construction and divide the thermal environment. The interweaving of high-temperature plots and the ecological network should be strengthened, heat exchange should be increased, and the LST should consequently be optimized. A Thiessen polygon of the spatial structure comprising the ecological source and ecological corridor was constructed, high-temperature blocks were superimposed, and the vertex and common edges of the Thiessen polygon were selected as alternative points for the spatial construction of future ecological network elements in the ecological source–ecological corridor interwoven area. The thermal environment regulation 60 m from the ecological corridor and 100 m from the ecological source should be strengthened, and it should be regarded as the focus of improving the cooling efficiency of the ecological network, thereby expanding the scope of the ecological network to improve the thermal environment. Since the distance from the vertex of the Thiessen polygon to its three common nodes remained the same, ecological construction at this location could achieve the simultaneous effect of functional connection between three adjacent ecological patches, and the selection of common edges was applicable.
It should be emphasized that the construction of alternative sites should be fully combined with the opportunity for urban renewal, and the construction of ecological corridors or ecological sources at these alternative sites should emphasize the magnitude of the cooling effect. According to existing research, it is possible to improve the cooling threshold of the candidate sites by controlling the land scale, land use form, vegetation coverage, water body area and contour, impervious surface, etc. [24,41,67,118,120,122,123,124,125,133,134] and ensure that it can pass verification of the dPC value for integration into the urban ecological network structure.

4.6. Research Limitations and Future Research Directions

First, this study emphasized the effect of the overall structure of the ecological network on the general thermal landscape pattern of the city, but no in-depth research was conducted on the construction and thermal environment mechanism within the source and corridor width. The ecological network does not comprise a single homogeneous material space. The internal landscape composition of components is complex, and the spatial forms are diverse, which can affect the resultant thermal environmental effect. Therefore, in future research, the thermal environment mechanism of different ecological network components should be explored in detail. Second, although the data collected by remote sensing technology have high spatial resolution, there is still a certain gap in the time accuracy required for continuous monitoring of the urban thermal environment due to the limitations of the considered data sources. As it was temporarily impossible to dynamically and continuously collect temporal and spatial threshold data pertaining to the thermal environmental effects of each ecological network component, this study used data types that are widely used at this stage. The urban thermal environment varies dynamically between different seasons and periods, and each urban ecological network component imposes distinct thermal environmental effects during different periods. Therefore, more accurate, dynamic and continuous quantification of the thermal environmental effects of the ecological network should also constitute a key consideration in future research. Finally, a typical city of average size in China was selected as the research object in this study, but each city exhibits unique characteristics, including climatic conditions, geographical conditions, and ecological background. In the future, thermal environmental effects on urban ecological networks should be more systematically explored through classification.

5. Conclusions

In this study, adopting Xuzhou, a typical city in China, as an example, the LST was retrieved from Landsat remote sensing images, and an ecological network based on the ecological source–ecological corridor model was constructed considering land use data. As such, the thermal environment characteristics of different land use types were described, and the spatial effects of the thermal environment within the ecological network were further explored. Spatial thresholds of the thermal environments of the ecological source and ecological corridor were identified, and strategies to comprehensively improve the urban thermal environment pattern with the urban ecological network were subsequently proposed. The results reveal the following. 1. There exists an obvious spatial distribution of cold and heat islands in Xuzhou, and the spatial aggregation phenomenon can be observed. 2. The main land use composition of heat and cold islands can be defined. M is the main UHI land use type, and G, E1 and E2 are the main cold island land use types. Affected by the morphology and spatial location, the same type of ecological land can exhibit the dual attributes of cold and heat islands. 3. The ecological network functions as a cold source structure in the overall thermal pattern of the city. The threshold of the thermal environment action distance of the ecological source is 300 m, and the threshold of the thermal environment action distance of the ecological corridor is 500 m. 4. In the context of the ecological network, the temperature within the most effective cooling threshold of E1 and E2 land areas in ecological sources is not greatly influenced by these areas’ own indicators, while the temperature within G land areas is mainly influenced by internal construction and vegetation cover in these areas; the temperature within the most effective cooling threshold of ecological corridors is mainly influenced by their construction volume. 5. Urban thermal pattern optimization should focus on improving the thermal environment of heat island patches beyond the threshold of the ecological network and should expand the spatial threshold of the thermal effect by enhancing the ecological network cooling effect. 6. By superimposing the ecological network Tyson polygon and the heat island patch, we determined the application point of Xuzhou to improve the thermal pattern of the ecological network and suggest that it should be implemented with the help of planning and management methods, combined with urban construction. The ecological network is an effective organizational form of the ecological space. This study quantitatively explored the thermal environmental effects of urban ecological networks, which could provide ideas for urban planners or urban ecological environmental researchers to formulate policies to address ecological construction related to the urban thermal environment and a broader perspective for further enrichment of the ecological service functions of urban ecological networks. Simultaneously, the method proposed in this study could be transferred to other countries and cities worldwide with different climatic environments and ecological types to guide and regulate the coordinated construction of better urban thermal and ecological environments.

Author Contributions

Conceptualization, X.L. and N.G.; methodology, X.L. and L.M.; software, N.G., X.L. and L.M.; data curation, N.G., X.L.; writing—original draft preparation, N.G.; writing—review and editing, N.G., X.L. and L.M. All authors have read and agreed to the published version of the manuscript.

Funding

This research was funded by the Natural Science Foundation of Education Department of Anhui Province, grant number KJ2020A0078, the National Training Program of Innovation and Entrepreneurship for Undergraduates, grant number 202010879069, and Provincial College Student Innovation and Entrepreneurship Training Program Support Project of Anhui Province, grant number S202210879018.

Institutional Review Board Statement

Not applicable.

Informed Consent Statement

Not applicable.

Data Availability Statement

Not applicable.

Acknowledgments

The authors acknowledge support from the Natural Science Foundation of Education Department of Anhui Province (grant number KJ2020A0078), the National Training Program of Innovation and Entrepreneurship for Undergraduates (grant number 202010879069) as well as data support from the China Meteorological Administration, the Chinese Academy of Sciences Computer Network Information Center and the Xuzhou urban planning bureau, and Nan Liu, Xinyi Liu, Yingzhou Miao and Mengyuan Zhao, whose majors are in urban and rural planning, College of Architecture, Anhui Science and Technology University. We also thank the editors and the anonymous reviewers for their helpful suggestions in various stages.

Conflicts of Interest

The authors declare no conflict of interest.

References

  1. Zhang, D.L.; Shou, Y.X.; Dickerson, R.R. Upstream urbanization exacerbates urban heat island effects. Geophys. Res. Lett. 2009, 36. [Google Scholar] [CrossRef] [Green Version]
  2. Kalnay, E.; Cai, M. Impact of urbanization and land-use change on climate. Nature 2003, 423, 528–531. [Google Scholar] [CrossRef]
  3. Lin, B.; Liu, H. China’s building energy efficiency and urbanization. Energy Build. 2015, 86, 356–365. [Google Scholar] [CrossRef]
  4. Azhdari, A.; Soltani, A.; Alidadi, M. Urban morphology and landscape structure effect on land surface temperature: Evidence from Shiraz, a semi-arid city. Sustain. Cities Soc. 2018, 41, 853–864. [Google Scholar] [CrossRef]
  5. Mallick, J.; Rahman, A.; Singh, C.K. Modeling urban heat islands in heterogeneous land surface and its correlation with impervious surface area by using night-time ASTER satellite data in highly urbanizing city, Delhi-India. Adv. Space Res. 2013, 52, 639–655. [Google Scholar] [CrossRef]
  6. Dou, Y.; Kuang, W. A comparative analysis of urban impervious surface and green space and their dynamics among 318 different size cities in China in the past 25 years. Sci. Total Environ. 2020, 706, 135828. [Google Scholar] [CrossRef]
  7. Gordon, A.; Simondson, D.; White, M.; Moilanen, A.; Bekessy, S.A. Integrating conservation planning and landuse planning in urban landscapes. Landsc. Urban Plan. 2009, 91, 183–194. [Google Scholar] [CrossRef]
  8. Ferrara, A.; Salvati, L.; Sateriano, A.; Carlucci, M.; Gitas, I.; Biasi, R. Unraveling the ‘stable’ landscape: A multi-factor analysis of unchanged agricultural and forest land (1987–2007) in a rapidly-expanding urban region. Urban Ecosyst. 2016, 19, 835–848. [Google Scholar] [CrossRef]
  9. Zhao, H.; Tan, J.; Ren, Z.; Wang, Z. Spatiotemporal Characteristics of Urban Surface Temperature and Its Relationship with Landscape Metrics and Vegetation Cover in Rapid Urbanization Region. Complexity 2020, 2020, 7892362. [Google Scholar] [CrossRef]
  10. Roth, M.; Lim, V.H. Evaluation of canopy-layer air and mean radiant temperature simulations by a microclimate model over a tropical residential neighbourhood. Build. Environ. 2017, 112, 177–189. [Google Scholar] [CrossRef]
  11. Yang, X.; Li, Y. The impact of building density and building height heterogeneity on average urban albedo and street surface temperature. Build. Environ. 2015, 90, 146–156. [Google Scholar] [CrossRef]
  12. Wong, M.S.; Nichol, J.; Ng, E. A study of the “wall effect” caused by proliferation of high-rise buildings using GIS techniques. Landsc. Urban Plan. 2011, 102, 245–253. [Google Scholar] [CrossRef]
  13. Byomkesh, T.; Nakagoshi, N.; Dewan, A.M. Urbanization and green space dynamics in Greater Dhaka, Bangladesh. Landsc. Ecol. Eng. 2012, 8, 45–58. [Google Scholar] [CrossRef]
  14. Scolozzi, R.; Geneletti, D. A multi-scale qualitative approach to assess the impact of urbanization on natural habitats and their connectivity. Environ. Impact Assess. 2012, 36, 9–22. [Google Scholar] [CrossRef]
  15. Frondoni, R.; Mollo, B.; Capotorti, G. A landscape analysis of land cover change in the Municipality of Rome (Italy): Spatio-temporal characteristics and ecological implications of land cover transitions from 1954 to 2001. Landsc. Urban Plan. 2011, 100, 117–128. [Google Scholar] [CrossRef]
  16. Singh, P.; Kikon, N.; Verma, P. Impact of land use change and urbanization on urban heat island in Lucknow city, Central India. A remote sensing based estimate. Sustain. Cities Soc. 2017, 32, 100–114. [Google Scholar] [CrossRef]
  17. Arshad, M.; Khedher, K.M.; Eid, E.M.; Aina, Y.A. Evaluation of the urban heat island over Abha-Khamis Mushait tourist resort due to rapid urbanisation in Asir, Saudi Arabia. Urban Clim. 2021, 36, 100772. [Google Scholar] [CrossRef]
  18. Kedia, S.; Bhakare, S.P.; Dwivedi, A.K.; Islam, S.; Kaginalkar, A. Estimates of change in surface meteorology and urban heat island over northwest India: Impact of urbanization. Urban Clim. 2021, 36, 100782. [Google Scholar] [CrossRef]
  19. Zank, B.; Bagstad, K.J.; Voigt, B.; Villa, F. Modeling the effects of urban expansion on natural capital stocks and ecosystem service flows: A case study in the Puget Sound, Washington, USA. Landsc. Urban Plan. 2016, 149, 31–42. [Google Scholar] [CrossRef]
  20. Li, Z.; Cheng, X.; Han, H. Future Impacts of Land Use Change on Ecosystem Services under Different Scenarios in the Ecological Conservation Area, Beijing, China. Forests 2020, 11, 584. [Google Scholar] [CrossRef]
  21. Maheng, D.; Pathirana, A.; Zevenbergen, C. A Preliminary Study on the Impact of Landscape Pattern Changes Due to Urbanization: Case Study of Jakarta, Indonesia. Land 2021, 10, 218. [Google Scholar] [CrossRef]
  22. Chen, W.X.; Zeng, J.; Chu, Y.M.; Liang, J.L. Impacts of Landscape Patterns on Ecosystem Services Value: A Multiscale Buffer Gradient Analysis Approach. Remote Sens. 2021, 13, 2551. [Google Scholar] [CrossRef]
  23. Gago, E.J.; Berrizbeitia, S.E.; Torres, R.P.; Muneer, T. Effect of Land Use/Cover Changes on Urban Cool Island Phenomenon in Seville, Spain. Energies 2020, 13, 3040. [Google Scholar] [CrossRef]
  24. Du, H.Y.; Cai, Y.L.; Zhou, F.Q.; Jian, H.; Jiang, W.Y.; Xu, Y.Q. Urban blue-green space planning based on thermal environment simulation: A case study of Shanghai, China. Ecol. Indic. 2019, 106, 105501. [Google Scholar] [CrossRef]
  25. Nor, A.N.M.; Corstanje, R.; Harris, J.A.; Grafius, D.R.; Siriwardena, G.M. Ecological connectivity networks in rapidly expanding cities. Heliyon 2017, 3, e325. [Google Scholar] [CrossRef] [Green Version]
  26. Serret, H.; Raymond, R.; Foltête, J.; Clergeau, P.; Simon, L.; Machon, N. Potential contributions of green spaces at business sites to the ecological network in an urban agglomeration: The case of the Ile-de-France region, France. Landsc. Urban Plan. 2014, 131, 27–35. [Google Scholar] [CrossRef]
  27. Ersoy, E.; Jorgensen, A.; Warren, P.H. Green and ecological networks in Sheffield, UK. Landsc. Res. 2019, 44, 922–936. [Google Scholar] [CrossRef]
  28. Muderrisoglu, H.; Oguz, D.; Sensoy, N. An evaluation of green areas from the point of user satisfaction in Ankara, Turkey: Gap analyses method. Afr. J. Agric. Res. 2010, 5, 1036–1042. [Google Scholar]
  29. Liu, W.Y.; Lin, Y.Z.; Hsieh, C.M. Assessing the Ecological Value of an Urban Forest Park: A Case Study of Sinhua Forest Park in Taiwan. Forests 2021, 12, 806. [Google Scholar] [CrossRef]
  30. Hong, W.Y.; Guo, R.Z. Indicators for quantitative evaluation of the social services function of urban greenbelt systems: A case study of shenzhen, China. Ecol. Indic. 2017, 75, 259–267. [Google Scholar] [CrossRef]
  31. Kopecká, M.; Szatmári, D.; Rosina, K. Analysis of Urban Green Spaces Based on Sentinel-2A: Case Studies from Slovakia. Land 2017, 6, 25. [Google Scholar] [CrossRef] [Green Version]
  32. Egerer, M.; Anderson, E. Social-Ecological Connectivity to Understand Ecosystem Service Provision across Networks in Urban Landscapes. Land 2020, 9, 530. [Google Scholar] [CrossRef]
  33. Hu, T.; Peng, J.; Liu, Y.X.; Wu, J.S.; Li, W.F.; Zhou, B.B. Evidence of green space sparing to ecosystem service improvement in urban regions: A case study of China’s Ecological Red Line policy. J. Clean. Prod. 2020, 251, 119678. [Google Scholar] [CrossRef]
  34. Semeraro, T.; Scarano, A.; Buccolieri, R.; Santino, A.; Aarrevaara, E. Planning of Urban Green Spaces: An Ecological Perspective on Human Benefits. Land 2021, 10, 105. [Google Scholar] [CrossRef]
  35. Ramyar, R. Social ecological mapping of urban landscapes: Challenges and perspectives on ecosystem services in Mashhad, Iran. Habitat Int. 2019, 92, 102043. [Google Scholar] [CrossRef]
  36. Yang, J.; Sun, J.; Ge, Q.; Li, X. Assessing the impacts of urbanization-associated green space on urban land surface temperature: A case study of Dalian, China. Urban For. Urban Green. 2017, 22, 1–10. [Google Scholar] [CrossRef]
  37. Masoudi, M.; Tan, P.Y. Multi-year comparison of the effects of spatial pattern of urban green spaces on urban land surface temperature. Landsc. Urban Plan. 2019, 184, 44–58. [Google Scholar] [CrossRef]
  38. Maimaitiyiming, M.; Ghulam, A.; Tiyip, T.; Pla, F.; Latorre-Carmona, P.; Halik, Ü.; Sawut, M.; Caetano, M. Effects of green space spatial pattern on land surface temperature: Implications for sustainable urban planning and climate change adaptation. ISPRS J. Photogramm. Remote Sens. 2014, 89, 59–66. [Google Scholar] [CrossRef] [Green Version]
  39. Chen, A.; Yao, X.A.; Sun, R.; Chen, L. Effect of urban green patterns on surface urban cool islands and its seasonal variations. Urban For. Urban Green. 2014, 13, 646–654. [Google Scholar] [CrossRef]
  40. Xiao, X.D.; Dong, L.; Yan, H.; Yang, N.; Xiong, Y. The influence of the spatial characteristics of urban green space on the urban heat island effect in Suzhou Industrial Park. Sustain. Cities Soc. 2018, 40, 428–439. [Google Scholar] [CrossRef]
  41. Yao, L.; Li, T.; Xu, M.; Xu, Y. How the landscape features of urban green space impact seasonal land surface temperatures at a city-block-scale: An urban heat island study in Beijing, China. Urban For. Urban Green. 2020, 52, 126704. [Google Scholar] [CrossRef]
  42. Wu, C.; Li, J.; Wang, C.; Song, C.; Haase, D.; Breuste, J.; Finka, M. Estimating the Cooling Effect of Pocket Green Space in High Density Urban Areas in Shanghai, China. Front. Environ. Sci. 2021, 9, 181. [Google Scholar] [CrossRef]
  43. Lin, W.; Yu, T.; Chang, X.; Wu, W.; Zhang, Y. Calculating cooling extents of green parks using remote sensing: Method and test. Landsc. Urban Plan. 2015, 134, 66–75. [Google Scholar] [CrossRef]
  44. Feyisa, G.L.; Dons, K.; Meilby, H. Efficiency of parks in mitigating urban heat island effect: An example from Addis Ababa. Landsc. Urban Plan. 2014, 123, 87–95. [Google Scholar] [CrossRef]
  45. Amani-Beni, M.; Zhang, B.; Xie, G.; Shi, Y. Impacts of Urban Green Landscape Patterns on Land Surface Temperature: Evidence from the Adjacent Area of Olympic Forest Park of Beijing, China. Sustainability 2019, 11, 513. [Google Scholar] [CrossRef] [Green Version]
  46. Yilmaz, S.; Mutlu, E.; Yilmaz, H. Alternative scenarios for ecological urbanizations using ENVI-met model. Environ. Sci. Pollut. Res. 2018, 25, 26307–26321. [Google Scholar] [CrossRef]
  47. Yu, Z.; Fryd, O.; Sun, R.; Jrgensen, G.; Vejre, H. Where and how to cool? An idealized urban thermal security pattern model. Landsc. Ecol. 2021, 36, 2165–2174. [Google Scholar] [CrossRef]
  48. Estoque, R.C.; Murayama, Y.; Myint, S.W. Effects of landscape composition and pattern on land surface temperature: An urban heat island study in the megacities of Southeast Asia. Sci. Total Environ. 2016, 577, 349. [Google Scholar] [CrossRef]
  49. Li, X.; Zhou, W.; Ouyang, Z. Relationship between land surface temperature and spatial pattern of greenspace: What are the effects of spatial resolution? Landsc. Urban Plan. 2013, 114, 1–8. [Google Scholar] [CrossRef]
  50. Tong, H.; Shi, P.; Bao, S.; Zhang, X.; Nie, X. Optimization of Urban Land Development Spatial Allocation Based on Ecology-Economy Comparative Advantage Perspective. J. Urban Plan. Dev. 2018, 144, 5018006. [Google Scholar] [CrossRef]
  51. Sanches, P.M.; Mesquita Pellegrino, P.R. Greening potential of derelict and vacant lands in urban areas. Urban For. Urban Green. 2016, 19, 128–139. [Google Scholar] [CrossRef]
  52. Du, C.; Ren, H.; Qin, Q.; Meng, J.; Zhao, S. A Practical Split-Window Algorithm for Estimating Land Surface Temperature from Landsat 8 Data. Remote Sens. 2015, 7, 647–665. [Google Scholar] [CrossRef] [Green Version]
  53. Wang, F.; Qin, Z.; Song, C.; Tu, L.; Karnieli, A.; Zhao, S. An Improved Mono-Window Algorithm for Land Surface Temperature Retrieval from Landsat 8 Thermal Infrared Sensor Data. Remote Sens. 2015, 7, 4268–4289. [Google Scholar] [CrossRef] [Green Version]
  54. Yu, X.; Guo, X.; Wu, Z. Land Surface Temperature Retrieval from Landsat 8 TIRS—Comparison between Radiative Transfer Equation-Based Method, Split Window Algorithm and Single Channel Method. Remote Sens. 2014, 6, 9829–9852. [Google Scholar] [CrossRef] [Green Version]
  55. Vogt, P.; Riitters, K.H.; Iwanowski, M.; Estreguil, C.; Kozak, J.; Soille, P. Mapping landscape corridors. Ecol. Indic. 2007, 7, 481–488. [Google Scholar] [CrossRef]
  56. Wang, S.; Wu, M.; Hu, M.; Fan, C.; Wang, T.; Xia, B. Promoting landscape connectivity of highly urbanized area: An ecological network approach. Ecol. Indic. 2021, 125, 107487. [Google Scholar] [CrossRef]
  57. Foltête, J.; Girardet, X.; Clauzel, C. A methodological framework for the use of landscape graphs in land-use planning. Landsc. Urban Plan. 2014, 124, 140–150. [Google Scholar] [CrossRef]
  58. McRae, B.H.; Dickson, B.G.; Keitt, T.H.; Shah, V.B. Using circuit theory to model connectivity in ecology, evolution, and conservation. Ecology 2008, 89, 2712–2724. [Google Scholar] [CrossRef]
  59. Leonard, P.B.; Duffy, E.B.; Baldwin, R.F.; McRae, B.H.; Shah, V.B.; Mohapatra, T.K. Gflow: Software for modelling circuit theory-based connectivity at any scale. Methods Ecol. Evol. 2017, 8, 519–526. [Google Scholar] [CrossRef] [Green Version]
  60. Heintzman, L.J.; McIntyre, N.E. Assessment of playa wetland network connectivity for amphibians of the south-central Great Plains (USA) using graph-theoretical, least-cost path, and landscape resistance modelling. Landsc. Ecol. 2021, 36, 1117–1135. [Google Scholar] [CrossRef]
  61. Zhang, Y.; Jiang, Z.; Li, Y.; Yang, Z.; Wang, X.; Li, X. Construction and Optimization of an Urban Ecological Security Pattern Based on Habitat Quality Assessment and the Minimum Cumulative Resistance Model in Shenzhen City, China. Forests 2021, 12, 847. [Google Scholar] [CrossRef]
  62. Ye, H.; Yang, Z.; Xu, X. Ecological Corridors Analysis Based on MSPA and MCR Model—A Case Study of the Tomur World Natural Heritage Region. Sustainability 2020, 12, 959. [Google Scholar] [CrossRef] [Green Version]
  63. Li, J.X.; Song, C.H.; Cao, L.; Zhu, F.G.; Meng, X.L.; Wu, J.G. Impacts of landscape structure on surface urban heat islands: A case study of Shanghai, China. Remote Sens. Environ. 2011, 115, 3249–3263. [Google Scholar] [CrossRef]
  64. Kong, F.H.; Yin, H.W.; James, P.; Hutyra, L.R.; He, H.S. Effects of spatial pattern of greenspace on urban cooling in a large metropolitan area of eastern China. Landsc. Urban Plan. 2014, 128, 35–47. [Google Scholar] [CrossRef]
  65. Cai, Z.; Han, G.F.; Chen, M.C. Do water bodies play an important role in the relationship between urban form and land surface temperature? Sustain. Cities Soc. 2018, 39, 487–498. [Google Scholar] [CrossRef]
  66. Wu, C.Y.; Li, J.X.; Wang, C.F.; Song, C.H.; Chen, Y.; Finka, M.; La Rosa, D. Understanding the relationship between urban blue infrastructure and land surface temperature. Sci. Total Environ. 2019, 694, 133742. [Google Scholar] [CrossRef] [PubMed]
  67. Siu, L.W.; Hart, M.A. Quantifying urban heat island intensity in Hong Kong SAR, China. Environ. Monit. Assess. 2013, 185, 4383–4398. [Google Scholar] [CrossRef] [Green Version]
  68. Chow, W.; Brazel, A.J. Assessing xeriscaping as a sustainable heat island mitigation approach for a desert city. Build. Environ. 2012, 47, 170–181. [Google Scholar] [CrossRef]
  69. Miles, V.; Esau, I. Seasonal and Spatial Characteristics of Urban Heat Islands (UHIs) in Northern West Siberian Cities. Remote Sens. 2017, 9, 989. [Google Scholar] [CrossRef] [Green Version]
  70. Wu, D. A Quantitative Study on Land Use Change Trajectories and Urban Heat Island. Master’s Thesis, China University of Mining and Technology, Beijing, China, 2017. [Google Scholar]
  71. Meng, Y. Study on Spatiotemporal Expansion and Thermal Environment of Impervious Surface in Xuzhou City. Master’s Thesis, China University of Mining and Technology, Beijing, China, 2020. [Google Scholar]
  72. Liang, X.; Ji, X.; Guo, N.; Meng, L. Assessment of urban heat islands for land use based on urban planning: A case study in the main urban area of Xuzhou City, China. Environ. Earth Sci. 2021, 80, 1–22. [Google Scholar] [CrossRef]
  73. Xinbin, L.; Xiang, J.; Nana, G.; Lingran, M.; Fang, Q. Evolution Characteristics of the Ecological Space Network of Resource-Based Cities: A Case Study on Xuzhou. China City Plan. Rev. 2021, 30, 62–74. [Google Scholar]
  74. Wang, R.; Zhao, J. Examining the Coexistence of People’s Satisfaction and Ecological Quality in Urban Green Space. J. Urban Plan. Dev. 2021, 147, 5021002. [Google Scholar] [CrossRef]
  75. Tao, Y.; Wang, Q.; Zou, Y. Simulation and Analysis of Urban Production–Living–Ecological Space Evolution Based on a Macro–Micro Joint Decision Model. Int. J. Environ. Res. Public Health 2021, 18, 9832. [Google Scholar] [CrossRef] [PubMed]
  76. Shiyuan, Z.; Jiang, C.; Pingjia, L.; Yan, D. Research into planning guidance during the transformation of resource-based cities: A case study of Xuzhou city. China Min. Mag. 2016, 25, 88–92. [Google Scholar]
  77. Wang, Y.C.; Zhang, Y.; Ding, N.; Qin, K.; Yang, X.Y. Simulating the Impact of Urban Surface Evapotranspiration on the Urban Heat Island Effect Using the Modified RS-PM Model: A Case Study of Xuzhou, China. Remote Sens. 2020, 12, 578. [Google Scholar] [CrossRef] [Green Version]
  78. Liang, X. Study on Surface Thermal Environment of Xuzhou City Based on Spatial Planning. Ph.D. Thesis, China University of Mining and Technology, Beijing, China, 2021. [Google Scholar]
  79. Sobrino, J.A.; Jiménez-Muoz, J.C.; Paolini, L. Land surface temperature retrieval from LANDSAT TM 5. Remote Sens. Environ. 2004, 90, 434–440. [Google Scholar] [CrossRef]
  80. Qin, Z.; Karnieli, A.; Berliner, P. A mono-window algorithm for retrieving land surface temperature from Landsat TM data and its application to the Israel-Egypt border region. Int. J. Remote Sens. 2001, 22, 3719–3746. [Google Scholar] [CrossRef]
  81. Xu, H. Analysis on urban heat island effect based on the dynamics of urban surface biophysical descriptors. Acta Ecol. Sin. 2011, 31, 3890–3901. [Google Scholar]
  82. Song, S.; Xu, D.W.; Hu, S.S.; Shi, M.X. Ecological Network Optimization in Urban Central District Based on Complex Network Theory: A Case Study with the Urban Central District of Harbin. Int. J. Environ. Res. Public Health 2021, 18, 1427. [Google Scholar] [CrossRef]
  83. Su, K.; Yu, Q.; Yue, D.; Zhang, Q.; Yang, L.; Liu, Z.; Niu, T.; Sun, X. Simulation of a forest-grass ecological network in a typical desert oasis based on multiple scenes. Ecol. Model. 2019, 413, 108834. [Google Scholar] [CrossRef]
  84. Ariken, M.; Zhang, F.; Liu, K.; Fang, C.L.; Kung, H.T. Coupling coordination analysis of urbanization and eco-environment in Yanqi Basin based on multi-source remote sensing data. Ecol. Indic. 2020, 114, 106331. [Google Scholar] [CrossRef]
  85. Marrotte, R.R.; Gonzalez, A.; Millien, V. Landscape resistance and habitat combine to provide an optimal model of genetic structure and connectivity at the range margin of a small mammal. Mol. Ecol. 2014, 23, 3983–3998. [Google Scholar] [CrossRef] [PubMed]
  86. Ma, J. Research on Optimization Strategy of Complex Network Information Capacity. Ph.D. Thesis, Harbin Institute of Technology, Harbin, China, 2016. [Google Scholar]
  87. Hu, C.; Wang, Z.; Wang, Y.; Sun, D.; Zhang, J. Combining MSPA-MCR Model to Evaluate the Ecological Network in Wuhan, China. Land 2022, 11, 213. [Google Scholar] [CrossRef]
  88. Taylor, P.D.; Fahrig, L.; Merriam, K.H.A.G. Connectivity Is a Vital Element of Landscape Structure. Oikos 1993, 68, 571–573. [Google Scholar] [CrossRef] [Green Version]
  89. Zhang, Y. Study on Landscape Pattern and Connectivity of Urban Green Space in Changsha City. Master’s Thesis, Central South University of Forestry and Technology, Changsha, China, 2009. [Google Scholar]
  90. Pascual-Hortal, L.; Saura, S. Comparison and development of new graph-based landscape connectivity indices: Towards the priorization of habitat patches and corridors for conservation. Landsc. Ecol. 2006, 21, 959–967. [Google Scholar] [CrossRef]
  91. Liu, C.; Zhou, B.; He, X.; Chen, W. Selection of distance thresholds of urban forest landscape connectivity in Shenyang City. Chin. J. Appl. Ecol. 2010, 21, 2508–2516. [Google Scholar]
  92. Meng, J.; Wang, Y.; Wang, X.; Zhou, Z.; Sun, N. Construction of landscape ecological security pattern in Guiyang based on Mcr model. Resour. Environ. Yangtze Basin 2016, 25, 1052–1061. [Google Scholar]
  93. Meng, L.; Wu, J.; Dong, J. Spatial differentiation and layout optimization of rural settlements in hill ecological protection area. Trans. Chin. Soc. Agric. Eng. 2017, 33, 278–286. [Google Scholar]
  94. Yu, K.; Wang, S.; Li, D.; Li, C. The function of ecological security patterns as an urban growth framework in Beijing. Acta Ecol. Sin. 2009, 29, 1189–1204. [Google Scholar]
  95. Huang, X.; Wu, C.; You, H.; Xiao, W.; Zhong, S. Construction of rural landscape ecological corridor in water network plain area based on MCR Model. Trans. Chin. Soc. Agric. Eng. 2019, 35, 243–251. [Google Scholar]
  96. Zhou, Y. Developing urban greenspace ecological network in Chengdu City center based on multiple objectives. J. Zhejiang A F Univ. 2019, 36, 359–365. [Google Scholar]
  97. Zheng, Q.; Ceng, J.; Luo, J.; Cui, J.; Sun, X. Spatial Structure and Space Governance of Ecological Network in Wuhan City. Econ. Geogr. 2018, 38, 191–199. [Google Scholar]
  98. Jin, G.; Shi, X.; He, D.; Guo, B.; Li, Z.; Shi, X. Designing a spatial pattern to rebalance the orientation of development and protection in Wuhan. J. Geogr. Sci. 2020, 30, 569–582. [Google Scholar] [CrossRef]
  99. Zhu, K.; Chen, Y.; Zhang, S.; Yang, Z.; Huang, L.; Lei, B.; Li, L.; Zhou, Z.; Xiong, H.; Li, X. Identification and prevention of agricultural non-point source pollution risk based on the minimum cumulative resistance model. Glob. Ecol. Conserv. 2020, 23, e1149. [Google Scholar] [CrossRef]
  100. Chang, Q.; Liu, X.; Wu, J.; He, P. MSPA-Based Urban Green Infrastructure Planning and Management Approach for Urban Sustainability: Case Study of Longgang in China. J. Urban Plan. Dev. 2015, 141, A5014006. [Google Scholar] [CrossRef]
  101. Li, H.; Chen, W.; He, W. Planning of Green Space Ecological Network in Urban Areas: An Example of Nanchang, China. Int. J. Environ. Res. Public Health 2015, 12, 12889–12904. [Google Scholar] [CrossRef] [Green Version]
  102. Liang, X.; Guo, N.; Lian, H.; Zhou, B. Construction and Optimization of Urban Area Ecological Network. Chongqing Archit. 2021, 20, 5–8. [Google Scholar]
  103. Amani-Beni, M.; Zhang, B.; Xie, G.; Odgaard, A.J. Impacts of the Microclimate of a Large Urban Park on Its Surrounding Built Environment in the Summertime. Remote Sens. 2021, 13, 4703. [Google Scholar] [CrossRef]
  104. Rakoto, P.Y.; Deilami, K.; Hurley, J.; Amati, M.; Sun, Q.C. Revisiting the cooling effects of urban greening: Planning implications of vegetation types and spatial configuration. Urban For. Urban Green 2021, 64, 127266. [Google Scholar] [CrossRef]
  105. Wang, H.Z. Urban Ecological Network Research—Taking Xiamen City as an Example. Master’s Thesis, East China Normal University, Shanghai, China, 2005. [Google Scholar]
  106. Haggett, P.; Chorley, R.J. Network Analysis in Geography; St. Martin’s Press: New York, NY, USA, 1970; Volume 1. [Google Scholar]
  107. Yu, M. Regional Eco-Corridor Construction under the Context of Human Activity: A Case Study of Liaoning Province, China. Master’s Thesis, Dalian University of Technology, Dalian, China, 2015. [Google Scholar]
  108. Zhu, Q.; Yu, K.; Li, D. The width of ecological corridor in landscape planning. Acta Ecol. Sin. 2005, 25, 2406–2412. [Google Scholar]
  109. Li, B.; Liu, Y.; Xing, H.; Meng, Y.; Yang, G.; Liu, X.; Zhao, Y. Integrating urban morphology and land surface temperature characteristics for urban functional area classification. Geo-Spat. Inf. Sci. 2022, 1, 1–16. [Google Scholar] [CrossRef]
  110. Tepanosyan, G.; Muradyan, V.; Hovsepyan, A.; Pinigin, G.; Medvedev, A.; Asmaryan, S. Studying spatial-temporal changes and relationship of land cover and surface Urban Heat Island derived through remote sensing in Yerevan, Armenia. Build. Environ. 2021, 187, 107390. [Google Scholar] [CrossRef]
  111. Yao, L.; Xu, Y.; Zhang, B. Effect of urban function and landscape structure on the urban heat island phenomenon in Beijing, China. Landsc. Ecol. Eng. 2019, 15, 379–390. [Google Scholar] [CrossRef]
  112. Liu, X.; Xiao, Z.; Liu, R. A Spatio-Temporal Bayesian Model for Estimating the Effects of Land Use Change on Urban Heat Island. ISPRS Int. J. Geo-Inf. 2019, 8, 522. [Google Scholar] [CrossRef] [Green Version]
  113. Qiu, G.Y.; Zou, Z.; Li, X.; Li, H.; Guo, Q.; Yan, C.; Tan, S. Experimental studies on the effects of green space and evapotranspiration on urban heat island in a subtropical megacity in China. Habitat Int. 2017, 68, 30–42. [Google Scholar] [CrossRef]
  114. Ma, Y.; Liu, A.M.; Wang, T.X.; Xie, G.D.; Zhao, M.Y. IEEE urban heat island monitoring and analysis based on remotely SENSED data. In Proceedings of the IEEE International Geoscience and Remote Sensing Symposium (IGARSS), Melbourne, Australia, 21–26 July 2013; pp. 1493–1496. [Google Scholar]
  115. Huang, Q.; Huang, J.; Yang, X.; Fang, C.; Liang, Y. Quantifying the seasonal contribution of coupling urban land use types on Urban Heat Island using Land Contribution Index: A case study in Wuhan, China. Sustain. Cities Soc. 2019, 44, 666–675. [Google Scholar] [CrossRef]
  116. Su, W.; Gu, C.; Yang, G. Assessing the Impact of Land Use/Land Cover on Urban Heat Island Pattern in Nanjing City, China. J. Urban Plan. Dev. 2010, 136, 365–372. [Google Scholar] [CrossRef]
  117. Yin, C.; Yuan, M.; Lu, Y.; Huang, Y.; Liu, Y. Effects of urban form on the urban heat island effect based on spatial regression model. Sci. Total Environ. 2018, 634, 696–704. [Google Scholar] [CrossRef]
  118. Huang, H.C.; Yun, Y.X.; Xu, J.G.; Wang, S.Z.; Zheng, X.; Fu, J.; Bao, L.T. Scale and attenuation of water bodies on urban heat islands. Open House Int. 2017, 42, 108–111. [Google Scholar] [CrossRef]
  119. Wang, Y.; Zhan, Q.; Ouyang, W. How to quantify the relationship between spatial distribution of urban waterbodies and land surface temperature? Sci. Total Environ. 2019, 671, 1–9. [Google Scholar] [CrossRef]
  120. Yang, S.J.; Ran, G.P.; Zhang, W.; Wang, Z.H. The cooling effect of an urban lake landscape on the urban heat island: A case study in Jinan, China. Appl. Ecol. Environ. Res. 2020, 18, 2197–2211. [Google Scholar] [CrossRef]
  121. Ke, X.; Men, H.; Zhou, T.; Li, Z.; Zhu, F. Variance of the impact of urban green space on the urban heat island effect among different urban functional zones: A case study in Wuhan. Urban For. Urban Green. 2021, 62, 127159. [Google Scholar] [CrossRef]
  122. Sun, R.; Chen, L. How can urban water bodies be designed for climate adaptation? Landsc. Urban Plan. 2012, 105, 27–33. [Google Scholar] [CrossRef]
  123. Du, H.; Song, X.; Jiang, H.; Kan, Z.; Wang, Z.; Cai, Y. Research on the cooling island effects of water body: A case study of Shanghai, China. Ecol. Indic. 2016, 67, 31–38. [Google Scholar] [CrossRef]
  124. Du, H.; Cai, W.; Xu, Y.; Wang, Z.; Wang, Y.; Cai, Y. Quantifying the cool island effects of urban green spaces using remote sensing Data. Urban For. Urban Green. 2017, 27, 24–31. [Google Scholar] [CrossRef]
  125. Hu, Y.; Dai, Z.; Guldmann, J. Greenspace configuration impact on the urban heat island in the Olympic Area of Beijing. Environ. Sci. Pollut. Res. 2021, 28, 33096–33107. [Google Scholar] [CrossRef]
  126. Jiang, Y.; Huang, J.; Shi, T.; Wang, H. Interaction of Urban Rivers and Green Space Morphology to Mitigate the Urban Heat Island Effect: Case-Based Comparative Analysis. Int. J. Environ. Res. Public Health 2021, 18, 11404. [Google Scholar] [CrossRef]
  127. Huang, L.; Wang, J.; Fang, Y.; Zhai, T.; Cheng, H. An integrated approach towards spatial identification of restored and conserved priority areas of ecological network for implementation planning in metropolitan region. Sustain. Cities Soc. 2021, 69, 102865. [Google Scholar] [CrossRef]
  128. Isaac, N.J.B.; Brotherton, P.N.M.; Bullock, J.M.; Gregory, R.D.; Boehning-Gaese, K.; Connor, B.; Crick, H.Q.P.; Freckleton, R.P.; Gill, J.A.; Hails, R.S.; et al. Defining and delivering resilient ecological networks: Nature conservation in England. J. Appl. Ecol. 2018, 55, 2537–2543. [Google Scholar] [CrossRef]
  129. Cook, E.A. Landscape structure indices for assessing urban ecological networks. Landsc. Urban Plan. 2002, 58, 269–280. [Google Scholar] [CrossRef]
  130. Ezimand, K.; Azadbakht, M.; Aghighi, H. Analyzing the effects of 2D and 3D urban structures on LST changes using remotely sensed data. Sustain. Cities Soc. 2021, 74, 103216. [Google Scholar] [CrossRef]
  131. Dos Santos, A.R.; de Oliveira, F.S.; Da Silva, A.G.; Gleriani, J.M.; Goncalves, W.; Moreira, G.L.; Silva, F.G.; Branco, E.; Moura, M.M.; Da Silva, R.G.; et al. Spatial and temporal distribution of urban heat islands. Sci. Total Environ. 2017, 605, 946–956. [Google Scholar] [CrossRef] [PubMed]
  132. Cai, Z. The Future Development of Regulatory Detailed Planning in China—A Study on How Regulatory Detailed Planning Accommodates the Needs of Urban Planning Management. Master’s Thesis, Tsinghua University, Beijing, China, 2004. [Google Scholar]
  133. Sun, X.; Tan, X.; Chen, K.; Song, S.; Zhu, X.; Hou, D. Quantifying landscape-metrics impacts on urban green-spaces and water-bodies cooling effect: The study of Nanjing, China. Urban For. Urban Green. 2020, 55, 126838. [Google Scholar] [CrossRef]
  134. Tong, S.; Wong, N.H.; Tan, C.L.; Jusuf, S.K.; Ignatius, M.; Tan, E. Impact of urban morphology on microclimate and thermal comfort in northern China. Sol. Energy 2017, 155, 212–223. [Google Scholar] [CrossRef]
Figure 1. Basic geographic information of the study area: (a) location; (b) land use status in 2019; (c) land surface temperature.
Sustainability 14 07744 g001
Figure 2. Spatial distribution of cold and heat island areas.
Sustainability 14 07744 g002
Figure 3. Ecological spatial level of the LST.
Sustainability 14 07744 g003
Figure 4. MSPA and connectivity calculation results: (a) MSPA result; (b) connectivity of core in MSPA result.
Sustainability 14 07744 g004
Figure 5. Ecological resistance surface and ecological network: (a) ecological resistance surface; (b) ecological network.
Sustainability 14 07744 g005
Figure 6. Classification of heat islands in the ecological source area.
Sustainability 14 07744 g006
Figure 7. Fitting results of the ecological source distance threshold to the surface temperature: (a) polynomial fit; (b) logarithmic fit.
Sustainability 14 07744 g007
Figure 8. Fitting results of the ecological corridor width threshold to the surface temperature: (a) polynomial fit; (b) logarithmic fit.
Sustainability 14 07744 g008
Figure 9. The greening coverage level and construction leve within the cooling threshold of ecological sources and ecological corridors. (a) FVC; (b) NDVI.
Sustainability 14 07744 g009
Figure 10. Correlation analysis of intra-threshold characteristics of ecological sources and ecological corridors with LST. (a) Area of E2 with LST, (b) LSI of E2 with LST, (c) NDBI of E2 with LST, (d) FVC of E2 with LST, (e) Area of G with LST, (f) LSI of G with LST, (g) NDBI of G with LST, (h) FVC of G with LST, (i) Area of E1 with LST, (j) LSI of E1 with LST, (k) NDBI of Ecological corridor with LST, (l) FVC of Ecological corridor with LST.
Sustainability 14 07744 g010
Figure 11. Spatial distribution map of the ecological network and high-temperature areas.
Sustainability 14 07744 g011
Table 1. Classification of the ecological resistance factors and weights.
FactorIndicatorsResistance ValueWeightDivision Basis
Terrain position grade (slope)<2° (flat)10.2[98,99]
2~5° (gentle slope)10
5~15° (slope)30
15~25° (steep slope)60
>25° (steep slope)100
Land cover typeE21000.8[100,101,102]
E110
Land for constructionA 1000
B 1000
GG130
G210
H14>50 ha1000
20–50 ha600
<20 ha400
RR11000
R21000
R31000
H4 1000
M 600
S 1000
U 1000
W 1000
Other 600
Table 2. Scale of the heat and cold island areas for each land use type.
Land
Code
Urban Heat Island AreaUrban Cold Island Area
Area
(km2)
Ratio
(%)
CountLST (°C)Area
(km2)
Ratio
(%)
CountLST (°C)
MEANMINMAXSTDMEANMINMAXSTD
A2.793.0812232.2031.3436.610.880.70.463226.8424.6627.700.73
B6.176.7926532.2431.3235.420.850.250.172526.6824.8627.670.87
M35.739.3045932.7431.3237.551.234.32.843026.9024.8727.710.74
R7.368.1021632.1731.3234.980.746.34.167127.2426.1027.700.39
S5.856.4411932.3631.3236.030.941.531.014926.5624.5027.690.95
U0.30.332132.3331.3234.920.890.210.141126.7124.6927.630.96
W3.974.376832.6931.3635.370.940.010.01127.3127.3127.310.00
G1.561.7115032.0931.3235.750.6628.4218.7731226.4223.0727.691.03
E10.430.486832.2131.3236.770.9026.2817.3665526.1523.1227.711.05
E213.2514.5914332.3631.3135.520.9881.4453.7835026.5123.3227.710.98
H1413.0314.3514732.2531.3135.150.800.850.561626.9925.6127.680.64
H40.430.47531.9631.4132.490.441.140.75826.9626.1227.570.51
Total90.84100.001783----151.41100.001560----
Table 3. LST parameters under different distance thresholds from each ecological source.
Distance0 m10 m20 m30 m50 m60 m80 m100 m150 m200 m300 m450 m600 m
LST_mean26.5126.9026.9827.0827.2227.3627.4827.6127.7627.8627.8527.7827.69
LST_std2.442.302.302.302.312.332.352.372.392.402.412.452.42
LST_min15.7916.3716.4716.6716.8016.9617.2317.5318.2518.8018.6318.8319.17
LST_max33.8133.1832.9432.5332.1432.5532.9433.2833.6933.8533.2433.4933.31
The unit of LST is °C, and the number of ecological sources is 537.
Table 4. LST parameters under different distance thresholds from each ecological corridor.
Distance10 m20 m30 m60 m100 m150 m200 m300 m450 m600 m
LST_mean27.9827.9828.0028.0228.1428.3328.5128.6928.8829.02
LST_std1.381.371.371.361.371.401.421.421.351.32
LST_min23.4323.4523.4623.5323.5723.6523.7123.8324.3624.90
LST_max31.3231.3531.3931.4431.9733.2233.7133.5632.9532.82
The unit of LST is °C and the number of ecological sources is 440.
Publisher’s Note: MDPI stays neutral with regard to jurisdictional claims in published maps and institutional affiliations.

