Technical Note

Domestic and Imported Food Product Recalls in Japan: Trend Analysis and Preventive Measures

by
Takashi Matsumoto
Department of Food Science and Technology, Tokyo University of Marine Science and Technology, 4-5-7 Kounan, Minato-ku, Tokyo 108-8477, Japan
Sustainability 2022, 14(13), 7863; https://doi.org/10.3390/su14137863
Submission received: 31 May 2022 / Revised: 20 June 2022 / Accepted: 24 June 2022 / Published: 28 June 2022

Abstract

:
In Japan, 700–800 food products are recalled each year. Food product recalls affect consumer health as well as businesses, depending on the content and scale of the recalls. Approximately 10% of food loss from food manufacturers was generated in 2018 and 2019. In Japan, food product recalls and measures to prevent them have not been sufficiently studied. Therefore, to investigate this issue, about 2300 recalls instigated by regulatory bodies in Japan from 2018 to 2020 were classified based on product category, responsibility, reason for recall, and violation of laws and regulations, and the trends were analyzed. Recalls were primarily associated with violation of the Food Sanitation Law and Food Labeling Act, due to contamination by microorganisms or foreign materials, mis- or non-declaration of expiration or best-before date, and mis- or non-labeling of allergens. Therefore, better management by adopting the Hazard Analysis and Critical Control Point and food safety management systems as preventive measures and the design review of ISO 9001: 2018 may be effective in reducing recalls. Moreover, better communication between manufacturing and importing countries to ensure compliance with laws on safety limits of ingredients and label preparation may reduce the number of recalls.

1. Introduction

The Food Sanitation Law in Japan was revised in 2018 to ensure that food safety measures cater to environmental changes and the increased internationalization of the food industry. Consequently, adherence to the Hazard Analysis and Critical Control Point (HACCP) system became mandatory in June 2021, and a reporting system for food product recall information was established [1]. According to the results of a survey on food product recalls by the Japanese Health, Labor and Welfare Ministry, approximately 20% of the local governments did not stipulate recall reports for food businesses; hence, some food product recalls were not reported to the local governments and might not have been publicized. Therefore, the establishment of a food product recall information reporting system will increase the transparency of the information and increase the number of reported food product recalls.
Food product recalls in Japan cover domestically produced and imported foods and are important for public safety, considering the large number of imported foods now consumed in Japan. Japan’s dependence on imported foods is evidenced by the low food self-sufficiency rate (38%) in 2019. Food products are recalled for various reasons, including violations of laws and regulations and threats to consumer health. In Japan, recalls can be ordered by the government or voluntarily conducted by food businesses [2]. From 2009 to 2020, 700–800 food products were recalled annually in Japan [3]. Over the past few years, the cost associated with the import of agricultural forestry (including forest products) and fishery products has been approximately JPY 9 trillion (approximately USD 82.6 billion). The import value of these products was slightly less than JPY 9 trillion in 2020, which was nearly 10 times the export value of approximately JPY 900 billion (approximately USD 8.3 billion) in the same year. This displays the degree of Japan’s dependence on imports [4].
Food product recalls result in huge losses for food-related businesses. For example, Matsumoto (2019) reported that the estimated cost of recalling 3000 items was JPY 31,200,000 (approximately USD 28,600). Therefore, preventing food product recalls is crucial for food companies. Analysis of the causes and circumstances leading to previous recalls can reveal common causes and identify factors that reduce the number of recalls in the future. Imported foods pose a unique challenge to food safety management because importers have little control over preventive measures during production. Therefore, understanding the trends in factors that led to the previous recalls of imported foods may help formulate preventive measures to be taken by manufacturers and importers and can be valuable for the economy and public safety.
Prevention of food product recalls is necessary for protecting consumer safety and businesses. However, studies on the analysis and prevention of food product recalls in Japan are limited. Matsumoto [4,5,6] reported food product recall trends and preventive measures based on the data from the reporting system for food product recall information, which was established as a part of the revised Food Sanitation Law in Japan in June 2021. Kanayama and Kaku [7] analyzed the risk of foods imported by studying cases of food poisoning in Japan. Iguchi and Teruzaki [8] summarized the laws and regulations involved in product recalls in Japan in 2012. Similarly, Matsumoto [4] classified food product recalls in Japan in 2018 based on the laws, regulations, and reasons for the recalls, analyzed the trends in causes, and suggested countermeasures. However, to the best of my knowledge, no study has investigated the recall of imported food based on the country of origin, food type, and cause.
At the United Nations Summit held in 2015, the “2030 Agenda for Sustainable Development” was adopted, and the goal of reducing food loss and waste was set, and there is growing interest in food loss internationally [9]. According to estimates in 2017 in Japan, the amount of business-related food waste generated was 17.67 million tons, of which the food manufacturing industry accounted for about 79.9%, or 14.11 million tons. Of the business-related food waste, a number of edible parts (food loss) generated was 3.28 million tons, of which 1.21 million tons, or about 36.9%, came from food manufacturers [10,11]. Products collected by food companies become food loss and are discarded; thus, it is estimated that they will have a considerable impact on the environment.
In this study, the details of previous recalls of imported foods were analyzed. To identify factors associated with such recalls, the data regarding food product recalls in Japan were analyzed for the past three years (from 2018 to 2020) based on the responsibility of the manufacturer, seller, and importer. Furthermore, manufacturer-attributed recalls were classified based on the food category and cause. Cases of violations in quarantine (before distribution in Japan) and the reason for recalls after initiating distribution were also analyzed to reveal the risks to food businesses outside Japan and importers in Japan. Consequently, classifying recalls based on responsibility, reason for recall, and food category, and analyzing the trends, could facilitate the formulation of appropriate countermeasures, and in turn, the prevention of recalls. Furthermore, the results of the present study could improve consumer food safety and minimize risks and losses for businesses in and outside Japan.

2. Materials and Methods

2.1. Collection of Food Product Recall Data

The data used in the analysis were provided by the Japan Food Industry Association [12] and the Consumer Affairs Agency [13], and those were secondary. The names of the businesses that produced the recalled food products, their lot numbers, and the reasons for the recall were included in the data. In other words, the sources of information are Japanese national regulatory bodies. The reports are prepared for consumers and customers, and mainly list the product name, associated company, range of products recalled, lot number, reason for recall, and potential health hazards. The documentation was not uniform, as the information was presented in multiple formats. The data sources did not distinguish between ordered and voluntary recalls; hence, the analysis was performed without this distinction. The reports in different formats were investigated individually, and the data were manually classified into fiscal years based on the start date of the recall. The number of recall cases without duplication was 791 in 2018, 770 in 2019, and 731 in 2020. Voluntary recalls for reasons related to quality, rather than violations of laws and regulations, were excluded from the analysis.
Food loss could be calculated because about 30% of the food product recalls that occurred in 2018 and 2019 disclosed information on the number of products to be collected. Therefore, the total was estimated from the cumulative total of food loss of around 30% per year.

2.2. Classification and Trend Analysis of Food Product Recalls

Food product recalls that occurred in Japan from 2018 to 2020 were classified as those foods produced in Japan (hereafter referred to as domestic foods) and those imported (imported foods). Domestic foods were sub-classified based on the manufacturer and seller while imported foods were sub-classified based on the importer. Within the three responsibility categories (i.e., manufacturer, seller, and importer), each recall was classified based on the following laws and regulations that were violated to analyze trends in reasons for recall: Food Labeling Act, Food Sanitation Law, Unfair Competition Prevention Law, Measurement Method, Act Against Unjustifiable Premiums and Misleading Representation, and Medical Products and Medical Devices Law. The laws and regulations violated by each recall were determined based on the information in the reasons for recall. For manufacturer-attributed recalls, the reasons for recall were variables in the analyses, whereas for importer-attributed recalls, the variables were quarantine inspection violations. Subsequently, the recalls in each responsibility category were classified into 29 reasons for recall. The items of the reasons were created by the author based on approximately 2300 recall instances. Classification of food product recalls based on laws and regulations violated and reasons for recall, as carried out in the present study, has never been previously performed in Japan.
Furthermore, manufacturer-attributed recalls were classified based on food categories, the top two categories of the number of recalls were classified according to the reasons for recall, and trends were investigated.

2.3. Domestic Distribution of Imported Foods in Japan

Figure 1 shows the flow of imported foods into the domestic market in Japan [14,15]. Foods arriving from countries are subject to different procedures in customs bonded areas, depending on whether they are grains, meat and meat products, and other food and food additives. Grains, and meat and meat products are under the control of the Ministry of Agriculture, Forestry and Fisheries, and grains and other items are inspected at the Plant Protection Station for compliance with the Plant Protection Act [16]. Meat and other items are confirmed to comply with the Domestic Animal Infectious Diseases Control Law at animal quarantine stations [17]. Quarantine stations under the jurisdiction of the Ministry of Health, Labor and Welfare are inspected for compliance with the Food Sanitation Law, following which grains, and meat and meat products are confirmed to be safe. Food inspections performed in Japan include administrative inspection (first inspection of imported foods, confirmatory inspection for compliance with the Food Sanitation Law, and confirmatory inspection of foods that cause accidents during transportation), inspection orders (for foods suspected as likely to violate the Food Sanitation Law based on circumstances in countries exporting the foods, the characteristics of foods, and the cases of violations for similar foods), and monitoring inspection (for foods unlikely to violate the Food Sanitation Law). In quarantine inspections, except for inspections that involve monitoring, customs procedures do not proceed until the results of the inspection are obtained. In monitoring inspections, businesses can proceed with import procedures without waiting for the results to be determined. However, if the food that has failed to pass a monitoring inspection is distributed in the market, the government will order the businesses to take measures such as recalling the foods. Imported foods in Japan are recalled when they fail to clear the monitoring inspection, or a defect is found in the foods after they have been distributed in the market. Food products confirmed to have no problems in quarantine inspection are then distributed to the market from food companies through customs procedures at the Finance Ministry’s Customs Office.
Food labeling on imported foods is not subject to quarantine inspections, and food businesses must comply with Japan’s Food Labeling Law and other Japanese laws before imported foods can be distributed in the market.

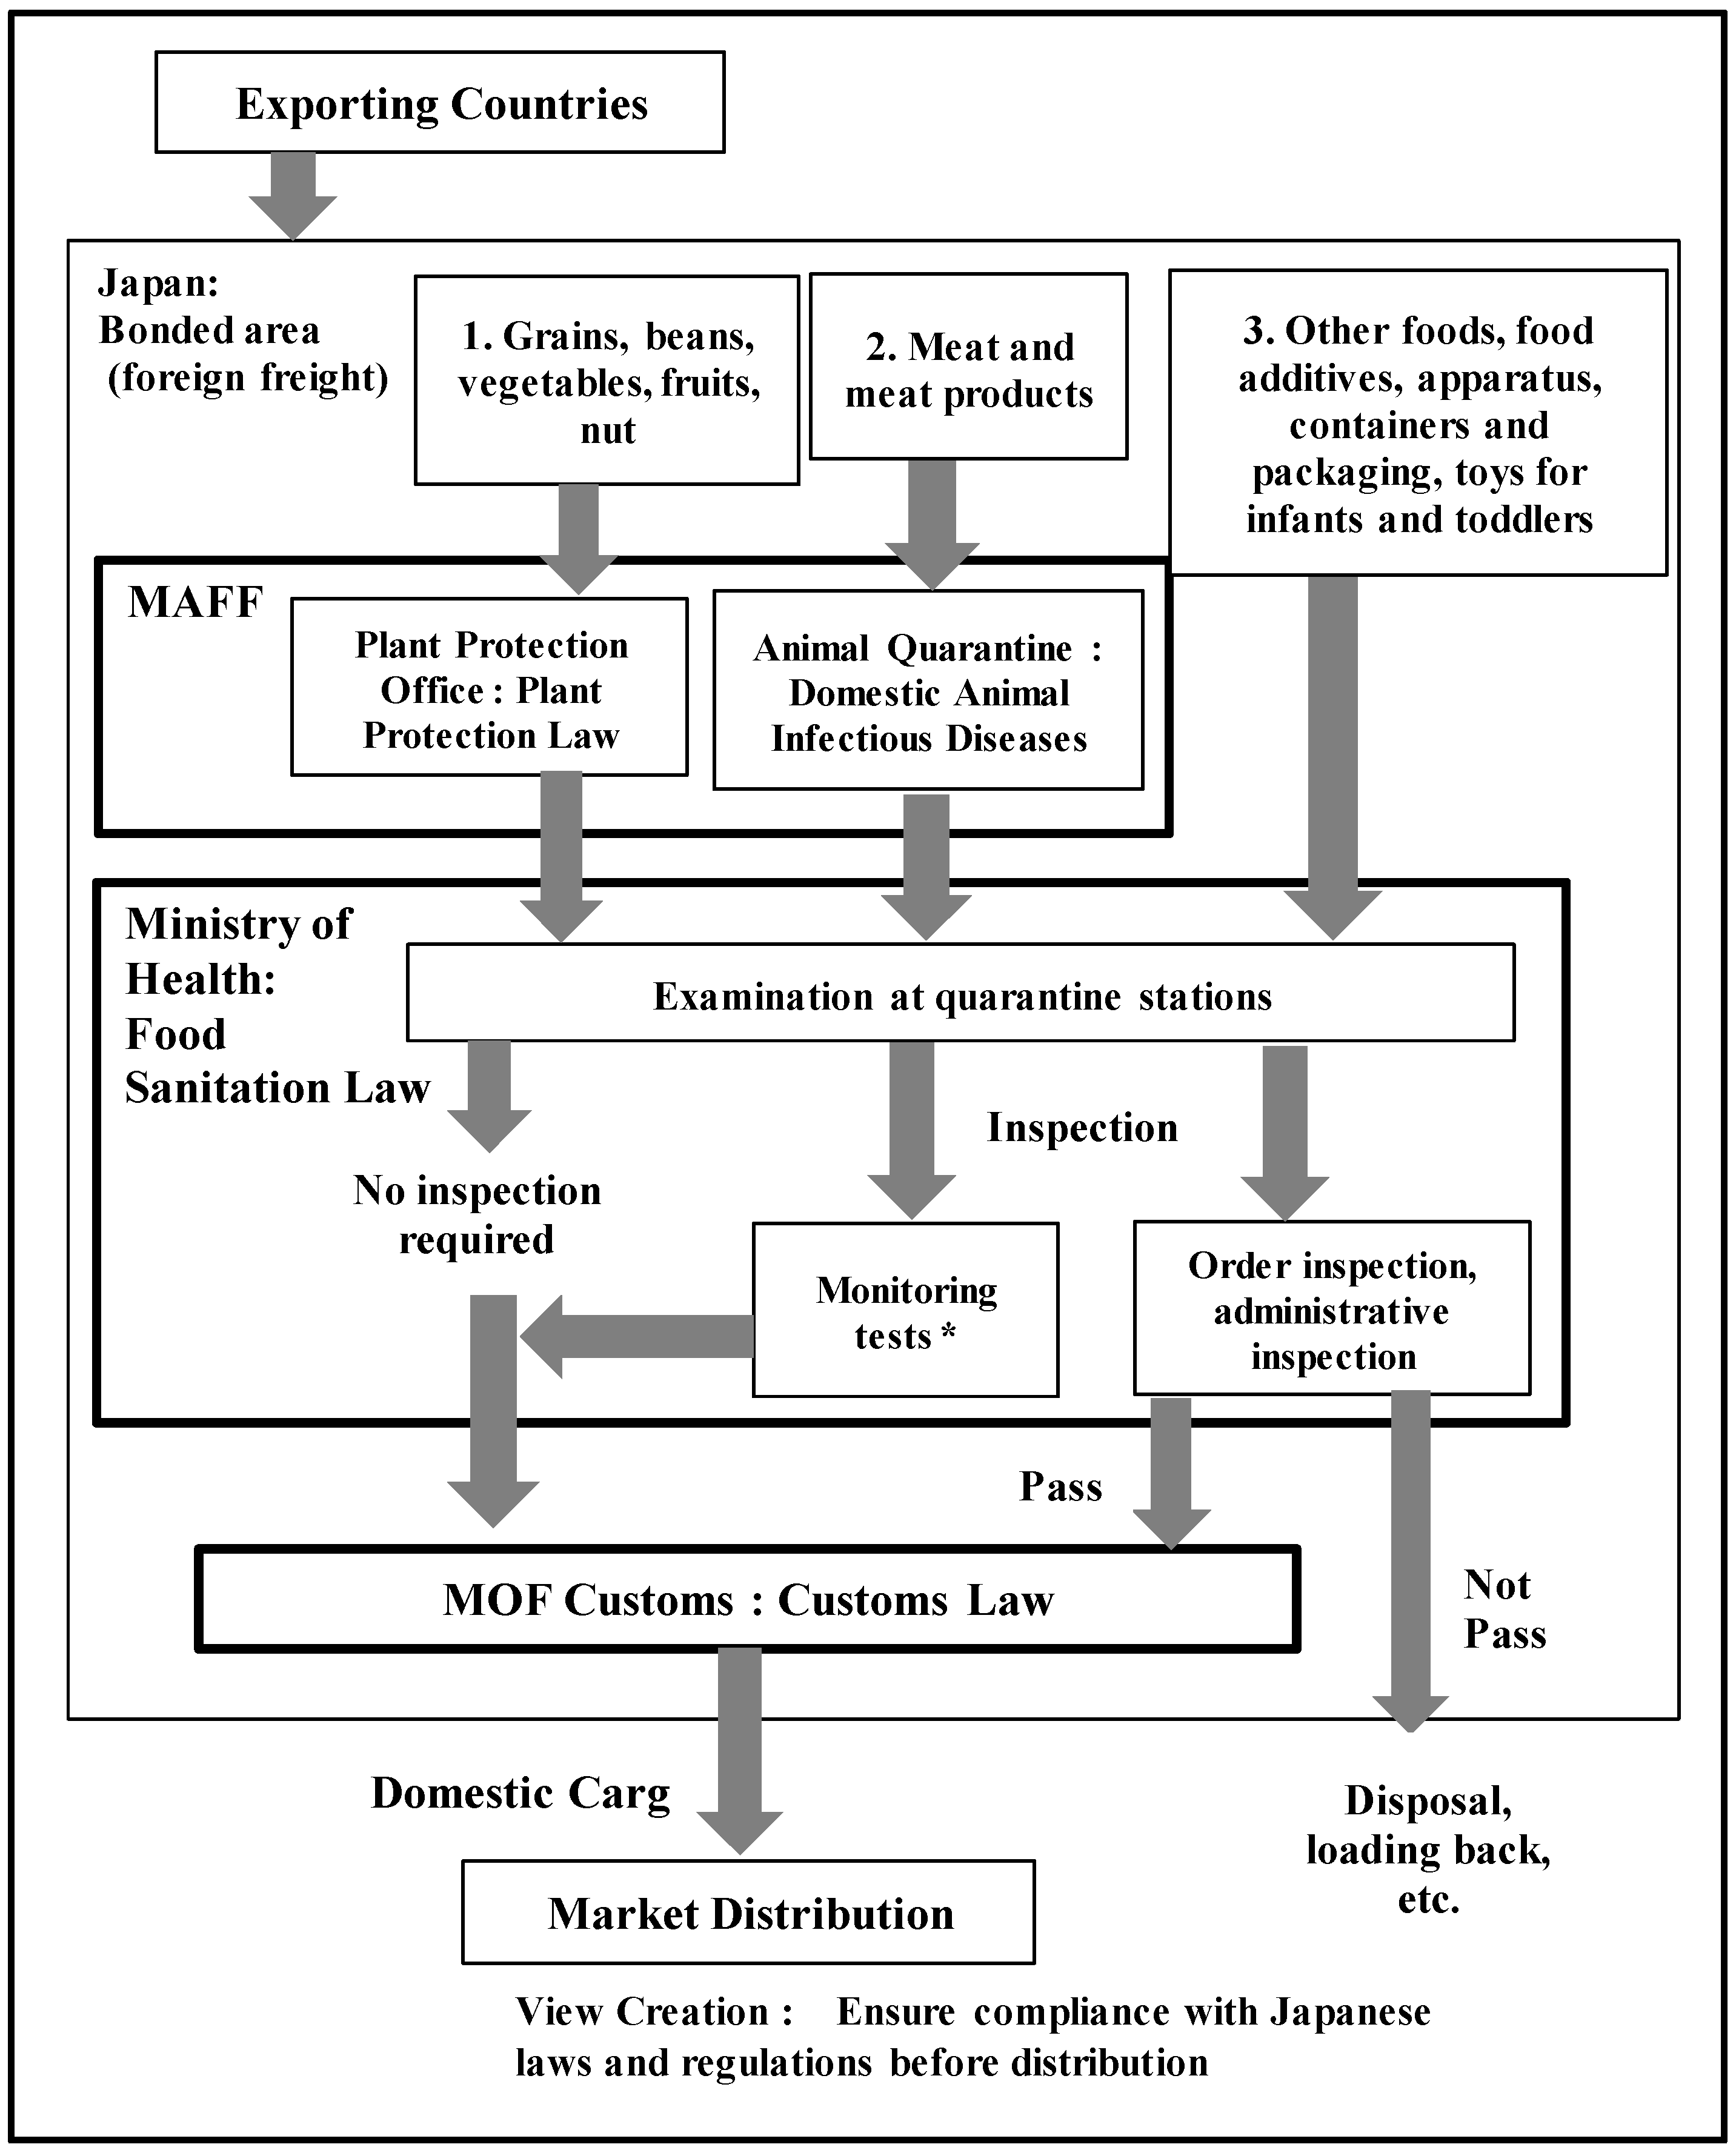
2.4. Collection of Data on Cases of Violations of Imported Foods in Quarantine Inspection

Examples of violations of imported foods in quarantine inspections in Japan are provided on the website of the Ministry of Health, Labor and Welfare. Data from 2018 to 2020 were extracted and used for analysis [18]. Information, including the product name, manufacturer, manufacturing country, ineligibility (violation), and status of measures (such as disposal and shipment) was classified by country/region and further by law violation.

3. Results

3.1. Approximate Food Loss

Table 1 is an estimate of food loss caused by food product recalls. Food loss information was disclosed in 193 (29.2%) of the totals of 791 recalls in 2018. The food loss caused by the 193 recalls was 30,800 tons. In 2019, food loss information was disclosed in 225 (34.4%) of the 770 recalls. The food loss caused by the 225 cases was 11,800 tons. Estimated to 100% for each, food loss in 2018 was 126,200 tons and in 2019 was 40,400 tons. The food loss of food manufacturers in Japan is about 1.21 million tons (2017), which cannot be compared simply because the years are different, but the estimated food loss due to food product recall in 2018 is about 10.4%. In 2019, it was equivalent to about 3.3%, and it was found that it had a great impact on the food supply chain. The data on food loss in 2017 is the latest in Japan.

3.2. Manufacturer-Attributed Recalls

Figure 2 categorizes food product recalls from 2018 to 2020 based on whether it occurred because of the manufacturer, seller, or importer or violation of relevant laws and regulations. Recalls by manufacturers accounted for approximately 85% of all recalls.

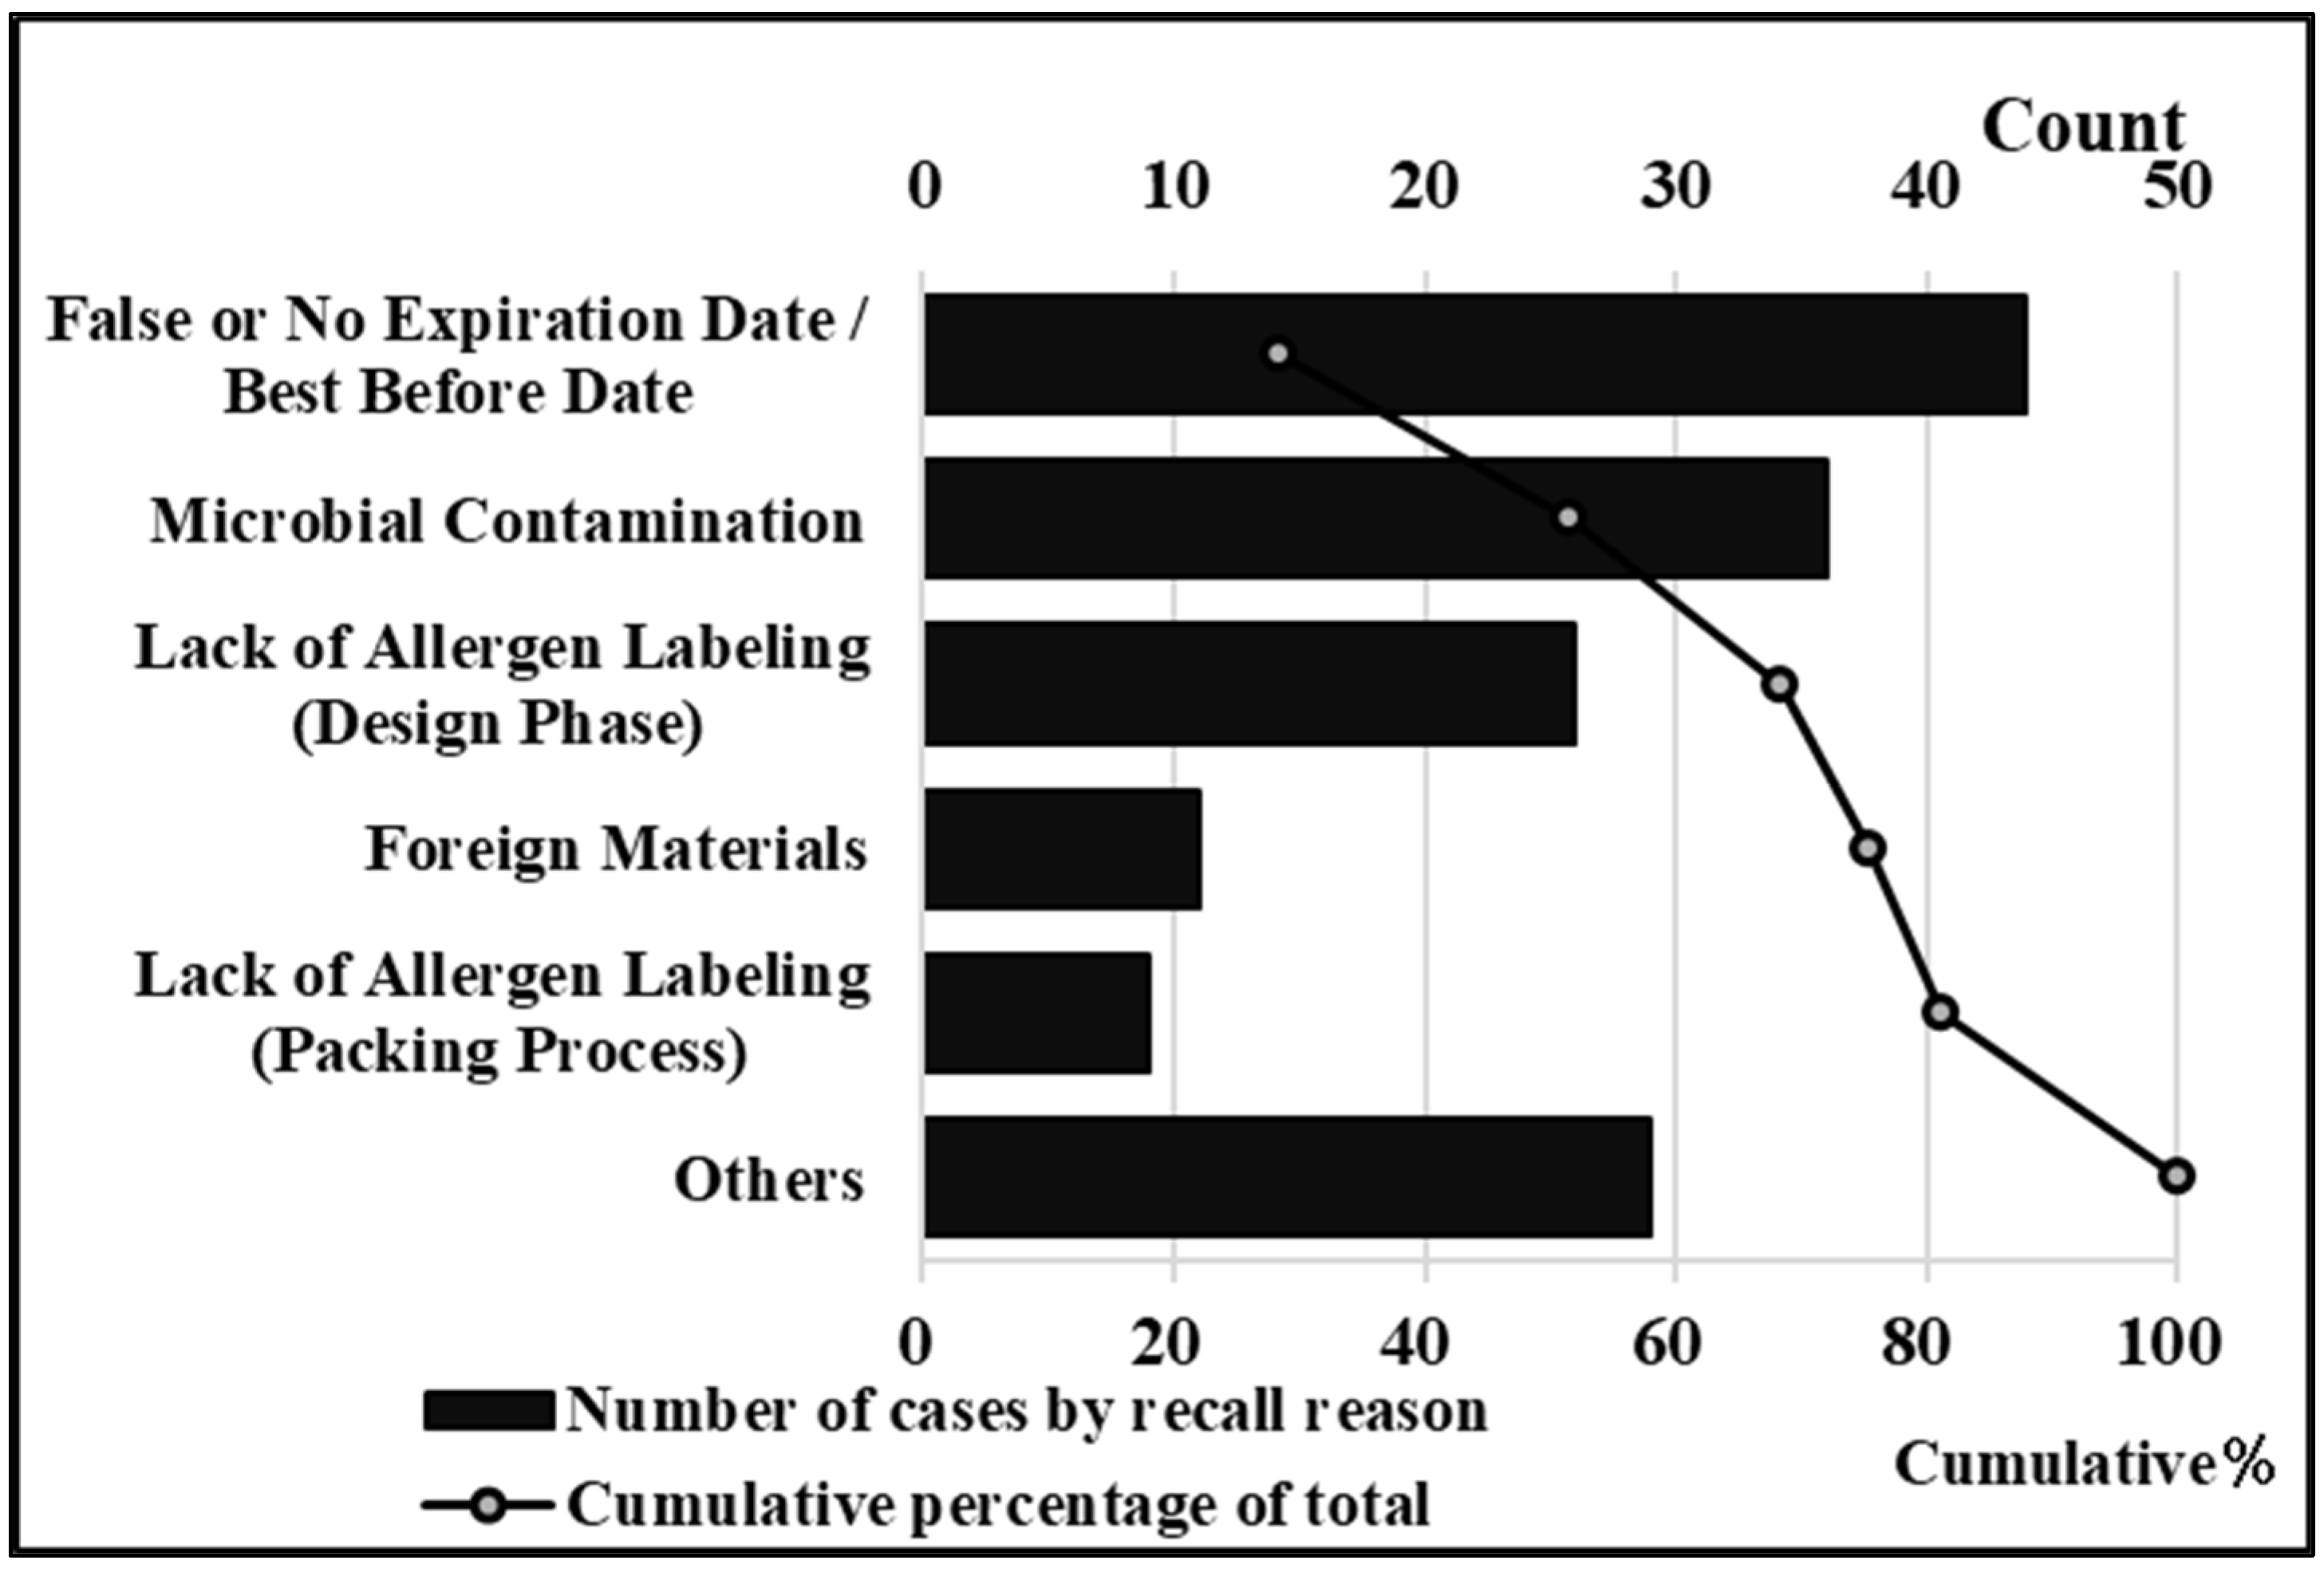
3.2.1. Trend Analysis Based on Violation of Relevant Laws and Regulations and Causes of Recalls

The total number of recalls by manufacturers was 662/791 (~84%) recalls in 2018, 654/770 (~85%) recalls in 2019, and 646/731 (~88%) recalls in 2020 (Figure 2). Every year, >99% of recalls were related to the violation of the Food Labeling Act (~60%) and Food Sanitation Law (~40%). From 2018 to 2020, the proportion of manufacturer-attributed recalls was 84–88% of the total. Table 2 classifies manufacturer-attributed recalls as those caused by packaging, manufacturing, or product design errors (A, B, or C, respectively) or raw material and packaging material-related problems (D). In addition, recalls were classified based on the laws and regulations violated and the reasons for recalls. In 2020, the number of recalls owing to mistakes or omissions in allergen labeling during the packing process increased 1.7-fold compared to the previous year. Furthermore, the number of recalls due to raw material and packaging material problems increased from 2018 to 2019. These are characteristic in only 2020, and it is necessary to continue monitoring trends in the future.
Printing errors in the best-before and expiration dates accounted for 50–60% of the packing process violations (Table 2). For food products that rapidly deteriorate, printing errors in expiration date are of concern, as food products may decompose during the distribution process. The omission of allergen labeling accounted for 40.9% (124 cases) of the labeling errors. Such errors in labeling, packaging, and printing are hazardous to the health of consumers with specific allergies.
Violations during the manufacturing process were primarily related to violation of the Food Sanitation Law (160 cases, 96.4%) and were classified as B1–B5 based on the HACCP system as follows: B1 and B5, biological hazard; B2, physical hazard; B4, chemical hazard; and B3, other hazards. According to a survey conducted by the Ministry of Agriculture, Forestry and Fisheries [19], approximately 57% of food manufacturers did not introduce the HACCP system until October 2020. The number of such recalls was expected to decrease following the revision of the Food Sanitation Law in 2018 and adherence to HACCP becoming mandatory in June 2021.
Mistakes in packaging or labeling are readily detected. However, several factors affected by the manufacturing process are not apparent, which makes the detection of errors difficult. Product design (C in Table 2) and food labeling errors accounted for >90% of the number of recalls, of which allergen labeling accounted for >70% of the total number of errors.
The number of cases related to raw material and packaging material problems (D in Table 2) increased in 2019. Recalls related to violating the Food Sanitation Law (D1–D4) accounted for >75% of the total raw material and packaging material problems (2018, 93.3%; 2019, 76.6%; and 2020, 96.1%). The total number of cases where pesticide residues (D1) and radioactive substances were detected in raw materials (D2) was 19 in 2019 (40.4% of D) and 18 in 2020 (34.6% of D). The ratio of cases of foreign material (D3) and microbial (D4) contamination related to food sanitation were 26.7% in 2018, 36.1% in 2019, and 61.5% in 2020. This study could not determine the cause for this marked increase in the number of recalls due to foreign material and microbial contamination because of insufficient data.

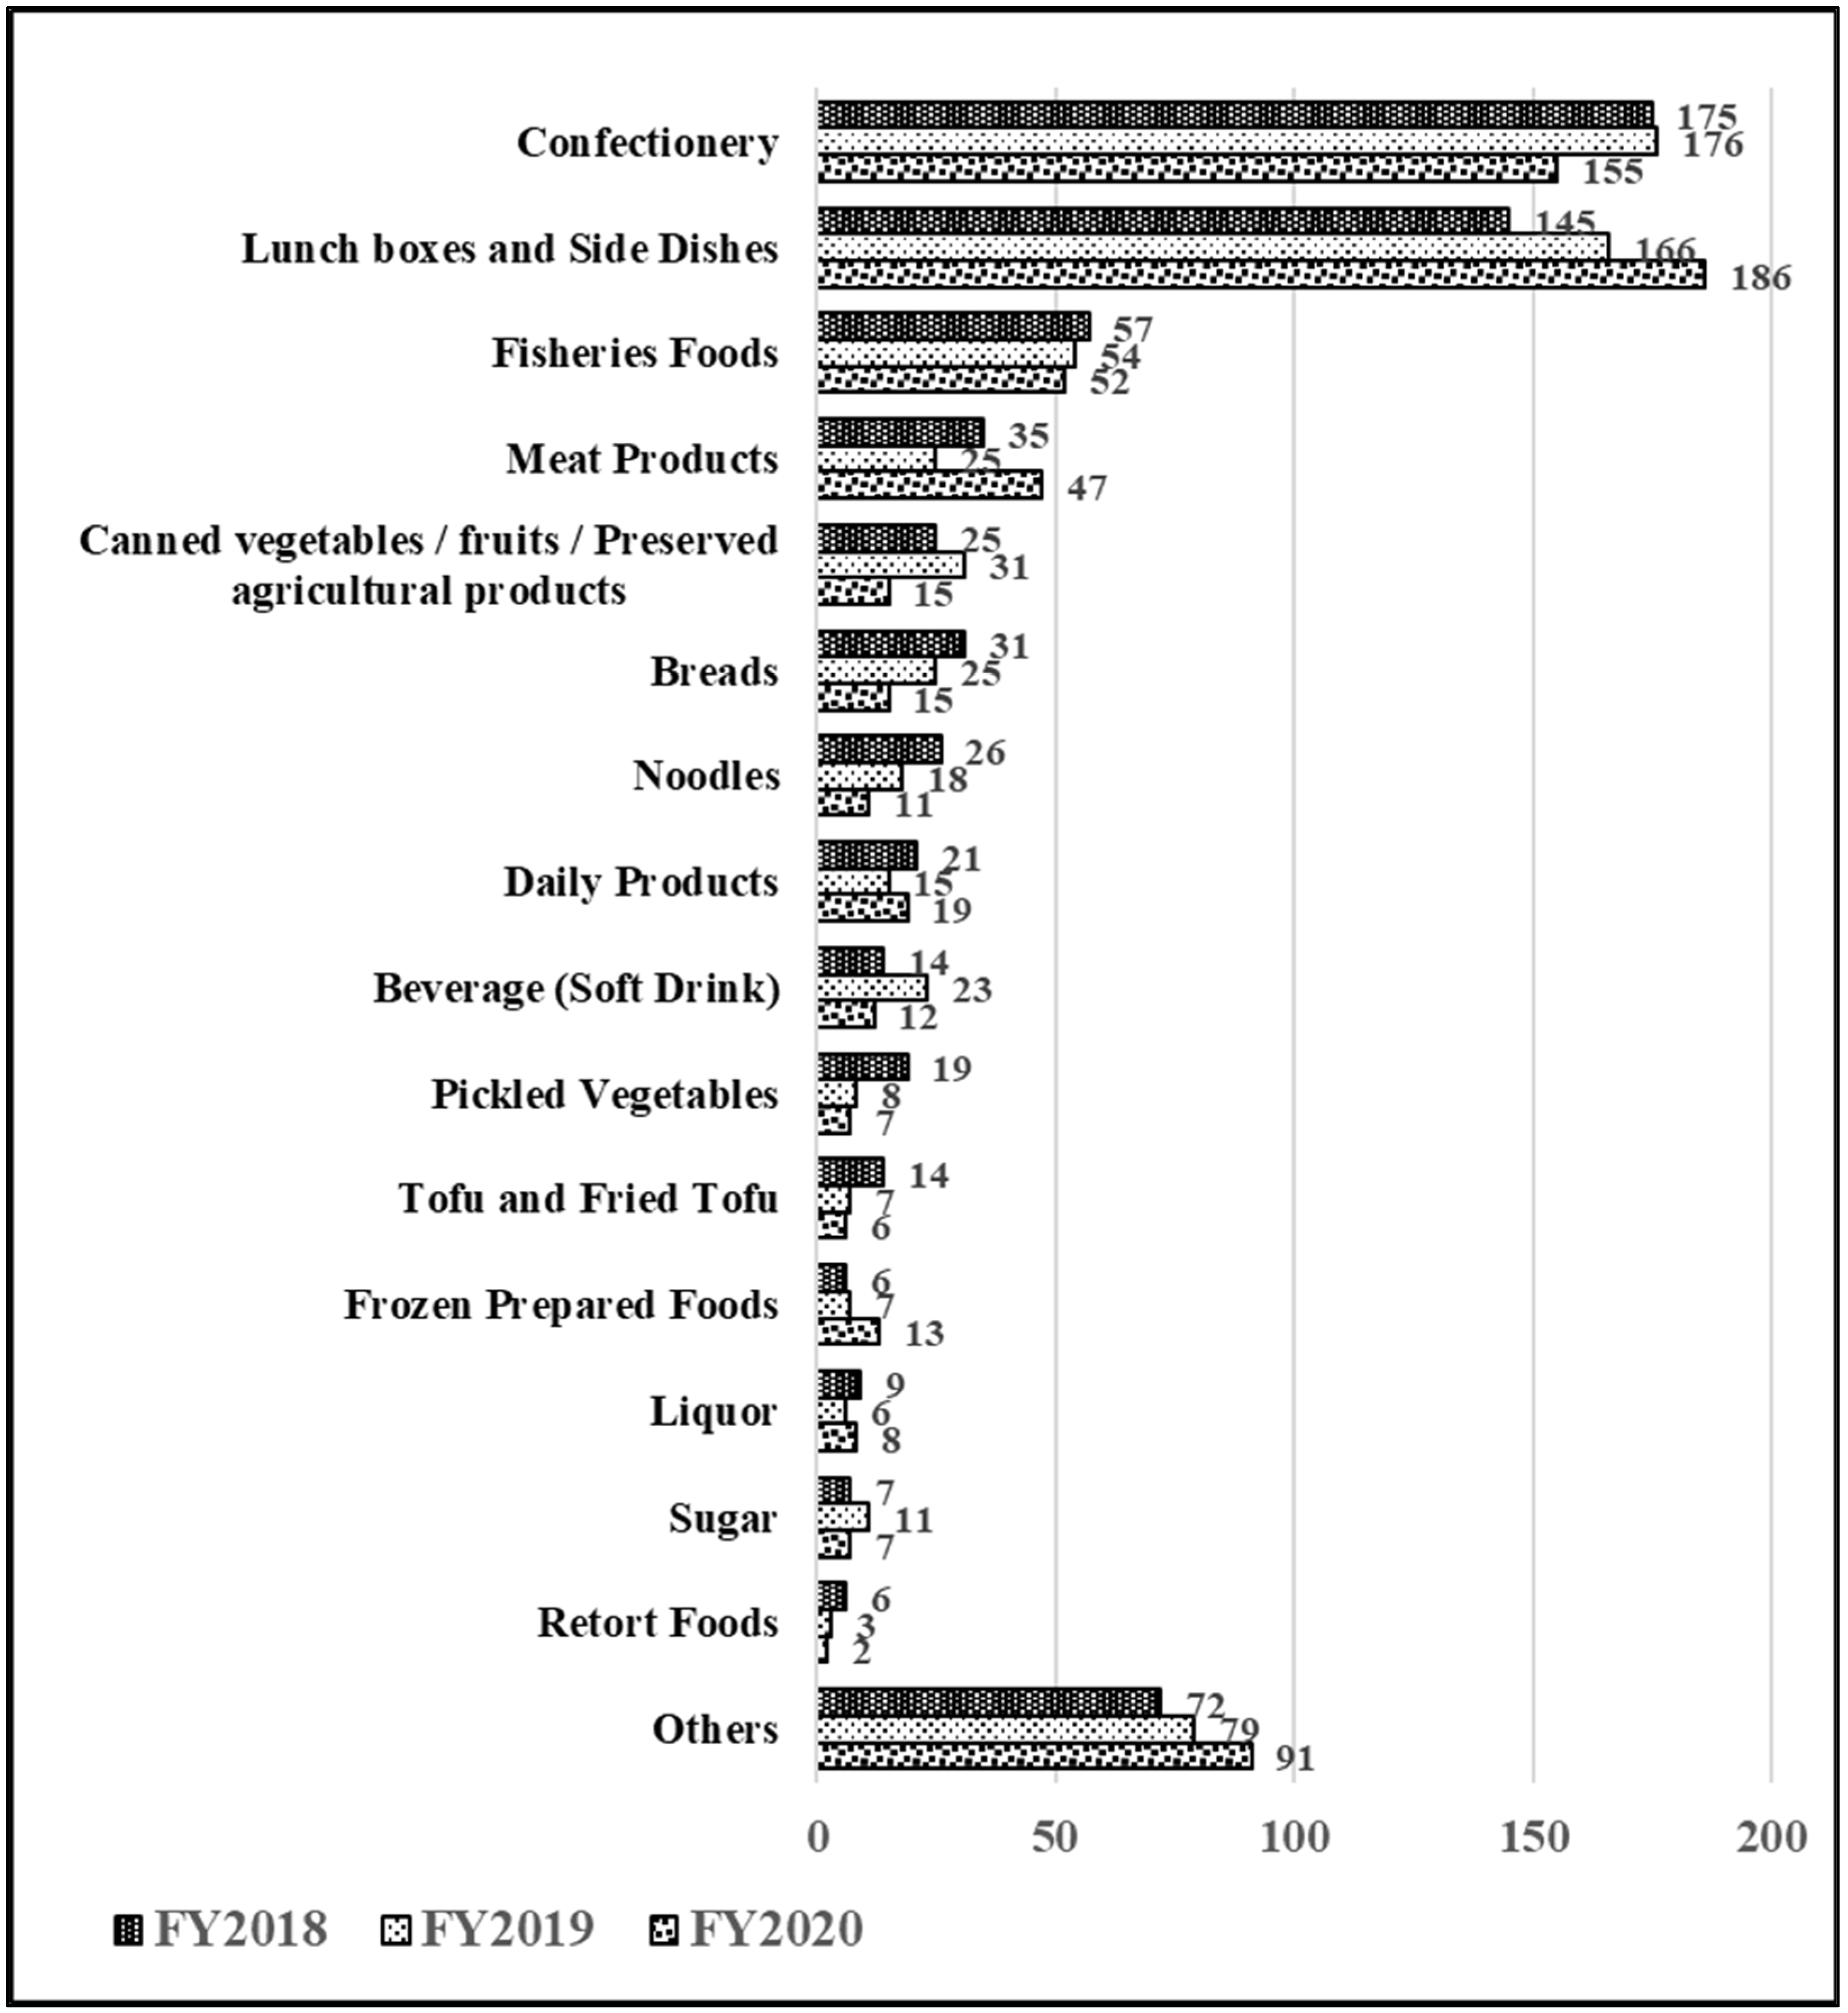
3.2.2. Trend Analysis for the Classification of Recalls by Food Category

Manufacturer-attributed recalls were then categorized by food category, and the trends were analyzed. Figure 3 shows the average number of recalls in each food category from 2018 to 2020, arranged in descending order.
The top two categories reflecting the greatest number of recalls were confectionery and lunch boxes/side dishes with 320/662 recalls in 2018 (~48%), 342 of the total number of recalls in 2019 (~52%), and 341 of the total number of recalls in 2020 (~53%), accounting for approximately 50% of the total recalls in the three years. The total number of recalls from the top five categories accounted for approximately 70% of the total number of recalls.
  • Confectionery category
Figure 4 is a pareto chart in which recalls in the confectionery category are classified based on the reasons for recall. As the reasons for recalls in the top two categories showed the same trends from 2018 to 2020, only the data from 2020 were analyzed. The most common reason for confectionery recall was the “false indication of expiration or best-before date or no indication” in 44 of 155 cases (~28%). The second most common reason was “microbial contamination” with 36 cases, of which 25 (~70%) were caused by molds. The third most common reason was “the lack of allergen labeling (design)” with 26 cases, followed by “contamination” with 11 cases, of which approximately 50% were contaminated by dangerous foreign materials. Finally, “the lack of indication of allergen” (e.g., labeling error) related to the packing process was the fifth most common cause for recall, with nine cases. The top five reasons for recall accounted for approximately 81% of all 155 recall cases in the confectionery category. The trend for “confectionery” was consistent with the pareto principle, that is, the “80/20” pattern.
  • Lunch boxes/side dishes category
Figure 5 is a pareto chart in which recalls in the lunch boxes/side dishes category are classified based on the reasons for the recalls. Of the 186 recalls in this category, 93 (50%) were due to “missing allergen labeling (packing process)” caused by mislabeling, followed by “the wrong indication of best-before or expiration date” (32 cases), “the lack of allergen labeling (design stage)” (31 cases), wherein, despite correct labeling of the packaging materials, a mistake made during the design stage of packaging led to the omission of allergen labeling. The fourth and fifth common reasons were “microbial contamination” (12 cases) and “foreign material contamination” (5 cases), respectively. Therefore, the top five reasons for the recalls accounted for approximately 93% of the 186 recalls in the lunch boxes/side dishes category. The trend for “lunch boxes/side dishes” was consistent with the pareto principle, that is, the “90/10” pattern.

3.2.3. Measures to Prevent Recalls by Manufacturers

Considering that the reasons for recalls in the top two categories showed the same trends from 2018 to 2020, only data from 2020 were analyzed. To prevent recalls attributable to the manufacturing process (packaging process; A in Table 2), special attention should be paid to the expiration date printing and allergen labeling in the manufacturing process. To facilitate this, work instructions or an initial sample can be confirmed at the start of production. The use of sensors to detect printing defects during the packing process was proposed by Saito [20]; however, if the instruction or a set print content is incorrect, it is impossible to prevent printing defects using such a countermeasure.
To prevent recalls due to violation of the Food Labeling Law owing to labeling errors, or the Food Sanitation Law owing to food contamination (55.1%; categories A2, A3, A5, A6, and B1–B5 in Table 2), management must be strengthened as directed using the HACCP system, and the underlying prerequisite programs or the food safety management system (FSMS), such as the JFS-C certification standard, should be implemented. Most of the causes of recalls due to labeling errors were incorrect labels or there was no indication of the best-before or expiry date. In the hazard analysis in HACCP, special attention should be paid to potential printing errors and incorrect labeling. Most of the recalls of B1–B5 in Table 2 are associated with the heat sterilization process, foreign material contamination, and allergen cross-contamination. Consequently, in the hazard analysis of HACCP, special attention should be paid to the heat sterilization process and contamination with foreign material or allergens. In 2018 and 2019, the corresponding recall rates were 53.3% and 48.9%, respectively, which were similar to those in 2020. Moreover, no major differences were detected in the reasons for recalls, suggesting that similar measures were effective.
The adoption of the HACCP system reportedly prevents food labeling violations [21]. However, as the HACCP system is only a control system guiding the manufacturing process, the design review “8.3 Design and Development of Products and Services” in ISO 9001: 2018 must be considered to prevent recalls caused by errors at the product design stage, which accounted for 125 recalls in 2020 (C in Table 2, 19.3% of 646 recalls by manufacturers). Strengthening the design review has been suggested as an effective preventive measure as it includes the contents of legal compliance and confirmation in product design and development, and the ability of the concerned person is also examined. In particular, the rates of recalls due to mistakes in allergen labeling were high (2018: 75.8% (16 cases/153 in total), 2019: 81.5% (123 cases/151 in total), and 2020: 74.4% (93 cases/125 in total)). Consequently, it is necessary to obtain and share accurate information on raw materials and pay attention to the presence or absence of allergen when preparing labels. Table 3 summarizes the countermeasures for preventing recalls during packaging and the other manufacturing processes.
To prevent the recalls caused by violation of the Food Sanitation Law owing to problems in raw materials and packaging materials used in manufacturing (D in Table 2) such as the detection of pesticide residues (D1) and radioactive materials (D2), inspection during manufacturing may not be effective or achievable considering the technical and financial costs. Nevertheless, enhanced control of raw material suppliers (e.g., contracts, change controls, quality audits) to prevent foreign material contamination (D3) and microbial contamination (D4) is considered effective (corresponding to “8.4 Control of externally provided processes, products, and services” in ISO 9001: 2018).
Manufacturer-attributed recalls were then classified into food categories, and the causes for product recalls in the confectionery and lunch boxes/side dishes categories, accounting for approximately 50% of the number of recalls, were analyzed. The overall reasons for recalls varied widely (Table 2); however, the reasons for the recalls of each food category were limited. Five causes for recall accounted for approximately 80% of the number of recalls in the confectionery category and >90% in the lunch boxes/side dishes category. Adoption of the HACCP system or the FSMS, such as JFS-C certification, or prevention by legal compliance in the design review of ISO 9001: 2018 may be effective in preventing these recalls.
The trend in the pattern of food product recalls was similar over the three years, from 2018 to 2020. Therefore, owing to the consistent trend in food product recalls, the measures described in Table 3 may be effective in preventing recalls.

3.3. Importer-Attributed Recalls

Table 4 presents the data on foods imported in Japan by food service providers from 2018 to 2020 and those collected in quarantine inspections [22]. Approximately 8.5–9.0% of the imported foods reported by businesses and others were inspected. The ratio of the number of violations to the number of inspections was approximately 0.3–0.4% from 2018 to 2020.

3.3.1. Overview of Imports in Japan

Table 5 presents the import data for agricultural, forestry, and fishery products from 2018 to 2020, including forest products equivalent to >10% of the import value [19]. Data were collected from relevant websites and manually analyzed. Over the three years of the study, imports totaled >USD 80 billion, with the United States of America and China accounting for nearly 30% of the imports, representing the first and second position, respectively, among the top 10 countries that accounted for approximately 65% of the imports. However, imported foods differ from country to country, with agricultural and livestock products representing the primary imports from the USA. Meanwhile, imports from China include a variety of livestock and marine products as well as mixed foods with multiple ingredients and primary agricultural products. Although not listed in the table, the value of exports from Japan was approximately one-tenth of the value of imports.

3.3.2. Trend Analysis of Quarantine Violations

Table 6 shows the breakdown of violations in quarantine inspections for imported foods by region from 2018 to 2020. The USA and China, which are the top two importers in terms of import value, ranked first and second, respectively, in terms of the number of violations. According to region, the highest number of violations were of imported foods from Asia, followed by North America and Europe. The proportion of violations made by Asia was approximately 50–60% (approximately 49.9% in 2018, 47.1% in 2019, and 59.7% in 2020), whereas those from the other three regions was approximately 80–90% (approximately 85.8% in 2018, 79.1% in 2019, and 89.0% in 2020). Quarantine inspections performed to check compliance with the Food Sanitation Law and the number of violations by different regions for the five reasons are listed in Table 6. Overall, the proportion of violations due to “microbial incompatibility” and “mycotoxin detection” exceeded 50% each year (approximately 53.8% in 2018, 50.1% in 2019, and 50.2% in 2020). In addition, the percentage of violations in the top four categories was approximately 87% (approximately 86.5% in 2018, 87.4% in 2019, and 87.0% in 2020). Areas from which most agricultural products were imported (particularly the USA) were likely to have mycotoxin detection violations due to microbial incompatibilities and mold contamination. In Asia, particularly in China, the number of violations due to “noncompliance with microbial standards” was the highest, followed by “detection of pesticide residues and antibiotics” and “violation of food additive use standards”.

3.3.3. Relationship between Quarantine Violations and Recall of Imported Foods

Table 7 classifies the importer-attributed recalls by region and by violation of relevant laws and regulations. As stated in Section 2.3, food labeling is not inspected during quarantine inspections after the food is imported into Japan. Businesses must ensure that the labeling of imported foods complies with Japanese laws and regulations before market distribution in Japan, as all violations related to the Food Labeling Act occur before market distribution. Contrarily, violations related to the Food Sanitation Law are largely identified during quarantine inspections. As mentioned in Section 3.3, the ratio of the number of monitoring inspections to the number of notifications is 8.5–9.0%; therefore, many imported foods pass inspection. The number of recalls related to violation of the Food Sanitation Law was 44 in 2018, 58 in 2019, and 47 in 2020. The percentage of recall number for violations in quarantine inspection (Table 7) was 5.6% (recall: 44, violation: 780) in 2018, 6.9% (58, 843) in 2019, and 7.2% (47, 653) in 2020. These figures indicate that >90% of recalls were prevented and that monitoring inspections during quarantine were effective.
The largest number of region-wise recalls related to violation of the Food Sanitation Law were for products from Asia, followed by North America; however, the total annual number of recalls was <10 (four in 2018, nine in 2019, and one in 2020; Table 7). Many cases involved violations during quarantine inspection, including microbial contamination of agricultural products and detection of mycotoxins (Table 6). However, whether it was distributed as an agricultural product or used as a raw material for processed food in Japan, it is presumed that the product in violation was not shipped to the market, as microbial contamination was visible. Of the several recalls (2018: 18 in Asia and 16 in Europe), many occurred due to multiple violations in quarantine (2019: 33 in Asia and 9 in North America; 2020: 27 in Asia and 15 in Europe).
Table 8 classifies importer-attributed recalls based on the reasons for recall. Many recalls in Asia and Europe occurred due to contamination by microorganisms, detection of pesticide residues and antibiotics, and violation of food additive standards. This is likely because laws and regulations on pesticide residues and antibiotics vary across different countries and hence, must be carefully considered to prevent the recall of products from Asia and Europe.

3.3.4. Potential Measures to Prevent Importer-Attributed Recalls

The number of recall cases of imported food products was 55–73 in the three years (from 2018 to 2020), and the percentage of total recalls was low (8.0% in 2018, 9.5% in 2019, and 7.5% in 2020; Figure 2; Table 8). However, the number of violations in quarantine inspections was 780 in 2018, 842 in 2019, and 653 in 2020, which is comparable to the number of recalls in Japan. Products in violation are returned or discarded, which increases food loss and has a considerable negative impact on the environment. Therefore, the correlation between imported food product recalls and violations in quarantine inspections was investigated.
The categories and proportion of violations vary by country and region as different foods are imported from different countries. Therefore, businesses must take preventive measures according to the food they import and the countries and regions from which they import. The top four reasons for violations account for approximately 90% of the total number of violations. The violations in the two categories “noncompliance with microbial standards” and “mycotoxin detection” exceeded 50% of the total number of violations each year (Table 6). Measures to mitigate such violations include strengthening hygiene control during the manufacturing, transport, and storage of products. For agricultural products, hygiene control during transportation and storage is particularly important to prevent mycotoxin production caused by mold contamination. Additionally, the other two reasons for violations included the “detection of pesticide residues and antibiotics” and “violation of food additive use standards” (Table 6). As laws and regulations may differ in the importing and exporting countries, businesses must ensure that importers and producers know each country’s laws and regulations. Additionally, the Japanese government should consider the harmonization of relevant laws between countries.
Finally, recall prevention was explored from the perspective of importers (Table 8). Importers must ensure that their business operators implement the measures listed in Table 3. Violations of the Food Labeling Law likely occur because importers distribute food to the markets without cross-checking the compliance of various aspects of food products with Japanese laws and regulations, such as the expiration date display format, which differs between Japan and other countries (a1, Table 8). The cause of recalls in categories a1–a3 was the absence of relevant information required by Japanese laws and regulations. Importers must also know that the best-before or expiration date labels for imported foods must be prepared based on the laws and regulations specified in the Food Labeling Law in Japan.

4. Discussion

From the estimated food loss due to food recalls that occurred in 2018 and 2019, it was possible to infer that there is a considerable environmental impact on the food supply chain. There is a difference in the estimated food loss for two years (126,200 tons in 2018, 40,400 tons in 2019). Regarding the cause of the difference, it is the amount of food loss estimated from the recall information of around 30% (in 2018: 29.2%, in 2019: 34.4%), and it is not clear at this point because it is a comparison of two-year data. Therefore, it is necessary to continue monitoring. With the establishment of a food recall information reporting system from June 2021, information necessary for environmental impact assessment such as the amount collected will be disclosed, which is expected to lead to prevention of food recall and reduction of food loss.
Public notification of voluntary recalls became obligatory in Japan in June 2021, increasing the transparency of information on food product recalls for consumers in Japan and other countries. The total number of food product recalls in 2020 was less than that in 2018. However, whether the decline observed in 2020 was due to the COVID-19 pandemic remains unclear. Recalls by manufacturers, which accounted for 85–90% of the number of all recalls, were due to violations of the Food Labeling Law (approximately 60%) and Food Sanitation Law (approximately 40%). These two laws are important in Japan, and over 99% of the recalls were due to violations of these two laws. In the three years of the study, the trend in the laws and regulations violated, as well as the reasons for recalls, was largely consistent. The analysis points at sanitation control issues as the major cause (49–55%) of the recalls, indicating that the adoption of the HACCP system may effectively strengthen food safety controls in Japan. The HACCP system is mandatory in the USA and China, and food companies have been surveyed [23,24,25,26,27]. The Food Sanitation Law in Japan was revised in 2018, and HACCP adherence became mandatory in June 2021. Therefore, it is expected that the number of food product recalls due to sanitation issues will decrease. As the HACCP only became mandatory recently, further decreases in food product recalls are expected. In addition, 19–23% of the recalls may be prevented by strengthening legal confirmation at the product design stage, and the confirmation of legal compliance by the design review in ISO 9001: 2018 may be effective.
Confectionery and lunch boxes/side dishes were the products that faced the most recalls (approximately 50%), and the top five reasons for recalls accounted for approximately 80% of the number of recalls in confectionery and >90% of the number of recalls in the lunch boxes/side dishes category. Preventive measures, including strengthening management by adopting the HACCP system and FSMS and confirming regulation compliance, will be effective against these five causes of recall and may likely decrease the number of recalls.
Although the number of imported food product recalls account for <10% of the total annual recalls, yearly quarantine violations nearly equal the total number of recalls. Analysis of the relationship between recalls and violations in quarantine inspections before distribution of imported foods in the market revealed that China and the USA had the highest number of quarantine violations. By region, Asia, North America, and Europe showed the highest number of violations. The reasons for violations varied across countries and regions. Of the number of all violations each year, >50% were due to “noncompliance with microbial standards” and “mycotoxin detection”. The top four reasons for violations accounted for approximately 90% of the number of all violations.
Business operators must be proactive in preventing recalls due to “detection of pesticide residues, antibiotics, etc.” and “violation of food additive use standards”. As laws and regulations of each country for such products vary, producers, business operators, and importers of agricultural, livestock, and marine products overseas must understand the laws and regulations of Japan to ensure that their products comply with Japanese standards. Further protection against such violations is provided by the Food Sanitation Law, which requires a confirmation that the overseas business operators are implementing measures to prevent recalls by manufacturers.
Recently, in Japan, there has been an intense movement to improve food-related laws and regulations, including revisions of the Food Labeling Law in 2015 and Food Sanitation Law in 2018. Additionally, in 2020, the sentiments concerning food have changed greatly due to the coronavirus disease 2019 (COVID-19) pandemic. Various studies on recalls have been conducted worldwide. For instance, Blickem et al. [28] investigated tuna product recalls in the USA from 2002 to 2020 and emphasized the importance of traceability and food safety culture to prevent recalls. Qiu et al. [29] investigated the relationship between food poisoning and recalls in the USA from 2006 to 2016, suggesting that improved traceability may reduce the number of recalls. Moreover, Herod et al. [30] investigated recalls caused by microbial contamination in Canada from 2000 to 2017, and Liao et al. [31] reported the importance of risk communication in the event of a recall in China. Liao et al. [32] also assessed consumer responses and found that consumers regain confidence if a recall occurs. To prevent food product recalls in both domestic and imported foods, as well as food exported between countries, the governments and researchers of each country must cooperate in knowledge transfer and information exchange. The results of this study may contribute to improving the food industry in Japan and other countries.
The main limitation of this study is that the data were mainly analyzed using descriptive statistics, with no other methods applied during the data analysis. Additionally, data were collected to enable food manufacturers to inform the government about the impact of a food in question on consumers in terms of food safety; however, there exists a lack of information on the background of recalls, which is why considering more extensive measures for the reduction of food product recalls is needed.

Funding

This research received no external funding.

Institutional Review Board Statement

Not applicable. For studies not involving humans or animals.

Informed Consent Statement

Not applicable. For studies not involving humans.

Data Availability Statement

The data that support the findings of this study are available from the corresponding author upon reasonable request.

Acknowledgments

I express my sincere gratitude to the Japan Food Industry Association for providing data on food product recalls.

Conflicts of Interest

The author declares no conflict of interest.

References

  1. Ministry of Health, Labor and Welfare. Outline of the Partial Revision of the Food Sanitation Law (Promulgated on 13 June 2018). Available online: https://www.mhlw.go.jp/content/11131500/000345946.pdf (accessed on 31 May 2021).
  2. Summary on the Current Status of Food Product Recalls, Consumer Safety Expert Committee. Available online: https://www.cao.go.jp/consumer/iinkaikouhyou/2013/houkoku/201308_houkoku.html (accessed on 31 May 2021).
  3. Matsumoto, T. Consideration on countermeasures for food product recall prevention in Japan. J. Food Syst. Res. 2019, 26, 367–372. (In Japanese) [Google Scholar] [CrossRef]
  4. Ministry of Agriculture, Forestry and Fisheries. Summary of Import and Export of Agricultural, Forestry and Fishery Products. 2020. Available online: https://www.maff.go.jp/j/tokei/kouhyou/kokusai/houkoku_gaikyou.html (accessed on 31 May 2021).
  5. Matsumoto, T. Obligation of notification of voluntary recall and trend analysis of recent food product recall. Food Ind. Tomorrow 2021, 6, 31–39. (In Japanese) [Google Scholar]
  6. Matsumoto, T. Obligation of notification of voluntary recall and countermeasures for food product recall prevention. Mon. Food Fact. Manag. 2021, 6, 30–35. (In Japanese) [Google Scholar]
  7. Kanayama, A.; Kaku, K. Risk of imported food products assumed from cases of oversea food poisoning. Jpn. J. Public Health 2013, 60, 697–704. (In Japanese) [Google Scholar]
  8. Iguchi, N.; Terazaki, M. Product Recall 2012; ABA Section of International Law: Chicago, IL, USA, 2012; pp. 82–85. [Google Scholar]
  9. Ministry of the Environment. 2030 Agenda/SDGs for Sustainable Development. Available online: https://www.env.go.jp/earth/sdgs/index.html (accessed on 1 March 2022).
  10. Consumers Affairs Agency. Reference Materials Related to Food Loss Reduction. 2020. Available online: https://www.caa.go.jp/policies/policy/consumer_policy/information/food_loss/efforts/assets/efforts_210826_0001.pdf (accessed on 1 March 2022).
  11. Ministry of Agriculture, Forestry and Fisheries. The Situation Surrounding Food Loss and Recycling. 2020. Available online: https://www.maff.go.jp/j/shokusan/recycle/syoku_loss/attach/pdf/161227_4-157.pdf (accessed on 1 March 2022).
  12. The Japan Food Industry Association. Food Recall Information. Available online: https://www.shokusan.or.jp/news/5087/ (accessed on 1 March 2022).
  13. Consumer Affairs Agency. Recall Information. Available online: https://www.recall.caa.go.jp/ (accessed on 1 March 2022).
  14. Food Inspection Division, Tokyo Quarantine Station. Flow of Procedures for Import Notification of Foods, etc. Available online: https://www.forth.go.jp/keneki/tokyo/kanshi_hp/a003.html (accessed on 28 May 2021).
  15. Ministry of Health, Labor and Welfare. Import Procedure Based on the Food Sanitation Law. Available online: https://www.mhlw.go.jp/stf/seisakunitsuite/bunya/kenkou_iryou/shokuhin/yunyu_kanshi/kanshi/index.html (accessed on 31 May 2021).
  16. Plant Protection Station. Available online: https://www.maff.go.jp/pps/ (accessed on 31 May 2021).
  17. Veterinary Quarantine. Available online: https://www.maff.go.jp/aqs/ (accessed on 31 May 2021).
  18. Ministry of Health, Labor and Welfare. Import Procedure: Import Procedure under the Food Sanitation Law. Available online: https://www.mhlw.go.jp/stf/seisakunitsuite/bunya/0000144562.html (accessed on 31 May 2021).
  19. Ministry of Agriculture, Forestry and Fisheries. Survey Result on the Introduction Status of HACCP System in the Food Manufacturers. Available online: https://www.maff.go.jp/j/shokusan/koudou/what_haccp/attach/pdf/h_toukei-12.pdf (accessed on 31 May 2021).
  20. Saito, T. Toward the reduction of printing accident in expiration date and food label. Mon. HACCP 2018, 20, 33–37. (In Japanese) [Google Scholar]
  21. Komaki, E. Food labeling discrepancy prevention utilizing HACCP technique. Food Sci 2018, 10, 64–73. (In Japanese) [Google Scholar]
  22. Ministry of Health, Labor and Welfare. Violation Cases in Quarantine Station Inspections. Available online: https://www.mhlw.go.jp/stf/seisakunitsuite/bunya/kenkou_iryou/shokuhin/yunyu_kanshi/ihan/index.html (accessed on 31 May 2021).
  23. Bai, L.; Ma, C.; Yang, Y.; Zhao, S.; Gong, S. Implementation of HACCP system in China: A survey of food enterprises involved. Food Control 2007, 18, 1108–1112. [Google Scholar] [CrossRef]
  24. Dodd, C.; Powell, D. Regulatory management and communication of risk associated with Escherichia coli O157:H7 in ground beef. Foodborne Pathog. Dis. 2009, 6, 743–747. [Google Scholar] [CrossRef] [PubMed]
  25. Jin, S.; Zhou, J.; Ye, J. Adoption of HACCP system in the Chinese food industry: A comparative analysis. Food Control 2008, 19, 823–828. [Google Scholar] [CrossRef]
  26. Jung, J.; Bir, C.; Widmar, N.O.; Sayal, P. Initial reports of foodborne illness drive more public attention than do food recall announcements. J. Food Prot. 2021, 84, 1150–1159. [Google Scholar] [CrossRef] [PubMed]
  27. Xu, Z.; Wang, M.; Zhou, C.; Gu, G.; Liang, J.; Hou, X.; Wang, M.; Wei, P. Prevalence and antimicrobial resistance of retail-meat-borne Salmonella in southern China during the years 2009–2016: The diversity of contamination and the resistance evolution of multidrug-resistant isolates. Int. J. Food Microbiol. 2021, 333, 108790. [Google Scholar] [CrossRef] [PubMed]
  28. Blickem, E.R.; Bell, J.W.; Baumgartel, D.M.; DeBeer, J. An analysis of tuna recalls in the United States, 2002 through 2020. J. Food Prot. 2021, 85, 60–72. [Google Scholar] [CrossRef] [PubMed]
  29. Qiu, Q.; Dewey-Mattia, D.; Subramhanya, S.; Cui, Z.; Griffin, P.M.; Lance, S.; Lanier, W.; Wise, M.E.; Crowe, S.J. Food recalls associated with foodborne disease outbreaks, United States, 2006–2016. Epidemiol. Infect. 2021, 149, e190. [Google Scholar] [CrossRef] [PubMed]
  30. Herod, A.; Goodridge, L.; Rohde, J. Recalls of foods due to microbial contamination classified by the Canadian Food Inspection Agency, 2000 to 2017. J. Food Prot. 2019, 82, 1901–1908. [Google Scholar] [CrossRef] [PubMed]
  31. Liao, C.; Luo, Y.; Zhu, W. Food safety trust, risk perception, and consumers’ response to company trust repair actions in food recall crises. Int. J. Environ. Res. Public Health 2020, 17, 1270. [Google Scholar] [CrossRef] [PubMed] [Green Version]
  32. Liao, C.; Zhou, X.; Zhao, D. An augmented risk information seeking model: Perceived food safety risk related to food recalls. Int. J. Environ. Res. Public Health 2018, 15, 1800. [Google Scholar] [CrossRef] [PubMed] [Green Version]
Figure 1. Distribution of imported foods in the Japanese domestic market. * In case of failure, measures such as recall will be taken. Source: Food Inspection Division, Tokyo Quarantine Station [14], Ministry of Health, Labor and Welfare [15].
Sustainability 14 07863 g001
Figure 2. Classification of food product recalls based on violation of laws and regulations. Source: Food Industry Association [12], Consumer Affairs Agency [13].
Sustainability 14 07863 g002
Figure 3. Number of recalls based on the food category. Source: Japan Food Industry Association [12], Consumer Affairs Agency [13].
Sustainability 14 07863 g003
Figure 4. Reasons for recalls in the confectionery category. Source: Written by the author.
Sustainability 14 07863 g004
Figure 5. Reasons for recalls in the lunch boxes/side dishes category. Source: Written by the author.
Sustainability 14 07863 g005
Table 1. Approximate food loss caused by food product recall.
YearA: Number of RecallsB: Number of Companies That Announced the Quantity of
Collection
C: Number of
Products to Be Collected × Total Content
(Amount Collected by Company B) Unit: 10,000 tons
D: Estimated Amount of Food Loss = C × A/B (100% Conversion)
Unit: 10,000 tons
(Reference) Ratio (%) of Food
Manufacturers to 1.21 Million tons of Food Loss in 2017
20187911933.0812.6210.43
20197702251.184.043.34
Source: Written by the author.
Table 2. Classification of manufacturer-attributed recalls by reason.
Classification and Related LawsReason for RecallNumber of Occurrences
FY2018FY2019FY2020
A. Attributable to the manufacturing process (packaging process)282244303
Food Labeling LawA1. Best-before date Printing error (printing error, no printing)1138585
A2. Expiration date Printing error (printing error, no printing)565560
A3. Mistakes and omissions in allergen labeling8574124
A4. Incorrect labeling71514
Food Sanitation LawB1. Defective packaging (possible microbial contamination)211518
B2. Contamination (part of packaging)002
B. Caused by the manufacturing process (other than the packaging process)212212166
Food Sanitation LawB1. Microbial contamination927472
B2. Foreign material contamination677742
B3. Deviations from specifications and standards241219
B4. Allergen contamination884
B5. Poor sterilization/unsterilization6515
B6. No business license (other)9278
Act against Unjustifiable Premiums and Misleading RepresentationsB7. Falsification of origin of raw materials by the business operator420
Food Labeling LawB8. Incorrect input/use of ingredients, incorrect packaging214
B9. Missing allergen labeling (incorrect use of ingredients)052
Measuring MethodB10. Insufficient quantity010
C. Arising from the product design stage.153151125
Food Labeling LawC1. Mistakes or omissions in allergen labeling11612393
C2. Mistakes in batch labeling (ingredients, storage methods, etc.)211717
C3. Mistakes in display of nutrition facts415
Food Sanitation LawC4. Incorrect use of food additives (2) Other1198
C5. Incorrect use of food additives (2) Other112
D. Caused by raw materials and packaging materials used in manufacturing154752
Food Sanitation LawD1. Violation of pesticide residue and veterinary drugs51614
D2. Detection of radioactive materials534
D3. Foreign material contamination (including harmful plants and chemicals)31416
D4. Microbial contamination (including defective packaging)1316
D5. Violation of food additive use standards050
D6. Cross-contamination of allergens021
Food Labeling LawD7. allergen labeling missing (wrong information on raw materials), etc.031
Act against Unjustifiable Premiums and Misleading RepresentationsD8. Raw material suppliers disguising the origin of raw materials110
Total 662654646
Source: Japan Food Industry Association [12], Consumer Affairs Agency [13].
Table 3. Probable causes of and countermeasures for preventing food product recalls.
Process/StageReason for RecallProbable CauseCountermeasure Plan
Manufacturing ProcessIncorrect or no indication of best-before-date or expiration dateMissetting or printing forgotten in the packaging processEstablishment of a check system for work orders before production, confirmation of deadlines in process control, confirmation before shipment, etc.
Allergen labeling missing (product design stage)Due to allergen labeling error in the display creation at the design stageConfirmation of legal compliance through design review in ISO9001: 2015
Microbial ContaminationIn particular, mold contamination during packaging after a heating process such as baking or contamination from the working environment or workers if there is no heating processHACCP systems, including general HACCP (including HACCP controls)
Strengthening food safety management systems such as JFS-C certification
Foreign Material ContaminationOrigin of raw materials, introduction of foreign matter, generation in manufacturing process, etc.
Allergen labeling missing (product design stage)Labeling error in packaging processEstablishment of a check system for work orders before production, confirmation of deadlines in process control, confirmation before shipment, etc.
Product Design and Development StageAllergen labeling and other labeling errors
-
Omissions and errors in information at the time of display creation, lack of knowledge and management of persons in charge of displaying creation and recipe development
-
Allergen-labeling leakage of secondary raw materials. Information transmission errors from raw material suppliers (such as wrong information and changes in secondary raw materials)
-
Design review in ISO9001: 2015: Display preparation and confirmation by persons in charge who are familiar with laws and regulations
-
Strengthen raw material supplier management (contracts, change control, quality audit, etc.)
Source: Written by the author.
Table 4. Food import data from food suppliers, quarantine inspections, and violations.
FY2018FY2019FY2020
Number of reports (millions)2.342.432.48
Reported weight (unit: million tons)32.333.834.2
Number of quarantine inspections206,000206,000224,000
Inspection rate (number of inspections/number of reports × 100, unit: %)8.88.59.0
Number of violations780843653
Violation rate (number of violations/number of inspections × 100, unit: %)0.380.410.29
Source: Ministry of Health, Labor and Welfare [22].
Table 5. Top 10 countries for Japan food imports.
Top 10 Countries in Terms of ImportsShare of Import Value (%)Main Imported Foods
RankCountry NameFY 2018FY 2019FY2020
1USA18.717.317.5Corn, beef, pork, soybeans, fresh and dried fruits
2China12.912.613.4Frozen Vegetables, poultry products, soybean oil cake, fresh vegetables, unagi (prepared)
3Canada6.16.05.8Pork, rapeseed (for oil production), wheat, soybeans
4Thailand5.95.95.8Chicken preparations, poultry, pet food, shrimp preparations
5Australia5.95.75.1Beef, sugar, natural cheese, wheat
6Vietnam2.93.13.9Shrimp, shrimp preparations, coffee beans (raw beans), squid
7Brazil2.73.83.8Corn, chicken, coffee beans (raw beans), soybean oil cake, soybeans
8Indonesia3.83.83.7Shrimp and palm oil
9Italy3.43.23.5Alcoholic beverages, olive oil, tomatoes (preparations), and spaghetti
10Korea2.93.03.1Skipjack and tuna, fresh vegetables, alcoholic beverages, sweetened food products
Total import value
USD 1 billion *88.787.381.6
Japanese JPY, Unit: trillion JPY9.79.58.9
* Calculated as USD 1 = JPY 109. Source: Ministry of Agriculture, Forestry and Fisheries [19].
Table 6. Number of imported food violations in quarantine inspection based on region.
FYArea *Items Related to the Food Sanitation LawTotalViolations in Major Countries (5% or More of the Total; Number of Violations after Country)
Number of Violations after Country)
Non-Compliance with Microbial StandardsMycotoxin (e.g., Aflatoxin) DetectionDetection of Pesticide Residues and AntibioticsViolation of Food Additive Use StandardsDetection of Chemical Substances (e.g., Cyanogen)Other Nonconformance
2018Subtotal/Total2671531431123768780
RegionalNorth America (Including USA)419321017154USA: 142
USA31932817142
Middle and South America532532240
Europe2954372319117Italy: 43
Middle East08750020
Asia (Including China)177388055939398Thailand: 43, Vietnam: 53, China: 178
China68193721033178
Africa402300027
Oceania111112016
2019Subtotal/Total2671551561591789843
RegionalNorth America (Including USA)397124628150USA: 139
USA307122628139
Middle and South America772080143
Europe239438243119
Middle East1222029
Asia (Including China)18659961031234398India: 58, Thailand: 48, Vietnam: 63, Taiwan: 42, China: 196
China69353339317196
Africa34900021
Oceania83121116
Subtotal/Total2051231261141273653
2020RegionalNorth America (Including USA)34612523107USA: 97
USA2860150397
Middle and South America552390042
Europe251082231684
Middle East0404109
Asia (Including China)135408671553390Thailand: 39, Vienam: 70, China: 158
China45194323028158
Africa2160009
Oceania42131112
* Regions are divided into seven categories according to the Japanese Ministry of Foreign Affairs classification. Figures for the United States and China, the top two countries in terms of imports, are by country. Source: Ministry of Health, Labor and Welfare [22].
Table 7. Classification of importer-attributed recalls by region and violation of laws.
FYAreaRelated LawsTotal/Subtotal
Food Sanitation LawFood Labeling Law
2018Subtotal/Total441963
ReginalNorth America448
Middle and South America415
Europe16622
Middle East112
Asia18624
Africa101
Oceania011
2019Subtotal/Total581573
ReginalNorth America9716
Middle and South America426
Europe9312
Middle East000
Asia33235
Africa000
Oceania314
2020Subtotal/Total47855
ReginalNorth America123
Middle and South America101
Europe15419
Middle East000
Asia27229
Africa101
Oceania202
Source: Ministry of Health, Labor and Welfare [22].
Table 8. Classification of importer-attributed recalls by reason.
Classification and Related LawsReason for RecallNumber of Occurrences
FY2018FY2019FY2020
a. Food Sanitation Lawa1. Foreign material contamination (dangerous foreign material, others)1074
a2. Pesticide residues, synthetic antibacterial agents, antibiotics (derived from raw materials)112817
a3. Microbial contamination (food poisoning bacteria, others)11213
a4. Violation of food additive use standards111411
a5. Other (cross-contamination of allergens, etc.)172
b. Food Labeling Lawb1. Best-before date: No mistake1184
b2. Wrong allergen labeling333
b3. Wrong labeling (wrong origin labeling, wrong labeling, wrong food additive labeling)541
Total 637355
Source: Japan Food Industry Association [12], Consumer Affairs Agency [13].
Publisher’s Note: MDPI stays neutral with regard to jurisdictional claims in published maps and institutional affiliations.

