1. Introduction
There are many sources of information about functional products. The basic source is information given by the producer and available in manuals and different kinds of labels, as well as delivered on-line on the Internet. Other kinds of information are reviews and opinions about products, formulated by consumers, who experienced contact with a given product. Important information on market products is also provided by the results of surveys, in particular, surveys focused on customer satisfaction [
1]. The valence and the volume of reviews constitute one of the most important features influencing sales and attitudes [
2,
3,
4]. Review experience [
5], the source of the review [
2], and the characteristics of the reviewer [
6] show the effect on changes in sales and consumer behavior. The question is how to use this knowledge and information on individual products, taking into account a scientific approach to developing survey results and data collected by other methods.
Creating new research concepts is one of the characteristic elements supporting the development of production systems. Designing scientific research is part of the process of improving knowledge and assessing the effects of qualitative, quantitative, and mixed research [
7]. In research studies involving agricultural production systems, an important place is occupied by processes and related technical objects, which are the subject of the assessment. The assessment of technical objects, i.e., machines and other types of equipment in agricultural and horticultural production, results from their special role, which is supporting human work [
8]. If technical devices support people in the implementation of production tasks, they are subject to high requirements related to the quality of work and other features. Both the quality of work and the individual features of technical facilities constitute the premise for formulating various methods for their assessment. These tools become sustainable if their technical, economic, and functional side is user-friendly and environmentally friendly.
In the considerations concerning the assessment of technical objects with the use of various methods, the issue of the practical use of the results of the assessment appears. This practical use is to support decision-making processes on the basis of computational indicators (specific to given methods) or descriptive assessments. The decision support problems are reflected in the literature, pointing to the growing role of decision support systems for farms [
9], including computer decision support systems [
10] and digitization in management [
11], and the role played by information technologies in agriculture [
12] and the use of artificial neural networks [
13]. The decision-making processes relate to potential users of technical equipment who expect support regarding the selection of equipment and the assessment of its individual characteristics. This support expected by potential buyers and users of technical equipment is the result of a large amount of information that has to be dealt with at the stage before purchasing the equipment. Hence, an important task remains to create a multi-criteria tool for assessing the initial concept of a product platform [
14].
The importance of formulating product assessments is confirmed by the concepts of multi-criteria methods of product quality assessment developed over the years. The developed methods are distinguished by their specificity, the algorithm of the operating procedure, the approach to data collection and the scope of these data, the way of presenting and interpreting the results, and a number of other features. In the procedure algorithms [
15], product quality assessments are usually preceded by a detailed selection and list of features and the definition of feature assessment methods, taking into account the appropriate measurement scale. In practice, this scale may have a different scope and structure, not only for the range of the continuous variable but also the step variables. Such step variables include positive and negative assessment options. Positive and negative evaluation options are included in many studies. The question remains what goals are set and achieved in research involving the idea of opposing concepts. A summary of such exemplary studies is provided in
Table 1 (the first column covers the original titles of the papers, and the second covers the concept of positive and negative evaluations).
Examples of scientific publications (
Table 1) show a general approach to the use of research results covering positive and negative concepts. In this approach, positive and negative messages support the description of the studied phenomena, social behavior, and products.
The gap in the current approach to research with positive and negative evaluation elements is the lack of comparative indicators that could be used in the analysis of research results.
The research problem is to develop a method that combines positive and negative product assessments in the form of one indicator.
The broad range of investigation with positive and negative aspects confirms that there are premises to develop one’s own method of the product(s) assessment based on positive and negative opinions given by the product users. The novelty of this method is the proposition of an index that links positive and negative assessments of individual features of an object in research with a group of users of this object.
The cognitive aim of the study is to develop the concept of a method for the assessment of technical objects on the basis of the proposed index, taking into account the advantages and disadvantages of technical and functional features of the objects in the opinion of their users. At the same time, the intention of the developed assessment method is to create a tool supporting decision-making related to equipping agricultural/horticultural production with technical equipment. Thus, the cognitive aim of the research is linked to the utilitarian aim.
Making decisions in various spheres of human activity, production, and management involves the use of knowledge, experience, and expert opinion. Experts make key contributions to many research methods, including through the Delphi method [
21] and others. They also play a special role in developing the methods of assessing technical objects and their quality characteristics. In the case of the assessment of the technical infrastructure used in the orchard, the experts’ knowledge was represented by the users of specialized equipment intended for the implementation of tasks on the fruit tree plantation. In a detailed methodological approach, as suggested by [
22], the process of acquiring knowledge with the participation of experts should be preceded by specifying the problem and answering the questions: what knowledge is needed and how to use this knowledge? These questions fall within the scope of the formulated cognitive goal and the utilitarian goal of the research study undertaken.
2. Materials and Methods
The concept of a method can be understood as a procedure leading to the achievement of the goal that can be used many times [
23]. The proposed evaluation method—as a result of the authors’ own research—extends the existing spectrum of product evaluation methods using a questionnaire containing a set of technical equipment features, which are subject to individual evaluation by users (respondents). The detailed procedure for the proposed evaluation method is as follows:
Selection of a technical object for questionnaire research.
Selection of technical and functional features of a technical object that will be included in the questionnaire for respondents.
The respondents evaluate the features of the technical object, assigning the selected features the option “advantage”.
The respondents evaluate the features of the technical object, assigning the selected features the option “disadvantage”.
Summary of the results of assessments concerning individual features of a technical object on the basis of the sum of “advantages” and the sum of “disadvantages” indicated by the respondents.
Calculation of the comparative index on the basis of the sum of “advantages” and the sum of “disadvantages” for the considered feature of the technical object.
For most of the technical products to be assessed, there is a subset of the technical features and a subset of the functional features. For the purposes of the analysis, in the proposed method with the use of a questionnaire, the identification of technical and functional features is required. The number of distinguishable technical and functional features results from the degree of construction complexity of the technical object.
The formal notation of a set of technical features and a set of functional features relating to the considered technical object is as follows:
A set of technical features—t1, t2, t3, …, tn
A set of functional features—f1, f2, f3, …, fn
Taking into account the assessment of individual features of a technical object based on the answers “advantage” and “disadvantage”, the following research hypothesis can be formulated:
User satisfaction related to the use of the assessed technical object is proportional to the level of perfection (advantages) of this object and inversely proportional to its imperfections (disadvantages), which can be expressed by the utility potential index. The proposed utility potential index (
Iup) can be expressed as a formula that takes into account the number of advantages (
a), disadvantages (
d), and the number of evaluating users (
x):
where:
Iup—utility potential index in the scope of the considered feature of the object;
a—the number of “advantage” responses in the assessment of the considered feature of the object;
d—the number of “disadvantage” responses in the assessment of the considered feature of the object;
x—the number of assessments (assessing users) of the considered feature of the object;
wherein: a + d ≤ x
The number of assessments (x) of the considered feature of the object in Formula (1) is equal to the number of users of the equipment participating in the survey.
In order to implement the individual stages in the proposed research method, leading in the final stage to the calculation of the utility potential index, it is required to develop an appropriate tool for collecting research data. This tool is a survey questionnaire with subsets of technical and functional features that are assessed by users.
2.1. Approach to Data Collection and Compilation
In order to collect the “advantage” and “disadvantage” responses regarding the technical and functional features of a technical object, two ways of proceeding can be considered:
The user completes the questionnaire using the zero-one system, where “0” refers to “disadvantage” and “1” is identified with “advantage” in assigning grades to individual features.
The user completes two independent questionnaires, each with a set of assessed technical and functional features; in one questionnaire, the user assigns the selected features the option “advantage”, and in the other, the option “disadvantage”.
The first method of filling in the questionnaire allows the user to clearly assign advantages or disadvantages to particular technical and functional features. After being filled in by the user, the questionnaire form is marked with 1 (advantage) or 0 (disadvantage). If some features are not assigned “1” or “0”, it means that there is no opinion about a given feature of the object considered in terms of advantage–disadvantage.
In the case of the second option (based on two questionnaires), the objectivity of user assessments can be indirectly checked. In the first stage of the discussed approach to assessment, it is possible to propose to the user to assign selected features only the “advantage” answer. Then, in a second step, the user is asked to assign only the “disadvantage” response to the selected features. In the case of the second stage of participation in the survey, the user does not have access to the “advantage” answers previously given by him/her, marked in the questionnaire. This procedure, with the two-step selection of the “advantage” and “disadvantage” options, allows to verify the user’s responses. The verification consists in checking whether, in the case of individually considered features, the answers “advantage” and “disadvantage” in relation to the same technical or functional feature were not marked in both questionnaires. When the respondent marks a given feature in both the first questionnaire with “advantage” and the second questionnaire with “disadvantage”, then it will mean a lack of unanimity and stability of opinion with regard to the considered feature. The list of incorrect answers, i.e., double answers (advantage and disadvantage) in the case of the considered features, may be one of the premises for determining the measurement error.
The proposed research method includes the “I have no opinion” option. This is equivalent to the fact that in the questionnaire (or questionnaires in the case of a two-step approach), the user for some technical or functional features does not indicate any of the options, i.e., “advantage” or “disadvantage”.
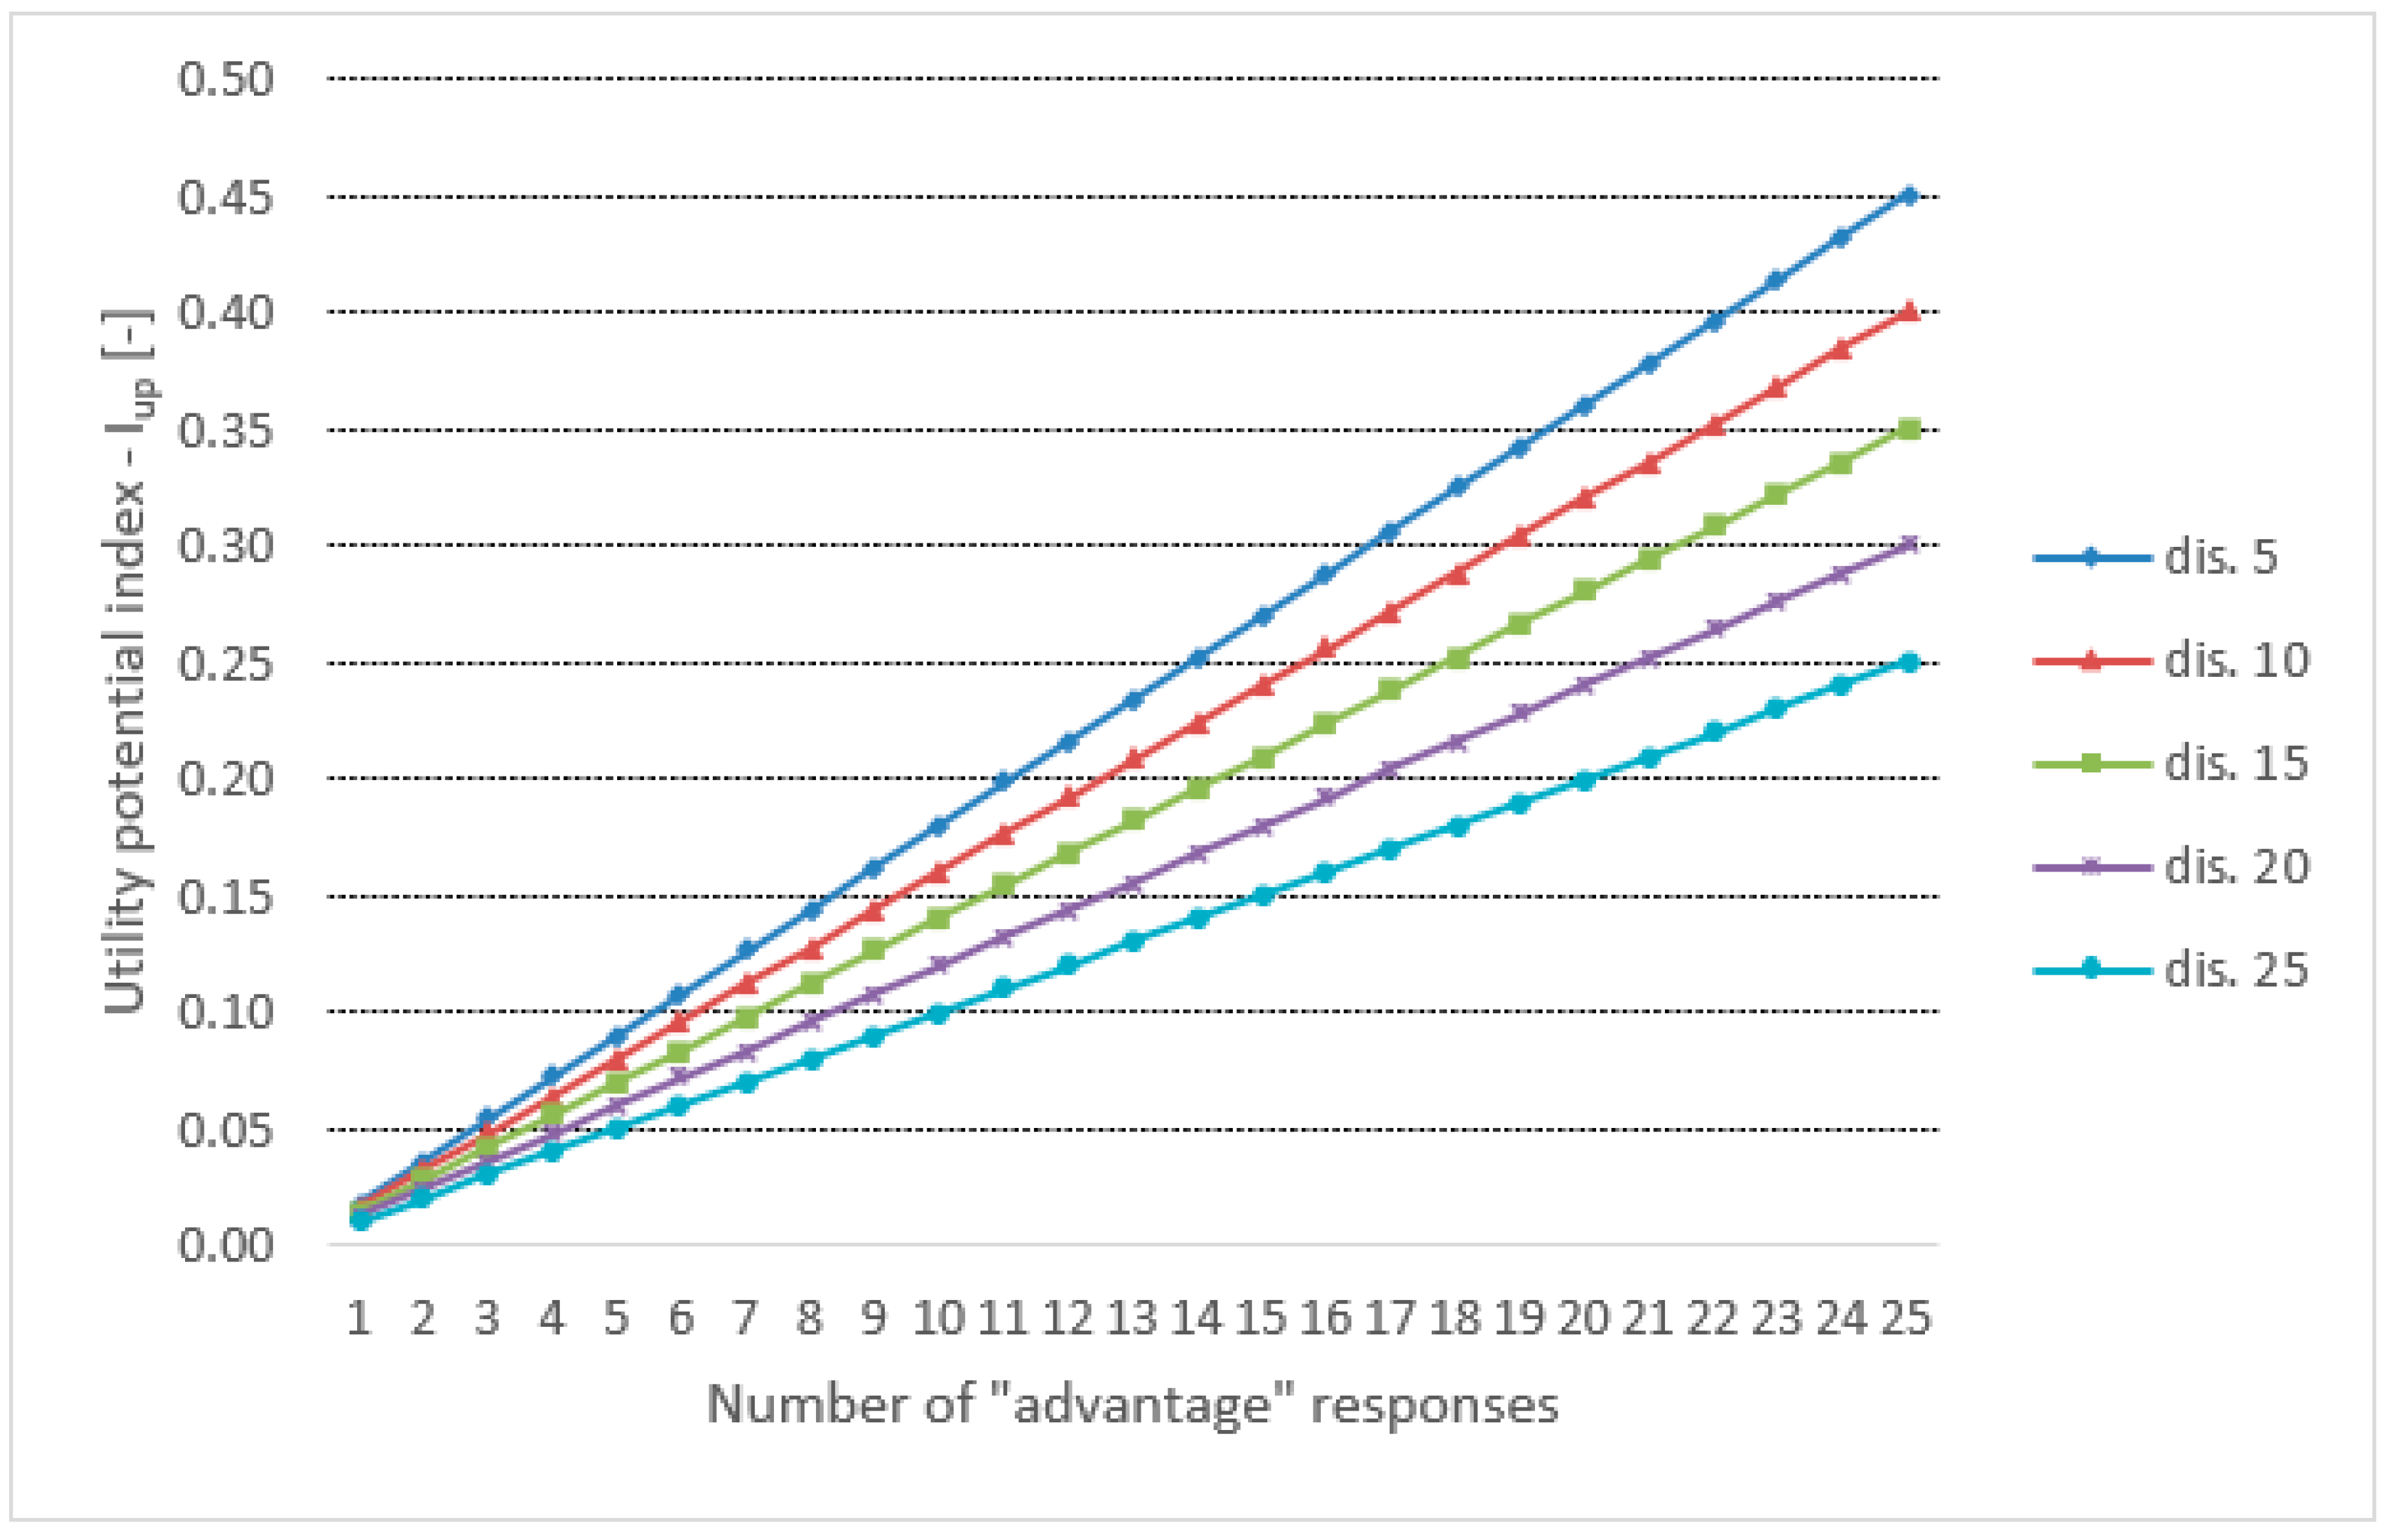
These three options for assessing a given feature of a technical object in the questionnaire, taking into account the advantage, disadvantage, and no opinion, determine the value of the utility potential index (
Iup). The computational value of the
Iup index ranges from 0.00 to 1.00. A zero value of
Iup is possible only when there is no “advantage” answer in the user response set. In such a situation, regardless of the number of “disadvantage” responses or no opinion, the value of the utility potential index is “0”. Other properties of the usable potential index (
Iup) are shown in
Figure 1, based on an example that takes into account the assessments given by 50 users (
x = 50) and changes in the number of advantages (from 1 to 25) for five levels of the number of disadvantages (5, 10, 15, 20, and 25).
The increasing share of advantages in the total sum of responses in the questionnaire is accompanied by an increase in the value of the
Iup index. The dynamics of changes in the index, however, depend on the mutual share of advantages and disadvantages, as well as their number in relation to the total number of answers provided in the questionnaire. In the case under consideration (
Figure 1), along with the decreasing share of the indication of “disadvantage”, the value of the
Iup index increases. The lack of the “disadvantage” answer does not mean, however, that the value of the
Iup index will reach its maximum, i.e., 1.00. Achieving the maximum value of the utility potential index (
Iup) is possible only when all user responses are “advantage”.
2.2. Data Arrangement and Classification
The proposed utility potential index (Iup) is calculated for a single feature of the considered technical object. As a result, taking into account a certain number of assessed features of an object in the questionnaire, a set of individual indices is obtained equal to the number of assessed features, which can be collated, compared, and classified.
When developing the issue of using the utility potential index (Iup) for comparisons, various models of technical objects assessed with the use of a questionnaire can be taken into account. For example, they can be technical objects of the same or different manufacturers on the market of specialized equipment. The utility potential index (Iup) determined on the basis of surveys with the participation of users of various models of technical objects provides information about the differences in assessment between objects and their features.
By extending the scope of using the utility potential index (
Iup), it is possible to develop a comparison of the assessed objects belonging to different generations (categories) of equipment, as shown in the example of data summarized in
Table 2. Calculated average values of the
Iup index for individual features of technical objects within the separate generations of objects are a premise for comparisons on a wider scale, covering various generations of technical advancement of objects as well as a subset of technical and functional features of these objects. The criterion for discussing the set of calculated values of the utility potential index (
Iup) may be the indication of the minimum and maximum values, comparison of their differentiation, features with the minimum and maximum
Iup values, and others. On the basis of the utility potential index, it is possible to establish a hierarchy of assessed features of technical objects included in each generation of equipment.
The range of
Iup values from 0.00 to 1.00 is a premise for proposing the categorization of the utility potential index, important for the interpretation and discussion of research results. Within the scale from 0.00 to 1.00 it is possible to distinguish five categories, assigning each of them a range of values (
Table 3).
The next stage in the interpretation of the utility potential index (
Iup) may be a proposal to distinguish two types of assessment of the percentage distribution of the
Iup index between its categories (from very low to very high). It is a quantitative and qualitative assessment (
Table 4).
In the case of a quantitative assessment, the individual lines with the results in
Table 4 take into account the percentage of the utility potential index in the selected categories, determined on the basis of the survey results. The qualitative assessment took into account the percentage of the
Iup index separately for technical and functional features. The sum of their percentage share is equal to the percentage value of the quantitative assessment within a given category of the utility potential index.
2.3. Research Sample
Collecting the research material in the form of completed questionnaires with the answers “advantage” and “disadvantage” in relation to the considered technical and functional features of the equipment requires the involvement of a group of respondents who have experience in the use of the assessed equipment. Two important aspects are related to this part of the planned research. They are the selection of an appropriate number of respondents providing answers on the basis of the research questionnaire and the statement of the level of their experience in the use of the equipment subject to the assessment, including technical and functional features. Both the selection of the number of respondents and the assessment of their experience, including professional experience related to the use of equipment, are the subject of detailed considerations presented in the literature, taking into account research [
24,
25] and studies by other authors.
A novelty in our approach to research was the simplification of the Delphi method by asking experts once, which reduces the cost of the test and the time needed to conduct it. We reduced the iteration of conducted research. On the other hand, the verification of this method was carried out by comparing the obtained results (finding the best saw model) with market data concerning the number of saw models sold. Assuming that customers act rationally when purchasing, the number of models sold indicates the optimal solution.
In the study quoted, the respondents referred to as experts were selected on the basis of seniority and experience resulting from at least several years of using specialized technical equipment on the farm. The selection of experts and the assessment of their competence was based on the assessment given by the researchers conducting the research and the self-assessment of experts. In the cited studies, the assessment of experts was made on the basis of their selected features scored on a scale from 0 to 10.
As samples of particular tests, combustion chainsaws used in orchard production were taken. Tools for the care and protection of trees should have the least possible impact on the environment, and in their production and use, the consumption of raw materials, water, and energy should be reduced to ensure that they are sustainable. On the basis of the proposed method, tests were carried out according to the discussed method of conduct leading to the determination of the utility potential index (Iup).
The following subsets of technical and functional features were distinguished in the evaluation of chainsaws used in the system of manual care of fruit trees.
A subset of technical features:
Engine—overall assessment of engine performance, quality of work, and durability;
Weight—assessment from the point of view of arduous work;
Guide rail—element assessment from the point of view of service life;
Lubrication—assessment of the amount of oil applied to the chain and its overheating;
Cutting chain—assessment in terms of work accuracy and service life;
Clutch drum—assessment in terms of wear time and service life;
Damping system—evaluation of vibrations and correct operation of shock absorbers.
A subset of functional features:
Functionality—assessment of the scope of use of the saw;
Noise level—assessment from the point of view of arduous work;
Reliability—evaluation of correct operation and operation time;
Workmanship—overall evaluation of workmanship, aesthetics, and materials used;
Operation—user-friendliness assessment;
Service—assessment of customer satisfaction with the possibility of repairing the equipment;
Price—price affordability assessment.
According to the definition of quality described by the ISO 9000 series of standards, when determining a set of features only inherent features are taken into account, i.e., features belonging to a given product and constant properties that exist in themselves. The undertaken research also took into account the price of the equipment as one of the elements of assessment by recipients.
The detailed structure of the research area was as follows:
chainsaw classes—2 classes of chainsaws (amateur, semi-professional);
number of manufacturers of the tested saws—4 manufacturers (A, H, P, S);
total number of assessment criteria—14 criteria (7 technical features and 7 functional features);
number of respondents assessing a single petrol saw—50;
total number of questionnaires—400 questionnaires (8 products assessed by 50 respondents).
On the basis of the research results from 400 questionnaires, the utility potential index (Iup) was calculated for the extracted features in terms of a subset of technical features and a subset of functional features.
3. Results and Their Discussion
The values of the utility potential index (
Iup) and its differentiation for the extracted features are presented in
Table 5.
One of the observations resulting from the compilation of the calculation results of the utility potential index (
Table 5) is the accumulation of the lowest and the highest values of the
Iup index at the level of one of the functional features, i.e., the price of the equipment. The range of the indicator’s diversification in the case of the price is from 0.06 to 0.83. On the other hand, when comparing the
Iup index in the category of technical features of amateur chainsaws, extreme values were recorded in the case of the damping system.
The mentioned price of the equipment is a particularly interesting aspect of the discussion of the research results summarized in
Table 5. Both in the case of amateur and semi-professional chainsaws, the distribution of the value of the utility potential index (
Iup) for the “price” feature is very similar. We can highlight two characteristic ranges of the value of
Iup, i.e., very low and very high. In a set of amateur chainsaws, a very low
Iup range for the price is at the level of 0.08–0.17, and a very high
Iup range is 0.76–0.83. On the other hand, in a set of semi-professional chainsaws, a very low value of
Iup for the price is 0.06, and a very high range of
Iup is 0.77–0.81. Another observation relating to the comparison of
Iup values for the “price” trait applies to companies with the lowest and highest
Iup values. For the compared groups of chainsaws, the lowest and the highest
Iup values refer to the same companies—manufacturers of the tested equipment. The lowest values of
Iup were obtained in the tests by the chainsaws H and S, whereas the highest values of
Iup were achieved by A and P. The obtained results seem to be justified. The H and S companies, and thus their chainsaws, are among the best-known manufacturers and products on the market, which may undoubtedly translate into the price of the equipment, and thus, its direct assessment by users, who were in this case the respondents participating in the conducted study. In general, in the case of products of well-known and recognized companies on the market, higher purchase prices can be expected, which has an impact on the assessment of respondents taking into account the “advantage” and “disadvantage” options of the considered product feature in the given situation of its price. Lower prices of products in the marketplace may be accompanied by a trend towards greater customer satisfaction at the time of purchase, expressed through “advantage” responses to price. Relatively lower costs incurred when purchasing A and P saws, both in the amateur and semi-professional version, were reflected in the preference for the “advantage” answer related to the product price. The effect of the aforementioned preferences for the answer “advantage” is a high range of values of the utility potential index (
Iup) in the case of the considered feature, i.e., the price of chainsaws of the mentioned companies.
Based on the results of the research presented in
Table 5, it is possible to make a detailed comparison of the average values of the
Iup index and its differentiation for the distinguishing features in the case of two groups of saws, i.e., amateur and semi-professional chainsaws.
The graphical presentation of the mean value (for the four considered chainsaws) of the utility potential index (
Iup), taking into account the standard deviation (SD) in the assessment of the amateur chainsaw generation, is presented in the form of a radar diagram in
Figure 2. An adequate radar diagram for the results of the survey of the generation of semi-professional chainsaws is shown in
Figure 3.
The graphic illustration of the value of the utility potential index (
Iup) in the research on amateur chainsaws (
Figure 3) emphasizes the diversity of the considered index in the set of distinguished technical and functional features. The highest values of the
Iup index can be observed for the following features: service, price, and functionality of the equipment under consideration. On the other hand, the lowest values of the utility potential index were found for lubrication, reliability, and weight of the tested group of amateur chainsaws used in orchard production. The relatively low level of the
Iup index in the case of the feature of reliability is an interesting observation—the result of research in confrontation with the general name of the group of the considered equipment, i.e., amateur chainsaws. The phrase “amateur chainsaws” may suggest a relatively low level of technical advancement of the equipment, simplicity of construction, and rules of use. In a particular way, the low level of technical advancement may determine the reduced reliability of the equipment and a shorter period of its failure-free use, which translates into an assessment of the effectiveness of selecting equipment for the needs of the farm. In this case, the efficiency of the selection is expressed by the certainty, significant from the user’s point of view, of the durable, efficient, and reliable operation of the chainsaw on a given farm.
In addition to comparing the value of the utility potential index (Iup) in the tests of amateur chainsaws, the differences in the value of the standard deviation (SD) in relation to the mean value Iup determined for the analyzed features of the device are equally important in the discussion of the results. The lowest values of the standard deviation, at the level of approx. 0.1, were found for the following features of the chainsaws subject to the assessment: lubrication and clutch drum (technical features), as well as noise level and operation (functional features). The lowest value of the standard deviation in comparison with the average value of the utility potential index (Iup) can be noticed in the evaluation of the feature, which is the handling of the technical equipment in question. The relatively low value of the standard deviation indicates a stabilized level of users’ opinions regarding the operation of the discussed group of amateur chainsaws.
Graphical presentation of the mean value (for the four considered chainsaws) of the utility potential index (
Iup) taking into account the standard deviation (SD) in the research of the group of semi-professional equipment is presented in the form of a radar chart in
Figure 3.
The analysis of the value of the utility potential index (Iup) in the tests of semi-professional saws shows that the highest values of the Iup index, ranging from 0.5–0.6, were achieved for the following features: functionality, workmanship, and handling. It is noteworthy that all the above-mentioned features belong to the set of functional features. In the situation of widening the range of values in the analysis to 0.4–0.6, this range also includes Iup for the following assessed features: engine, reliability, and price. By comparing these features with the previously mentioned features, it can be concluded that in the given range (0.4–0.6) of the highest values obtained in the research, out of the six features, as many as five are included in the set of functional features and only one (i.e., the engine) comes from a set of technical features. Such research results based on the value of the utility potential index (Iup) emphasize the importance attached by equipment users to the functional features of chainsaws. This importance is attached to a greater degree compared to the technical features of semi-professional chainsaws. Definitely the lowest value of the Iup index, in the range of 0.0–0.1, was found in the case of the chainsaw evaluation. This may suggest a low level of trust that the users of semi-professional chainsaws have in the replaced parts of the technical device, which may result from operating experience.
An equally important area of the analysis is the set of values of the standard deviation (SD), considered in relation to the average values of the
Iup index and determined for the examined features of semi-professional saws. A particularly high value of the standard deviation in relation to the average value of the
Iup index was found for the price of equipment. This indicates significant discrepancies in the respondents’ answers regarding the considered feature, which is price. The high value of the standard deviation in the case of the price confirms the previous considerations—the discussion summarizing the results presented in
Table 5. This discussion indicates the possibility of distinguishing two characteristic ranges of the utility potential index (
Iup) for the price, i.e., the range of very low values and the range of very high values of
Iup, which therefore translates into a high standard deviation (SD). The lowest level of standard deviation in relation to the average value of
Iup was found for the following features: operation and functionality, which suggests a constant opinion of the respondents.
Based on the data in
Table 5, we calculated the mean values of the utility potential index (
Iup) for individual chainsaw models. In the group of amateur chainsaws, the highest
Iup was achieved by the chainsaws marked in the test by H and S, with an index of 0.43 and 0.37, respectively. On the other hand, among semi-professional chainsaws, the highest
Iup was achieved by the chainsaws marked in the study by A and S, with an index of 0.41 and 0.42, respectively. A higher value of the utility potential index corresponds to a better assessment of the equipment by its users. A better rating of chainsaws may translate into greater interest in their use. To verify this statement, on the basis of the available data, we compared the number and structure of chainsaw models sold in the region where the research was carried out. Based on the data of the sales of chainsaws during one year, we found that the percentage share of sales of individual models was consistent with the distribution of the
Iup index in the group of devices under consideration.
The test results in the form of calculated values of the utility potential index for individual features can be used in the process of assigning weights to the considered features of groups of devices (group of amateur chainsaws and group of semi-professional saws). The essence of the interpretation of the utility potential index shows that higher values of this index in the case of the considered features correspond to the higher importance attached to these features by the users of the equipment. Thus, the features of the device, arranged in the order from the highest to the lowest value of the utility potential index, can be given proportional weights. In the conducted study, as the first approximation on the way to finding the best-rated feature, we used the arithmetic mean of all ratings assigned to individual features separately for the set of amateur and semi-professional saws. The calculations—based on the data in
Table 5—show that the guide rail was rated the highest among the technical characteristics of amateur chainsaws, followed by the motor, whereas lubrication was rated the lowest by users. On the other hand, among the functional features of this group of chainsaws, the operation was rated the highest and noise level the lowest. In the group of semi-professional chainsaws, among the technical features, the users appreciated the engine the most and the cutting chain the least. In this group of chainsaws, among the functional features, the most appreciated by users were functionality and operation, and the least appreciated was the noise level. It can be noticed that for both groups of chainsaws (amateur and semi-professional) the highest and the lowest valued functional features coincided.
In subsequent planned studies, the scoring method with assigned weights will be used. In order to identify the importance of particular features for the user, weights will be entered for each feature and then the number of points will be calculated. The most important features will be assigned the highest possible weights, whereas the least important features will be assigned the lowest weights. The scoring method will make it possible to evaluate the technical and functional characteristics of the tested object separately. In this way, the total sum of the points of the individual assessments will lead to the overall evaluation of the considered object.
Another idea planned to be implemented is to ask users at the beginning of the study to rank the technical features and functional features from the most valuable (important) to the least valuable (important). The results of this assessment can be compared with the results of the utility potential index calculations for individual features. The comparison of the ordered features in the order from the highest to the lowest utility potential index with the ranking of features carried out before the test will allow for the verification of the test results.
4. General Discussion
The proposed method of assessing technical objects may be an alternative to the previously known and used methods of testing the production potential and technical equipment. Each method of assessing technical objects developed thus far is distinguished by the specificity, procedure, and approach for presenting the result of the assessment. Many assessment methods are based on the opinions of experts and/or users of technical facilities, and the question is only how and according to what criteria these opinions are collected and developed. The methods proposed by many researchers [
26,
27] take into account the experts’ assessment of selected features of technical objects on a five-point scale. Determining the average scores for individual features was the basis for the global quality assessment of an object and its classification into one of the five quality assessment ranges. In our method, we also included a scale with five value ranges, except that it was intended to define the category of the calculated utility potential index. Contrary to the approach in the above-mentioned methods, the users of technical objects in our method assessed their features by taking into account the two options of “advantage” and “disadvantage”, instead of rating on a five-point scale. Which of these scales is more objective is debatable. Certainly, the five-point scale gives wider possibilities of precisely expressing opinions related to the evaluation of given features of a technical object, especially if the interpretation of the five-point scale is expanded with additional indicators, including the relation between the highest and the lowest scores [
28]. On the other hand, the five-point scale requires the evaluator (respondent) to interpret the scale’s own scope and find a place on it for the assessed feature. The approach we proposed requires unambiguous expression of one’s opinion on the considered feature of the technical object. This unambiguous opinion consists of choosing one of the options: “advantage” or “disadvantage”. At the same time, it is provided that the user can assess a given feature of a technical object neutrally, i.e., without indicating that it is positive or negative.
In addition to the method of assessing individual features of technical objects, the research also develops the issues of the number of assessed features and the possibility of limiting this number of features. Based on the research involving the selection of criteria for assessing the quality of agricultural machines using the feature correlation method, it was indicated that by limiting the number of decision criteria to nine criteria, it is much easier to assign them weights and speed up the quality evaluation process [
29]. In our method, we focused on categorizing the criteria for assessing a technical object and not limiting the number of assessed features. That is why we distinguished between the categories of technical and functional features in order to indicate the differences in their assessment by users (respondents) of technical objects. The next stage in the research may be to expand the categories of technical and functional features with the related ergonomic assessment. Such an assessment may be an important contribution to the development of research resulting from the personal experiences of users of equipment, especially those intended for manual operation [
30].
When assessing the utility value of technical objects, certain methods of comparing a given object with an ideal object have been developed. In our method, ideal technical objects could be considered those whose features, as a result of users’ assessment, have obtained the utility potential index equal to 1.0. This direction of research is in line with the considerations devoted to ideal solutions, not only regarding technical facilities but also on a wider scale of production facilities, including farms [
31].
In the developed methods of assessing technical objects, strong emphasis is placed on the way of expressing the result of the assessment. For many methods, it is a single indicator. The only question is the basis on which such an indicator is built. In practice, the indicators can be formulated on the basis of work efficiency, operating coefficients, parameters of work quality, and operating costs of technical facilities, in addition to parameters determining the conditions of sustainability in agriculture [
32]. These are terms characteristic of the stage of use of technical facilities. In our method, however, we focused on the parameters of technical facilities assessed directly by their users. In this context, the approach to creating assessment indicators for technical objects is worth noting. These are indicators based on an operational (often computational) approach as well as indicators resulting from the assessment of technical and functional parameters that affect the achieved efficiency and comfort of work. Each approach is specific and requires appropriate interpretation. The common feature, however, is the possibility of the developed indicators in the decision-making process being used by potential recipients/users of technical facilities (objects).
The research highlights the role of prioritizing the criteria for assessing technical objects according to the degree of importance [
33]. The observations resulting from such research can be used to support the decision-making processes of quality management. In our research, individual features of technical objects and their assessment at the summation stage were treated equally. Nevertheless, a valuable suggestion for future research is to establish the order of the considered features of a technical object according to their importance in the opinion of users. This, in turn, may contribute to the further improvement of the methodology of developing the results of the assessment of technical objects on the basis of a set of technical and functional features.
The assessed technical objects can be ranked in order on the basis of the calculated index, for example, in relation to the ideal solution. The ability to prioritize technical objects is one of the important characteristics of indicators in assessment methods. The results of ranking technical objects [
34] can be an important source of information supporting a potential user of the equipment in making decisions related to its purchase.
The presented research can be considered in the context of the basic pillars of sustainable development, including social, environmental, and economic factors [
35]. People expressing social commitment are involved in both the evaluation and use of chainsaws. Users evaluating the chainsaws are aware of their care for the natural environment, cleanliness, and responsible shaping of the environment. The results of the saw assessment are in line with the idea of value-based management that determines the search for economic efficiency of using the technical and functional potential of given equipment.
Research on technical solutions used in agricultural and horticultural production is part of the mainstream scientific considerations combining engineering and biosystems [
36]. The implementation of bioproduction processes in agriculture and horticulture inspires the use of more and more modern technical equipment [
37]. Technical equipment and the progress in understanding its role in the sustainable development of biological production systems generate the problem of the development of research and research methods devoted to technical devices working in agriculture and horticulture.
A feature in the assessment method is each element determining a given object (product) and its properties. Among the features of technical equipment included in the structure of the assessment methods, there are technical, ergonomic and safety, economic, functional, and other groups [
38]. Research on these characteristics is used to determine their value and compare weights in the global assessment of product quality.
The question is how to measure the individual features of the research object (product) under consideration. In practice, taking into account the criterion of the possibility of measurement, measurable and non-measurable features are known. Experiments with technical objects contribute to the measurement and thus identification of technical, physical, and other parameters. The results of research in this area may identify technical progress implemented in the area of biosystems on the basis of measurable features.
The results of research on the measurable features of technical devices contribute important information to the state of knowledge about their working potential, including the achieved work efficiency, quality of task implementation, energy consumption, or environmental impact [
39]. Is this scope of knowledge about a given technical device, however, sufficient for its full, objective assessment? In general, technical facilities, especially those used in the field of agricultural and horticultural activities, are in synergy with the people who attend them. For this reason, users of given technical equipment have practical knowledge about it. This knowledge comes from personal experience in operating the equipment. Therefore, it was justified to develop research covering the assessment of technical devices (objects) operating in biosystems based on the opinions of their users.
The accessible single reviews, consumer ratings, and product attributes create a set of information used in practice and support the purchaser to make the decision to be the owner of the selected product. The information considered individually by the consumer constitutes a certain potential of knowledge, which opens up some questions as [
19]: How can we use this knowledge to ensure better decision-making by a different group of consumers? The issue raised in this question can refer to a narrower group of people, i.e., users of technical equipment. How can the experience of using the equipment be used to evaluate its usefulness for other people?
A wide spectrum of issues related to the concepts of technical infrastructure assessment indicates the complexity of the research undertaken. It is also a stimulus to improve research methods aimed at achieving cognitive and utilitarian goals, including those related to supporting decision-making by potential buyers and users of technical equipment. The utilitarian effect of the study was the creation of a tool supporting the selection of equipment based on the needs of its users. In the case of the chainsaws considered in the study, such users are the owners of the orchards [
40]. The research results can also be used as a suggestion for the improvement of the indicated features of technical devices by their manufacturers. It is important because producers systematically look for information that will allow them to improve the products offered on the market [
41]. In addition, the knowledge about the assessment of individual product characteristics by their users supports the right direction of product improvement.


