Article

Social Influence and Meat-Eating Behaviour

1
School of Geography, University of Leeds, Leeds LS2 9JT, UK
2
Independent Researcher, 22100 Como, Italy
3
Social, Economic and Geographical Sciences Department, The James Hutton Institute, Aberdeen AB15 8QH, UK
*
Author to whom correspondence should be addressed.
Sustainability 2022, 14(13), 7935; https://doi.org/10.3390/su14137935
Submission received: 11 May 2022 / Revised: 30 May 2022 / Accepted: 15 June 2022 / Published: 29 June 2022
(This article belongs to the Special Issue Transitioning toward a Healthy, Secure, and Sustainable Food System)

Abstract

:
In recent years, interest in non-meat diets has been growing at an exponential rate in many countries. There is a wide consensus now that increased meat consumption is linked to higher health risks and environmental impact. Yet humans are social animals. Even the very personal decision of whether to eat meat or not is influenced by others around them. Using data from the British Social Attitude Survey, we develop an agent-based model to study the effect of social influence on the spread of meat-eating behaviour in the British population. We find that social influence is crucial in determining the spread of different meat-eating behaviours. According to the model, in order to bring about large-scale changes in meat-eating behaviours at the national level, people need to (1) have a strong openness to influences from others who have different meat-eating behaviour and (2) have a weak tendency to reinforce their current meat-eating behaviour after observing others in their own social group sharing the same behaviour.

1. Background

The number of people who opt for a non-meat diet (including vegetarians and vegans) in the UK has been growing rapidly in recent years. A survey [1] shows that during the lockdown of COVID-19 in 2020, one in four people in the UK had reduced their consumption of animal products, and one in five had reduced their meat consumption. It is estimated that the number of vegans in the UK had quadrupled between 2014 and 2019 (Food and You Survey, 2014, Ipsos Mori surveys 2016, 2019). The rapid increase in the demand for meat substitutes has also created a new market with many business opportunities. In 2020 the global market for plant-based meat is estimated at USD 6.67 billion, with the U.S. market alone exceeding USD 1.4 billion.
People’s diets have a large impact on both their health and the environment [2], which are two of the grand challenges prioritised by the United Nations [3] and the UK government’s 25 Year Environment Plan [4]. Livestock is an important contributor to greenhouse gas (GHG) emissions, which account for 14.5% of all anthropogenic GHG emissions globally [5]. Annual emissions from beef production alone accounted for approximately 7% of total GHG emissions, according to the U.N. Food and Agriculture Organization (FAO). In addition, researchers find that foods associated with improved health also have low environmental impacts [2]. Increased meat consumption is found to be linked to the growth of degenerative disease (e.g., Alzheimer disease) [6], cancer [7,8], and stroke [9]. A more balanced and sustainable diet therefore will not only improve the quality of life and reduce national health care costs but also significantly lower the environmental impact of food consumption [10,11].
However, despite large public health campaigns and educational programmes to promote healthy eating, including more subtle approaches such as nudges, only modest effects have been achieved at best [12,13]. One reason is that these programmes tend to focus on raising awareness of the nutritional values and environmental impacts for individuals, while the choices of any individual are also influenced by their peers and the social context in which they interact [14,15,16]. Social factors such as gender, race, ethnicity, location of residence (region and urban vs. non-urban), and social class all appear to affect dietary habits even when controlling for physiological variables such as body weight and age [17]. To make public health campaigns and interventions more effective, it is important to go beyond conventional methods of information provision and awareness raising, and give more consideration to the influence of social interactions on these everyday decisions.
Humans are social animals. Apart from individual concerns for health, environmental impacts, and animal rights [18], one’s eating choices is also greatly influenced by their peers and social groups. A review of 69 experiments published between 1974 and 2014 found strong evidence for the role of social influence in one’s dietary choice and eating behaviour [19]. People tend to adjust their food choice and intake to affiliate with those around them such as parents, teachers, and peers [20,21]. Without realising it, people will mimic each other’s eating behaviour as a way to affiliate with and ingratiate others [22]. They will also unwittingly reduce the level of mimicry if they do not want to bond with the person they are eating with [23]. In a real-world setting, based on the combination of a field and a survey experiment in seven German university dining halls, [24] analysed the impact of social norms on meat consumption in a single meal choice situation, and found that direct normative influence leads to convergence towards vegetarian meal choices.
Importantly, many seemingly neutral lifestyle choices such as dietary choices are driven by underlying ideology or social status. DellaPosta, Shi [15] described the ‘latte-drinking liberals’ and ‘bird-hunting conservatives’ in the U.S., where the nonpartisan lifestyle choices of beverages and leisure activities are strongly associated with a distinctive political and ideological profile. People in the same network tend to become more similar in all aspects of life, not only in areas closely related to their ideological beliefs, thus leading to the clustering of lifestyles and choices [25]. According to Weber, a community of individuals with a shared ‘style of life’, agreed upon and expected from all those who belong in the group, marks the beginning of the forming of social status [26].
An increasingly important channel of peer influence is social media, which often leads to new lifestyle trends. Social media allows the sharing of information and opinions at a very personal level. For example, in the last few years, top influencers with millions of followers have started to share pictures and videos of their plant-based meals and recipes on various social media. It has been found that food pictures, personal blogs, and vlogs posted on social media are helpful in maintaining a plant-based diet [27]. As plant-based diets have become trendy on social media, their popularity has skyrocketed over the last few years, especially among young people [28]. As more generations grow up deeply engaged in social media, we can expect that peer influence will play an increasingly important role in shaping one’s lifestyle.
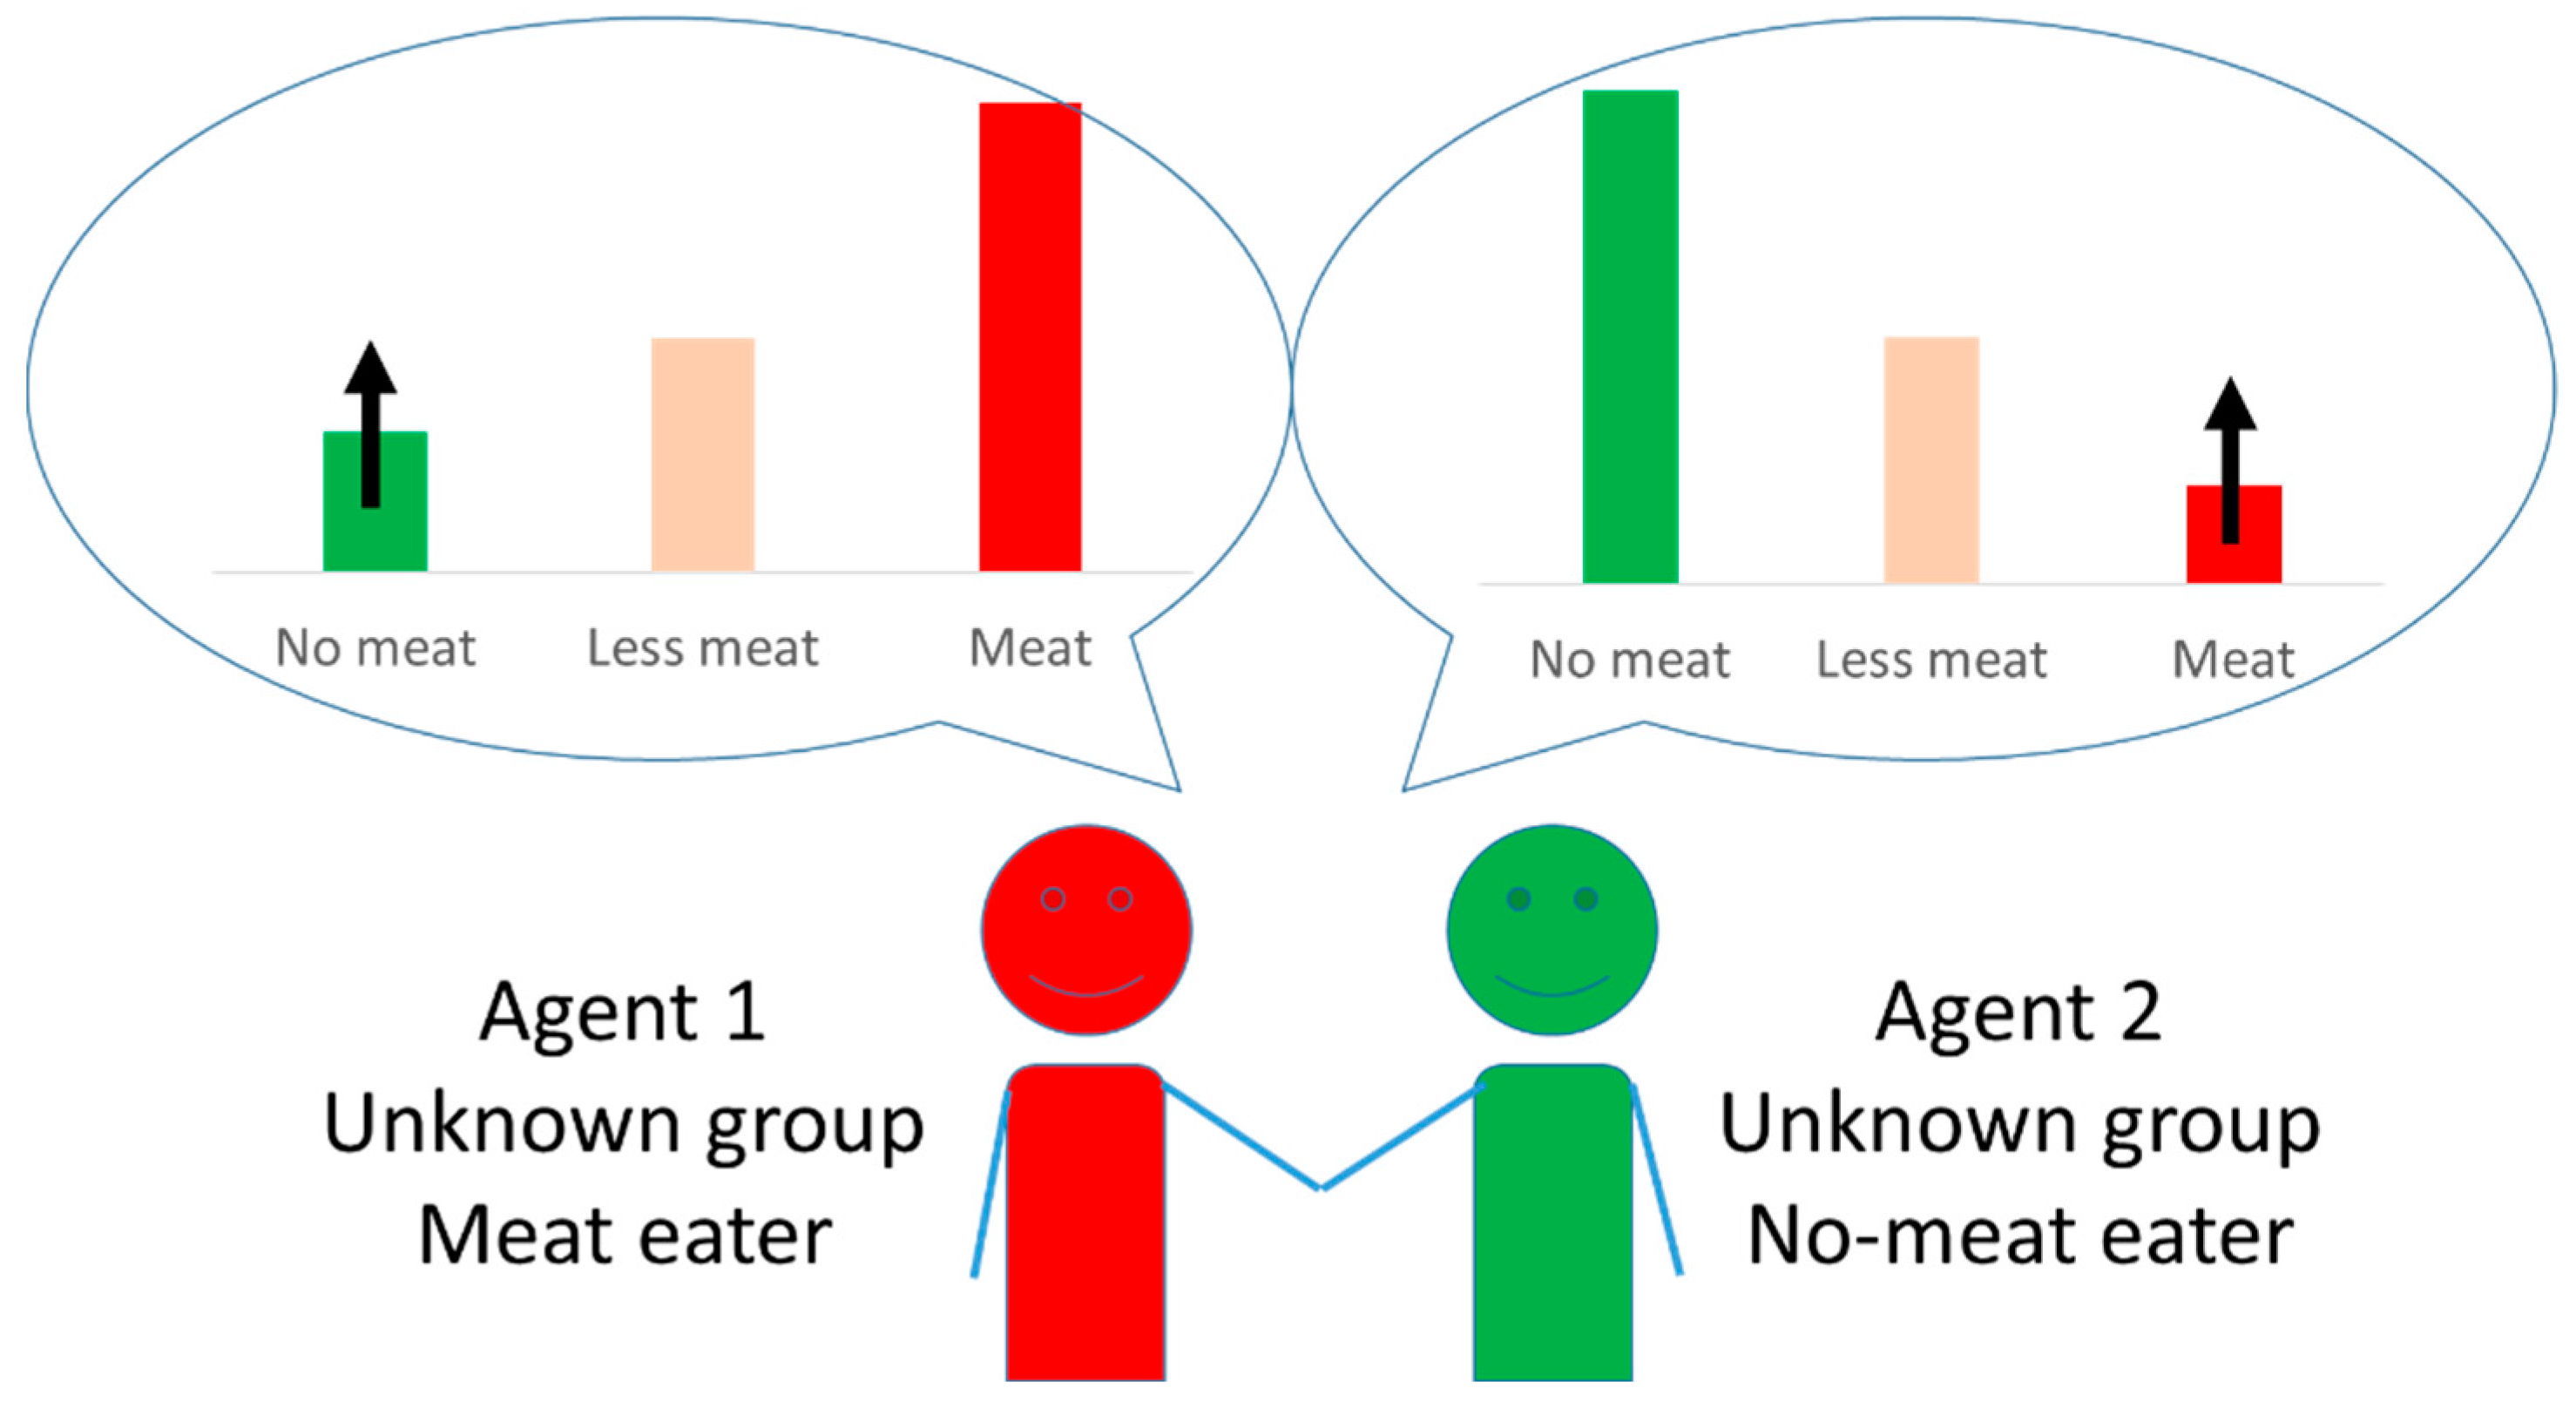
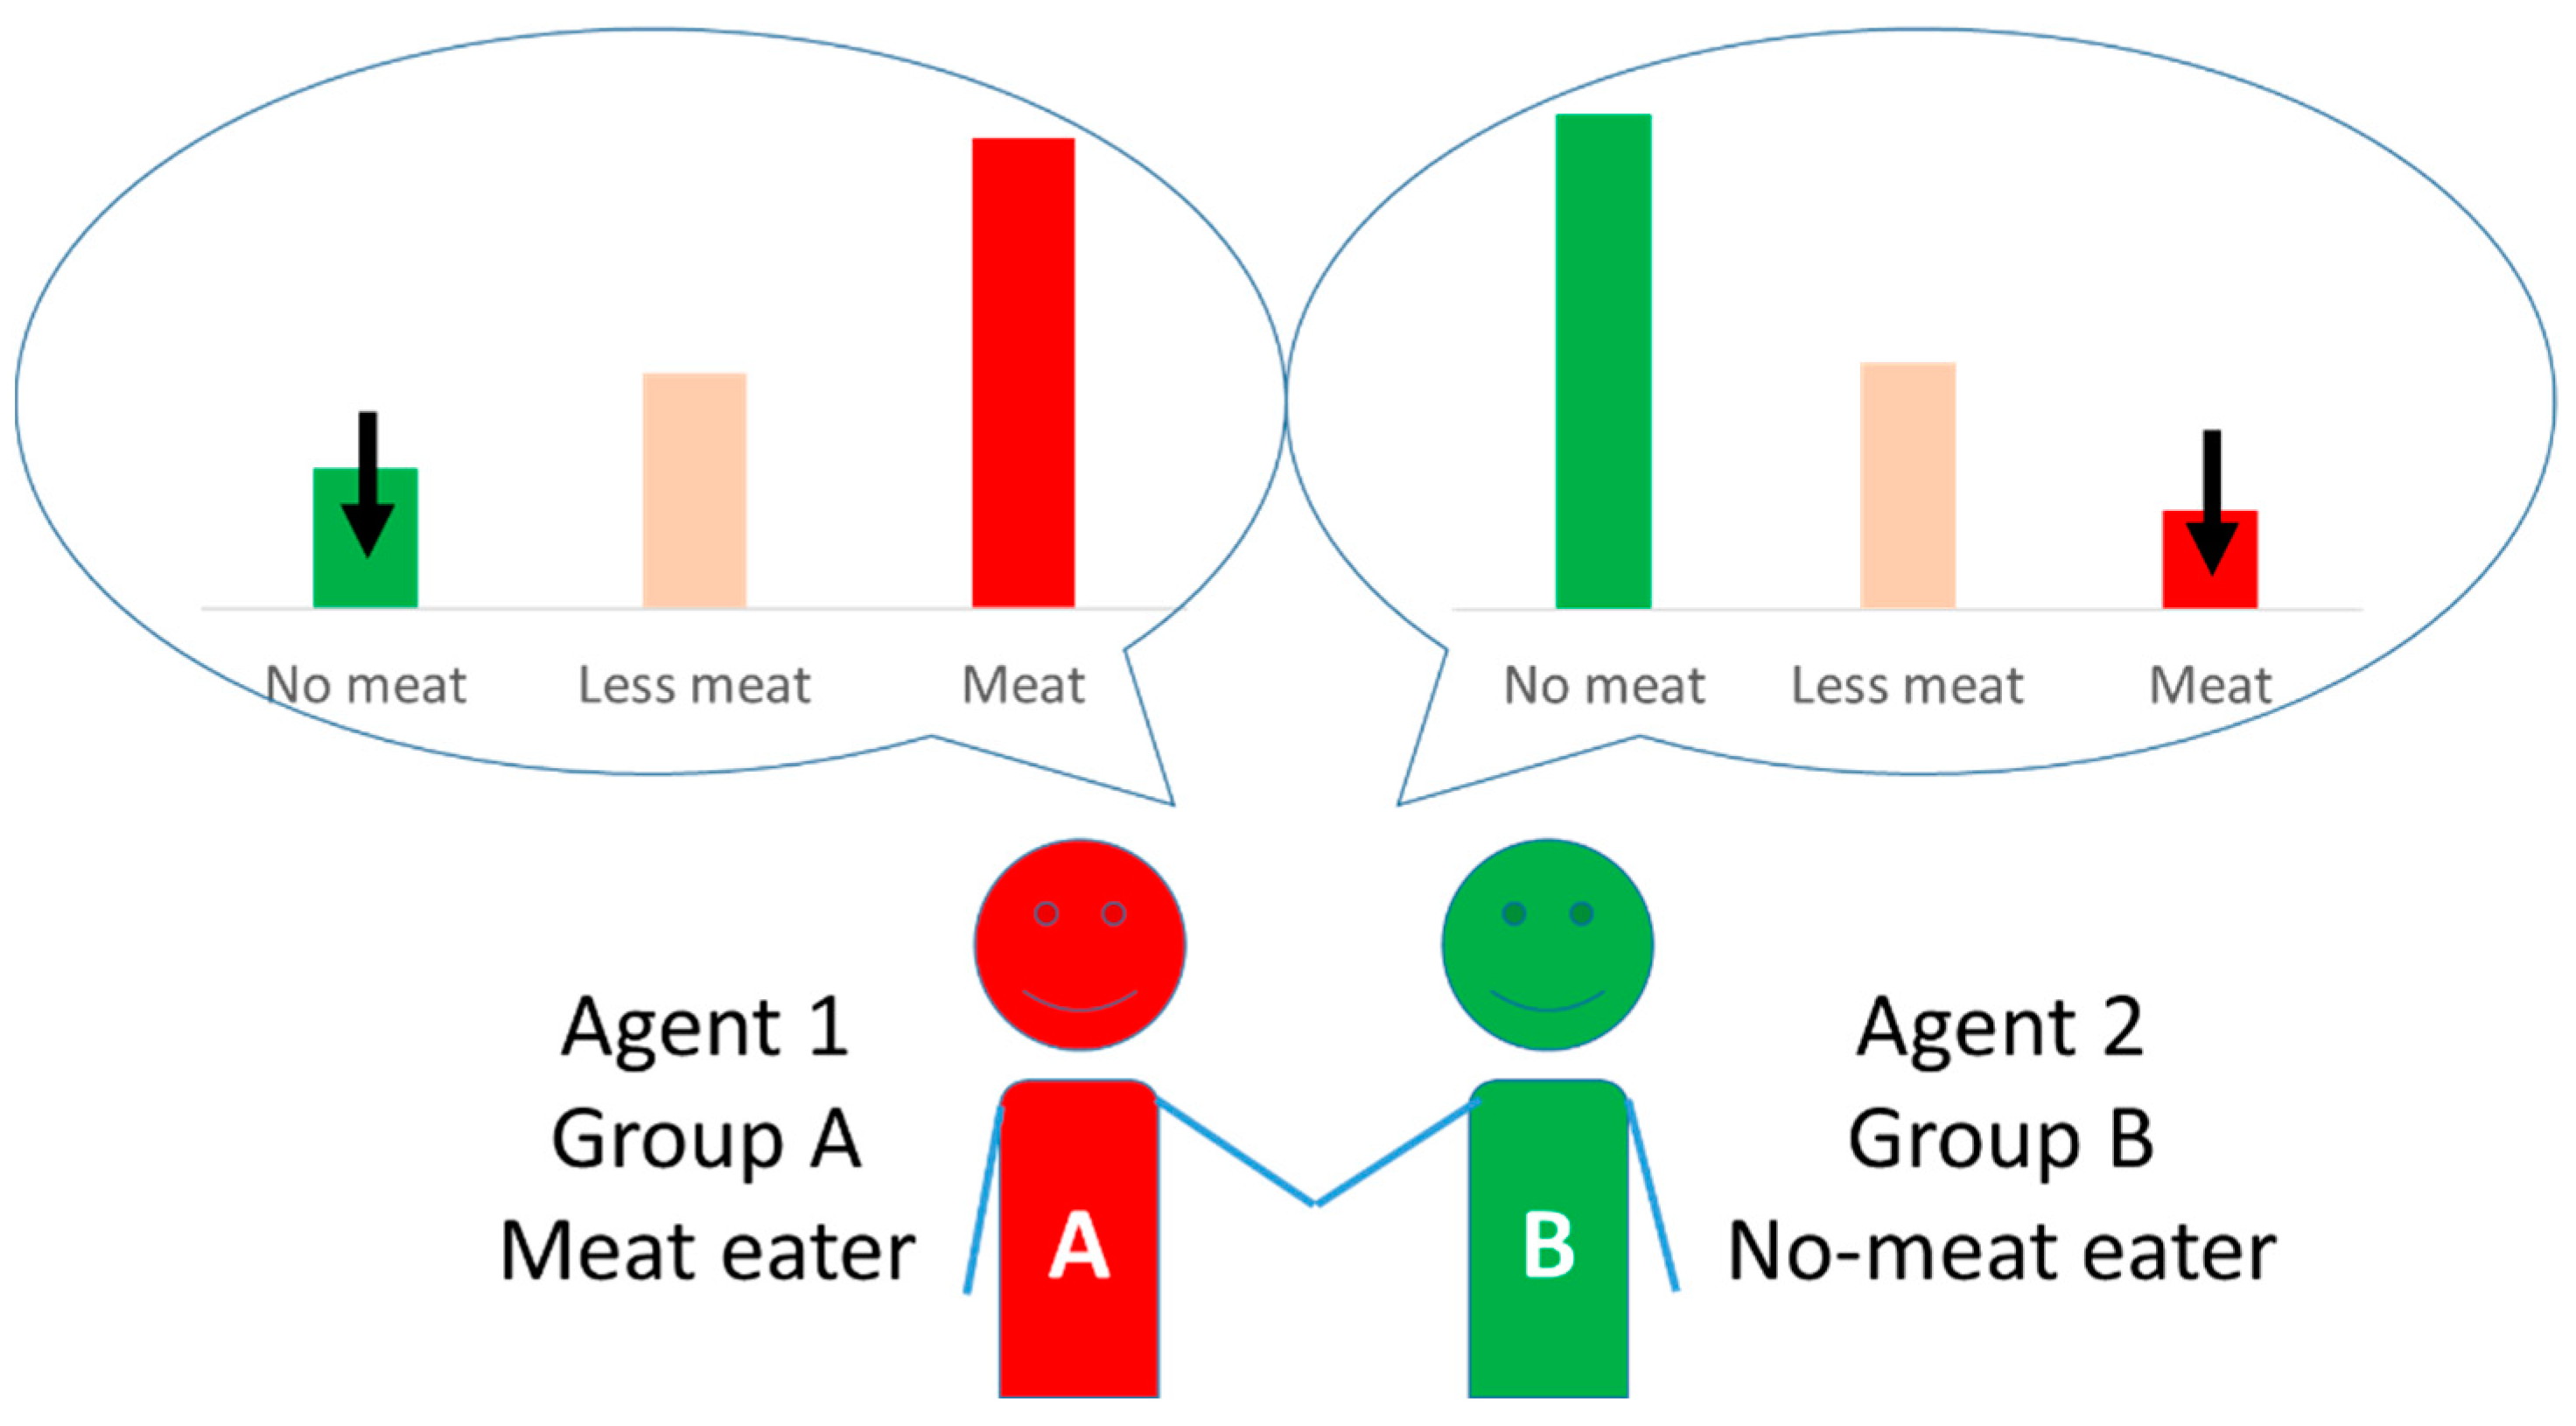
Whether in-person or online, peer influence is expected to be stronger if the peers are perceived to be ‘people like us’, which can happen on a variety of parameters (such as gender, race, body type, social class) [29]. Research has shown that social influence on eating behaviour is significantly enhanced if people are familiar with their eating companions, or if they perceive similarities with them in terms of gender, weight, or age [19,30,31]. Cruwys, Platow [32] found that when students have high levels of organisational identification with their university, they adjust their food intake to those from the same university, but not from a different one.
In addition, research found that people in different groups may differentiate from each other by abandoning a certain behaviour that is common in the other group [33]. For example, university students are found to consume less junk food if eating junk food is associated with an undesirable group [34]; minority participants are found to eat less healthily when healthy eating is perceived as the marker of the majority group [35].
Agent-based modelling (ABM) is a research method that simulates autonomous and interacting agents in a virtual environment on a computer. An advantage of ABM is that it explicitly represents the dynamic interactions among individuals. ABM has been used to simulate and understand the dynamics of social identity and to test the logical consequences of social theories [36,37,38]. It has also been applied in the areas of civil conflicts [39,40], crowd simulation [41], and natural resource management [42,43].
This study will investigate the impact of social influence on the consumption of meat and non-meat diets. We will focus on meat consumption partly because interest in non-meat diets has been growing rapidly across the world in recent years, and also because there is a wide consensus now that increased meat consumption is linked to higher health risks [2,6,7,8,9] and substantial environmental damage [44,45,46]. Using data from the 2014 British Social Attitude (BSA) Survey [47] and through the construction of an agent-based model, this study will enhance our understanding of the impact of social interactions and peer influence on the dynamics of the spread of various meat-eating behaviours.

2. The Agent-Based Model of Social Influence and Meat-Eating Behaviour

2.1. Agent and Attributes

An agent in the model represents a person. Table 1 lists the attributes of a Person agent.
  • Change tendency
Change tendency is a heterogeneous personal attribute that measures how likely a person is to change after being exposed to social interactions. Some people may have a lower tendency to change and will stick to their dietary choice despite the social interactions, whereas others may be more open to a change. The parameter ‘change tendency’ will capture this heterogeneous attribute among the agents. A higher change tendency means the agent is more likely to change after social interactions and vice versa.
The tendency to change will also depend on the current meat-eating behaviour of the agents. We assume that, on average, the change tendency for vegetarians is much lower than that for non-vegetarians. The reason is that in 2014 only approximately 5% of the population were vegetarians, according to the BSA Survey. Being such a small minority means that the vegetarians will inevitably have to be more determined to stick with their current eating behaviour despite being the small minority, or they will soon be converted to the majority after continuous exposure to and interaction with the rest of the population.
  • Social accounting
Each agent keeps a representation of what is referred to here as ‘social accounting’ (illustrated in Figure 1) of the level of social appeal associated with adopting one of the eating behaviours: to eat no meat (represented by colour green), less meat (pink), and meat (red). The agent will adopt the meat-eating behaviour that has the highest score or level of appeal. In the model, the initial levels of social accounting will be consistent with the agent’s current behaviour. Figure 1 is an example that illustrates an agent’s social accounting for different eating behaviour. In Figure 1, the behaviour with the highest score in the social accounting is to eat meat. As a result, the agent will choose to eat meat. The values for each behaviour in the social accounting will be updated in each period as the agents engage in different types of social interactions with each other, which will be detailed in the next section, ‘Section 2.2. Process: Four Types of Interactions’.

2.2. Process: Four Types of Peer Influence

2.2.1. In-Group Reinforcement: Same Group, Same Behaviour

The first type of social interaction, in-group reinforcement, occurs when two agents in the same group with the same eating behaviour meet. As demonstrated in Figure 2, both agent 1 and 2 belong to the same social group (group A) and have the same dietary behaviour (no-meat eater). Because the two agents are identified as in the same group and they have the same behaviour, their social accounting for their current behaviour (no-meat eater) will both increase. Hence their current meat-eating behaviour will be reinforced after the interaction.

2.2.2. In-Group Influence: Same Group, Different Behaviour

The second type of social interaction, in-group influence, occurs when two agents are in the same social identity group but have different eating behaviours. Because the agents identify each other as being in the same group, they will exert a positive influence on one another. As demonstrated in Figure 3, agent 1 is a meat eater and agent 2 is a no-meat eater, and both are in the social group A. Since both agents 1 and 2 are in the same social group, agent 1’s social accounting for no-meat eaters will increase after meeting agent 2; so will agent 2’s social accounting for meat-eaters after meeting agent 1. In-group influence will increase the social accounting score for different behaviour, making it slightly more appealing to the agent, although the change may not be enough to reach the behaviour-changing threshold.

2.2.3. Out-Group Reinforcement: Different Group, Different Behaviour

The third type of social interaction, out-group reinforcement, describes the process where two people in different social groups with different behaviours meet. As shown in Figure 4, agent 1 is a meat-eater who belongs to social group A, whereas agent 2 is a no-meat eater who belongs to social group B. Because they belong to different social groups, when agents 1 and 2 meet, both will lower the social accounting score for the behaviour of the other party after the interaction. Hence, agent 1’s score for no-meat eaters will decrease, and so will agent 2’s score for meat-eaters. This represents a process of ‘negative stereotyping’, i.e., that a behaviour performed by an out-group member makes it less appealing, which is documented in the literature as discussed previously [34,35]. Out-group reinforcement effect will reinforce the agent’s current behaviour by reducing the appeal of a different behaviour performed by an out-group member.

2.2.4. Out-Group Influence: Unknown Identity, Different Behaviour

Lastly, not all social interactions are driven by social groups or identities. In some social settings, the social group of the other person cannot be known or observed, in which case there will be out-group influence with unknown social groups. As shown in Figure 5, agents 1 and 2 do not know each other’s social groups. Agent 1 is a meat eater and agent 2 is a no-meat eater. After meeting agent 2, agent 1’s social accounting for no-meat eaters will increase, and vice versa. Under out-group influence with unknown social groups, a person’s social accounting for a certain behaviour increases after observing the behaviour of others, according to descriptive norms theory [48]. We also assume that out-group influence only happens among agents living in the same region, when they are more likely to mingle and observe each other’s eating behaviours.
Figure 6 summarises the four types of social interactions by meat-eating behaviour and social groups. When two people with the same behaviour and in the same group meet, they engage in in-group reinforcement (type I) and they are more rooted in their current behaviour after the interaction. When two people in the same social group with different eating behaviour meet, they exert in-group influence on each other, and they are more likely to change their current behaviour (type II). When two people in different social groups with different social behaviour meet, they exert (negative) reinforcement effect on each other, and become less likely to convert to the other’s behaviour (type III). Finally, when two people with different eating behaviours meet and do not know each other’s social groups, they exert a positive social influence on each other (type IV), although the level of influence is less than if they belonged to the same social group. Additionally, when two people in different social groups and with the same eating behaviour meet, their social accounting does not change after the interaction. In summary, both in-group and out-group influence promote changes in behaviour, while both in-group and out-group reinforcement promote the status quo.

3. Model Parameters

Table 2 lists the key parameters in the ABM.
  • Green bonus
Since there were so few vegetarians at the beginning (5% of the population according to the BSA survey 2014), the novelty and social impact of encountering a non-meat eater can be expected to be much larger. It may make someone realise for the first time that not eating meat is even an option. Research also shows that vegetarians and vegans are more vocal about their dietary choice and more proactive to promote it [49], which also serves to reinforce a sense of positive distinctiveness—an important aspect of group identification. Hence, in the model, we introduce the parameter ‘Green bonus’ to account for the additional influence from non-meat eaters compared with the other types. We will experiment with two levels of Green bonus: 1, meaning no additional influence and 4, meaning that no-meat eaters have four times the influence than meat- or reduced-meat eaters.

3.1. Stochasticity

The first source of stochasticity is the random encounter with the people. In each period, every person will meet another person chosen at random (either in the whole population or within the same region), with whom one of the four types of social interactions takes place. The random pairing of people introduces a high level of stochasticity into the model. The second source of stochasticity is the random draw of the heterogeneous person attribute tendency to change (green/red/pink), from a normal distribution, which will affect how likely it is that a person will change their dietary behaviour over time.

3.2. Input Data

3.2.1. The British Social Attitude Survey 2014

The British Social Attitude (BSA) survey [47] is an independent survey of the views and opinions of the British public on various matters. It has run every year since 1983 with an average sample of 3000 UK people aged 18 or over. Respondents are chosen based on random probability sampling, assuring that the results are representative of the British population. The questionnaire comprises two parts: a face-to-face interview and a self-completion part. Sponsored by the Vegetarian Society, in 2014 the survey included a set of questions on vegetarianism. It asks about people’s meat consumption behaviour as well as reasons for meat reduction or avoidance (e.g., health, animal welfare, environmental concerns). Interviews were mainly carried out between July and September 2014, with some additional interviews in October and November.
Based on the answers to the question ‘What best describes your eating habits concerning meat’, we identify three types of meat-eating behaviour: (1) those who have stopped eating meat (no-meat eaters), (2) those who eat meat but have reduced or are considering reducing the amount of meat (less-meat eaters), and (3) those who eat the same amount or more meat with no intention of reducing or stopping (meat-eaters). We also have data on the respondent’s socio-demographic attributes and attitudes about various social issues. After removing missing/incomplete data, we have a sample of 2187 respondents, which will be the basis for the analysis and the ABM.

3.2.2. Gender, Social Class, and Political Ideology

In the model, we will look at three types of social groups or identities: gender, social class, and political ideology. Although social groups can be fluid and primed by the environment (e.g., in a lab experiment), researchers have consistently found gender [50,51,52], social class [53,54], and political ideology [55,56,57] to be among the main factors in forming one’s social identity [58,59]. The results from a Logit regression confirm that gender, social class, and political ideology are significant factors determining the decision to eat meat, less meat, or no meat at all (full results in the Appendix A). The simulation results from the ABM are similar regardless of which social group is used in the model.
Table 3 shows the proportion of the sample who eat no-meat, reduced-meat, and meat by gender. It shows that the percentage of no-meat eaters in females is almost twice as high as in males. The percentage of reduced-meat eaters in females is also higher than that of males by 9.2%.
Table 4 shows the proportion of the sample who eat no meat, less meat, and meat by social class (profession), as defined in BSA. It shows that the percentage of no-meat eaters or reduced-meat eaters among skilled manual workers is much smaller than all the other groups. Since the differences among the other groups are insignificant, we combine the other groups into one group (called non-manual workers) to contrast with the group of skilled manual workers.
Figure 7 shows that people who support the Green Party are much more likely to be no-meat eaters or reduced-meat eaters than the rest of the population; additionally, people who support labour and liberal democratic parties are more likely to be no-meat eaters or reduced-meat eaters than those supporting conservative, UKIP, or other parties.
The tables and figures above show the percentages of people who eat no meat, less meat, and meat by gender, social class, and political party. The clear differences show that one’s dietary choice is strongly associated with these factors.

3.2.3. Regional Impact

There is also a strong regional impact. Figure 8 shows the percentages of the population that eat no meat, less meat, and meat by region. Some regions such as inner and outer London have significantly more reduced-meat eaters than others; some regions such as outer London and South West have more no-meat eaters than others; others such as Wales and Yorkshire have more meat eaters than others. In this study, we assume that identity-neutral social influence can only take place when two people meet face-to-face in the same region. Regional differences will thus determine whom an agent is likely to encounter in an identity-neutral way. In regions such as inner or outer London, the likelihood of encountering a no-meat or reduced-meat eater is much higher than in regions such as Wales and Yorkshire.

3.3. Experiment Design and Scheduling

Table 5 lists the parameter values in the ABM experiment design. We simulated 2187 agents, each representing a respondent in the survey (1-to-1 mapping from the survey). Each parameter combination was run 20 times with a different random seed in each simulation. Each run contained 120 steps, representing 120 months or 10 years in real-time. In each step, every agent encountered two people: one from any region whose social identity they know (identity-driven encounter), and one from their own region whose identity they do not know (identity-neutral encounter). The people an agent will encounter in every step will be chosen randomly and at random order. After all social encounters have taken place in each period, agents will update their meat-eating behaviour accordingly. They will change their behaviour if the score for a different eating behaviour in the social accounting exceeds the score for their current one. The aggregated number of agents who eat no meat, less meat, and meat in each region are recorded in each step.

4. Results

We will first show the regression results based on the full simulation data at the end of runs (last step), and then the time-series diagrams from selected parameter combinations. The diagrams for all the runs are available upon request. The dependent variable is the number of no-meat eaters from the simulation and the independent variables are the parameter values in the experiment design. The standard errors and p-values are based on model stochasticity, which should not be interpreted literally.
Table 6 shows the regression results of no-meat eaters. We see that higher tendencies to change in meat and less-meat eaters will lead to an increased number of no-meat eaters, which is as expected. Compared with social class (manual vs. non-manual workers), having gender or political party as their social identity will reduce the number of no-meat eaters. We also see that a stronger in-group and out-group influence will lead to an increased number of no-meat eaters, whereas stronger in-group and out-group reinforcement will lead to an increased number of no-meat eaters, which is as expected because influence will lead to change whereas reinforcement will lead to status quo. Finally, a stronger green bonus will lead to an increased number of no-meat eaters, which is again as expected.
Table 7 shows the regression results of meat-eaters (not including less-meat eaters). We see that a higher tendency to change in meat-eaters will lead to fewer meat-eaters, which is as expected. On the other hand, a higher tendency to change within reduced-meat eaters will lead to more meat-eaters, as some reduced-meat eaters become meat-eaters. Compared with social class (manual vs. non-manual workers), having gender or political party as social groups will increase the number of meat-eaters. We see that both in-group and out-group influences have a positive impact on the number of meat-eaters, though out-group influence has a much larger effect size than in-group influence. This is interesting as stronger influence also leads to an increased number of no-meat eaters (Table 6), indicating a squeeze on the reduced-meat eaters and more divergent/extreme behaviour (i.e., more meat or no-meat eaters, fewer reduced-meat eaters). Stronger in-group reinforcement will lead to more meat-eaters, as people conform to their groups and remain in the status quo. On the other hand, stronger out-group reinforcement will lead to less-meat eaters, as people avoid the behaviour of those not in their group. Finally, a stronger green bonus will lead to fewer meat-eaters, which is as expected.

4.1. The Impact of Social Influences

In this section, we will show the time series of the percentage of no-meat (green), reduced-meat (pink), and meat (red) eaters over the 120 steps in the run. We will also show the maximum and minimum values from the 20 runs.

4.2. Influence vs. Reinforcement

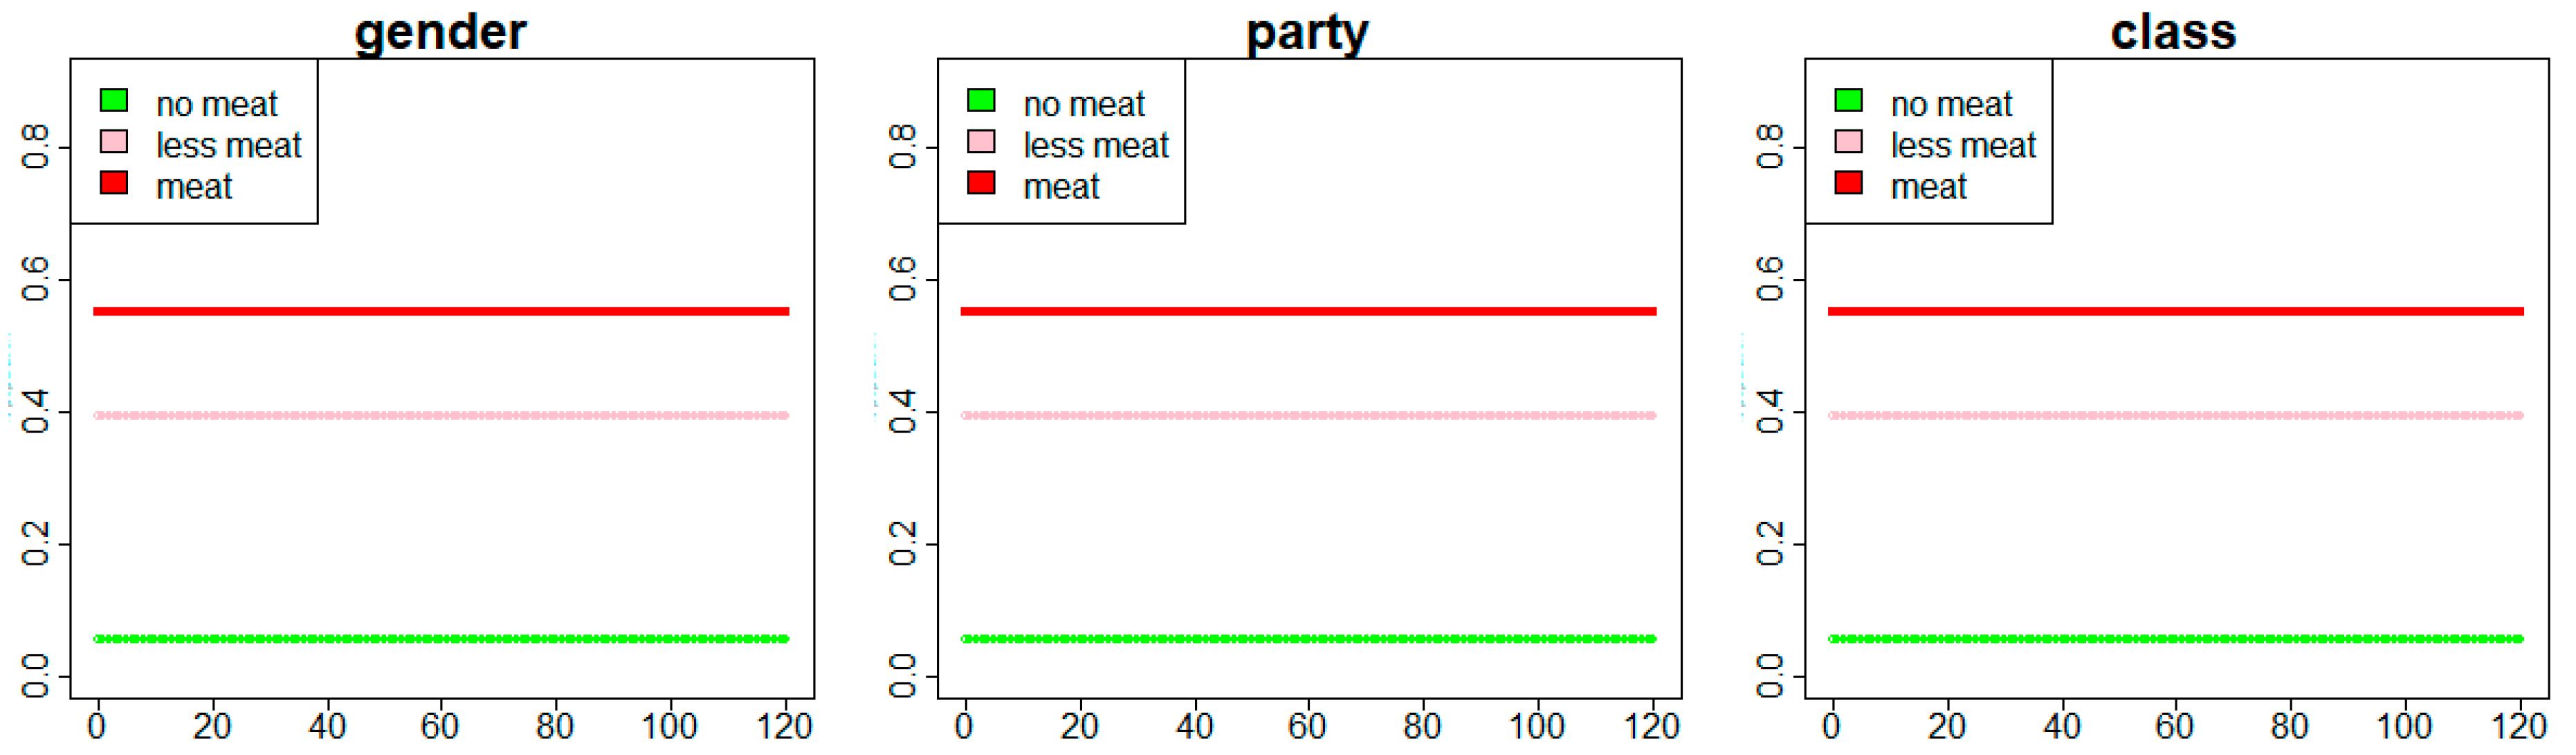
We will first look at the effects of influence and reinforcement effects. The former leads people to consider and possibly change to a different eating behaviour, whereas the latter reinforces their current behaviour, either because the in-group members share the same behaviour, or the out-group members have the opposite behaviour. Under weak influence and reinforcement, there is very little change (Figure 9), as is the case under the combination of weak influence and strong reinforcement (Figure 10), which is as expected because the reinforcement effect points to the status quo.
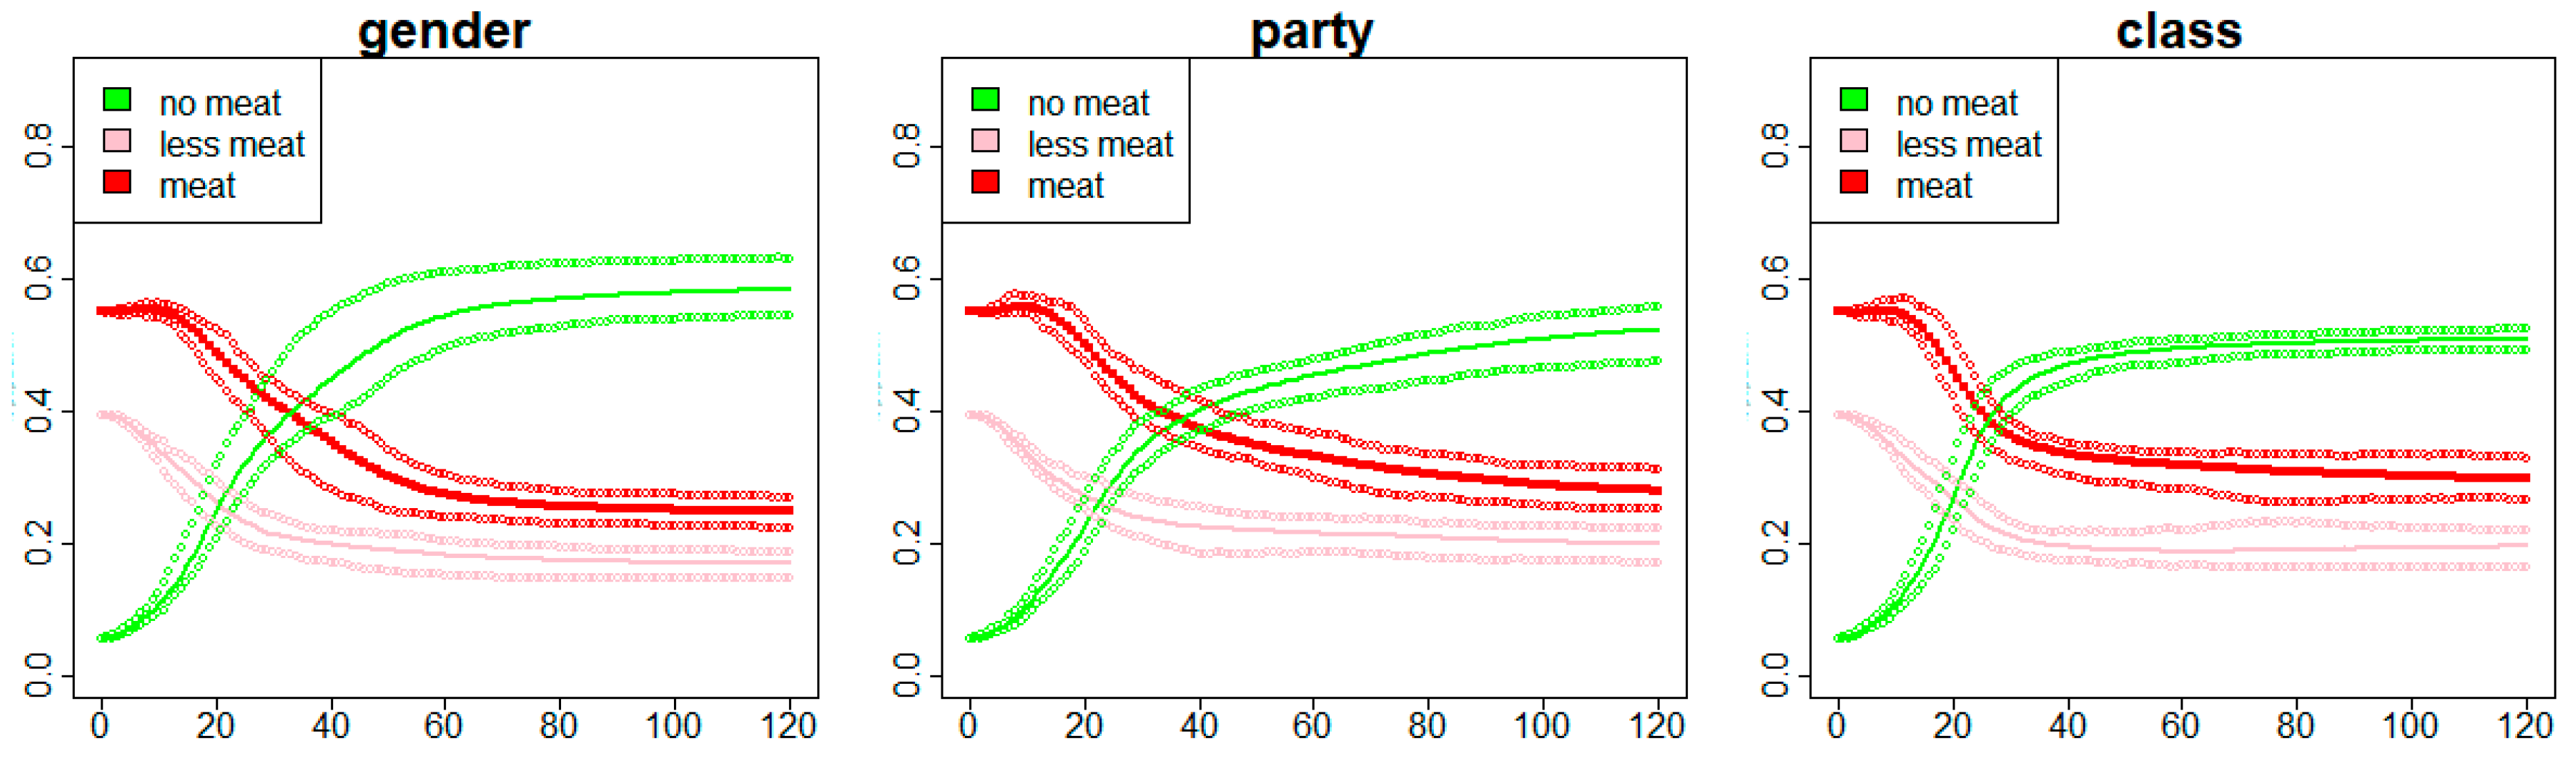
Figure 11 shows the effect of strong influence and weak reinforcement. Under the combination of strong influence and weak reinforcement, the percentage of people who eat no meat increases significantly, which is accompanied by a sharp decrease in the percentage of people who eat meat or less-meat. The change is more pronounced when gender is the social identity. In all cases, the percentage of vegetarians (green) rise from less than 10% to more than 40%, and the percentage of meat-eaters (red) declined from more than 55% to less than 40% over 10 years.
Furthermore, Figure 12 shows the effect of strong influence, weak in-group reinforcement, and strong out-group reinforcement. In-group reinforcement is the confirmation of current behaviour after seeing the same behaviour being performed by in-group members, whereas out-group reinforcement is the confirmation of the current behaviour after seeing the opposite behaviour being performed by out-group members. We see that the out-group reinforcement effect alone can significantly increase the percentage of no-meat eaters.
Figure 13 shows the effect of both strong influence and reinforcement. Interestingly, in the case of gender and political party as social identity, there is little change in the number of meat, reduced-meat, and no-meat eaters, as if the effects of influence and reinforcement are cancelled out. In the case of social class as the main social group, there is a large variance in the ensemble runs. In some runs, there is little change, whereas in other runs the percentage of no-meat eaters increases significantly. The large variance come from the internal stochasticity of the model, as people encounter randomly in each period. When social class is the main social group, the results are more sensitive to the stochasticity in the model and less robust.

4.3. In-Group vs. Out-Group

In this section, we will compare the effect of in-group vs. out-group. A strong in-group effect means that people are more affected by those with the same social group as them; whereas a strong out-group effect means that people are more affected by those in a different or unknown social group. Figure 14 shows the combination of strong in-group and weak out-group effects. It shows a significant rise in the percentage of no-meat eaters (green), accompanied by a significant decrease in reduced-meat eaters (pink). The number of meat-eaters (red) increases slightly or remains more or less the same. The strong in-group and weak out-group combination will make the population more polarised: the ‘middle’ group who eat less-meat declines, whereas the ‘extreme’ groups who eat meat and no meat increase, with the latter increasing more significantly than the former. Figure 15 shows the combination of weak in-group and strong out-group effects. There is no significant change in the percentage of meat, reduced-meat and no-meat eaters throughout the simulation. It shows that the out-group effect alone is insufficient to cause people to change their dietary behaviour.

4.4. Regional Differences

As we have shown before, there is a strong regional disparity in the percentage of meat, reduced-meat and no-meat eaters initially, as recorded in the BSA data (Figure 8). Some regions such as Inner and Outer London has significantly less-meat eaters than others such as Yorkshire and Wales. In this section, we will show the results at the end of the simulation, which is the average of the 20 ensemble runs. We will only show the results where there are significant changes to the initial levels. For the sake of space, we only show results for gender as the social identity. The results for political party and social class as the social identity are qualitatively similar, which are available upon request.
Figure 16, Figure 17 and Figure 18 shows the percentage of meat, reduced-meat and no-meat eaters in the 12 regions in the UK under different combinations of social influences. When influence is strong and reinforcement is weak (Figure 16), there is a sharp increase in the percentage of no-meat eaters across all regions. Moreover, the differences between regions in the number of meat-eaters and no-meat eaters become smaller. For example, initially, the percentage of meat-eaters in Inner London is about half of that in Yorkshire and Wales. At the end of the simulation, however, the difference is much smaller. Under the combination of strong influence and weak reinforcement, regions tend to become more similar, which is as expected as influence causes people to mimic each other, whereas reinforcement causes people to differentiate themselves.
Figure 17 shows the regional differences under strong influence, weak reinforcement in-group and strong reinforcement out-group. Although there are large increases in no-meat eaters as in Figure 16, the regional differences are persistent, which is the same when there is a strong in-group and weak out-group effect as shown in Figure 18. Interestingly, in all three cases, Outer London becomes the region with the least meat-eaters, which contrasts with the initial data that show Inner London to be the region with the least number of meat-eaters. The reason could be that Outer London has the largest percentage of no-meat eaters initially, who has a large influence on others and have converted more people in the region to no-meat eaters.

5. Discussion

The simulation results show that when the influence effect is weak there is very little change in the meat-eating behaviour at the population level, regardless of the reinforcement effect. However, it does not mean that peer influence is not present or working in those cases. Rather, it suggests that the system is very stable in the status quo. For example, when influence is weak and reinforcement is strong, a meat-eater may encounter another meat-eater who shares the same gender/social class/political party, and become even more rooted in her choice to eat meat. In most cases, we find that the system is stable with no significant changes. Large changes at the system level are rather the exceptions than the norm. It is consistent with general findings that behaviours are hard to change, since there exists inertia that resists change at both the system and individual levels [60,61]. Large-scale changes at the population level thus require cumulative micro behavioural changes over a long time.
The results show that a strong influence effect (which points to change) leads to more changes in the system, whereas a strong reinforcement effect (which points to status quo) leads to fewer changes, which is consistent with expectation. However, the ABM brings additional insights. It shows that to create significant changes, especially to increase the number of no-meat eaters, there needs to be at least a strong influence effect, as well as a weak in-group reinforcement effect. In other words, in order to bring about large-scale behavioural changes to the system, people need to (1) have a strong openness to the influence of both in-group and out-group members who have a different eating behaviour, and (2) have a weak tendency to reinforce their current behaviour after seeing other in-group members sharing the same behaviour. Out-group reinforcement, that is, avoiding the behaviour of out-group members (or negative stereotyping), has a smaller effect in preventing changes, although it will reduce the magnitude of change in the system. Although both the influence and reinforcement effects have been much studied and documented in the literature on ‘social identity’ (e.g., [16,35,42]), their interactions and joint effects on the system have not been investigated before.
When we compare in-group and out-group influence, we find that a strong in-group impact accompanied by a weak out-group impact will lead to large changes in the system, whereas the opposite will lead to a stable system with no change. The results emphasise the importance of in-group influence, i.e., influence from peers with the same social identity, in producing large-scale changes, which is consistent with general findings that people are more influenced by peers in the same group [32,57]. Influence from out-groups alone, as the model shows, is insufficient to cause significant changes at the system level.
The BSA data in 2014 displayed a large regional disparity: regions like inner and outer London have a much larger percentage of no-meat and reduced-meat eaters than regions like Yorkshire and Wales. In the simulations where large changes occur, the differences between regions are reduced to different degrees. Especially under strong influence and weak reinforcement, the differences between regions become much smaller at the end of the simulation than initially. In all cases, outer London surpasses inner London to become the region with the lowest percentage of meat-eaters and the highest percentage of no-meat eaters at the end of the simulation.
Although the model builds upon empirical data and produces future projections, we do not intend it to be a quantitative projection of the future, because many other factors will influence a person’s dietary choices and peer influence is only one of them. Nevertheless, the model can enhance our understanding of how peer influence affects behavioural changes at a population level. As has been shown in the paper, these changes are non-linear. The model can also shed light on how campaigners and policymakers can potentially leverage social influence factors in their appropriate contexts to promote desired behavioural changes, especially in the era of social media.
The model can be extended in several ways. First, the current model assumes that people encounter each other with a random possibility that depends only on the regions where they live. In reality, however, similar people are more likely to hang out with and thus influence each other. One extension can therefore be to incorporate a network structure among people and use it to determine the possibility that two people may encounter each other. This may dampen the magnitude of changes in the system and make it more stable in the status quo. Second, the model can be extended to have different social groups or identities under different contexts, which will make the model more flexible and reflect social interactions under different contexts more accurately. Third, the probability of encountering people in the simulation is fixed for every time step. This is an obvious simplification, and in the future, it would be useful to vary the number of encounters people have in a given time step, which may provide a simplified representation that could be considered as a proxy for ‘sociability’. Finally, in this study, we assume that people who eat less meat have the same level of openness to change to a different behaviour as people who eat meat. Yet they could be more open to vegetarianism than a meat-eater (if eating less meat is considered a first step towards eating no-meat), or less (if eating less meat is considered a substitute for eating no meat). More research will be needed to understand the motivation and behaviour of less-meat eaters.

6. Conclusions

The vegetarian lifestyle has been spreading at an exponential rate in the Western world recently. So far, its adoption has been very uneven among different social groups. For example, more than one in four people in generation Z in the UK do not eat meat, compared with around 5% among baby boomers. Women are significantly more likely to be vegetarians than men, and so are people who support the Green party, whereas skilled manual workers are much less likely to be vegetarians than people from other social classes.
In this study, we proposed four types of social influence mechanisms based on people’s meat-eating behaviour and their social groups. Using data from the British Social Attitude Survey, we developed an agent-based model to simulate the spread of various meat-eating behaviour among British people under social influence. We find that peer influence is a crucial determinant of how the system will evolve. In order to produce large-scale behavioural changes at the population level, people need to (1) have a strong openness to the influence of both in-group and out-group members with different dietary choices, and (2) have a weak tendency to reinforce their current behaviour after seeing their in-group members sharing the same behaviour. We also found that when vegetarianism increased, the initial regional disparities persisted, but outer London surpassed inner London to become the region with the most no-meat and less-meat eaters.
An individual’s decision to eat or not eat meat is not made in isolation. It reflects their overall lifestyle, beliefs, and the social groups to which they belong. Understanding how social influence affects one’s dietary choices will enhance our understanding of the social barriers preventing people from adopting a healthier and more sustainable diet (e.g., it is not what ‘we’ do), and help us predict future trends (e.g., how long will the recent growth trend continue, and at which level will it plateau?). This study will complement existing research that largely focusing on individual motivations such as health and environmental concerns, and inform policymakers and campaigners, enabling them to be more effective by considering social influences.

Author Contributions

Conceptualization, J.G., A.S. and T.C.; Data curation, A.S.; Formal analysis, J.G.; Funding acquisition, T.C.; Investigation, J.G., A.S. and T.C.; Methodology, J.G.; Writing—original draft, J.G.; Writing—review & editing, J.G., A.S. and T.C. All authors have read and agreed to the published version of the manuscript.

Funding

This research received no external funding.

Institutional Review Board Statement

Not applicable.

Informed Consent Statement

Not applicable.

Data Availability Statement

Data are available at https://osf.io/dfwn8/, accessed on 10 May 2022.

Conflicts of Interest

The authors declare no conflict of interest.

Appendix A

Table A1. Logit regression on whether to eat NO MEAT.
EstimateStd. Errorz ValuePr(>|z|)
(Intercept)−5.775131.33916−4.3120 ***
RAgeCat0.180840.070692.5580.01052 *
HEdQual32−0.22030.2794−0.7880.43042
HEdQual33−0.626640.32169−1.9480.05142
HEdQual34−0.392350.36477−1.0760.2821
HEdQual380.036410.830370.0440.96502
RaceOri320.181561.27340.1430.88662
RaceOri341.054211.354520.7780.4364
RaceOri350.736111.426570.5160.60586
RaceOri36−16.073172275.32515−0.0070.99436
RaceOri37−15.256293228.41894−0.0050.99623
RaceOri38−16.348491445.84988−0.0110.99098
RaceOri39−0.184210.95025−0.1940.84629
RaceOri3100.247011.113660.2220.82447
RaceOri311−16.01831774.67441−0.0090.9928
Religion2−0.06620.32254−0.2050.83737
Religion3−0.353030.40576−0.870.38428
Religion4−0.974320.3852−2.5290.01143 *
Religion5−16.171831910.69241−0.0080.99325
Religion6−0.648461.06222−0.610.54155
Religion70.479390.609790.7860.43178
Religion8−15.42742814.1365−0.0050.99563
Religion91.411271.275721.1060.26862
Religion10−15.593382875.74684−0.0050.99567
Religion110.908671.026370.8850.37598
Religion120.923311.497480.6170.53752
Religion131.522561.376291.1060.26861
Religion14−16.157222723.5154−0.0060.99527
Religion22−15.46466522.63863−0.0020.99811
Religion23−15.830563685.10282−0.0040.99657
Religion27−15.725461649.28606−0.010.99239
Religion972.563381.560841.6420.10053
MarStat20.61340.371121.6530.09836
MarStat30.386060.324241.1910.23378
MarStat40.183480.428620.4280.66859
MarStat50.797830.331112.410.01597 *
HHIncD0.012940.044950.2880.77353
manualTRUE−0.805280.41625−1.9350.05304
genderFemale0.586410.234642.4990.01245 *
partylabour1.019370.341062.9890.00280 **
partylibdem1.15080.463852.4810.01310 *
partyukip0.696560.457421.5230.12781
partygreen2.081740.506664.1090 ***
partyother0.916150.645261.420.15567
partynone1.135280.393742.8830.00393 **
partydk0.689220.483981.4240.15443
regionNW1.217630.769911.5820.11376
regionYorkshir0.953250.812541.1730.24073
regionEMD1.09910.830131.3240.1855
regionWMD0.678850.854370.7950.42687
regionSW1.773740.78932.2470.02462 *
regionEastern1.015580.803911.2630.20648
regionI London0.487590.963360.5060.61276
regionO London1.27360.82641.5410.12328
regionSE1.456040.766071.9010.05735
regionWales1.354050.81431.6630.09635
regionSCOT1.148260.816071.4070.15941
* 0.1, ** 0.05, *** 0.01.
Table A2. Logit regression on whether to eat LESS MEAT.
EstimateStd. Errorz ValuePr(>|z|)
(Intercept)−0.3296460.555223−0.5940.5527
RAgeCat0.2079940.0338626.1420 ***
HEdQual32−0.1792550.141098−1.270.2039
HEdQual33−0.3341360.149119−2.2410.0250 *
HEdQual34−0.1650620.175608−0.940.3472
HEdQual38−0.700930.427965−1.6380.1015
RaceOri32−1.016680.636159−1.5980.11
RaceOri34−0.3253330.726587−0.4480.6543
RaceOri35−1.6716061.21087−1.380.1674
RaceOri361.417881.0020651.4150.1571
RaceOri37−0.4621581.115533−0.4140.6787
RaceOri380.0291650.6542080.0450.9644
RaceOri39−1.0271060.444479−2.3110.0208 *
RaceOri310−0.238530.596376−0.40.6892
RaceOri311−0.4210690.74866−0.5620.5738
Religion20.0057640.158560.0360.971
Religion30.215640.172851.2480.2122
Religion4−0.0623150.133724−0.4660.6412
Religion50.3150160.6638460.4750.6351
Religion60.490830.4072421.2050.2281
Religion7−0.4761650.354245−1.3440.1789
Religion81.9820421.1554631.7150.0863
Religion9−0.580420.714159−0.8130.4164
Religion101.7294381.1332041.5260.127
Religion11−0.6817860.513148−1.3290.184
Religion12−1.1450051.085724−1.0550.2916
Religion13−0.4627941.260243−0.3670.7135
Religion1414.650574376.8323460.0390.969
Religion22−14.734058882.743413−0.0170.9867
Religion23−0.2734221.24119−0.220.8256
Religion270.4210790.5626820.7480.4543
Religion97−13.911665619.844427−0.0220.9821
MarStat2−0.158690.178131−0.8910.373
MarStat3−0.0478990.14792−0.3240.7461
MarStat4−0.3144240.184812−1.7010.0889
MarStat5−0.0723560.161312−0.4490.6538
HHIncD−0.0108290.021458−0.5050.6138
manualTRUE0.0649030.1363940.4760.6342
genderFemale0.485210.1036594.6810 ***
partylabour0.0937960.1337820.7010.4832
partylibdem0.0465770.2283440.2040.8384
partyukip0.0736720.1774510.4150.678
partygreen0.5303420.3180091.6680.0954
partyother0.1125450.3057780.3680.7128
partynone0.2358530.1681651.4030.1608
partydk0.150030.2000650.750.4533
regionNW−0.3276740.23363−1.4030.1608
regionYorkshire−0.365580.255692−1.430.1528
regionEMD−0.0787410.258788−0.3040.7609
regionWMD−0.1653460.256585−0.6440.5193
regionSW−0.362230.261322−1.3860.1657
regionEastern−0.2067650.247062−0.8370.4027
regionI London0.6519120.3305651.9720.0486 *
regionO London0.200040.2851520.7020.483
regionSE−0.0473920.230895−0.2050.8374
regionWales−0.5594640.277791−2.0140.0440 *
regionSCOT−0.172190.272738−0.6310.5278
* 0.05, *** 0.001.

References

  1. The Vegan Society. Changing Diets during the COVID-19 Pandemic. 2021. Available online: https://www.vegansociety.com/sites/default/files/uploads/downloads/Changing%20Diets%20During%20the%20Covid-19%20Pandemic.pdf (accessed on 10 May 2022).
  2. Clark, M.A.; Springmann, M.; Hill, J.; Tilman, D. Multiple health and environmental impacts of foods. Proc. Natl. Acad. Sci. USA 2019, 116, 23357–23362. [Google Scholar] [CrossRef] [PubMed] [Green Version]
  3. Clark, H.; Wu, H. The Sustainable Development Goals: 17 Goals to Transform Our World. In Furthering the Work of the United Nations; UN: New York, NY, USA, 2016. [Google Scholar]
  4. UK Government. A Green Future: Our 25 Year Plan to Improve the Environment; Department for Environment, Fisheries and Rural Affairs: London, UK, 2018. [Google Scholar]
  5. Opio, C.; Gerber, P.; Mottet, A.; Falcucci, A.; Tempio, G.; MacLeod, M.; Vellinga, T.; Henderson, B.; Steinfeld, H. Greenhouse Gas Emissions from Ruminant Supply Chains–A Global Life Cycle Assessment; Food and Agriculture Organization of the United Nations: Rome, Italy, 2013. [Google Scholar]
  6. Chong, E.W.-T.; Simpson, J.A.; Robman, L.D.; Hodge, A.; Aung, K.Z.; English, D.; Giles, G.; Guymer, R. Red meat and chicken consumption and its association with age-related macular degeneration. Am. J. Epidemiol. 2009, 169, 867–876. [Google Scholar] [CrossRef] [PubMed]
  7. World Cancer Research Fund/American Institute for Cancer Research. Diet, Nutrition, Physical Activity and Cancer: A Global Perspective. Continuous Update Project Expert Report. 2018. Available online: https://www.wcrf.org/wp-content/uploads/2021/02/Summary-of-Third-Expert-Report-2018.pdf (accessed on 10 May 2022).
  8. Chan, D.S.; Lau, R.; Aune, D.; Vieira, R.; Greenwood, D.C.; Kampman, E.; Norat, T. Red and processed meat and colorectal cancer incidence: Meta-analysis of prospective studies. PLoS ONE 2011, 6, e20456. [Google Scholar] [CrossRef] [PubMed] [Green Version]
  9. Lin, C.-L. Stroke and diets–A review. Tzu-Chi Med. J. 2021, 33, 238. [Google Scholar] [CrossRef]
  10. Clune, S.; Crossin, E.; Verghese, K. Systematic review of greenhouse gas emissions for different fresh food categories. J. Clean. Prod. 2017, 140, 766–783. [Google Scholar] [CrossRef] [Green Version]
  11. Aleksandrowicz, L.; Green, R.; Joy, E.J.M.; Smith, P.; Haines, A. The impacts of dietary change on greenhouse gas emissions, land use, water use, and health: A systematic review. PLoS ONE 2016, 11, e0165797. [Google Scholar] [CrossRef] [Green Version]
  12. Bianchi, F.; Dorsel, C.; Garnett, E.; Aveyard, P.; Jebb, S.A. Interventions targeting conscious determinants of human behaviour to reduce the demand for meat: A systematic review with qualitative comparative analysis. Int. J. Behav. Nutr. 2018, 15, 102. [Google Scholar] [CrossRef] [Green Version]
  13. Bianchi, F.; Garnett, E.; Dorsel, C.; Aveyard, P.; Jebb, S.A. Restructuring physical micro-environments to reduce the demand for meat: A systematic review and qualitative comparative analysis. Lancet Planet. Health 2018, 2, e384–e397. [Google Scholar] [CrossRef]
  14. Kim, Y.-H. Organic shoppers’ involvement in organic foods: Self and identity. Br. Food J. 2018, 121, 139–156. [Google Scholar] [CrossRef]
  15. DellaPosta, D.; Shi, Y.; Macy, M. Why do liberals drink lattes? Am. J. Sociol. 2015, 120, 1473–1511. [Google Scholar] [CrossRef]
  16. Plante, C.N.; Rosenfeld, D.L.; Plante, M.; Reysen, S. The role of social identity motivation in dietary attitudes and behaviors among vegetarians. Appetite 2019, 141, 104307. [Google Scholar] [CrossRef] [PubMed]
  17. Gossard, M.H.; York, R. Social structural influences on meat consumption. Hum. Ecol. Rev. 2003, 10, 1–9. [Google Scholar]
  18. Hopwood, C.J.; Bleidorn, W.; Schwaba, T.; Chen, S. Health, environmental, and animal rights motives for vegetarian eating. PLoS ONE 2020, 15, e0230609. [Google Scholar] [CrossRef] [Green Version]
  19. Cruwys, T.; Bevelander, K.E.; Hermans, R.C.J. Social modeling of eating: A review of when and why social influence affects food intake and choice. Appetite 2015, 86, 3–18. [Google Scholar] [CrossRef]
  20. Exline, J.J.; Zell, A.L.; Bratslavsky, E.; Hamilton, M.; Swenson, A. People-Pleasing Through Eating: Sociotropy Predicts Greater Eating in Response to Perceived Social Pressure. J. Soc. Clin. Psychol. 2012, 31, 169–193. [Google Scholar] [CrossRef]
  21. Hermans, R.C.J.; Engels, R.C.; Larsen, J.K.; Herman, C.P. Modeling of palatable food intake. The influence of quality of social interaction. Appetite 2009, 52, 801–804. [Google Scholar] [CrossRef]
  22. Iacoboni, M. Imitation, Empathy, and Mirror Neurons. Annu. Rev. Psychol. 2009, 60, 653–670. [Google Scholar] [CrossRef] [Green Version]
  23. Van Baaren, R.B.; Holland, R.W.; Kawakami, K.; Van Knippenberg, A. Mimicry and Prosocial Behavior. Psychol. Sci. 2004, 15, 71–74. [Google Scholar] [CrossRef]
  24. Einhorn, L. Normative Social Influence on Meat Consumption; MPIfG Discussion Paper; Max Planck Institute for the Study of Societies: Cologne, Germany, 2020. [Google Scholar]
  25. McPherson, M. A Blau space primer: Prolegomenon to an ecology of affiliation. Ind. Corp. Chang. 2004, 13, 263–280. [Google Scholar] [CrossRef]
  26. Weber, M. From Max Weber: Essays in Sociology; Routledge: London, UK, 2009. [Google Scholar]
  27. Holmgren, H. Plant-Based Diets on Social Media: How Content on Social Media Influence for Maintaining a Lifestyle. 2017. Available online: https://www.diva-portal.org/smash/get/diva2:1107865/FULLTEXT01.pdf (accessed on 10 May 2022).
  28. Faber, I.; Castellanos-Feijoó, N.A.; Van de Sompel, L.; Davydova, A.; Perez-Cueto, F.J. Attitudes and knowledge towards plant-based diets of young adults across four European countries. Exploratory survey. Appetite 2020, 145, 104498. [Google Scholar] [CrossRef]
  29. Turner, J.C.; Tajfel, H. The social identity theory of intergroup behavior. Psychol. Intergroup Relat. 1986, 5, 7–24. [Google Scholar]
  30. Hermans, R.C.J.; Larsen, J.K.; Herman, C.P.; Engels, R.C. Modeling of palatable food intake in female young adults. Effects of perceived body size. Appetite 2008, 51, 512–518. [Google Scholar] [CrossRef] [PubMed]
  31. McFerran, B.; Dahl, D.W.; Fitzsimons, G.J.; Morales, A.C. I’ll Have What She’s Having: Effects of Social Influence and Body Type on the Food Choices of Others. J. Consum. Res. 2010, 36, 915–929. [Google Scholar] [CrossRef] [Green Version]
  32. Cruwys, T.; Platow, M.J.; Angullia, S.A.; Chang, J.M.; Diler, S.E.; Kirchner, J.L.; Lentfer, C.E.; Lim, Y.J.; Quarisa, A.; Tor, V.W.; et al. Modeling of food intake is moderated by salient psychological group membership. Appetite 2012, 58, 754–757. [Google Scholar] [CrossRef]
  33. Berger, J.; Heath, C. Who drives divergence? Identity signaling, outgroup dissimilarity, and the abandonment of cultural tastes. J. Personal. Soc. Psychol. 2008, 95, 593–607. [Google Scholar] [CrossRef] [Green Version]
  34. Berger, J.; Rand, L. Shifting signals to help health: Using identity signaling to reduce risky health behaviors. J. Consum. Res. 2008, 35, 509–518. [Google Scholar] [CrossRef] [Green Version]
  35. Oyserman, D.; Fryberg, S.A.; Yoder, N. Identity-based motivation and health. J. Pers. Soc. Psychol. 2007, 93, 1011–1027. [Google Scholar] [CrossRef] [Green Version]
  36. Upal, M.A.; Gibbon, S. Agent-based system for simulating the dynamics of social identity beliefs. In SpringSim; ANSS: Canonsburg, PA, USA, 2015. [Google Scholar]
  37. Smaldino, P.E.; Calanchini, J.; Pickett, C.L. Theory development with agent-based models. Organ. Psychol. Rev. 2015, 5, 300–317. [Google Scholar] [CrossRef]
  38. Nan, N.; Johnston, E.W.; Olson, J.S.; Bos, N. Beyond being in the lab: Using multi-agent modeling to isolate competing hypotheses. In CHI’05 Extended Abstracts on Human Factors in Computing Systems; Association for Computing Machinery: New York, NY, USA, 2005. [Google Scholar]
  39. Rousseau, D.; van der Veen, A.M. The Emergence of a Shared Identity: An Agent-Based Computer Simulation of Idea Diffusion. J. Confl. Resolut. 2005, 49, 686–712. [Google Scholar] [CrossRef] [Green Version]
  40. Kustov, A. How ethnic structure affects civil conflict: A model of endogenous grievance. Confl. Manag. Peace Sci. 2017, 34, 660–679. [Google Scholar] [CrossRef]
  41. Moulin, B.; Larochelle, B. Crowdmags: Multi-agent geo-simulation of the interactions of a crowd and control forces. In Modelling, Simulation and Identification; Department of Computer Sciences and Software Engineering, Laval University: Quebec City, QC, Canada, 2010; pp. 213–237. [Google Scholar]
  42. Chabay, I.; Koch, L.; Martinez, G.; Scholz, G. Influence of narratives of vision and identity on collective behavior change. Sustainability 2019, 11, 5680. [Google Scholar] [CrossRef] [Green Version]
  43. Valkering, P.; Tabara, D.; Wallman, P.; Offermans, A. Modelling cultural and behavioural change in water management: An integrated, agent based, gaming approach. Integr. Assess. J. 2009, 9. Available online: https://journals.lib.sfu.ca/index.php/iaj/article/view/2746 (accessed on 10 May 2022).
  44. Godfray, H.C.J.; Aveyard, P.; Garnett, T.; Hall, J.W.; Key, T.J.; Lorimer, J.; Pierrehumbert, R.T.; Scarborough, P.; Springmann, M.; Jebb, S.A. Meat consumption, health, and the environment. Science 2018, 361, eaam5324. [Google Scholar]
  45. Willett, W.; Rockström, J.; Loken, B.; Springmann, M.; Lang, T.; Vermeulen, S.; Garnett, T.; Tilman, D.; DeClerck, F.; Wood, A.; et al. Food in the Anthropocene: The EAT–Lancet Commission on healthy diets from sustainable food systems. Lancet 2019, 393, 447–492. [Google Scholar] [PubMed]
  46. Hallström, E.; Carlsson-Kanyama, A.; Börjesson, P. Environmental impact of dietary change: A systematic review. J. Clean. Prod. 2015, 91, 1–11. [Google Scholar] [CrossRef]
  47. Natcen Social Research. British Social Attitudes Survey, 2nd ed.; UK Data Archive: Colchester, UK, 2016. [Google Scholar]
  48. Cialdini, R.B.; Reno, R.R.; Kallgren, C.A. A focus theory of normative conduct: Recycling the concept of norms to reduce littering in public places. J. Personal. Soc. Psychol. Q. 1990, 58, 1015. [Google Scholar] [CrossRef]
  49. Rosenfeld, D.L. The psychology of vegetarianism: Recent advances and future directions. Appetite 2018, 131, 125–138. [Google Scholar]
  50. Wood, W.; Eagly, A.H. Two traditions of research on gender identity. Sex Roles 2015, 73, 461–473. [Google Scholar] [CrossRef]
  51. Bussey, K. Gender identity development. In Handbook of Identity Theory and Research; Springer: Berlin/Heidelberg, Germany, 2011; pp. 603–628. [Google Scholar]
  52. Hofstede, G.J.; Dignum, F.; Prada, R.; Student, J.; Vanhée, L. Gender differences: The role of nature, nurture, social identity and self-organization. In International Workshop on Multi-Agent Systems and Agent-Based Simulation; Springer: Berlin/Heidelberg, Germany, 2014. [Google Scholar]
  53. Shayo, M. A model of social identity with an application to political economy: Nation, class, and redistribution. Am. Political Sci. Rev. 2009, 103, 147–174. [Google Scholar] [CrossRef] [Green Version]
  54. Aries, E.; Seider, M. The role of social class in the formation of identity: A study of public and elite private college students. J. Soc. Psychol. 2007, 147, 137–157. [Google Scholar]
  55. Greene, S. Social identity theory and party identification. Soc. Sci. Q. 2004, 85, 136–153. [Google Scholar] [CrossRef]
  56. Abramowitz, A.I.; Saunders, K.L. Exploring the bases of partisanship in the American electorate: Social identity vs. ideology. Political Res. Q. 2006, 59, 175–187. [Google Scholar] [CrossRef]
  57. Devine, C. Ideological social identity: Psychological attachment to ideological in-groups as a political phenomenon and a behavioral influence. Political Behav. 2015, 37, 509–535. [Google Scholar] [CrossRef]
  58. Stets, J.E.; Burke, P.J. Identity theory and social identity theory. Soc. Psychol. Q. 2000, 63, 224–237. [Google Scholar] [CrossRef] [Green Version]
  59. Robinson, J.A. Social identity, inequality and conflict. In Conflict and Governance; Springer: Berlin/Heidelberg, Germany, 2003; pp. 7–21. [Google Scholar]
  60. Polites, G.L.; Karahanna, E. Shackled to the status quo: The inhibiting effects of incumbent system habit, switching costs, and inertia on new system acceptance. MIS Q. 2012, 36, 21–42. [Google Scholar] [CrossRef] [Green Version]
  61. Barnes, W.; Gartland, M.; Stack, M. Old habits die hard: Path dependency and behavioral lock-in. J. Econ. Issues 2004, 38, 371–377. [Google Scholar] [CrossRef]
Figure 1. An agent’s social accounting for different meat consumption behaviour.
Sustainability 14 07935 g001
Figure 2. Social accounting for in-group reinforcement: Same group, same behaviour.
Sustainability 14 07935 g002
Figure 3. Social accounting for in-group influence: Same identity, different behaviour.
Sustainability 14 07935 g003
Figure 4. Social accounting for out-group reinforcement: Different identity, different behaviour.
Sustainability 14 07935 g004
Figure 5. Social accounting for out-group influence: Unknown identity, different behaviour.
Sustainability 14 07935 g005
Figure 6. Four types of social interactions: in-group reinforcement (I), in-group influence (II), out-group reinforcement (III), and out-group influence with unknown identity (IV).
Sustainability 14 07935 g006
Figure 7. Percentage of population that eats no meat, less meat, and meat by political party.
Sustainability 14 07935 g007
Figure 8. Percentage of population that eats no meat, less meat, and meat by region.
Sustainability 14 07935 g008
Figure 9. Weak influence, weak reinforcement.
Sustainability 14 07935 g009
Figure 10. Weak influence, strong reinforcement.
Sustainability 14 07935 g010
Figure 11. Strong influence, weak reinforcement.
Sustainability 14 07935 g011
Figure 12. Strong influence, weak in-group reinforcement, and strong out-group reinforcement.
Sustainability 14 07935 g012
Figure 13. Strong influence, strong reinforcement.
Sustainability 14 07935 g013
Figure 14. Strong in-group, weak out-group.
Sustainability 14 07935 g014
Figure 15. Weak in-group, strong out-group.
Sustainability 14 07935 g015
Figure 16. Regional differences under strong influence and weak reinforcement.
Sustainability 14 07935 g016
Figure 17. Regional differences with strong influence, weak reinforcement in-group and strong reinforcement out-group.
Sustainability 14 07935 g017
Figure 18. Regional differences with strong in-group and weak out-group.
Sustainability 14 07935 g018
Table 1. Main agent attributes.
AttributeType/ValueData Source Endogenous?Dynamic?
Serial numberString BSAN N
AgeintegerBSAN N
Region12 region in the UKBSAN N
Gender [Male, Female]BSAN N
Social Class[Manual, non-manual]BSAN N
Political Party [conservative, labour, libdem, ukip, green, other, none, dk]BSAN N
Meat habit[no meat, less meat, meat]Initialised with BSA, updated each period Y Y
Change tendency *between 0 and 1 Heterogeneous parameter NN
Social accounting *A list of three numbers between 0 and 1 for the three meat habits Updated each periodYY
* more details below.
Table 2. ABM parameters.
Parameter Description Value Range
Mean change tendency greenMean change tendency for non-meat eaters (more details below)[0, 1]
Mean change tendency pinkMean change tendency for reduced-meat eaters (more details below)[0, 1]
Mean change tendency redMean change tendency for meat eaters (more details below)[0, 1]
Social Identity Type of social identityGender, Party, Class
Mean weight identityStrength of identity-driven interactions (with respect to identity-neutral one)[0, 1]
In-group influence Strength of type 1 interaction[0, 1]
In-group reinforcementStrength of type 2 interaction[0, 1]
Out-group influence Strength of type 3 interaction[0, 1]
Out-group reinforcementStrength of type 4 interaction[0, 1]
Green bonus *Additional influence of non-meat eaters w.r.t meat eaters (more details below)[1, ] (1 = no Green bonus)
* more details below.
Table 3. Percentage of population that eat no meat, less meat, and meat by gender.
No MeatLess MeatMeat
Male0.0370.3420.621
Female0.0690.4340.497
Table 4. Percentage of population that eats no meat, less meat, and meat by social class *.
No-MeatLess-MeatMeat
professional0.0560.4030.540
manag/tech0.0690.4140.517
skilled non-manual0.0540.3980.549
skilled manual0.0200.3680.611
partly skilled0.0570.3510.591
unskilled0.0670.4000.533
* ‘skilled manual’ group highlighted to stress the difference from the other groups.
Table 5. ABM experiment design.
ParameterValue(s)
Change tendency—less meatLow (0.1), High (0.2)
Change tendency—meatLow (0.1), High (0.2)
Social Identity Gender, Party, Class
Social identity strengthWeak (0.1), Strong (0.9)
In-group influence strengthWeak (0.1), Strong (0.9)
In-group reinforcement strengthWeak (0.1), Strong (0.9)
Out-group influence strengthWeak (0.1), Strong (0.9)
Out-group reinforcement strengthWeak (0.1), Strong (0.9)
Green bonusWeak (1), Strong (4)
Table 6. Regression results on the number of NO-MEAT eaters.
EstimateStd. Errort ValuePr(>|t|)
(Intercept)−77.637.06−11.000
change.tendency.meat301.4125.1212.000
change.tendency.less.meat262.8025.1210.460
social.identity.gender−11.513.08−3.740.000185
social.identity.party−18.883.08−6.140
mean.weight.id104.383.1433.240
influence.in.group130.313.1441.500
influence.out.group20.213.146.440
reinforce.in.group−103.733.14−33.040
reinforce.out.group−5.853.14−1.860.063
green.bonus41.010.8448.980
Table 7. Regression results on the number of MEAT eaters (not including less-meat eaters).
EstimateStd. Errort ValuePr(>|t|)
(Intercept)1232.046.91178.310
change.tendency.meat−609.6124.59−24.790
change.tendency.less.meat750.8724.5930.540
social.identity.gender2.893.010.960.337
social.identity.party13.903.014.620
mean.weight.id−218.293.07−71.030
influence.in.group10.323.073.360.001
influence.out.group171.763.0755.890
reinforce.in.group97.443.0731.700
reinforce.out.group−70.783.07−23.030
green.bonus−21.850.82−26.660
Publisher’s Note: MDPI stays neutral with regard to jurisdictional claims in published maps and institutional affiliations.

