1. Introduction
The study area of this paper is the Shanghai–Yangshan Port waterway. Shanghai Yangshan Deepwater Port is an important part of the construction of the Shanghai International Shipping Center. Since its construction and operation, Yangshan Deepwater Port has been one of the busiest ports in the world, and its throughput has been increasing year by year, comprising an important part of Shanghai’s plan to build an international shipping center. After years of leapfrogging development, it has developed into an international container hub port. Yangshan Deepwater Port is located at the intersection of the mouth of the Yangtze River and Hangzhou Bay, bordering the mouth of the Yangtze River in the north, the Huangze Ocean in the east, and the Zhoushan Islands in the south, with a superior geographical location and good water depth conditions. However, the port area and the nearby waters are prone to bad weather. In particular, the annual average number of pilotage suspensions by heavy winds and waves is 11.9 times, which has a serious impact on the production of the port.
Related data show that maritime trade accounted for more than 80% of global trade volume and 70% of value in 2017, and grew by another 4% in 2018. According to UNCTAD’s projections, maritime trade is expected to expand at an annual rate of 3.8% from 2018 to 2023 [
1]. With the vigorous development of the global trade and shipping industry, for most of the better developed ports, the number of ships entering and leaving ports has gradually increased, the number and scale of ports has increased, the number of ship-piloting tasks has increased, and the risks of piloting have increased. As a key link in water transportation, ship pilotage refers to a specialized practitioner (pilot) boarding a ship in a certain water area (port or inland river), guiding the ship’s course, and bringing the ship safely into, out of, or moving it to a berth in the port. Since the channel conditions of a port constitute a natural barrier to a country’s national defense, it is internationally accepted that the pilot must be a national, therefore a national’s pilotage is mandatory for foreign vessels entering or leaving the port. This is a manifestation of a country’s right of pilotage and is part of national sovereignty [
2]. It can be seen that ship pilotage bears the important responsibility of safeguarding national sovereignty and plays an active role in ensuring the safety of ship navigation, maintaining port order and cleaning up the water environment. However, the interruption of pilotage caused by extreme weather forces ships to wait at anchorages or in open seas. This not only reduces the efficiency of port operations but also causes ships to bear unnecessary additional costs, and even poses a certain adverse threat to the healthy development of the shipping industry. In order to improve the efficiency of ships entering and leaving the port and to ensure the safety of ships, it is necessary to explore the law of interruption of pilotage [
3].
As the density of ships grows ever higher, piloting in busy waterways constitutes a great risk. The process of ship pilotage is a dynamic Markov process, which needs to be considered comprehensively according to the characteristics of the port area and ship conditions. This research provides basic features for the risk control of ship pilotage [
4].
Scholars Mikulikh, etc. [
5] elaborated on the Formal Safety Assessment (FSA) methodology, which is mainly used to assess the risks of maritime navigation and is also widely used to assess pilot safety. It aims to develop a risk assessment model. The goal of the FSA is to develop a framework of safety requirements in which risks are addressed in a comprehensive and cost-effective manner. Scholars Fang Q, etc. [
6] used FSA to do a comprehensive analysis and assessment of ship pilotage risk. A new exploration on how to ensure the safe pilotage operation of ships in restricted waters was conducted. A risk assessment model based on the influence factors of hazard sources was proposed. The results of the quantitative assessment of the risks associated with the influencing factors are discussed in the context of the specific situation of the causes of ship pilotage accidents, using the model. Scholars Geoffrey R, Hosack G R, etc. [
7] used a Bayesian generalized linear model to construct an analytical method of prior probability distribution based on the possible collision risk during the pilotage of ships in Australian territorial waters, and proposed recommendations and measures for risk control. Scholars Birnur Özbaş, etc. [
8] developed a comprehensive risk simulation model for maritime traffic in the Istanbul Strait by considering traffic rules, vessel profiles, pilotage services, meteorology, geographical conditions and vessel scheduling. Risk assessment was performed by incorporating a probabilistic accident risk model into the simulation model to determine the baseline level of risk. A comprehensive scenario analysis was conducted with the aim of reducing the risk of mitigating maritime traffic in the Istanbul Strait. Scholars Trucco, etc. [
9] developed a ship collision risk assessment model based on Bayesian network inference according to the integrated safety assessment recommendations of the International Maritime Organization (IMO), combined with the impact on maritime traffic safety under severe weather. The innovation of the article is to incorporate Human and Organizational Factors (HOF) into the risk analysis. The paper proposes a model and a comprehensive approach based on Fault Tree Analysis (FTA) and Bayesian Belief Network (BBN) to integrate HOF within a risk analysis study. The Maritime Research Institute Netherlands [
10] developed a risk indicator-based ship safety assessment model. Scholar Szlapczynski [
11] studied the safe navigation planning of ships in bad weather using evolutionary algorithms. The proposed method uses Evolutionary Algorithms (EA) to find an optimal set of safe tracks for all ships involved in the encounter. The paper contains sample results of computer simulation tests carried out for ship encounters in restricted visibility in both open and restricted waters. They confirm the effectiveness of the chosen approach and suggest that the method could be applied in on-board decision support systems. Scholars Lehikoinen et al. [
12] analyze the probability of ship accidents and the modeling of the results. They developed a probabilistic risk assessment application that considers the likely future development of maritime traffic and oil transportation in the area and the resulting risk of environmental pollution. This metamodel is used to compare the effects of two preventative management actions on the tanker collision probabilities and the consequent risk. The resulting risk is evaluated from four different perspectives. Bayesian networks enable large amounts of information about causalities to be integrated and utilized in probabilistic inference. Scholars Silveira P. et al. [
13] studied the maritime traffic off the coast of Portugal. The article describes the maritime traffic off the Portuguese coast through the analysis of AIS information and statistical analysis of vessels in the Traffic Separation Scheme (TSS). An algorithm was developed to assess the risk profile and the relative importance of the routes associated with the ports. Scholars Bing Wu et al. [
14] modeled the collision consequences in the downstream of Yangtze River using Bayesian Networks, considering the causation factors and including a novel approach for the emergency management of maritime accidents. Scholars Zhang D et al. [
15] used the FSA concept and Bayesian network (BN) technique to estimate the navigational risk of the Yangtze River. In terms of the risk matrix approach, a navigational risk model is developed by considering the probability and consequences of accidents. The application of the proposed model is then demonstrated by scenario analysis. Scholars Serdar Kum et al.. [
16] investigate the marine accidents and incidents recorded by the Marine Accident Investigation Branch (MAIB) that occurred north of 66°33′ (Arctic region) between 1993 and 2011, and proposed a Root Cause Analysis (RCA) to clarify reasons in order to prevent future events. The article constructs a fault tree for collision and grounding in the Arctic region. Fuzzy Fault Tree Analysis (FFTA) is applied to this problem in order to propose a recommendation to reduce the occurrence probabilities. Scholars Radon AN, Wang K, etc. [
17] performed a statistical analysis of maritime accidents. The article points out that in many cases, anomalous ships in terms of kinematic data may be perfectly normal and legitimate if the “context” of the ship at the time (e.g., weather and ocean conditions) is taken into account. The article also proposes a novel anomalous vessel detection framework that utilizes such contextual information to reduce false alarms through “contextual verification.” Scholars Goerlandt and Kujala [
18] suggest that the use of non-critical events as the basis for navigational risk analysis may lead to unreliable results. Therefore, in order to study the safety of navigation in specific sea areas, a larger database should be established and statistical analysis should be performed based on the relevant database. Scholars SG Han et al. [
19] identified the risks of the pilotage of large ships in and out of Guangzhou port from four aspects: human–vessel–management–environment, that is, based on personnel factors, ship factors, navigational environment, and management factors, and proposed corresponding risk mitigation suggestions and countermeasures according to the risk situation, providing theoretical basis and safety guarantees for the pilotage of large ships in and out of the port. Scholars Zhang Xinxin et al. [
20] studied the HOF risk coupling in maritime pilotage from the perspective of human-organizational factor (HOF) risk coupling in pilotage, using the hierarchical classification idea of Human Factors Analysis and Classification System (HFACS) and the system dynamics (SD) approach.
To summarize the above literature, a large number of statistical analysis methods to study the corresponding problems in ship navigation risk analysis have been explored, including ship navigation in bad weather, ship collision risk analysis, accident probability risk assessment, etc. For the analysis of pilotage risk, other studies have been carried out, mainly on the risk analysis under various conditions such as personnel factors and environmental factors. This study is modeled and summarized after data analysis, with large amounts of data as the basis, and summarizes the law of pilotage disruption. The analysis of the traffic flow data of the pilotage disruptions also led to the corresponding conclusions. This is not only important in this study, but also can provide the corresponding data base for other studies.
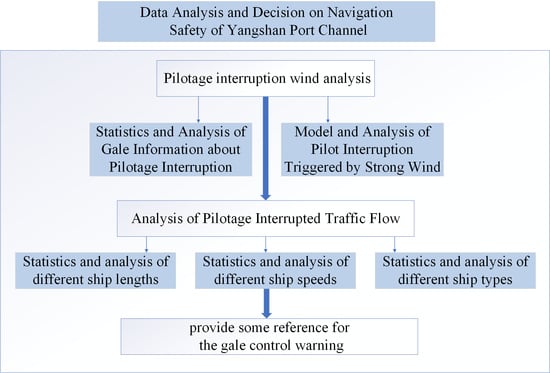
In order to ensure the safety of pilotage in the Yangshan Port channel, this article provides statistics on pilotage interruptions in the ten years from 2011 to 2020, based on the data set provided by the project. Firstly, we summarize the wind direction and wind levels on the day of pilotage disruption due to high winds, and then analyze the effects of different wind directions and wind levels on triggering pilotage disruption. Secondly, a suitable model is established to study the influence of different wind levels and wind directions on pilotage interruption, and to explore the law of pilotage interruption. Finally, the data of different observation lines are compared to analyze the changes in traffic flow under the condition of pilotage interruption. At the same time, the statistical analysis of different ship lengths, ship speeds, and ship types are carried out to summarize the general laws of pilotage interruption, which provides a certain reference for the early warning of gale control. In terms of the statistical methods used for data analysis, the data was first visualized and the probabilities of the corresponding data were calculated. Then, error analysis was performed, mainly using the arithmetic mean and trapezoidal mean methods, followed by curve fitting through the origin software. The convex packet algorithm was used in the construction of the model for the determination of the two-factor coupling threshold. In terms of methods used to provide analysis, the main methods are data analysis, modeling, scenario comparison, results presentation, and hypothesis inference.
2. Pilotage Interruption Wind Analysis
2.1. Statistics and Analysis of Gale Information Effecting Pilotage Interruption
According to the data set provided by the project, statistics on pilotage interruption in the ten years from 2011 to 2020 are given. The main reason for the interruption of pilotage is due to high wind control. The main reason for triggering high wind control is whether the wind level and wind direction of the day are suitable for ship piloting, thus ensuring safe ship entry into the port.
Based on the data provided by the project, we summarized the frequencies of wind levels and wind directions that occurred during the ten years of strong wind control days from 2011 to 2020 and set 16 wind directions such as E, W, S, and N. We visualized the data. The visualization results are as follows:
- (1)
The relationship between high wind control and wind direction (As shown in
Figure 1).
Among them, the blue bar represents the total number of records for the wind direction; the orange bar represents the number of records for the wind direction; and the red dot represents the ratio of the number of records in wind direction and wind control to the total number of records.
It can be seen from
Figure 1 that the three wind directions NNW, N, and NNE have the highest frequency, while the four wind directions WNW, W, SW, and WSW have the lowest frequency. It can be inferred that the northerly wind is the prevailing wind direction in Yangshan Port. In addition, when the wind direction is NW or WNW, the probability of triggering high wind control is the largest, up to 25.8%. When the wind direction is in other directions, the probability of triggering high wind control is generally low. It can be speculated that the wind direction near the northwest will significantly increase the probability of triggering the wind control.
- (2)
The relationship between high wind control and wind level (As shown in
Figure 2).
Among them, the blue bar is the total number of records; the orange bar is the number of high wind controls; and the red dot is the probability of high wind control under the wind level.
It can be seen from
Figure 2 that the frequency of occurrence is the highest when the wind level is 5.5, while wind above level 10 hardly appears. It can be inferred that winds of about level 5.5 prevail in Yangshan Port. In addition, as the wind level increases, the probability of triggering the gale control also increases; when the wind level is below level 6, the gale control is almost never triggered; when the wind level is between 6.5 and 8, the triggering probability increases from 10.6% to 60%; when the wind level is between 8.5 and 10, the trigger probability is about 80% to 90%. When the wind level is 11 or above, although there are almost no occurrences, all of them will trigger the gale control.
- (3)
The relationship between high wind control and gusts (As shown in
Figure 3).
Among them, the blue bar is the total number of records; the orange bar is the number of high wind controls; and the red dot is the probability of high wind control at the wind level.
It can be seen from
Figure 3 that when the gusts are level 7, the frequency of occurrence is highest, and gusts above level 10.5 hardly appear. It can be inferred that gusts of level 7 are prevalent in Yangshan Port. Obviously, the gust triggering the gale control is similar to the wind level, and the probability of the gale control becomes higher as the intensity increases. When the gust is above 7.5, it will hardly trigger the gale control; when the gust is between 8 and 9.5, the probability of triggering gale control increases from 10.4% to 64.5%; when the gust reaches level 10, the probability of triggering gale control is above 70%.
By analyzing the above data, we can see that gusts exist in Yangshan Port more than half of the days. Not every wind level or gust level will necessarily trigger high wind control. It can be inferred that wind speed, wind direction and gusts are also in constant change throughout the day. For example, a gust level of 9 occurred 109 times, but only triggered high wind control 42 times. It can be seen that the wind speed, wind level, and gusts are unstable throughout the day, and the chance of triggering wind control is also random, which also affects the decision of port operators.
2.2. Model and Analysis of Pilot Interruption Triggered by Strong Wind
From the statistical results, the wind control is mainly related to the wind level and wind direction. The description of the wind level is all numbers, so the digital information can be extracted directly. The wind direction also has keywords such as “True North” and “Northeast”, so it can use these keywords to extract short sentences containing valid information. For convenience, the positive east wind direction is taken as 0°, and the clockwise rotation is 360°. At the same time, the daily time is divided into five time periods. If no change is proposed in the textual description, the wind level and direction of the previous time period are defaulted, and then we use the averaging method for the wind level as the effective wind level information of the day. For the statistics of the effective wind direction value, there are several methods, i.e., the arithmetic average method, the trapezoidal average method, etc. [
21].
- (4)
Error Analysis
We believe that, when the number of observations is large enough, the average value can be regarded as the true value, and then a certain observation value is:
Among them, r and s are random error and systematic error, respectively. The random error of the arithmetic average method is:
Then when the number of observations is large enough, there are:
The random error of the trapezoidal average method is:
Then when the number of observations is large enough, there are:
That is to say, there is no difference between the advantages and disadvantages of the two methods for handling random errors from a statistical perspective. The movement of the wind vane can be regarded as an underdamped oscillation, then:
Because the observed value at time t can be written as:
So the systematic error of the arithmetic average method is:
Then when the number of observations is large enough, there are:
The systematic error of the trapezoidal average method is:
when the number of observations is large enough, there are:
It can be concluded that the two methods are equivalent in dealing with observation errors.
- (5)
Error handling method selection
In the above analysis, the two methods are equivalent in the processing of the observation error, so in the processing of the wind level to choose any one of the methods is feasible. However, in the wind direction problem, the wind direction of the previous moment has an impact on the wind direction of the next moment, so the trapezoidal averaging method can be adopted.
Assuming that the average speed at which the wind direction changes from
θi to
θi+1 is:
when the step length Δ
t = ti+1 − ti is a constant, the median angle of
and
is:
In the same way, we can calculate the average wind direction of
:
Therefore, we have obtained the effective wind direction and wind speed of the strong wind control every day through the above calculation.
- (6)
Graham Scan algorithm
The daily effective wind direction and wind speed of high wind control are obtained from the above analysis. Next, we need to consider whether a single factor can determine the triggering pilotage interruption. Firstly, the threshold of wind level causing pilotage disruption is analyzed separately, that is, the minimum wind level at each angle of pilotage disruption is extracted. Then take the maximum of these “threshold wind levels” as the overall wind level threshold, and consider whether the overall wind level threshold covers most situations. If the overall wind level threshold exists as a sufficient non-essential condition for the vast majority of angles, it indicates that the wind level is not suitable as the sole criterion for judging pilotage disruption. After the origin mapping, it is found that the overall wind level threshold is enlarged because the threshold wind level in the range of 0–45 degrees is too large. That is, due to the influence of individual values, it cannot cover most situations. Therefore, the possibility of wind level as the only criterion for judging pilotage interruption is eliminated. It is guessed that wind level may be an independent factor in one interval to affect the judgment of pilotage interruption, while in another wind direction intervals play a role as part of the coupling factor. Overall, it is clear that considering wind direction as the only criterion for judging pilotage interruption is not in line with the common sense of life and can be directly excluded.
Next, consider the two-factor coupling threshold. The preliminary idea is to make a scatter plot covering all situations with the wind direction and wind level as the coordinate axes. The lower boundary is obtained through the convex hull algorithm, and then the curve that best fits the lower boundary is fitted through the origin. You can get the threshold of two-factor coupling. In graphics, convex hull means giving N points in the plane and finding a convex polygon composed of some points as vertices, which can enclose all N points. This convex hull algorithm is also called the Graham Scan method. In fact, it is very simple, that is, use a convex polygon to enclose all the points. The effect is similar to a boundary created by thumbtacks on a desktop, anchoring a tight rubber band. Detailed steps of the algorithm are as follows:
Find the point with the smallest ordinate y among all the points, which is the lowest point among them, and record it as p0.
Then, calculate the cosine value of the angle between the line spanning the remaining points, and the point recorded as p0 and the x-axis. Then sort these points according to their sine value for the lowest point, from large to small. The sorted points are denoted as p1, p2, p3,…
Press the lowest point p0 and the first point p1 of the sorted points into the stack, then count from p2 and calculate whether the two points at the top of the stack and the three-point vector of the point are rotated counterclockwise. If so, press the point into the stack, otherwise push out the top element of the stack.
Finally, the elements in the stack are the points outside all the convex hulls.
- (7)
Model construction and analysis
After obtaining the points on the periphery of the convex hull, the data were input into origin for curve fitting, and the results of the two-factor coupling thresholds were obtained. After observation, it is found that the boundary curve is obviously divided into two parts. When the angle is in the range greater than seventy to eighty degrees (i.e., it is obvious that it is a straight line when it is close to the northward and counterclockwise to the due east), it is obviously a straight line, i.e., this part was the interval in which the wind level as a separate factor worked, and the threshold was 5.5. While in the interval near the eastern side, it is the coupling factor that plays a role. The fitted curves derived by origin is shown in
Figure 6:
Therefore, the final determination result is that the pilotage interruption is judged by the dual-factor coupling effect near the easterly wind direction, and the wind level acts alone in other wind directions. It is possible to speculate that, because the No. 2 piloting operation point is relatively close to the sea surface, the bad sea conditions caused by easterly winds are lighter, so the pilotage interruption wind level may be higher than other wind levels.
3. Analysis of Pilotage Interrupted Traffic Flow
After analyzing the traffic flow in the warning area under normal and interrupted pilotage conditions, the ship’s traffic conditions during the five pilotage interruptions in 2019 were recorded, and the ship’s traffic records were divided into normal conditions and interrupted conditions based on the pilotage interruption time. Extract the traffic records of east-west and north-south directions respectively. The angles of 0–45, 135–225, and 315–360 are counted as north–south, and the remaining directions are counted as east–west. During the pilot interruption period, the traffic flow during the interruption period is significantly less than the non-interruption period.
3.1. Vessel Flow Analysis under Normal Weather, Windy Weather and Wind Control
The statistics of the nine observation lines from Tiger Snake Island to Shaoxi Island (L1 to L9, respectively) in the cautionary area of Yangshan waters in December 2020 are used, and the locations and names of the observation lines are shown in
Figure 7. The ships in the warning zone (L1~L8) are regarded as “import ships” when they enter the warning zone and “export ships” when they leave the warning zone.
From
Table 1 and
Figure 8, it can be seen that the ships sailing into the warning zone under normal weather conditions are mainly from L2, L3, and L7, while the ships sailing out of the warning zone are mainly from L1, L3, and L8 observation lines. On average, the largest number of ships entering and leaving the alert area per day are from L3 and L8 observation lines.
From
Table 2 and
Figure 9, we can see that the ships sailing into the warning zone under windy weather conditions are mainly from L3 and L7, while the ships sailing out of the warning zone are mainly from L3 and L8 observation lines. On average, the largest number of ships entering and exiting the warning area per day was from L3 and L8 observation lines. Compared with normal weather, the number of ships in windy weather is obviously reduced. It can be calculated that, except for L6 which was reduced by 94.45%, all other observation lines were reduced by more than 95%, with the most obvious reduction in L9 and L2, which were reduced by 99.80% and 99.01% respectively.
From
Table 3 and
Figure 10, it can be seen that the ships sailing into the warning area during the high wind control are mainly from L3, L6, and L7, while the ships sailing out of the warning area are mainly from the L3 and L8 observation lines. On average, the largest number of ships entering and leaving the alert area per day is from L3 and L8 observation lines. Compared with the normal weather, the number of vessels during the control is obviously reduced. The most obvious reduction is L9, which is calculated to be 100%, followed by L1 and L2, which are reduced by 95.43% and 96.51% respectively; the least reduction is L6, which is reduced by 65.52%.
It is clear from the above data that, compared to normal weather conditions, ship traffic flow decreases significantly in windy weather conditions, and the number of ships entering and leaving the port drops to single digits or even to zero in windy control conditions, which shows that the impact of high winds and windy control on traffic flow is significant.
3.2. Statistics and Analysis of Different Ship Lengths
According to the observation data of each observation line, the container ship length range is divided into 9 categories: 0–50 m, 51–100 m, 101–150 m, 151–200 m, 201–250 m, 301–350 m, 351–400 m, and more than 400 m. The traffic statistics results are shown in
Table 4,
Figure 11.
From the statistical results, between different observation lines, there is a relatively large gap in the proportion of different ship types. Among them, ships between 51–100 m in length obviously have the highest number of passes, reaching 381 times and accounting for 29% of the total. The container ship lengths accounting for more than 10% are: 51–100 m, 101–150 m, 251–300 m, and 351–400 m. The container ship length is 201–250 m, and 151–250 m, accounting for only 3% of the total. While there are almost no records of passage for ships under 50 m in length or for ships over 400 m. The disparity in the number of records for different categories of ships may be due to the low number of overly long ships themselves and the predominance of ships with shorter lengths.
It can be found from
Figure 12 that the passage of ships with lengths in each area of the observation line L1 is relatively average, mainly concentrated on medium and large ships, with a relatively large number of 351–400 m, but still no more than 25%, and no ships below 200 m have passed. The lengths of the ships passing observation lines L3, L4 and L8 are relatively similar, with most being small ships under 150 m and a very small number around 150–200 m. By understanding the position of observation line L3, it is found that this channel is the Jinshan channel, which is the link between Shanghai and Zhejiang. It is speculated that due to the relatively close distance between the two places and the developed means of transportation such as railways and roads, there are not likely to be larger ships, mostly small boats. At the same time, considering that observation line 8 is geographically closer to the land and considering the ship’s draft and other factors, it may be that the depth of this route is relatively shallow, which is not conducive to the passage of large ships. Observation line L6 is the intersection of two channels with huge throughput, so ships of various lengths are involved, but mainly large ships of 251-400 m and ships of 101–150 m. The position of observation line 9 is located in the main channel of Yangshan Port, so all kinds of ship lengths are also involved, and most of the ships of 250–400 m are the main ones.
3.3. Statistics and Analysis of Different Ship Speeds
According to the observation data on different observation lines, the average ship speeds of various types of ships have certain differences, but the ship speeds are basically concentrated between 6–15 kn. The speed of container ships less than 150 m in length is about 5–10 kn, and the speed of container ships more than 150 m in length is about 12–17 kn. The speed statistics of container ships with different lengths on different observation lines are shown in the
Figure 13 below:
Observation line L1 shows that the ship speed is about 10–14 kn, and the speed does not fluctuate much with the change of the ship length. Observation lines L3 and L4 are mainly small boats. The ship length of observation line 3 is about 50–150 m, and the ship speed fluctuates roughly between 6–9 kn. The speed of a ship with a length of 150–200 m is about 10–12 kn. The ship speed of observation line L4 fluctuates between 7 and 12 kn. Among them, the ship speed fluctuates more for the ships with the length of 201–250 m, probably because this channel is the Jinshan channel, which is the channel linking Shanghai and Zhejiang, and more incoming ships lead to more fluctuations in ship speed. Observation lines L6 and L9 have similar ship speed patterns, and ship speed fluctuations are related to ship length. Ships with a length of 50–200 m on the observation line L6 have speeds of around 8–12 kn, while those with a length of 201–350 are around 13–17 kn. Ships with a length of 50-150 m on the observation line L9 have speeds of around 4–8 kn, while those with a length of 201–350 are around 12–14 kn. It is speculated that it may be because the longer the ship, the higher the speed of the ship is required to maintain rudder efficiency. The ships in observation line L8 are mostly small ships, with ship lengths of 50–150 m and ship speeds of around 6–8 kn.
The study found that the relationship between ship length and ship speed recorded by each observation line has some differences. For example, the speed of container ships less than 150 m in length is roughly 5–10 kn, while the speed of container ships over 150 m in length is roughly 12–17 kn. However, further analysis found that ship speed is roughly positively correlated with ship length, that is, ship speed gradually increases as the length of the ship increases.
3.4. Statistics and Analysis of Different Ship Types
In view of the passage law of different types of ships, we first need to use MMSI as the identification code of a ship, count the traffic records of container ships that appear on three or more observation lines, and calculate the average speed as the ship’s speed in the warning zone. At the same time, considering that the warning zone is a circular area with a radius of two nautical miles, we approximate the distance of the ship as four nautical miles and calculate its transit time. Secondly, the origin is used for linear fitting. The Pearson coefficient is 0.80512, and the empirical formula is:
The visualization results of the time and ship speed data of different types of ships in the warning zone are shown in
Figure 14 and the statistics of the time and speed of container ships of different lengths in the warning zone are shown in
Table 5.
It can be seen from
Figure 14 that the ship length of different types of ships in the warning zone is negatively correlated with navigation time and positively correlated with ship speed, that is, the longer the length of the ship, the shorter the navigation time and the faster the ship speed. According to the linear fitting plot of ship length-ship speed for different types of containers in
Figure 15, the ship speed in the alert zone is roughly positively correlated with the ship length, that is, the longer the length of the ship, the faster the speed of the ship, and the corresponding time is less, which also confirms the above speculation.
4. Conclusions
Aiming at the regularity of triggering high wind control leading to interruption of pilotage, this paper combines the data set provided by the project for a total of ten years, from 2011 to 2020, and counts the occurrence of pilot interruption. The analysis shows that the northerly wind prevails in Yangshan Port, and the wind levels are mostly at level 5.5. When the wind direction is near the northwest and the wind level is 8.5 to 10 or even greater, the probability of triggering gale control will be significantly increased. At the same time, level 7 gusts prevail in Yangshan Port and wind levels above force 10 also significantly increase the probability of triggering high wind control. From the perspective of wind level and wind direction dual-factor coupling triggering high wind control, the severe sea conditions caused by easterly winds are lighter, and the wind level of pilot interruption may be higher than other wind levels. According to the observation data of different observation lines, ships with a length between 51–100 m pass the most times in Yangshan Port, while ships with a length of less than 50 m and ships over 400 m have almost no passing records. Ship speeds are basically concentrated in between 6–15 kn, and the ship speed of different ship types is obviously different. The fluctuation of ship speed is positively correlated with the ship length, that is, the ship speed gradually increases as the length of the ship increases. Finally through the ship length–ship speed linear fitting graph, the related speculation is also confirmed. By analyzing the data of triggering pilotage interruptions and analyzing the traffic flow in the alert area under normal and interrupted pilotage conditions, a corresponding research basis is provided for safe pilotage operation of vessels in Yangshan Port under high wind conditions.
However, there are some limitations in this paper, and further research is needed. In the future, the Automatic Identification System (AIS) data can be matched with the wind data and with the physical properties of the ship. By finding the connection between different kinds of data, i.e., matching the ship data and the weather data. AIS data can be added to the model of wind-triggered pilotage disruptions. The force of wind can be estimated using detailed data of individual ships, and the effect of wind on ship behavior from AIS data can be quantitatively analyzed, so that the behavior of different ships under external conditions can be accurately predicted, and better pilotage decisions can be made in wind-controlled weather. In addition, the safe operation mode of ship pilotage under high wind conditions can also be studied and optimized based on this paper, in order to improve the navigational effectiveness of the port, and thus achieve greater economic and social benefits.


