Article

Corrosion Inhibition Evaluation of Chitosan–CuO Nanocomposite for Carbon Steel in 5% HCl Solution and Effect of KI Addition

1
Department of Bioengineering, Cyprus International University, Via Mersin 10, 98258 Nicosia, Turkey
2
Interdisciplinary Research Center for Advanced Materials, King Fahd University of Petroleum and Minerals (KFUPM), Dhahran 31261, Saudi Arabia
*
Authors to whom correspondence should be addressed.
Sustainability 2022, 14(13), 7981; https://doi.org/10.3390/su14137981
Submission received: 29 May 2022 / Revised: 25 June 2022 / Accepted: 25 June 2022 / Published: 30 June 2022
(This article belongs to the Section Sustainable Materials)

Abstract

:
Chitosan–copper oxide (CHT–CuO) nanocomposite was made by an in-situ method utilizing olive leaf extract (OLE) as reductant. The OLE mediated CHT–CuO nanocomposite containing varying amount of chitosan (0.5, 1.0 and 2.0 g) was evaluated as corrosion inhibitor for X60 carbon steel in 5 wt% hydrochloric acid solution. The corrosion inhibitive performance was assessed utilizing weight loss and electrochemical impedance spectroscopy, linear polarization resistance and potentiodynamic polarization techniques complemented with surface assessment of the corroded X60 carbon steel without and with the additives using scanning electron microscopy/energy dispersive X-ray spectroscopy and 3D optical profilometer. The effect of KI addition on the corrosion protection capacity of the nanocomposites was also examined. Corrosion inhibitive effect was observed to increase with increase in the nanocomposites dosage with the highest inhibition efficiency (IE) achieved at the optimum dosage of 0.5%. The order of corrosion inhibition performance followed the trend CHT1.0–CuO (90.35%) > CHT0.5–CuO (90.16%) > CHT2.0–CuO (89.52%) nanocomposite from impedance measurements. Also, IE was found to increase as the temperature was raised from 25 to 40 °C and afterwards a decline in IE was observed with further increase in temperature to 50 and 60 °C. The potentiodynamic polarization results suggest that the nanocomposites alone and in combination with KI inhibited the corrosion of X60 carbon steel by an active site blocking mechanism. Addition of KI upgrades the IE of the nanocomposites but is not attributable to synergistic influence. The lack of synergistic influence was confirmed from the computed synergism parameter (S1) which was found to be less than unity with values of 0.89, 0.74 and 0.75 for CHT0.5–CuO, CHT1.0–CuO and CHT2.0–CuO nanocomposites, respectively, at 60 °C. Furthermore, KI addition improved the IE with rise in temperature from 25 to 60 °C. Surface analysis results confirm the formation of a protective film which could be attributed to the adsorption of the nanocomposites on the carbon steel surface.

1. Introduction

Carbon steel finds widespread usage in many industrial sectors, including oil and gas, nuclear power, construction, energy, desalination, and metal processing [1,2]. Its widespread use is due to its appealing characteristics, which include rigidity, resilience, malleability, cost-effective, and portability. Nevertheless, carbon steel is prone to corrosion when exposed to assiduous and unfavourable environmental conditions, causing it to deteriorate and lose its useful properties [3]. Corrosion is a big issue that many sectors face. It poses both safety and economic risks [1,4]. Industries have incurred significant economic losses directly or indirectly due to corrosion and therefore require methods for its control. Shutdowns leading to loss of revenue and expenditure incurred in maintenance of equipment due to damage constitute indirect and direct costs respectively. Utilization of corrosion inhibitors is the most feasible means of reducing corrosion of equipment made of metallic substrate. Most inhibitors work by adsorbing molecules onto metal surfaces, increasing or decreasing the anodic and/or cathodic reaction, slowing the pace at which reactants diffuse to the metal’s surface, increasing the electrical resistance of the metal’s surface, or a combination of these methods [5].
Multi-component inhibitor systems containing nitrogen, phosphorous, and sulphur moieties are among the commercially available corrosion inhibitors used in industry. Despite the fact that these inhibitors are reliable and work well in corrosive environments [6,7], they are difficult to synthesize and, due to their toxic nature, are not ecologically benign. The majority of them persist in the environment and require costly clean-up procedures [8]. Because of the concerns with commercial corrosion inhibitors, scientists are increasingly focusing on producing ecologically acceptable corrosion inhibitors from natural sources. Natural polymers have been considered as an excellent alternative to the current toxic inhibitors. Many of these have been reported as corrosion inhibitors, as can been seen in the detailed comprehensive review work by Umoren and Solomon [9]. Interest in natural polymers as green corrosion inhibitors stem from the fact that they are renewable, nontoxic, environmentally friendly, possess multiple adsorption centres, are available in abundance, are relatively inexpensive and can be produced using simple procedures at minimal cost [10].
The inability of some polymers to dissolve readily in aqueous solution, as well as their sensitivity to degradation at elevated temperatures, are two reported limitations. As a result, some of these have limited or moderate protection capabilities. For instance, Solomon et al. [11] observed that 0.5 g of carboxymethyl cellulose in 0.5 M H2SO4 solution could only provide 64.8% IE on a mild steel surface. Rajeswari et al. [12] found that 500 mg L−1 of glucose, when used as a corrosion inhibitor for cast iron in hydrochloric acid as corrodent at 28 °C, had a protective power of 69.5%. As a result, several initiatives have been undertaken to improve natural polymer stability and inhibitive properties. Incorporation of substances which exert synergistic effect, cross-linking, blending, copolymerization, and nano compositing (the incorporation of a minute amount of metal-based material into the polymer matrix) are among them [13,14,15,16,17,18].
It appears that, among all the steps taken, compositing has proved successful. In recent times, there have been reports on the preparation, characterization, and corrosion protection potential of chitosan–metal nanocomposites. Solomon et al. [19] reported the synthesis, characterization, and use of chitosan–silver nanoparticles (AgNPs–chitosan) to protect St37 steel in a 15 wt% hydrochloric acid medium. Utilizing gravimetric method, it was observed that AgNPs–chitosan nanocomposite exhibited the highest IE of 97.09% at 1000 ppm dosage. The adsorption of AgNPs–chitosan nanocomposite on the surface of steel obeyed the Temkin adsorption isotherm model. PDP evaluation indicated that AgNPs–chitosan nanocomposite behaves as a mixed-type inhibitor for St37 steel in 15% HCl corrosive environment. The corrosion inhibitive effect of the nanocomposite for St37 steel corrosion in 15% sulphuric acid corrodent was also investigated by Solomon et al. [20]. Srivastava and co-workers [21] reported the preparation, characterization and anticorrosion potential of chitosan and its cobalt (chitosan–Co) and SnS2 (chitosan–SnS2) nanocomposites for mild steel in 1 M HCl. It was found that chitosan in its neat form offered 77% protection efficiency, but this value was increased to more than 95% and 80% in the presence of chitosan–Co and chitosan–SnS2 nanocomposites respectively. Fetouh et al. [22] examined the corrosion inhibitive potential of chitosan–AgNPs for mild steel in cooling water employing gravimetric and electrochemical techniques. Data obtained showed that the IE of 97–98% was achieved at the dosage of 150 ppm from the gravimetric method. Solomon and co-workers [23] reported the synthesis, characterization and assessment of the corrosion inhibition performance of carboxymethyl cellulose–silver nanoparticles (CMC–AgNPs) for St37 steel in 15% H2SO4 corrosive environment. The CMC–AgNPs exhibited the optimum IE of 93.94% at 1000 ppm concentration at 25 °C. However, using a weight loss method, the optimum IE of 96.37% was derived at 60 °C. In another recent study [24], the preparation, characterization and corrosion protection potential of carboxymethyl cellulose and three metal nanocomposites, namely, nickel (CMC–Ni nanocomposite), copper (CMC–Cu nanocomposite) and iron (CMC–Fe nanocomposite), was reported for carbon steel in 2 N HCl solution. It was observed that the optimum IE for the CMC as well as CMC–Fe NP, CMC–Cu NP and CMC–Ni NP composites at 400 mg L−1 were 76.6, 94.9, 96.2 and 98.4%, respectively. In addition, John et al. [25] discovered that a chitosan–ZnO nanocomposite could provide 73.80% protection to mild steel surfaces in 0.1 N HCl solution in comparison to 32.47% protection by chitosan alone.
Extensive research has been undertaken to find the synergistic effect of various additives to improve the efficacy of metal corrosion inhibitors. Synergism, according to Li et al. [26], is a means of increasing the inhibitor’s inhibitive capacity, reducing the dosage of inhibitor used, and diversifying the inhibitor’s deployment in a corrosive environment. The synergistic influence of metal cations (Ba2+, Sr2+, Ca2+, and Zn2+) and anions on corrosion inhibitors has been reported in the literature [27,28]. The halides are the most investigated anions. The halide ions are thought to be preferentially adsorbed on the metal surface, enhancing the inhibitor’s potency through intermediate bridge formation between the positive end of the inhibitor and the metal surface [29,30].
Although there are some publications on the corrosion inhibition of chitosan–metal/metal oxide nanocomposites for mild steel in acidic media in the literature, there is none on chitosan–CuO nanocomposite. In the present work, we therefore report for the first time the corrosion protection capacity of chitosan–CuO nanocomposite prepared using olive leaf extract and the influence of KI addition on the corrosion inhibitive performance of the nanocomposites for carbon steel in 5% HCl corrosive medium. The novelty of the work lies in using a facile approach to synthesize the CHT–CuO nanocomposite in comparison to previously reported approaches found in the literature. We use olive leaf extract as reducing agent and the synthesis was achieved using water as a solvent. The advantage of this is that among all the several green syntheses processes, plant extract mediated synthesis is the fastest, cheapest, and most sustainable.

2. Materials and Methods

2.1. Materials

The materials utilized include chitosan with degrees of deacetylation of 75–85% and molecular weights of 50,000–190,000 Da, copper sulphate pentahydrate (CuSO4·5H2O) (Merck, Darmstadt, Germany) and acetic acid (CH3COOH) (Merck). These were used as procured without further purification. Fresh olive leaf was harvested near the Haspolat campus of Cyprus International University (CIU). The metal substrate used was X60 carbon steel with chemical composition as earlier reported [31].

2.2. Preparation and Characterization of CHT-CuO Nanocomposites

Chitosan–CuO nanocomposite was made utilizing an in-situ approach. Aqueous Olive leaf extract (OLE) was used as the reductant while CuSO4·5H2O served as the CuO nanoparticles precursor. Details of preparation and characterization of chitosan–CuO nanocomposite are documented in our earlier publication [32]. Briefly, chitosan with masses of 0.5, 1.0, and 2.0 g was weighed into a conical flask (250 mL capacity) and 100 mL distilled water containing 1 mL of acetic acid was added. At room temperature, the mixture was stirred using a magnetic stirrer until the chitosan was completely dissolved. An appropriate amount of copper sulphate pentahydrate (0.2497 g, 1 mM equivalent) was added to the chitosan solution and stirred. This was followed by the addition of 5 mL of olive leaf extract (OLE) that had already been prepared. The mixture was heated on a magnetic hot plate to a constant temperature of 90 °C for 96 h while being constantly stirred. A gradual change in colour indicated the formation of chitosan–CuO nanocomposite, which was confirmed by UV–vis measurement [32].

2.3. Corrosion Inhibition Studies

The metal sample was cut into coupons of 1.20 × 1.20 × 1.10 cm size (total exposed surface area of 8.16 cm2) for the weight loss measurements and 1.0 × 1.0 × 0.5 cm size for electrochemical measurements. The sample surface treatment was undertaken according to the ASTM G1-90 standard [33]. Silicon carbide papers of various grit sizes (# 120–1000) were used to grind the metal sample mechanically. The corrosive medium was a 5 wt.% hydrochloric acid solution made by diluting adequate analar grade hydrochloric acid (37%, Merck) with double distilled H2O. Corrosion inhibition performance of CHT–CuO nanocomposites for X60 carbon steel corrosion in the acid medium was examined using electrochemical and weight loss techniques. We added 3 mM KI to the CHT–CuO nanocomposite to assess the effect of KI addition on the corrosion inhibitive performance of the nanocomposites.

2.3.1. Electrochemical Measurements

VERSASTAT 3 (Princeton Applied Research, Oak Ridge, TN, USA) was used to perform electrochemical experiments. An electrochemical system with three electrodes was used. The working, reference, and counter-electrodes were X-60 carbon steel (surface area of 0.7855 cm2), silver/silver chloride (Ag/AgCl, 3 M KCl), and a platinum wire mesh, respectively. Before commencement of each measurement, a one-hour stabilization interval was allowed to produce a steady-state open-circuit potential (EOCP). 0.5 mV/s was the potential sweep rate for PDP measurements. The potentials were first scanned cathodically, starting at the corrosion potential, and then anodically from −250 to +250 mV. Using a scan rate of 0.125 mV/s, LPR assessment was performed by polarizing the working electrode ±10 mV around the EOCP. The EIS assessment was performed using a 10 mV sinewave alternating-current (AC) voltage at EOCP in the frequency range of 100,000 Hz to 0.01 Hz. For consistency, the impedance measurement experiments were done twice. Zsimpwin software was used to analyse the data.

2.3.2. Weight Loss Measurements

To determine the influence of temperature on the corrosion protection efficacy of CHT–CuO nanocomposite and CHT–CuO + 3 mM KI, a weight loss experiment was undertaken in a reaction vessel made of a glass containing 250 mL of test solution maintained at 25, 40, 50, and 60 °C with thermostated water bath. The cleaned and weighed steel samples were suspended loosely in the various test solutions in each experiment. The metal samples were totally immersed in the test solutions without and with the inhibitors. After 24 h of immersion, the test coupons were removed, thoroughly cleaned following previously documented procedures [33], rinsed first with distilled water and then acetone, air dried, and reweighed. The weight loss was calculated using the variation in pre and post immersion weight. The results demonstrated good repeatability and the mean values of the duplicate determinations are reported. Based on the weight loss results, corrosion rates (mm y−1) were estimated using the formula [19]:
C R ( mm   y 1 ) = 87.6 × Δ W ρ AT
where CR, W, ρ, A and T represents the corrosion rate, mean weight loss (mg), density (g cm−3), surface area (cm2) and exposure duration (h) respectively.
The IE of the nanocomposites was computed utilizing the formula [16]:
IE % = C R ( blank ) C R ( inh ) C R ( blank ) × 100
where CR(blank) stands for the corrosion rate without the additive and CR(inh) stands for the corrosion rate with the additives.

2.3.3. Surface Analysis

A scanning electron microscope (SEM; JEOL JSM 66100 LV, Japan) was used to characterize the metal surface following exposure to the corrosive environment with and without the inhibitors. A 3D optical profilometer (Contour GT-K, Bruker Nano GmBH, Berlin, Germany) was utilized to assess the surface roughness of the exposed area of the X60 carbon steel specimens submerged in the corrosive medium without and with 0.5% CHT–CuO nanocomposite alone and in combination with KI.

3. Results and Discussion

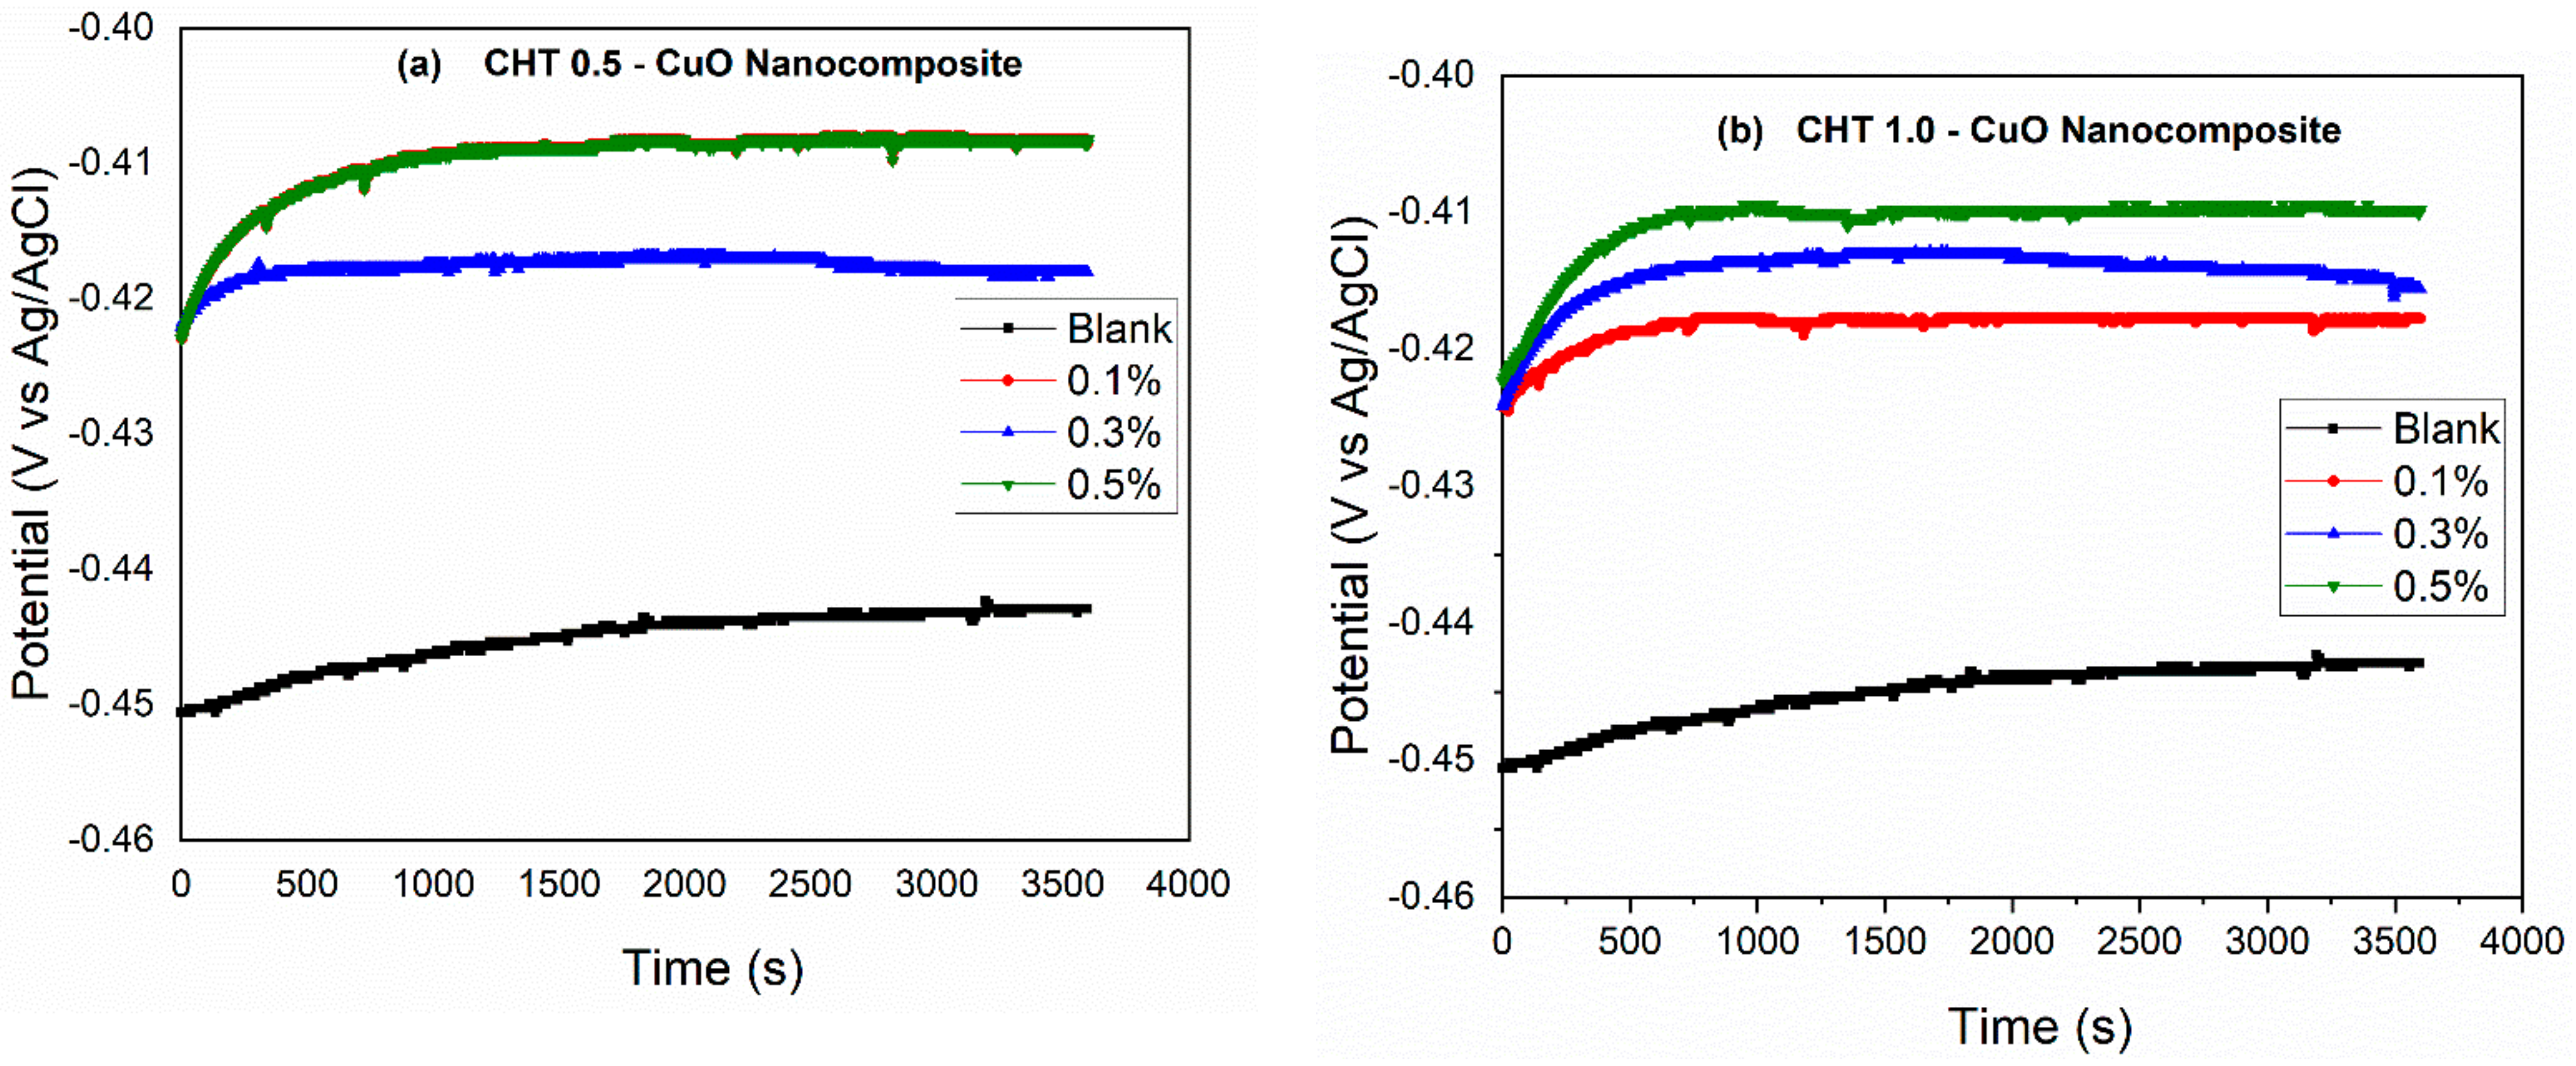
3.1. Open Circuit Potential

Open circuit potential (EOCP) is defined as the free corrosion potential when the system attains an equilibrium and zero net electrical current flows through the metal surface. Its measurement gives insight into the inhibitory process. When the corrosion reaction approaches equilibrium, Eocp reaches a steady-state value equal to the corrosion potential (Ecorr). Plotting Ecorr against time is required to understand the reactivity of a metal surface in contact with its environment [34]. Figure 1a–c show the Eocp curves of X60 carbon steel in 5% HCl solution without and with CHT–CuO nanocomposites containing 0.5, 1.0, and 2.0 g of chitosan, respectively. The potential shifted to less noble values in the steady-state portion of the figure, signifying the occurrence of corrosion on the metal surface exposed to the corrodent. Because of the nanocomposite adsorption on the carbon steel surface, the Eocp value of the steady-state region shifts to positive values when CHT–CuO nanocomposite is added. The movement in corrosion potential towards noble values is nanocomposite concentration dependent, as shown by the OCP vs time curve. The optimum investigated nanocomposite concentration (0.5%) resulted in more noble EOCP displacement than other dosages.

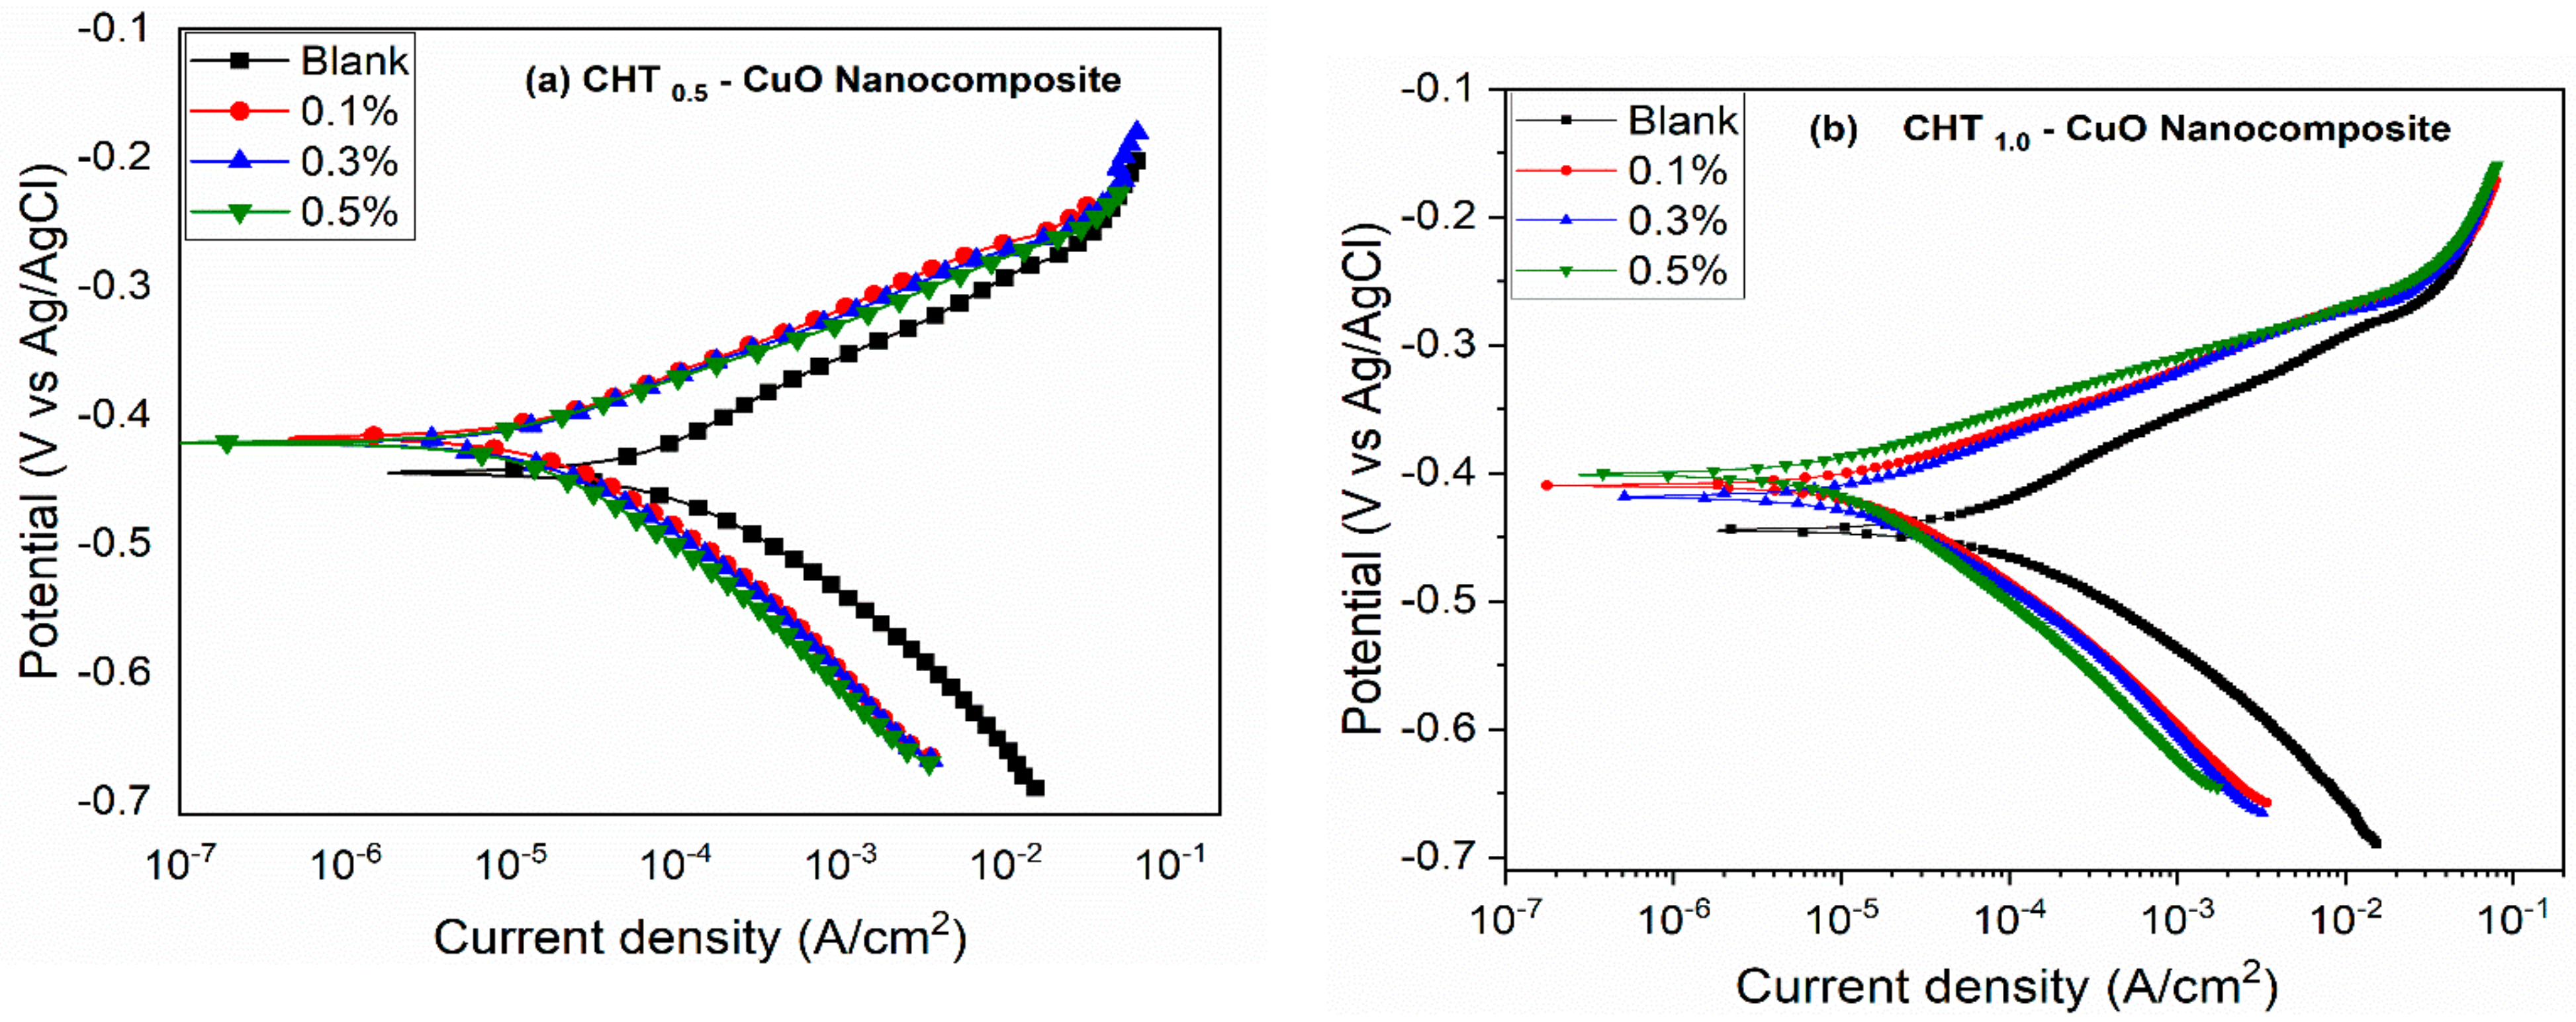
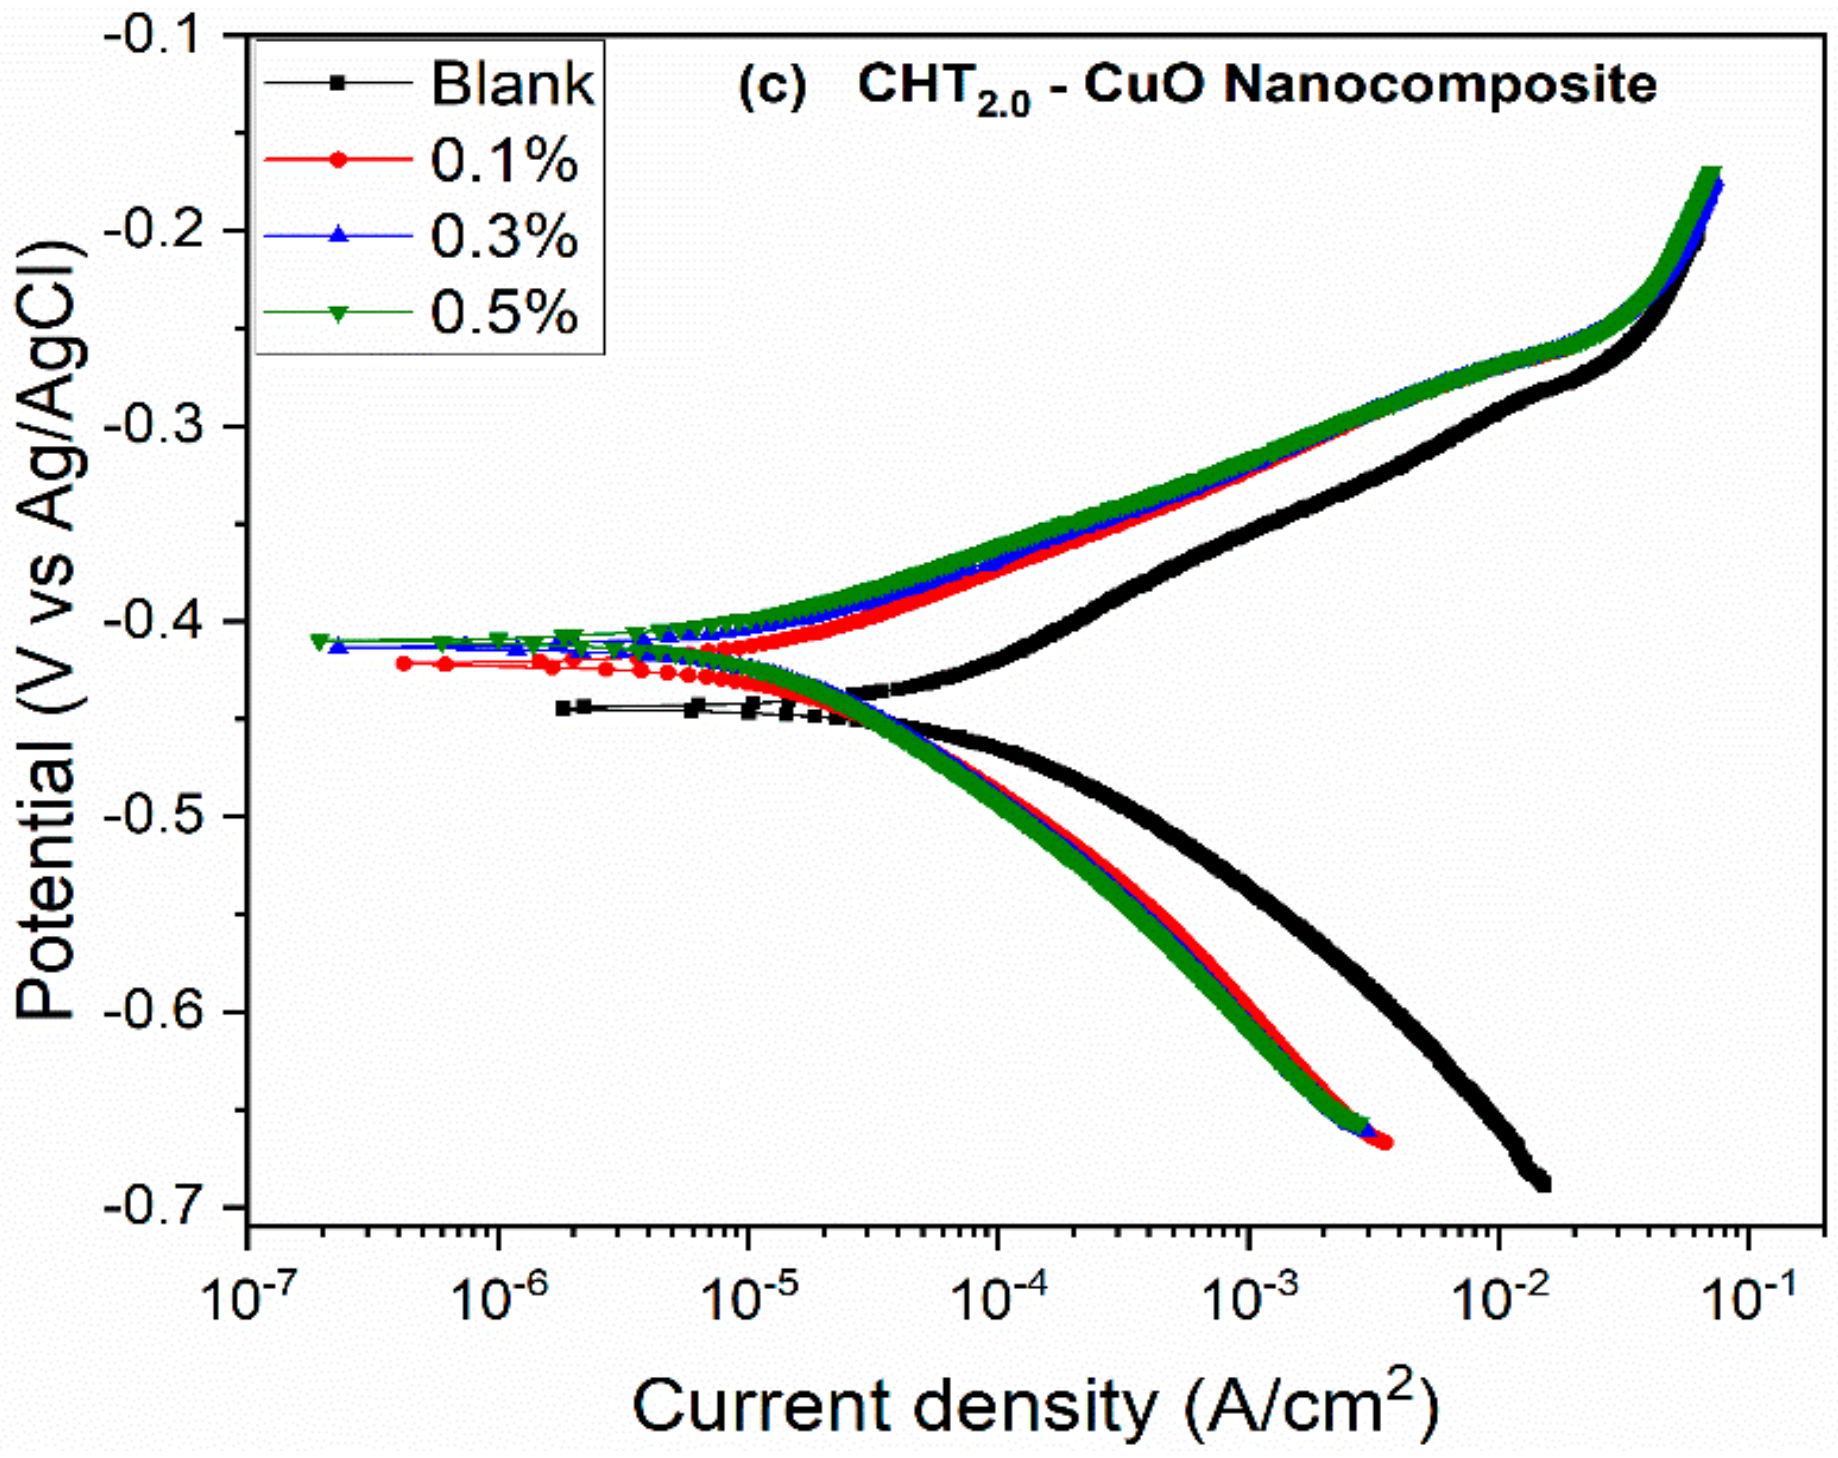
3.2. PDP and LPR Measurements

The corrosion protection of X60 carbon steel in 5% HCl was studied utilizing electrochemical methods at 25 °C with and without varying concentrations of CHT–CuO nanocomposite (0.1, 0.3, and 0.5%) containing varying amounts of chitosan (0.5, 1.0, and 2.0 g). Figure 2 depicts the usual potentiondynamic polarization curves for X60 carbon steel in 5% HCl acid medium without and with various dosages of (a) CHT0.5–CuO, (b) CHT1.0–CuO, and (c) CHT2.0–CuO nanocomposites. Listed in Table 1 are the major corrosion kinetic parameters determined from these curves, including Ecorr, corrosion current density (icorr), and anodic and cathodic Tafel slopes (βa and βc). From Figure 2, it is seen that the X60 carbon steel undergo active dissolution in the corrosive medium, with no discernible transition to passivation within the applied potential range in the absence and presence of the nanocomposites. In the presence of the additives, the polarization curves shift to lower current density regions in comparison with the corrodent with no additive. From Table 1, it is noted that there is a displacement of the Ecorr towards noble values in the presence of CHT–CuO nanocomposite when compared with the uninhibited solution. For example, the Ecorr moved to a positive value of −409.1 mV/Ag/AgCl, −400.1 mV/Ag/AgCl and −409.1 mV/Ag/AgCl for 0.5% of CHT0.5–CuO, CHT1.0–CuO, and CHT2.0–CuO nanocomposites respectively from −443.9 mV/Ag/AgCl of the uninhibited acid (5% HCl). Examination of Table 1 also reveals that the icorr value is reduced from 73.20 µA cm–2 to 14.91, 13.19 and 14.99 µA cm–2 in the inhibited solution of 0.1% nanocomposite containing 0.5, 1.0 and 2.0 g chitosan respectively. Further increase in concentration of the nanocomposite to 0.5% results in further reduction in icorr to 11.73, 9.75 and 11.80 µA cm–2 for CHT0.5–CuO, CHT1.0–CuO, and CHT2.0–CuO nanocomposites, respectively, indicating that the icorr reduction is impacted by the dosage of the additives. With increasing nanocomposite concentration, there is no substantial alteration in the numerical values of βa and βc, according to Table 1. Kousar et al. [35] made a similar observation, which suggests that the anodic and cathodic corrosion reactions inhibition mechanism has not changed. This suggests that the nanocomposites inhibit X60 carbon steel corrosion in 5% HCl corrodent by blocking anodic and cathodic active sites. As is well known, interface inhibitors can suppress corrosion by one of three mechanisms [36]: (i) geometric blockage [37], (ii) active site blockage, or (iii) electro-catalytic effect. Estimation of the coefficients of anodic (fa) and cathodic (fc) reactions can be used to derive the predominant mechanism [38]. If geometrical blocking is used to inhibit corrosion, fa = fc [36], and the variation in Ecorr between inhibited and uninhibited systems is zero. fa and fc is <1 for corrosion retardation by active site blocking, but fa or fc is >1 for inhibition by electro-catalytic action [36], and Ecorr shows a significant difference [37]. Displayed in Table 1 are the computed values of fa and fc for the present work using previously published equations [36]. The values in the table clearly show that fa and fc are less than 1, indicating that anodic and cathodic corrosion active sites are inhibited by nanocomposites adsorption. The difference in corrosion potential between inhibited and uninhibited systems also supports inhibition via active site blocking. Arellanes-Lozada et al. [36] found that 1-butyl-2,3-dimethyl-imidazolium iodide and 1-propyl-2,3-dimethyl-imidazolium iodide inhibited X52 steel corrosion in acid medium through an active site blocking mechanism.
IE was obtained from the PDP method employing the formula in Equation (3) [19,20].
I E ( % ) = 1 i c o r r i c o r r 0 × 100
where i c o r r 0 represents the corrosion current density without the additives and i c o r r represents the corrosion current density in the inhibited acid solution. The values of IE are presented in Table 1. Inspection of the table reveals that IE increased with an increase in the additives dose reaching the values of 83.98, 86.68 and 83.88% at the optimum concentration of 0.5% of the nanocomposites containing 0.5, 1.0 and 2.0 g chitosan respectively. The order of corrosion inhibition performance was found to follow the trend CHT1.0–CuO > CHT0.5–CuO > CHT2.0–CuO.
LPR measurement was conducted to evaluate the IE of CHT–CuO nanocomposite on X60 carbon steel corrosion in 5% hydrochloric acid corrodent. The fundamental benefit of this electrochemical method is that it is the only corrosion measurement technique that can directly assess the rates of corrosion in real time as well as being non-destructive [39]. The polarizing voltage of 10 mV was chosen because it falls well within the bounds of the direct connection between icorr and E/I. Furthermore, the value is modest enough to prevent any remarkable or irreversible disruption of the corrosion process, ensuring that succeeding assessments are accurate. The polarization resistance (Rp) and IE values obtained using this technique in the uninhibited and inhibited acid solutions containing various nanocomposite dosages are listed in Table 2. The following formula was used to compute the IE [31]:
I E = 1 R p 0 R p × 100
where R p 0 stands for the polarization resistance without the additives and Rp stands for the polarization resistance in the presence of the additives.
Results in Table 1 show that Rp is improved in the presence of the nanocomposites in comparison to the absence of nanocomposites, indicating that the nanocomposites function as an excellent inhibitor for X60 steel corrosion in the acid corrodent. The Rp appears to rise as the concentration of nanocomposites increases. At the optimum CHT–CuO nanocomposite concentration (0.5%) containing 0.5, 1.0, and 2.0 g chitosan, maximum polarization resistance values of 931.79, 1174.00, and 934.43 Ω cm2 were achieved, respectively. The inhibition efficiency corresponding to these polarization resistances is 73.42, 78.89, and 73.49%, respectively. The results of the PDP and LPR measurements are in good accord, confirming that the order of corrosion inhibitive performance of the nanocomposites is CHT1.0–CuO > CHT0.5–CuO > CHT2.0–CuO.

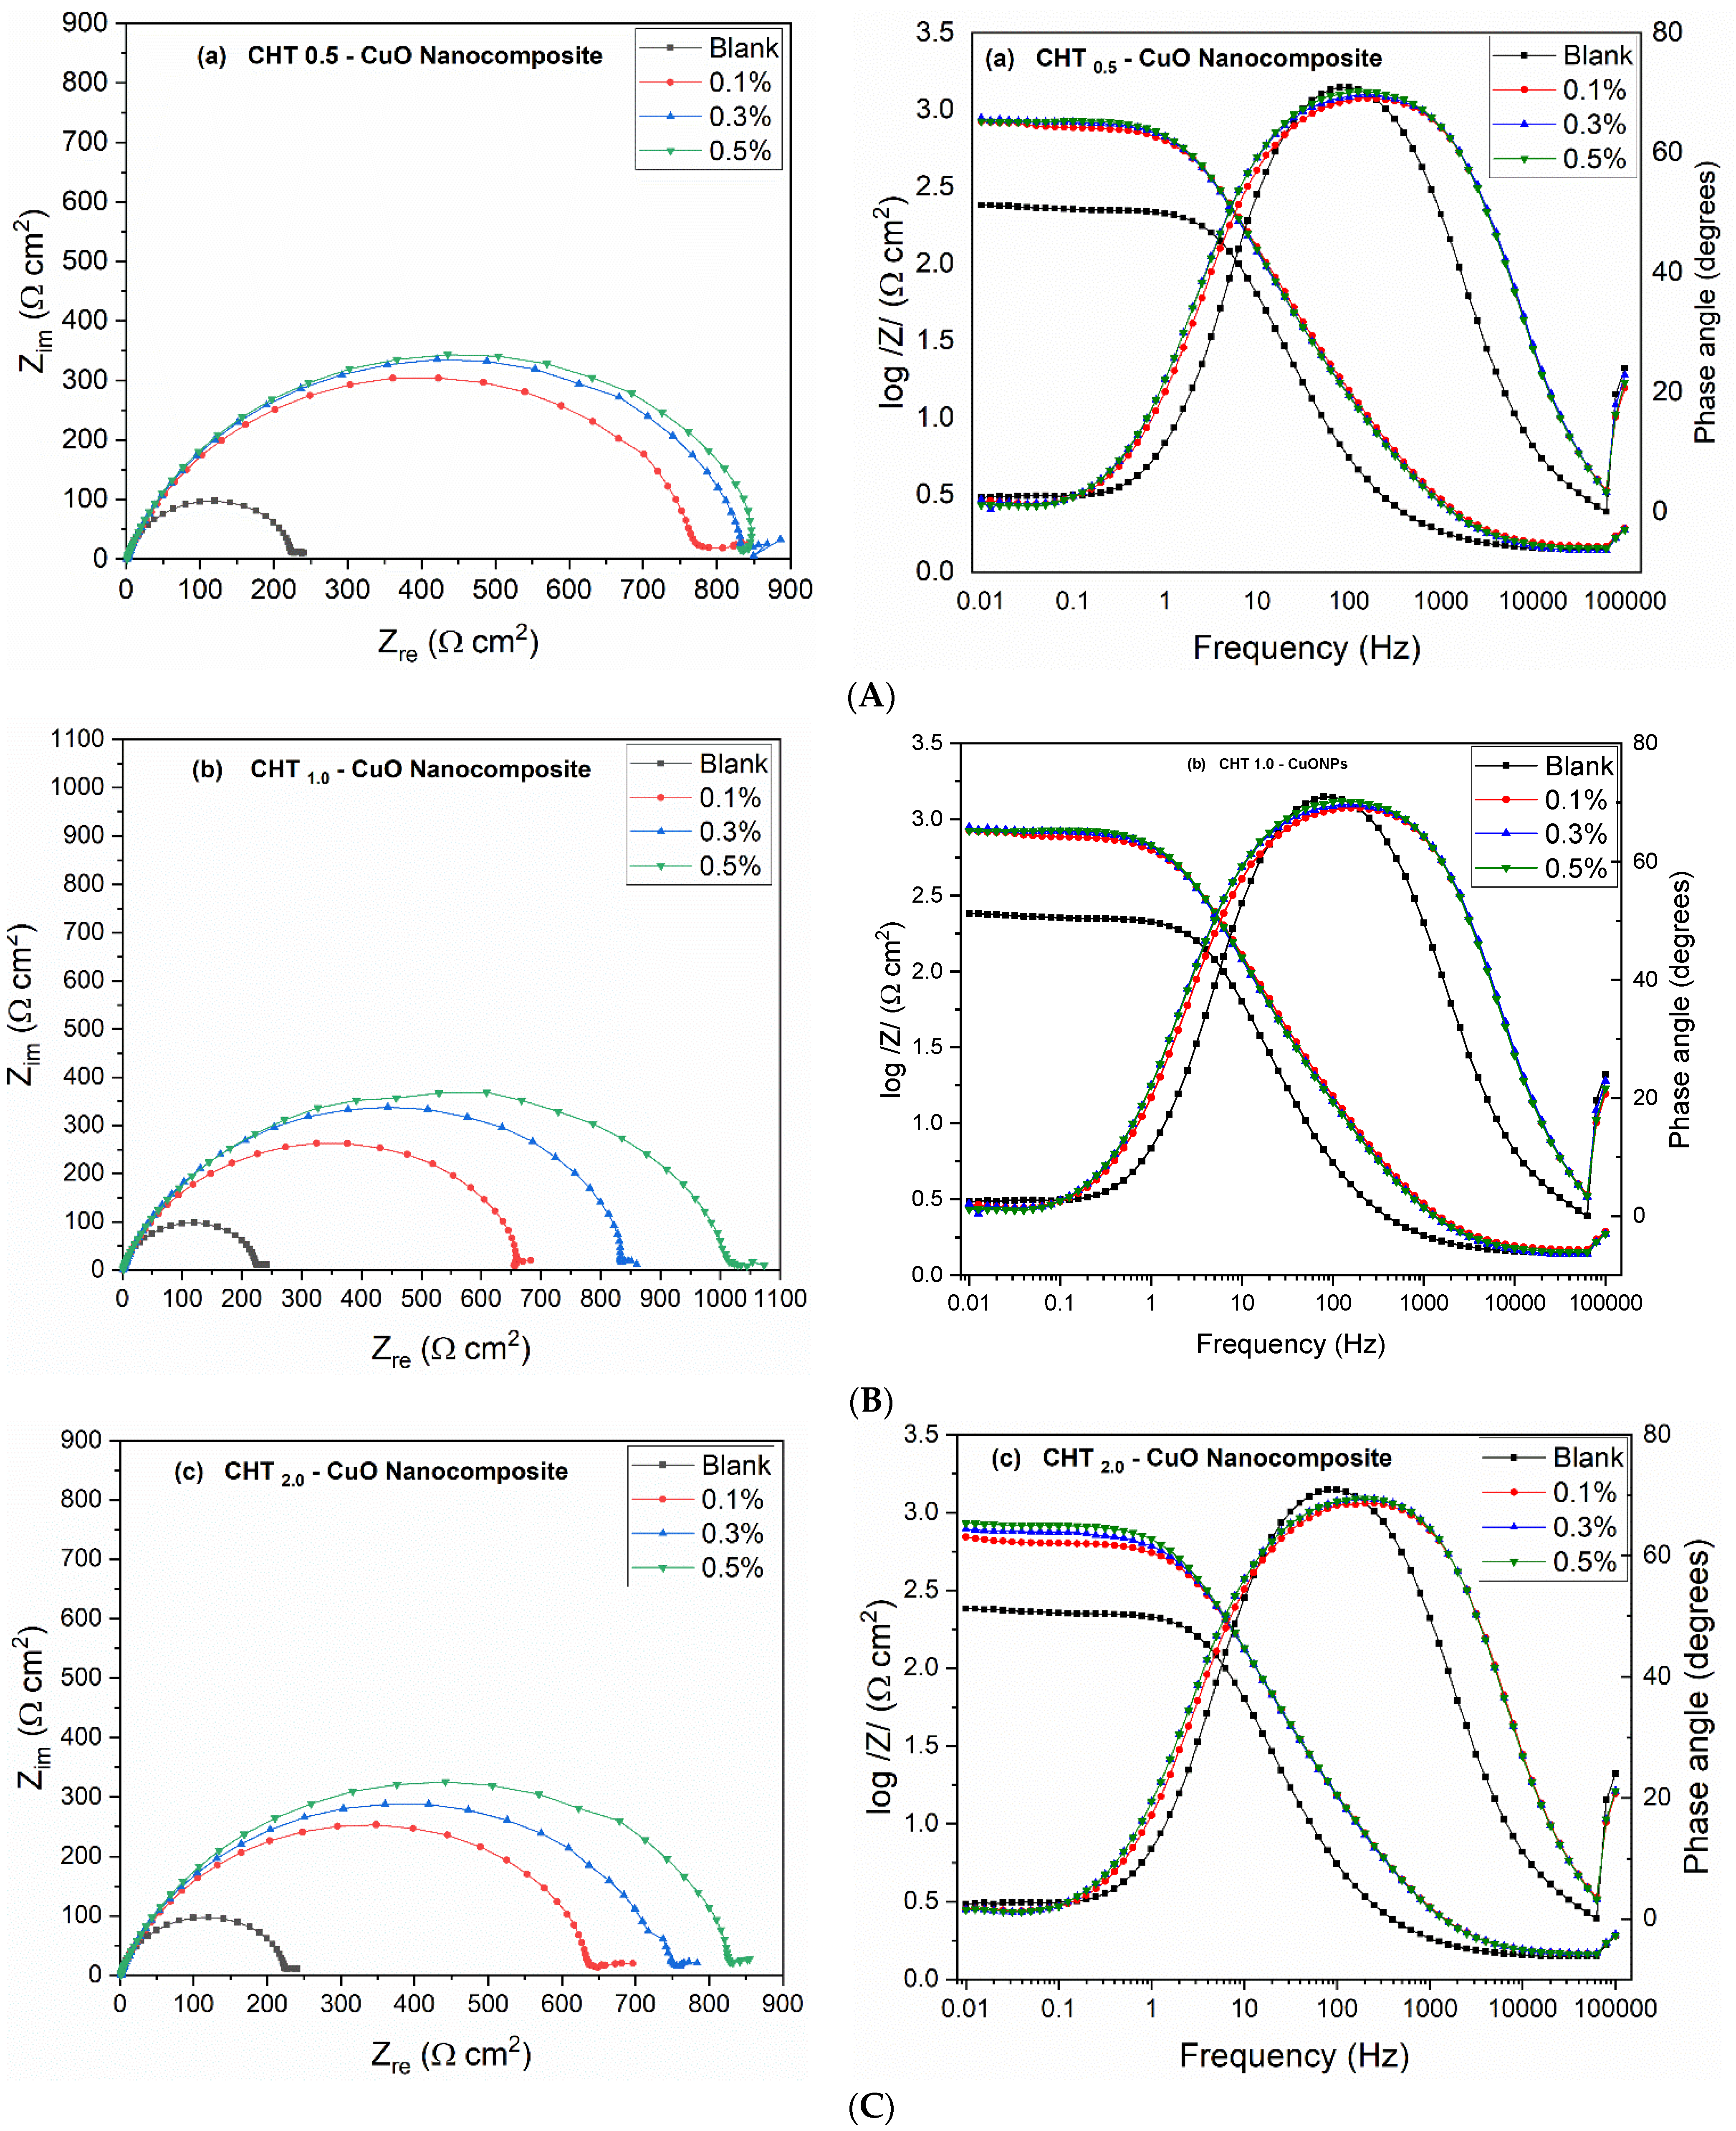
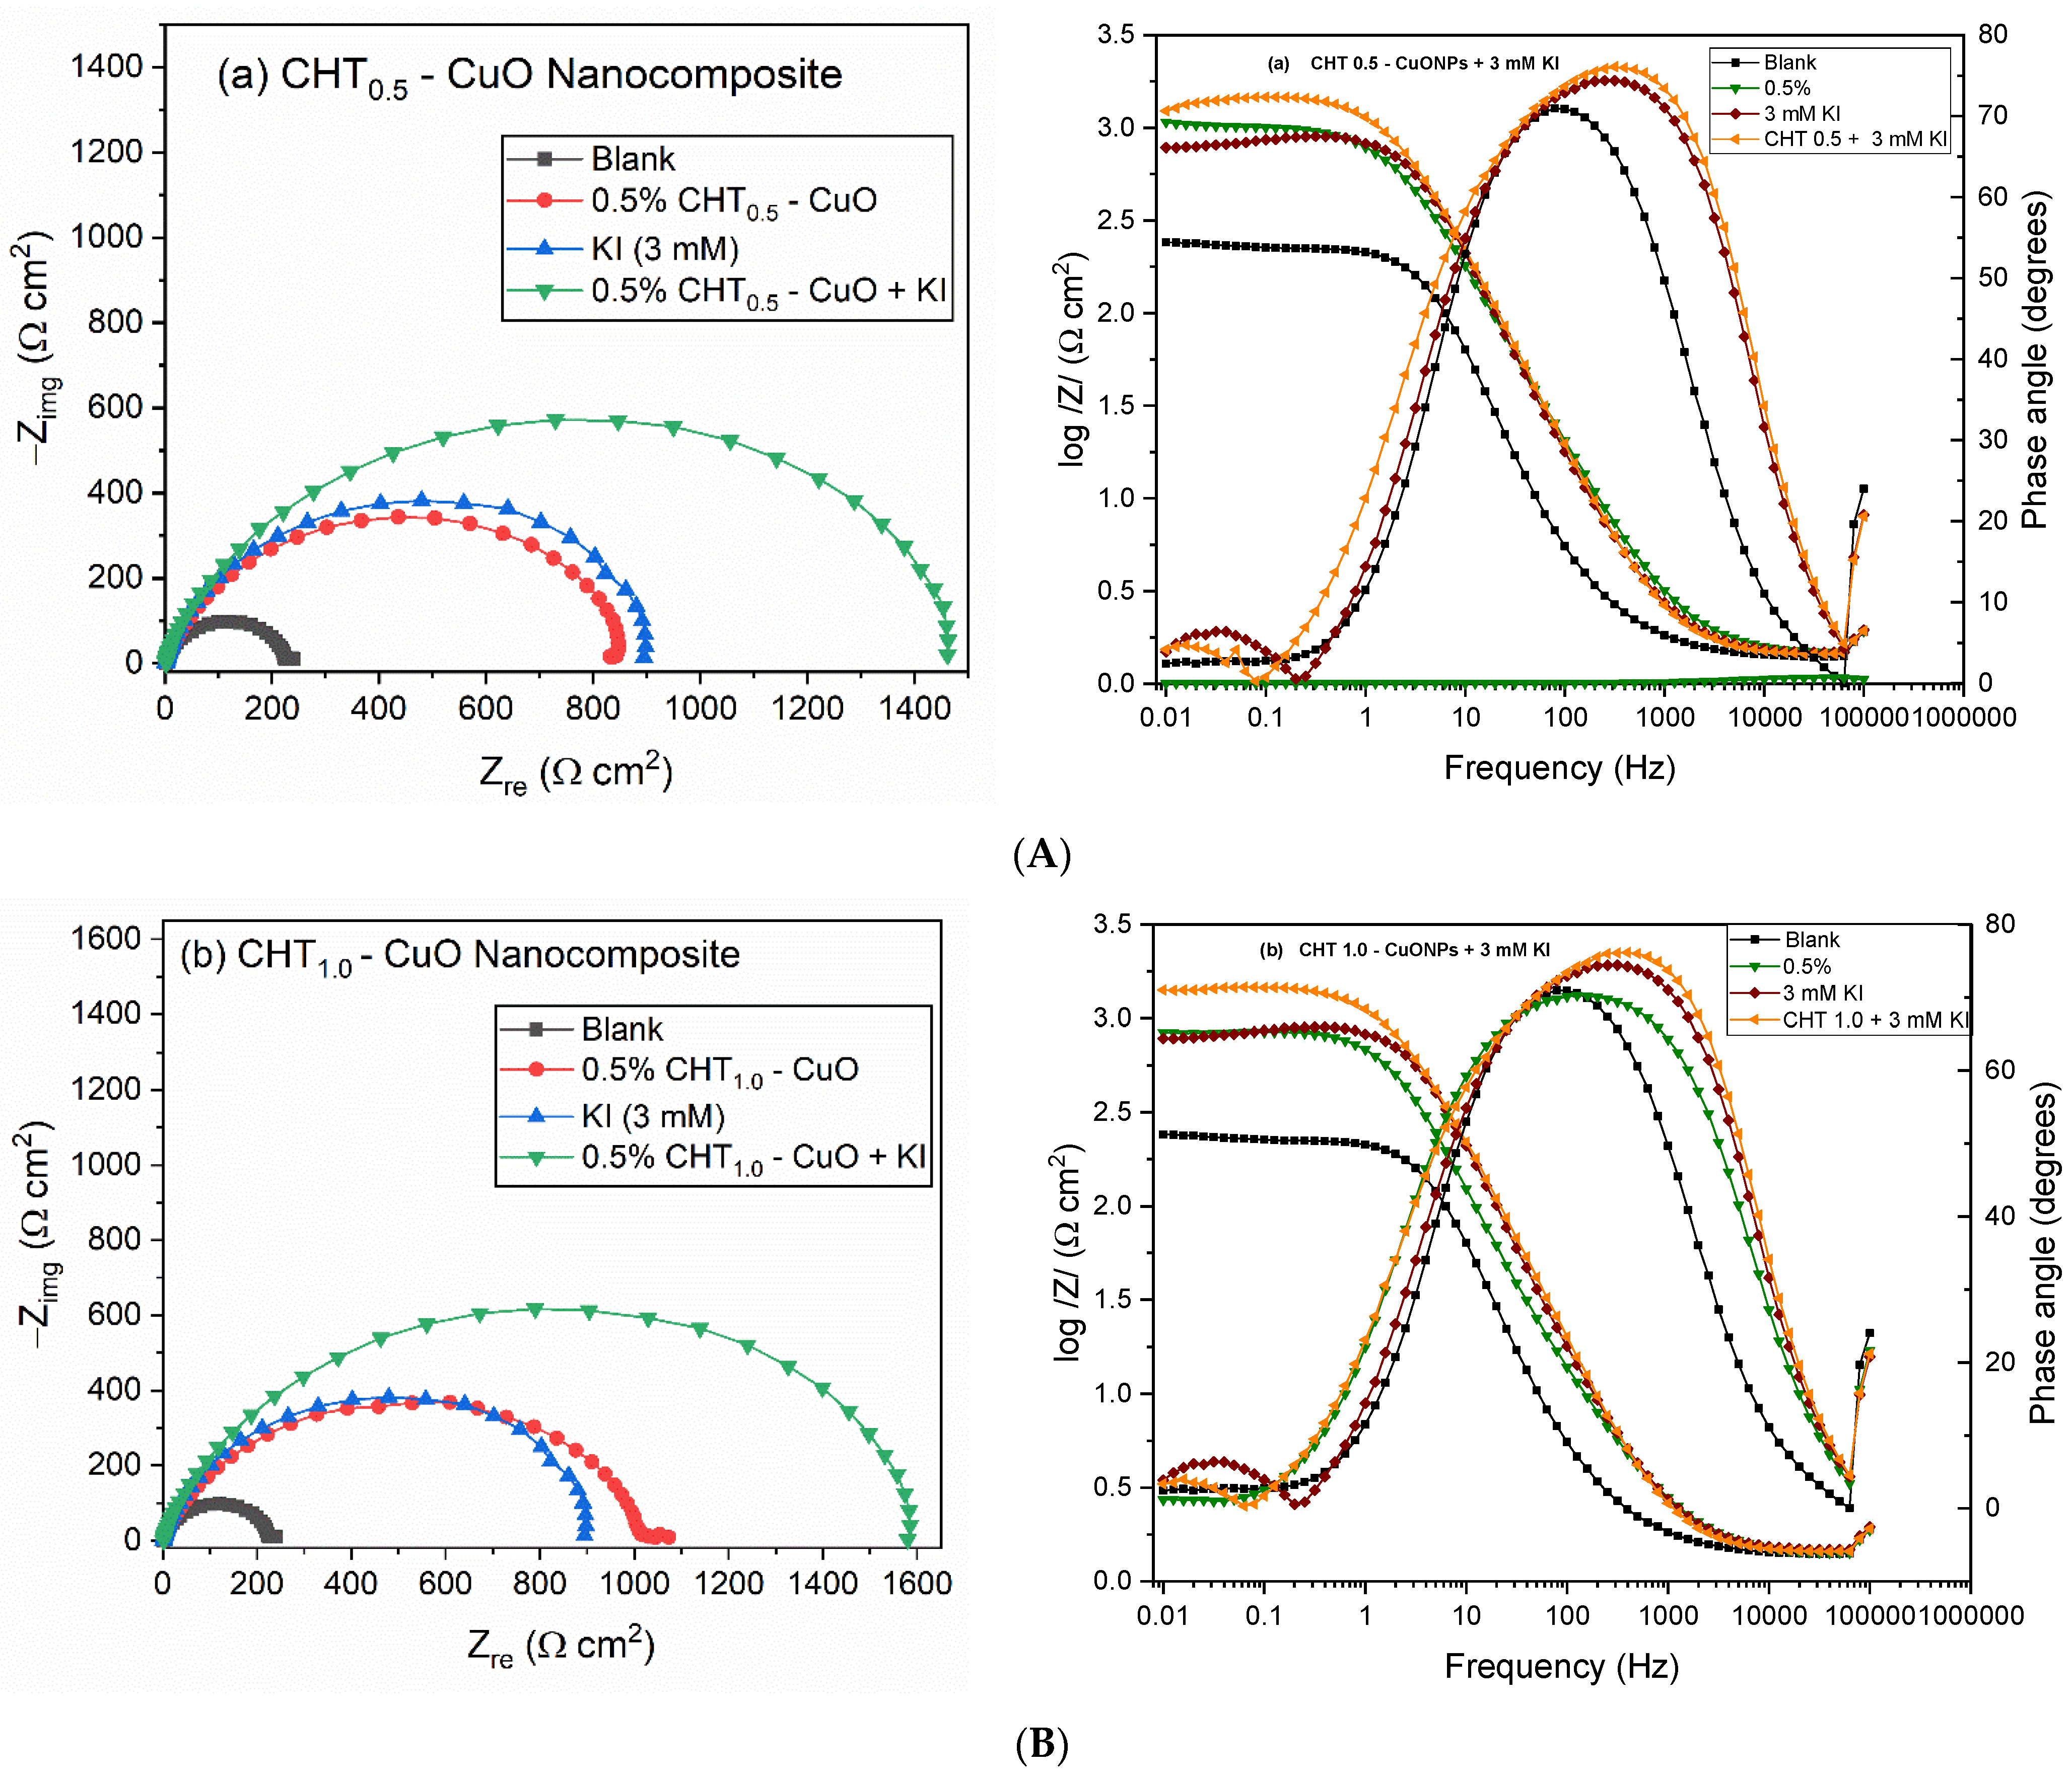
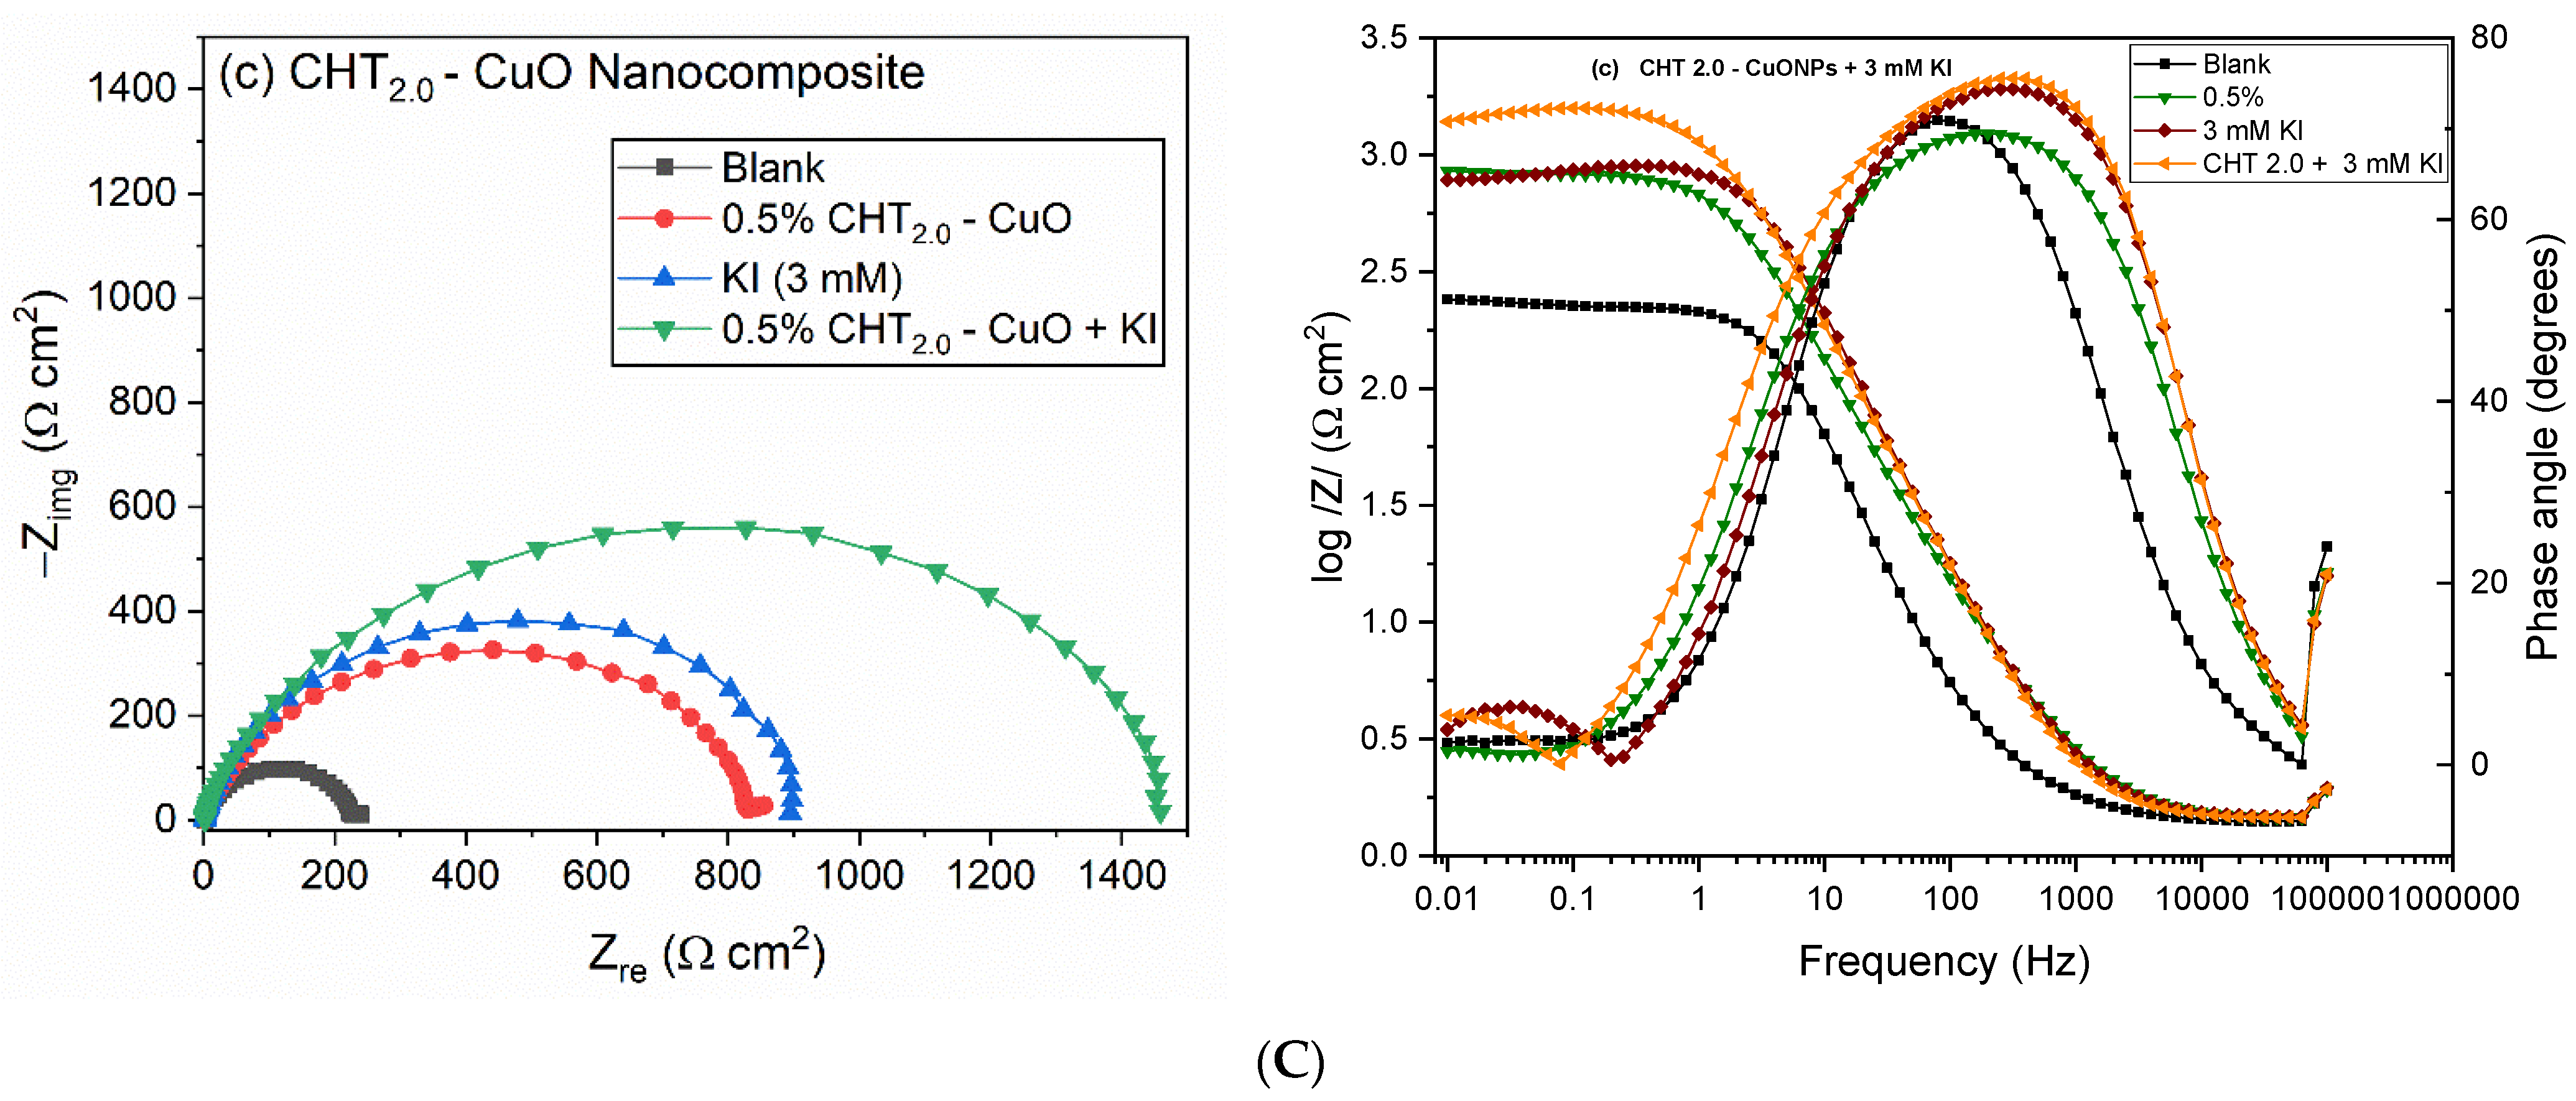
3.3. EIS Measurements

Figure 3 depicts the impedance diagrams for X60 steel in the uninhibited and inhibited 5% HCl containing varying dosages of (a) CHT0.5–CuO, (b) CHT1.0–CuO, and (c) CHT2.0–CuO nanocomposite in both Nyquist and Bode representations. The impedance spectra revealed two capacitive loops that are difficult to distinguish, corresponding to two-time constants in the Bode representation both in the absence and presence of the inhibitory molecules. The high frequency time constant indicates the presence of a corrosion product/inhibitor film in contact with the corrosive medium, whereas the middle and low frequency time constants are related to corrosion activity at the unprotected sites of the metal surface [39]. The semicircles in the Nyquist diagrams with the additives are comparable to the one without the additives, showing that the corrosion mechanism was unaffected by the additives [40]. With increasing additive concentrations, the diameters of the semicircles in the Nyquist diagrams and the Bode modulus magnitude at low frequency domain become bigger in each scenario. The semicircles are not perfect but sunken, which could be due to the X60 steel surface’s heterogeneity or roughness [41]. It is also ascribed to active site dispersion, inhibitor molecule adsorption, and the creation of porous layers [42,43].
Figure 4c,d depict representative simulated and empirically obtained impedance plots for X60 carbon steel in 5% hydrochloric acid without and with nanocomposite additive, respectively. For all experimental data, this model provided an excellent fit. It is obvious from the figure that the measured impedance plot matches the one simulated by the equivalent circuits given in Figure 4a,b, respectively. The solution and charge transfer resistances are represented in the equivalent circuits by Rs and Rct, respectively, Rf stands for film resistance. CPE stands for constant phase element, which was employed in place of a pure capacitor to recompense for deviations from ideal dielectric behaviour. CPE’s impedance is defined as follows [44]:
Z C P E = Y 1 j w n
where Y and n are the magnitude and exponent of the CPE respectively; j = 1 1 / 2 is an unreal number and ω is the angular frequency in rad/s. The exponent, n, can be utilized to determine the surface heterogeneity or coarseness of the carbon steel electrode.
Presented in Table 2 are the electrochemical parameters derived from the fittings. The addition of the additives to the corrodent raised the magnitude of the Rct, as evidenced by the increase in the Nyquist semicircles diameter in comparison to the uninhibited solution, as shown in Figure 3. This is due to the protective film that forms at the steel–electrolyte interface [39]. The table also shows that Rct values increase as the concentration of nanocomposites increased. The goodness of fit (χ2) values are low, and the range of values provided indicates that the equivalent circuit accurately matched the experimental data. IE was obtained from the EIS method by comparing the polarization resistance (Rp) values in the uninhibited and inhibited solutions using the formula given in Equation (5) [19]:
I E = 1 R p 0 R p × 100
where R p 0 stands for the polarization resistance without the additives and Rp stands for the polarization resistance in the presence of the additives. The derived values are also presented in Table 2. The corrosion inhibition efficiency increases with increase in inhibitor dosage, reaching the peak values of 89.52, 90.35, and 90.16% at the optimum studied concentration (0.5%) of CHT0.5–CuO, CHT1.0–CuO and CHT2.0–CuO nanocomposites, respectively. The values of the double-layer capacitance (Cdl) determined using Brug’s formula given in Equation (6) [45,46,47] are also listed in Table 3, which is acceptable for this type of nonideally polarized electrode where charge transfer primarily controls the corrosion phenomenon.
C d l = Y d l 1 / n d l 1 R s + 1 R c t ( n d l 1 / n d l )
The results in the table show that adding inhibitors to the corrodent lowers Cdl values. This has been associated with a reduction of dielectric constant and/or an enlargement in double layer thickness because of inhibitor adsorption onto the steel–solution interface, thus protecting the metal from corrosion [48].
The IE values obtained from the PDP and EIS methods differ, with the EIS technique being more pronounced than the PDP technique. The impact of the applied potential on the inhibitor action could explain the differences in data obtained from EIS and PDP measurements. The working electrode in EIS measurements was under OCP, while the working electrode in PDP assessment was polarized, according to Pereira et al. [49].

3.4. Temperature Effect

Temperature is an essential kinetic element that affects the rate of metal corrosion and inhibitor adsorption on the surface of the electrode. Gravimetric tests were performed at 25, 40, 50, and 60 °C utilizing the optimal concentration (0.5%) of the nanocomposites studied to evaluate the impact of temperature on the corrosion inhibitive performance of CHT–CuO nanocomposite containing varied amounts of chitosan. The acquired findings are shown in Figure 5. Figure 5 shows that in the presence of the nanocomposites, the rate of corrosion of X60 steel in 5% HCl decreased as compared with the blank solution at 25 °C. However, as the temperature rises from 40 to 60 °C, corrosion rate values increase both the absence and presence of nanocomposites, with the maximum corrosion rates noticed at 60 °C (Figure 6a). This observation, as described by Mobin et al. [50], is probably ascribed to a stepping up of thermal agitation of the medium’s molecules, as well as an increase in conductivity and therefore the medium’s corrosive activity. As the temperature was raised from 25 to 40 °C, inhibition efficiency increased, then decreased as the temperature was elevated to 50 and 60 °C. At 40 °C, the CHT1.0–CuO nanocomposite had the maximum inhibitory efficiency of about 72%. A chemisorption mechanism involving inhibitor and the Fe surface atoms empty low-energy d-orbitals [50] is primarily accountable for the increased IE as the temperature goes up. On the other hand, the decreased inhibition performance of the nanocomposites at elevated temperatures could be attributable to the desorption of the adsorbed inhibitor on the metal’s surface due to increased thermal agitation.

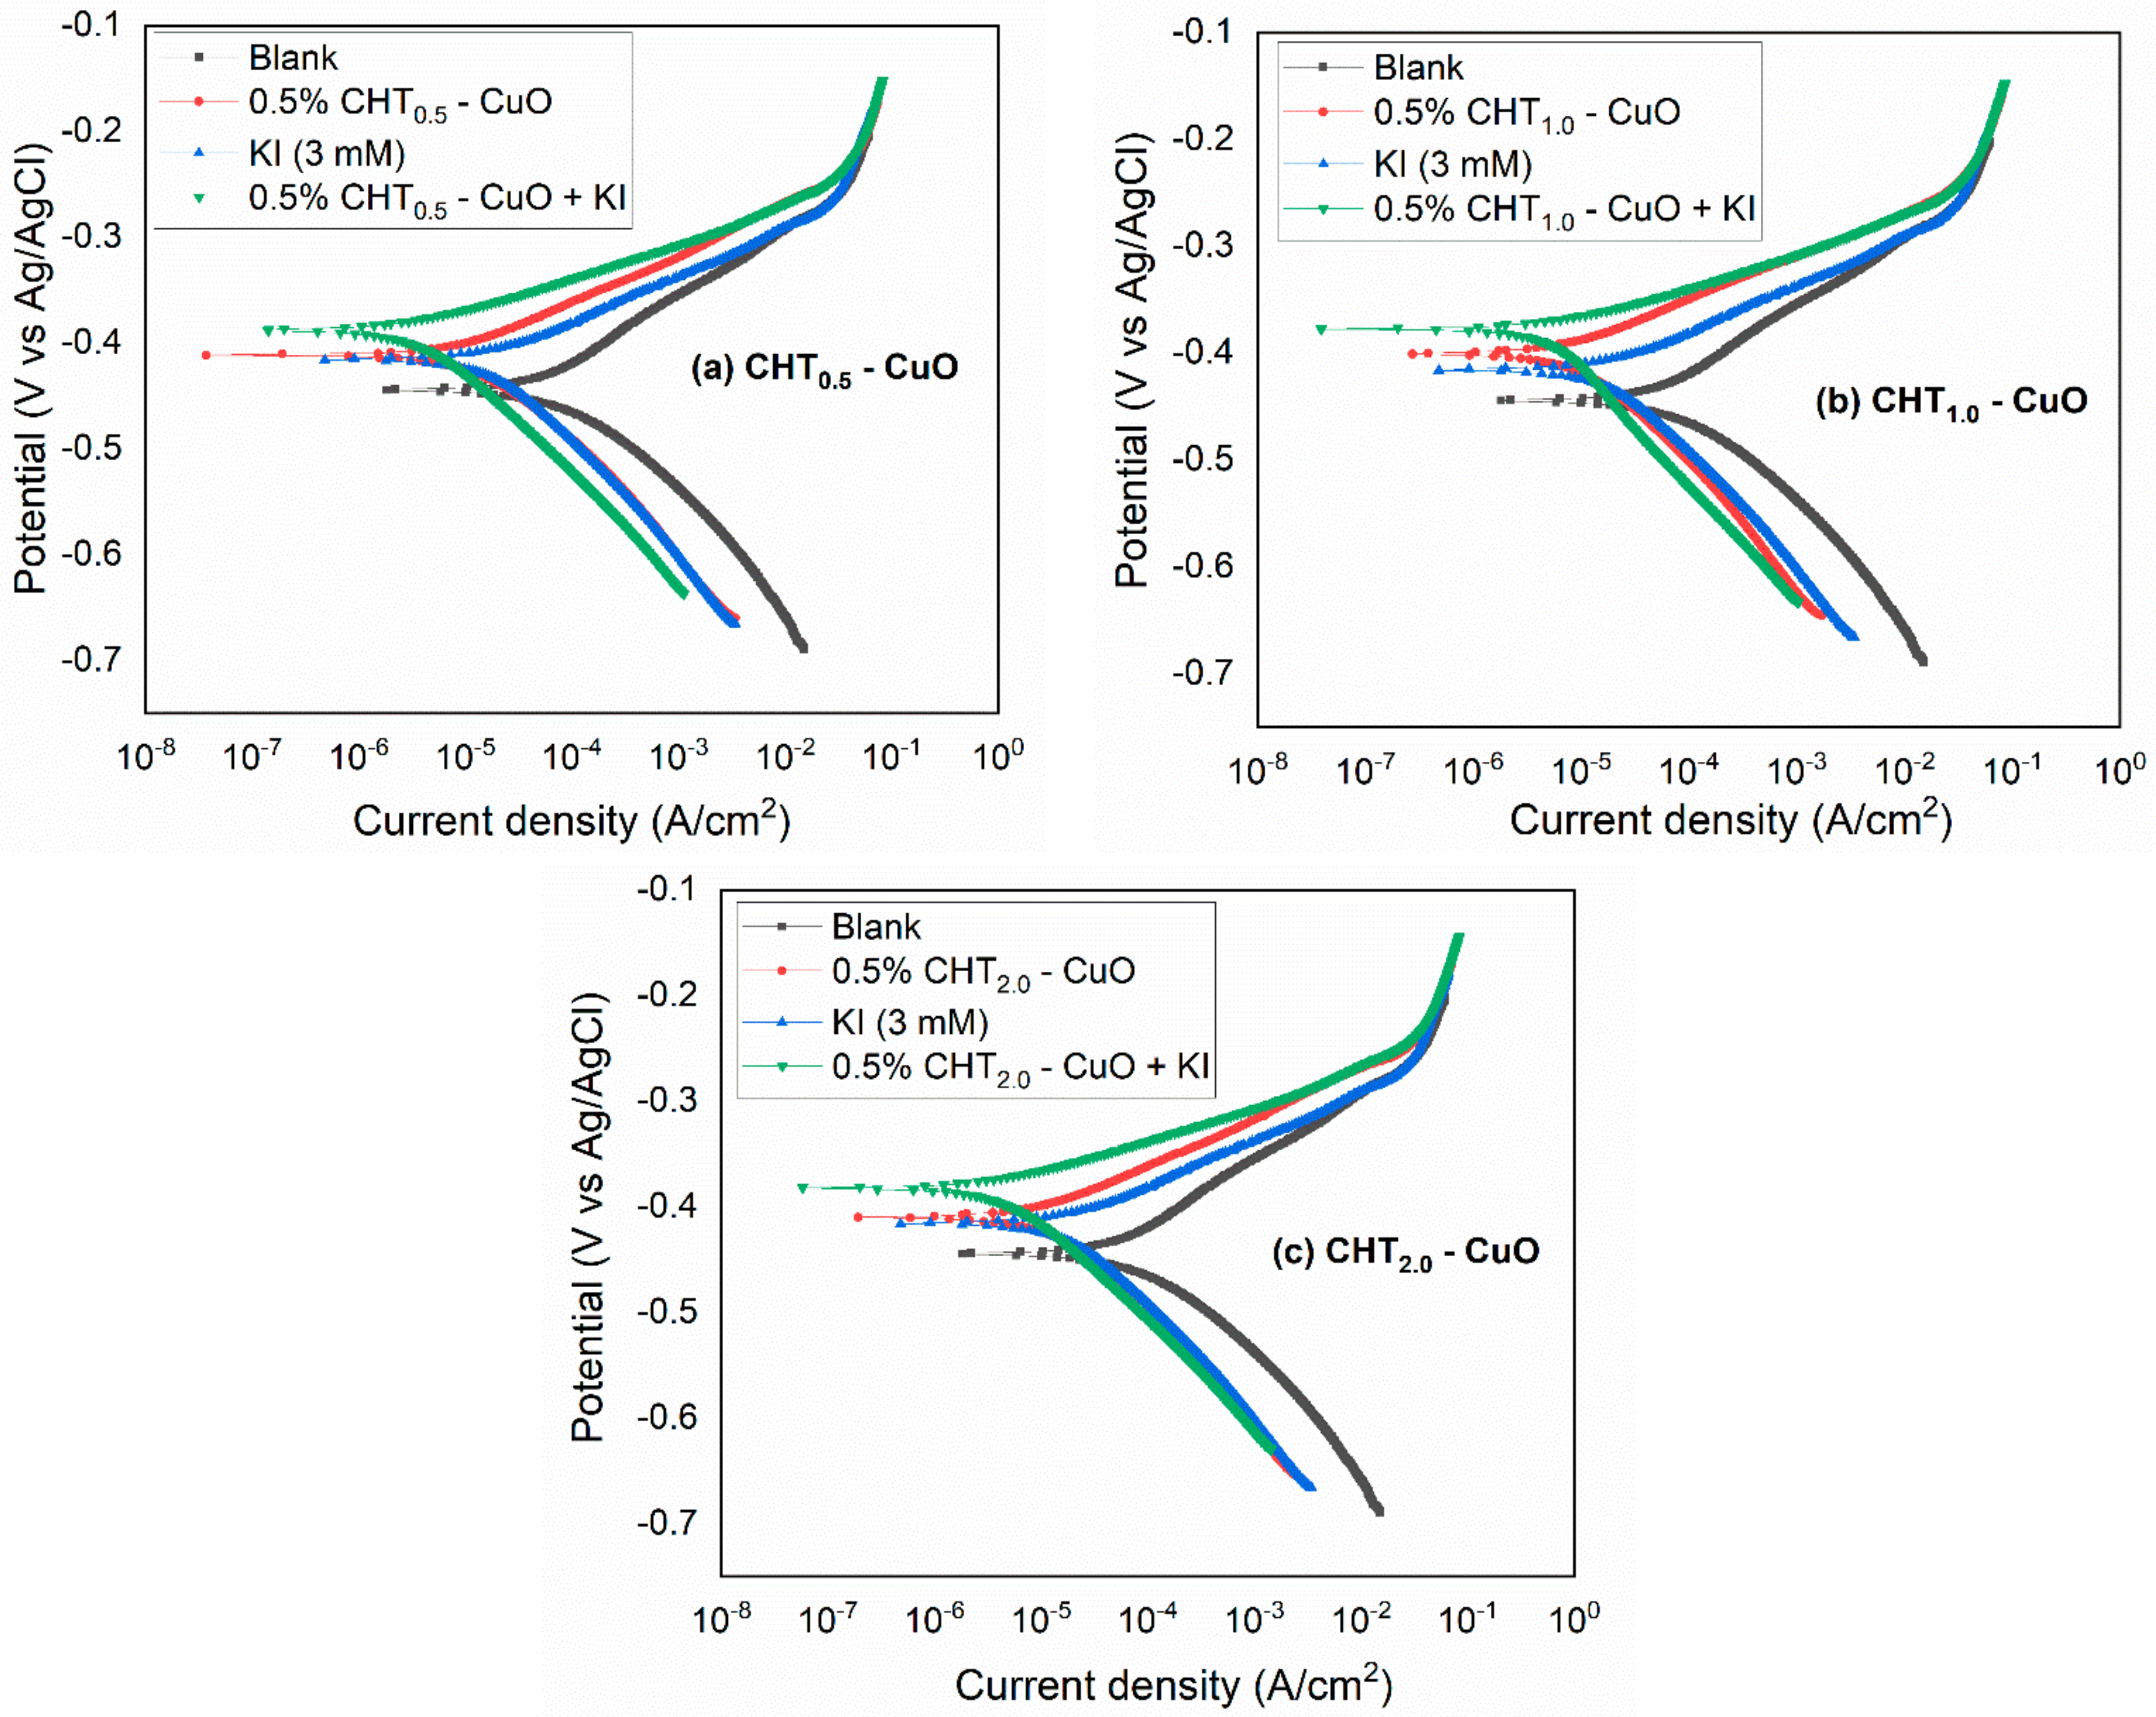
3.5. Effect of KI on CHT–CuO Nanocomposites Performance

The corrosion inhibition efficiency of CHT–CuO nanocomposites has previously been demonstrated to rise with increasing concentration, with the maximum IE attained at the optimum CHT–CuO dosage (0.5%) assessed in this study. As a result, the concentration of 3 mM KI was chosen to evaluate corrosion inhibitive effectiveness. The effect of adding KI on the corrosion inhibitive performance of the nanocomposites was evaluated using weight loss at 25 and 60 °C and electrochemical methods at 25 °C. Figure 6 depicts PDP curves for X60 steel in 5% HCl without, 0.5% CHT–CuO nanocomposite with different amounts of chitosan, 3 mM KI, and the nanocomposites in combination with 3 mM KI at 25 °C. Presented in Table 3 are the corrosion kinetic parameters derived from the PDP curves. The addition of KI to the nanocomposites shifts the corrosion potentials to noble values (Figure 6 and Table 3). From Table 3, the Icorr is noted to decrease from 11.73, 9.75 and 11.80 µA cm–2 to 5.16, 3.32 and 4.07 µA cm–2 by adding 3 mM KI to 0.5% CHT–CuO nanocomposite containing 0.5, 1.0 and 2.0 g chitosan, respectively. This corresponds to inhibition efficiency increases from 83.98, 86.68 and 83.88% to 92.95, 95.46 and 94.44%, respectively. The computed values of fa and fc displayed in Table 3 also indicate that in the presence of KI, the mechanism of inhibition of corrosion by the nanocomposites is by active site blocking since the values are smaller than 1.
Using EIS technique, the effect of adding KI on the corrosion inhibition performance of nanocomposites was also examined. In both Nyquist and Bode formats, the impedance of X60 steel in uninhibited and inhibited 5% HCl containing 0.5% nanocomposite, 3 mM KI, and nanocomposite in combination with 3 mM KI is shown in Figure 7. A single capacitive loop characterized the Nyquist curves, corresponding to a one time constant in the Bode modulus representation, as seen in the presence of nanocomposites having varying concentrations of chitosan alone. The form of the curves in the Nyquist plots for the inhibited solutions containing nanocomposites and nanocomposite + KI blends remained invariable, showing that KI addition to the nanocomposites had no effect on the corrosion mechanism. The diameter of capacitive loops in the presence of nanocomposites + KI is larger than that of KI and nanocomposites alone (Figure 7), signifying a higher Rct at the metal–electrolyte interface [51]. Displayed in Table 4 are the electrochemical parameters that were derived utilizing the equivalent circuit depicted in Figure 4b to fit the experimental data for the nanocomposites + KI mixtures. Table 4 shows that the Rct is higher in the presence of nanocomposites alone than in the lack of nanocomposites, and even higher in the presence of nanocomposites in conjunction with KI. Table 4 shows that the IE values rise in the combined nanocomposites + KI inhibited systems compared with the systems inhibited by nanocomposites alone, following the trend reported for PDP and LPR tests. Again, with varying amount of chitosan in the nanocomposites, the order of corrosion prevention performance is observed as follows: CHT1.0–CuO > CHT0.5–CuO > CHT2.0–CuO.
The effect of KI addition on the corrosion inhibitive capacity of the nanocomposites was evaluated using a gravimetric technique at 25 and 60 °C. The results acquired are displayed in Table 5. The data in the table reveal that the corrosion rate was diminished in the inhibited acid containing the nanocomposites in comparison with the uninhibited solution and further reduction occurs upon addition of KI to the nanocomposites. As expected, corrosion rates increased with temperature rise from 25 to 60 °C both in the uninhibited and inhibited acid containing the nanocomposites alone and nanocomposites + KI mixtures. Also, a corresponding increase in IE was observed with the addition of KI with a profound effect noticed at 60 °C. For instance, at 60 °C the IE of CHT–CuO nanocomposite containing 0.5, 1.0 and 2.0 g chitosan is 28.50, 46.99 and 39.42%, respectively, and, with addition of 3 mM KI to the nanocomposites, the IE surged to 72.49, 74.76 and 71.71%, respectively. It is visible from the table that IE declined with increase in temperature for the nanocomposites alone. Interestingly, addition of KI to the nanocomposites caused an increase in IE as the temperature was raised from 25 to 60 °C. As an example, at 25 °C the IE upon addition of KI to the nanocomposites containing 0.5, 1.0 and 2.0 g of chitosan is 68.00, 72.80 and 62.40%, respectively, and at 60 °C the IE increases to 72.49, 74.76 and 71.71%, respectively. This suggests that the KI addition alters the inhibition mechanism from physisorption to chemisorption.
Many parameters, including inhibitor dosage, immersion duration, temperature, corrosive environment, and the state of the metal’s surface, are identified as influencing the corrosion inhibition performance of corrosion inhibitors. The findings of this study reveal that immersion duration and temperature are important factors influencing the inhibitive properties of the nanocomposites when used in combination with KI. In the electrochemical tests, the samples were submerged for a short duration (60 min) and at 25 °C. The duration is short and corrosion rates obtained are instantaneous values. On the other hand, the weight loss measurements samples were immersed for 24 h and the values of corrosion rates obtained from such prolonged exposure are average values. Also, it is seen that IE of the nanocomposites in combination with KI increased with an increase in temperature. The two parameters established to influence the IE of the nanocomposites + KI mixes are increased immersion duration and temperature.
The synergistic parameter (S1) was computed based on the degree of surface coverage (θ) utilizing the formula given in Equation (7); first used by Aramaki and Hackerman [52] and afterwards by various investigators [50,51,53] to assess the kind of effect existing between CHT–CuO nanocomposites and KI utilized as inhibitors for X60 steel in 5% hydrochloric acid as corrodent:
S 1 = 1 θ 1 + 2 1 θ 1 + 2
where θ1+2 = (θ1 + θ2) − (θ1θ2), θ1 stands for the surface coverage of CHT–CuO, θ2 stands for the surface coverage of KI and θ1+2 stands for the overall surface coverage of CHT–CuO + KI. S1 greater than 1 show that the selected inhibitors’ combination has a synergistic impact, whilst S1 less than 1 indicates and antagonistic effect and S1 equal to 1 indicates a lack of interaction between the two additives. Table 6 presents the determined synergistic parameter values using various experimental approaches and reveals that, while the KI addition improves the corrosion inhibition efficacy of the nanocomposites, its effect is not synergistic, as the values of S1 from all the experimental techniques (PDP, LPR, EIS, and weight loss) are less than unity. The values are greater for weight loss method particularly at 60 °C in comparison with other experimental methods. Temperature and immersion time have a significant impact on the effect of adding KI to CHT–CuO nanocomposite. The prolonged immersion duration in the weight loss measurements assure that the inhibitors’ molecules adsorb more effectively on the metal surface, resulting in a larger surface area covered and hence greater IE.
The co-adsorption of the two additives, which can be competitive or cooperative, is commonly linked to synergistic corrosion inhibition behaviour between mixture formulations [54]. Competitive adsorption occurs when the anion and cation are adsorbed at different sites on the metal surface, whereas co-operative adsorption occurs when the anion is chemisorbed first, and the cation is adsorbed on the anion’s layer. Simultaneous competitive and cooperative adsorption may occur in some instances [55]. The mechanism of non-synergistic behaviour seen in this study between the nanocomposites and KI is unknown, and a more detailed investigation may be required to fully understand this phenomenon. The CuO nanoparticles having high surface area to volume ratio is expected to be chemisorbed and decrease the hydrophilicity of the metal surface [54], with the consequence of promoting the adsorption of the nanocomposites. However, KI presence may hinder the chemisorption of CuO and increase the hydrophilicity of the metal due to competitive adsorption of the CuO nanoparticles and KI on the metal surface. This results in the incremental adsorption of the nanocomposites, hence the antagonistic behaviour of KI addition.

3.6. Surface Assessments

Figure 8a–f show the surface morphology of X60 carbon steel specimens in the following states: (a) abraded condition, (b) in uninhibited acid solution (5% HCl), (c) inhibited acid solution containing 0.5% CHT0.5–CuO nanocomposite, (d) in acid solution containing 0.5% CHT1.0–CuO nanocomposite, (e) in acid solution containing 0.5% CHT0.5–CuO + 3 mM KI and (f) in acid solution containing 0.5% CHT1.0–CuO + 3 mM KI. The X60 carbon steel surface appeared very smooth in the polished state (Figure 8a). However, the surface changed dramatically when exposed to the corrodent (Figure 8b). As a consequence of the acid’s intense attack, the surface seems rough. The acid attack appears to be rather uniform with no evidence of localized corrosion. The surfaces in Figure 8c–f show a reasonably smooth surface with evidence of adsorbate on the surface in comparison with Figure 8b. The additives diminished the active surface area of the steel exposed to the corrodent due to it being adsorbed on the metal surface.
EDS composition analysis revealed the formation of a protective film and the presence of organic compounds on the X60 carbon steel surface. The EDS spectra of the X60 steel immersed in uninhibited 5% HCl corrodent and inhibited acid containing 0.5% CHT1.0–CuO nanocomposite for 24 h are shown in Figure 9. The distinctive peaks of Fe, C, and other elements that make up low carbon steel can be seen in the EDS spectrum for the abraded sample (Figure 9a). In comparison with the abraded specimen, the EDS spectra of the sample immersed in uninhibited 5% HCl corrodent demonstrated a decrease in the atomic percentage of the elements, specifically Fe. The breakdown of the Fe due to corrosion attack by the acid is the root cause. Furthermore, the EDS spectra revealed extra signal due to O and Cl atoms. The corrosive medium is the source of the Cl atom, and the O emanates from the oxide layer formed by the corrosion of X60 carbon steel. The EDS spectra in the presence of CHT1.0–CuO nanocomposite and CHT1.0–CuO nanocomposite + 3 mM KI demonstrates that the atomic percentage of Fe was enhanced in comparison with the uninhibited corrodent. There is also an extra element of Cu, which comes from the nanocomposite’s adsorption. This shows that the nanocomposite was adsorbed on the metal surface to form a protective film that hinders Fe from further dissolution.
A 3D optical profilometer was used to assess the surface roughness of the exposed area of steel specimens immersed in the uninhibited and inhibited solution containing the additives (CHT–CuO nanocomposite and CHT–CuO nanocomposite + KI). Figure 10 depicts the 3D profilometer images revealing the surface texture and profile of the exposed areas. Figure 10b shows that the specimens submerged in the uninhibited corrodent suffered significantly more surface damage than the abraded specimen (Figure 10a). In comparison to the blank (Figure 10b), the specimens immersed in the inhibited acid containing CHT–CuO nanocomposite and CHT–CuO nanocomposite + KI (Figure 10c–f) showed substantially less surface damage. Displayed in Table 7 are the mean roughness parameters for the arithmetic mean (RA), root-mean-square (RRMS), and maximum peak-to-minimum valley (RT) values, also known as surface roughness parameters, which are employed to quantify surface deterioration. Higher surface roughness values indicate more corrosion-related surface degradation. At 25 °C, the specimens immersed in the uninhibited corrodent had RA, RRMS, and RT values that were roughly five times greater than the polished coupon. The arithmetic mean (RA) of CHT–CuO and CHT–CuO nanocomposite + KI drops from 0.384 µm (RA of uninhibited corrodent at 25 °C) to 0.128 and 0.124 µm for CHT0.5–CuO and CHT1.0–CuO nanocomposites, respectively, and to 0.116 and 0.104 µm for the corresponding nanocomposites in combination with KI. Other surface roughness parameters were also lowered. In comparison with the CHT–CuO nanocomposite, the CHT–CuO nanocomposite + KI can be judged to be more protective and show greater corrosion inhibitive performance based on RA, which is a frequently utilized measure for surface roughness determination. This finding is consistent with the gravimetric and electrochemical measurements, indicating that the X60 steel corrosion resistance has improved in the inhibited acid containing CHT–CuO nanocomposite + KI.

4. Conclusions

The corrosion inhibition performance of OLE-mediated synthesis of CHT–CuO nanocomposite containing different amounts of chitosan (0.5, 1.0 and 2.0 g) on X60 carbon steel in 5% HCl acid corrodent was assessed employing weight loss and electrochemical techniques. The effect of temperature and KI addition (3 mM) on the corrosion inhibition efficacy of the nanocomposites was also examined. The conclusions that can be drawn based on the findings of these studies are as follows.
(a)
The OLE-mediated CHT–CuO nanocomposites act as an effective corrosion inhibitor for X60 carbon steel in 5% HCl solution. IE increases with increase in concentration of the nanocomposite. The order of corrosion protection performance is found to follow the order CHT1.0–CuO (90.35%) > CHT0.5–CuO (90.16%) > CHT2.0–CuO (89.52%) nanocomposite from impedance measurements.
(b)
Increase in IE of the nanocomposites was observed with temperature rise from 25 to 40 °C. Thereafter, further increase in temperature to 50 and 60 °C causes a decrease in IE.
(c)
Addition of KI to the nanocomposites resulted in improved corrosion inhibition performance which could not be ascribed to synergistic effect. The non-synergistic inhibition effect was confirmed from the calculated synergism parameter which was found to be less than unity with values of 0.89, 0.74 and 0.75 for CHT0.5–CuO, CHT1.0–CuO and CHT2.0–CuO nanocomposites respectively at 60 °C.
(d)
Also, the addition of KI induced a change in corrosion inhibition mechanism from physisorption to chemisorption based on the increase in IE from 68.0, 72.8 and 62.4% at 25 °C to 72.5, 74.7 and 71.7% at 60 °C for CHT0.5–CuO, CHT1.0–CuO and CHT2.0–CuO nanocomposites respectively.
(e)
The potentiodynamic polarization results suggest that the nanocomposites alone and in combination with KI inhibited the corrosion of X60 carbon steel by active site blocking mechanism.
(f)
The results from all the experimental techniques viz weight loss, EIS, LPR and PDP are in good agreement.
(g)
Surface assessments of the corroded X60 carbon steel specimens in the blank corrodent, in the corrodent containing nanocomposites alone, and in the corrodent with KI addition, were undertaken using a 3D optical profilometer. These assessments confirm the additives’ corrosion inhibitive effect based on the reduction in surface roughness parameters in the additive’s presence in comparison to the blank.
(h)
As a future perspective, we propose the evaluation of the prepared nanocomposites as sweet (CO2) and sour (H2S) corrosion inhibitors as well as biocides for microbial influenced corrosion (MIC) mitigation.

Author Contributions

Conceptualization, D.K. and S.A.U.; methodology, P.S.U., S.A.U. and D.K.; validation, D.K. and S.A.U.; formal analysis, P.S.U. and S.A.U.; investigation, P.S.U.; resources, D.K. and S.A.U.; data curation, P.S.U.; writing—original draft preparation, P.S.U.; writing—review and editing, S.A.U. and D.K.; supervision, D.K. and S.A.U.; project administration, D.K. and S.A.U. All authors have read and agreed to the published version of the manuscript.

Funding

This research received no external funding.

Institutional Review Board Statement

Not applicable.

Informed Consent Statement

Not applicable.

Data Availability Statement

The data presented in this study are available on request from the corresponding authors.

Conflicts of Interest

The authors declare no conflict of interest.

References

  1. Abbasov, V.M.; Abd El-Lateef, H.M.; Aliyeva, L.I.; Ismayilov, I.T.; Qasimov, E.E.; Narmin, M.M. Efficient complex surfactants from the type of fatty acids as corrosion inhibitors for mild steel C1018 in CO2-environments. J. Korean Chem. Soc. 2013, 57, 25–34. [Google Scholar] [CrossRef] [Green Version]
  2. Osokogwu, U.; Oghenekaro, E. Evaluation of corrosion inhibitors effectiveness in oilfield production operations. Int. J. Sci. Technol. Res. 2012, 1, 19–23. [Google Scholar]
  3. Kumar, H.; Yadav, V. Corrosion characteristics of mild steel under different atmospheric by vapour phase corrosion inhibitors. Am. J. Mater. Sci. Eng. 2013, 1, 34–39. [Google Scholar]
  4. Desimone, M.; Grundmeier, G.; Gordillo, G.; Simison, S. Amphiphilic amido-amine as an effective corrosion inhibitor for mild steel exposed to CO2 saturated solution: Polarization, EIS and PM-IRRAS studies. Electrochim. Acta 2011, 56, 2990–2998. [Google Scholar] [CrossRef]
  5. Gunavathy, N.; Murugavel, S. Corrosion inhibition studies of mild steel in acid medium using musa acuminata fruit peel extract. E-J. Chem. 2012, 9, 487–495. [Google Scholar] [CrossRef] [Green Version]
  6. Lopez, D.A.; Simison, S.N.; de Sanchez, S.R. Inhibitors performance in CO2 corrosion: EIS studies on the interaction between their molecular structure and steel microstructure. Corros. Sci. 2005, 47, 735–755. [Google Scholar] [CrossRef]
  7. Abbasov, V.M.; Gadjiyeva, S.R.; Magerramov, R.S.; Akhmedov, N.S.; Rasulov, S. Influence of potassium salts of nitro derivative high α-olefins in 1% NaCl solution saturated with CO2 on steel corrosion. Azerbaijani Oil Ind. 2010, 8, 1–4. [Google Scholar]
  8. Benton, W.J.; Koskan, L.P. Inhibtion of Carbon Dioxide Corrosion of Metals. U.S. Patent 5607623 A 4 March 1997. [Google Scholar]
  9. Umoren, S.A.; Solomon, M.M. Recent Developments on the Use of Polymers as Corrosion Inhibitors -A Review. Open Mater. Sci. J. 2014, 8, 39–54. [Google Scholar] [CrossRef]
  10. Negm, N.A.; Yousef, M.A.; Tawfik, M. Impact of synthesized and natural compounds in corrosion inhibition of carbon steel and aluminium in acidic media. Recent Pat. Corros. Sci. 2013, 3, 58–68. [Google Scholar]
  11. Solomon, M.M.; Umoren, S.A.; Udosoro, I.I.; Udoh, A.P. Inhibitive and adsorption of carboxymethyl cellulose on mild steel corrosion in sulphuric acid. Solution. Corros. Sci. 2010, 52, 1317–1325. [Google Scholar] [CrossRef]
  12. Rajeswari, V.; Kesavan, D.; Gopiraman, M.; Viswanathamurthi, P. Physicochemical of glucose, gellan gum, and hydroxypropyl cellulose—Inhibition of cast iron corrosion. Carbohydr. Polym. 2013, 95, 288–294. [Google Scholar] [CrossRef] [PubMed]
  13. Fares, M.M.; Maayta, A.K.; Al-Mustafa, J.A. Corrosion inhibition of iota-carrageenan natural polymer on aluminum in presence of zwitterions mediator in HCl media. Corros. Sci. 2012, 65, 223–230. [Google Scholar] [CrossRef]
  14. Mobin, M.; Rizvi, M. Inhibitory effect of xanthan gum and synergistic surfactant additives for mild steel corrosion in 1 M HCl. Carbohydr. Polym. 2016, 136, 384–393. [Google Scholar] [CrossRef] [PubMed]
  15. Biswas, A.; Pal, S.; Udayabhanu, G. Experimental and theoretical studies of xanthan gum and its graft co-polymer as corrosion inhibitor for mild steel in15% HCl. Appl. Surf. Sci. 2015, 353, 173–183. [Google Scholar] [CrossRef]
  16. Umoren, S.A.; Solomon, M.M.; Udosoro, I.I.; Udoh, A.P. Synergistic and antagonistic effects between halide ions and carboxymethyl cellulose for the corrosion inhibition of mild steel in sulphuric acid solution. Cellulose 2010, 17, 635–648. [Google Scholar] [CrossRef]
  17. Banerjee, S.; Srivastava, V.; Singh, M.M. Chemically modified natural polysaccharide as green corrosion inhibitor for mild steel in acidic medium. Corros. Sci. 2012, 59, 35–41. [Google Scholar] [CrossRef]
  18. Hefni, H.H.H.; Azzam, E.M.; Badr, E.A.; Hussein, M.; Tawfik, S.M. Synthesis, characterization and anticorrosion potentials of chitosan-g-PEG assembled on silver nanoparticles. Int. J. Biol. Macromol. 2016, 83, 297–305. [Google Scholar] [CrossRef]
  19. Solomon, M.M.; Gerengi, H.; Kaya, T.; Umoren, S.A. Performance evaluation of a chitosan/silver nanoparticles composite on St37 steel corrosion in a 15% HCl solution. ACS Sustain. Chem. Eng. 2017, 5, 809–820. [Google Scholar] [CrossRef]
  20. Solomon, M.M.; Gerengi, H.; Kaya, T.; Umoren, S.A. Enhanced corrosion inhibition of chitosan for St37 in 15% H2SO4 environment by silver nanoparticles. Int. J. Biol. Macromol. 2017, 104, 638–649. [Google Scholar] [CrossRef]
  21. Srivastava, M.; Srivastava, S.; Ji, G.; Prakash, R. Chitosan based new nanocomposites for corrosion protection of mild steel in aggressive chloride media. Int. J. Biol. Macromol. 2019, 140, 177–187. [Google Scholar] [CrossRef]
  22. Fetouh, H.; Hefnawy, A.; Attia, A.; Ali, E. Facile and low-cost green synthesis of eco-friendly chitosan-silver nanocomposite as novel and promising corrosion inhibitor for mild steel in chilled water circuits. J. Mol. Liq. 2020, 319, 114355. [Google Scholar] [CrossRef]
  23. Solomon, M.M.; Gerengi, H.; Umoren, S.A. Carboxymethyl cellulose/silver nanoparticles composite: Synthesis, characterization and application as a benign corrosion inhibitor for st37 steel in 15% H2SO4 medium. ACS Appl. Mater. Interf. 2017, 9, 6376–6389. [Google Scholar] [CrossRef] [PubMed]
  24. Abd El-Lateef, H.M.; Albokheet, W.; Gouda, M. Carboxymethyl cellulose/metal (Fe, Cu Ni) nanocomposites as non-precious inhibitors of C-steel corrosion in HCl solutions: Synthesis, characterization, electrochemical and surface morphology studies. Cellulose 2020, 27, 8039–8057. [Google Scholar] [CrossRef]
  25. El-Lateef, H.M.; Albokheet, W.A.; Gouda, M. Enhancement of corrosion protection of mild steel by chitosan/ZnO nanoparticle composite membranes. Prog. Organ. Coat. 2015, 84, 28–34. [Google Scholar]
  26. Li, X.; Deng, S.; Fu, H.; Mu, G. Synergism between rare earth cerium (IV) in and vanillin on the corrosion of cold rolled steel in 1 M HCl solution. Corros. Sci. 2008, 50, 3599–3609. [Google Scholar] [CrossRef]
  27. Telegdi, J.; Shaglouf, M.M.; Shaban, A.; Karman, F.H.; Betroti, I.; Mohai, M.; Kalman, E. Influence of cations on the corrosion inhibition efficiency of aminophosphoric acid. Electrochim. Acta 2001, 46, 3791–3799. [Google Scholar] [CrossRef]
  28. Zhang, D.Q.; Cai, Q.R.; He, X.M.; Gao, L.X.; Kim, G.S. Corrosion inhibition and adsorption behavior of methionine on copper in HCl and synergistic effect of zinc ions. Mater. Chem. Phys. 2009, 114, 612–617. [Google Scholar] [CrossRef]
  29. Larabi, L.; Harek, Y.; Traisnel, M.; Mansri, A. Synergistic influence of poly (4-vinylpyridine) and potassium iodide on inhibition of corrosion of mild steel in 1 M HCl. J. Appl. Electrochem. 2004, 34, 833–839. [Google Scholar] [CrossRef]
  30. Umoren, S.A.; Ebenso, E.E. The synergistic effect of polyacrylamide and iodide ions on the corrosion inhibition of mild steel in H2SO4. Mater. Chem. Phys. 2007, 106, 387–393. [Google Scholar] [CrossRef]
  31. Usman, B.J.; Umoren, S.A.; Gasem, Z.M. Inhibition of API 5L X60 steel corrosion in CO2 –saturated 3.5% NaCl solution by tannic acid and synergistic effect of KI additive. J. Mol. Liq. 2017, 237, 146–156. [Google Scholar] [CrossRef]
  32. Umoren, P.S.; Kavaz, D.; Nzila, A.; Sankaran, S.S.; Umoren, S.A. Biogenic synthesis and characterization of chitosan-CuO nanocomposite and evaluation of antibacterial activity against gram positive and negative bacteria. Polymers 2022, 14, 1832. [Google Scholar] [CrossRef] [PubMed]
  33. ASTM International. Standard Practice for Preparing, Cleaning, and Evaluating Corrosion Test; ASTM International: West Conshohocken, PA, USA, 1999. [Google Scholar]
  34. Zeino, A.; Abdulazeez, I.; Khaled, M.; Jawish, M.W.; Obot, I.B.; Alhooshani, K. Mechanistic study of polyepoxy succinic acid (PESA) as green corrosion inhibitor on carbon steel in aerated nacl solution. Mater. Today Commun. 2021, 29, 102848. [Google Scholar] [CrossRef]
  35. Kousar, K.; Walczak, M.S.; Ljungdahl, T.; Wetzel, A.; Oskarsson, H.; Restuccia, P.; Ahmad, A.; Harrison, N.M.; Lindsay, R. Corrosion inhibition of carbon steel in hydrochloric acid: Elucidating the performance of an imidazoline-based surfactant. Corros. Sci. 2021, 180, 109195. [Google Scholar] [CrossRef]
  36. Arellanes-Lozada, P.; Díaz-Jiménez, V.; Hernández-Cocoletzi, H.; Nava, N.; Olivares Xometl, O.; Likhanova, N.V. Corrosion inhibition properties of iodide ionic liquids for API 5L X52 steel in acid medium. Corros. Sci. 2020, 175, 108888. [Google Scholar] [CrossRef]
  37. Cao, C. On electrochemical techniques for interface inhibitor research. Corros. Sci. 1996, 38, 2073–2082. [Google Scholar] [CrossRef]
  38. Umoren, S.A.; Solomon, M.M.; Obot, I.B.; Suleiman, R.K. Effect of intensifier additives on the performance of butanolic extract of date palm leaves against the corrosion of API 5L X60 carbon steel in 15 wt.% HCl solution. Sustainability 2021, 13, 5569. [Google Scholar] [CrossRef]
  39. Umoren, S.A. Polypropylene glycol: A novel corrosion inhibitor for X60 pipeline steel in 15% HCl solution. J. Mol. Liq. 2016, 219, 946–958. [Google Scholar] [CrossRef]
  40. Li, X.; Deng, S.; Xie, X. Experimental and theoretical study on corrosion inhibition of oxime compounds for aluminium in HCl solution. Corros. Sci. 2014, 81, 162–175. [Google Scholar]
  41. Zhang, Z.; Tian, N.C.; Huang, X.D.; Shang, W.; Wu, L. Synergistic inhibition of carbon steel corrosion in 0.5 M HCl solution by indigo carmine and some cationic organic compounds: Experimental and theoretical studies. RSC Adv. 2016, 6, 22250–22268. [Google Scholar] [CrossRef]
  42. Appa Rao, B.V.; Srinivasa Rao, S. Electrochemical and surface analytical studies of synergistic effect of phosphonate, Zn2+ and ascorbate in corrosion control of carbon steel. Mater. Corros. 2010, 61, 285–301. [Google Scholar]
  43. Jüttner, K. Electrochemical impedance spectroscopy (EIS) of corrosion processes on inhomogeneous surfaces. Electrochim. Acta 1990, 35, 1501–1508. [Google Scholar] [CrossRef]
  44. Du, Y.-T.; Wang, H.-L.; Chen, Y.-R.; Qi, H.-P.; Jiang, W.-F. Synthesis of baicalin derivatives as eco-friendly green corrosion inhibitors for aluminum in hydrochloric acid solution. Environ. Chem. Eng. 2017, 5, 5891–5901. [Google Scholar] [CrossRef]
  45. Brug, G.J.; van den Eeden, A.L.G.; Sluyters-Rehbach, M.; Sluyters, J.H. The analysis of electrode impedances complicated by the presence of a constant phase element. J. Electroanal. Chem. 1984, 176, 275–295. [Google Scholar] [CrossRef]
  46. Koh, E.; Park, S. Self-anticorrosion performance efficiency of renewable dimer-acid-based polyol microcapsules containing corrosion inhibitors with two triazole groups. Prog. Organ. Coat. 2017, 109, 61–69. [Google Scholar] [CrossRef]
  47. Wazzan, N.; Obot, I.B.; Fagieh, T.M. The role of some triazoles on the corrosion inhibition of C1020 steel and copper in a desalination descaling solution. Desalination 2022, 527, 115551. [Google Scholar] [CrossRef]
  48. Hussin, M.H.; Kassim, M.J. The corrosion inhibition and adsorption behavior of Uncaria gambir extract on mild steel in 1 M HCl. Mater. Chem. Phys. 2011, 125, 461–468. [Google Scholar] [CrossRef]
  49. de Assunção Araújo Pereira, S.S.; Pêgas, M.M.; Fernández, T.L.; Magalhães, M.; Schöntag, T.G.; Lago, D.C.; de Senna, L.F.; D’Elia, E. Inhibitory action of aqueous garlic peel extract on the corrosion of carbon steel in HCl solution. Corros. Sci. 2012, 65, 360–366. [Google Scholar] [CrossRef]
  50. Mobin, M.; Zehra, S.; Aslam, R. L-Phenylalaninemethyl ester hydrochloride as a green corrosion inhibitor for mild steel in hydrochloric acid solution and the effect of surfactant additive. RSC Adv. 2016, 6, 5890–5902. [Google Scholar] [CrossRef]
  51. Roy, P.; Pal, A.; Sukul, D. Origin of the synergistic effect between polysaccharide and thiourea towards adsorption and corrosion inhibition for mild steel in sulphuric acid. RSC Adv. 2014, 4, 10607–10613. [Google Scholar] [CrossRef]
  52. Aramaki, K.; Hackerman, N. Inhibition mechanism of medium-sized polymethyleneimine. J. Electrochem. Soc. 1969, 116, 568–574. [Google Scholar] [CrossRef]
  53. Jeyaprabha, C.; Sathiyanarayanan, S.; Venkatachari, G. Effect of cerium ions on corrosion inhibition of PANI for iron in 0.5 M H2SO4. Appl. Surf. Sci. 2006, 253, 432–438. [Google Scholar] [CrossRef]
  54. Umoren, S.A. Synergistic inhibition effect of polyethylene glycol-polyvinyl pyrrolidone blends for mild steel corrosion in sulphuric acid medium. J. Appl. Polym. Sci. 2011, 119, 2072–2084. [Google Scholar] [CrossRef]
  55. Okafor, P.C.; Zheng, Y. Synergistic inhibition behaviour of methylbenzyl quaternary imidazoline derivative and iodide ions on mild steel in H2SO4 solutions. Corros. Sci. 2009, 51, 850–859. [Google Scholar] [CrossRef]
Figure 1. OCP–time plot for X60 steel in 5% HCl without and with different concentration of (a) CHT0.5–CuO, (b) CHT1.0–CuO and (c) CHT2.0–CuO nanocomposites.
Sustainability 14 07981 g001aSustainability 14 07981 g001b
Figure 2. Potentiodynamic polarization plots for X60 steel in 5% HCl without and with different concentrations of (a) CHT0.5–CuO, (b) CHT1.0–CuO and (c) CHT2.0–CuO nanocomposites.
Sustainability 14 07981 g002aSustainability 14 07981 g002b
Figure 3. Impedance plots for X60 steel in 5% HCl without and with different concentration of (A(a-a)) CHT0.5–CuO, (B(b-b)) CHT1.0–CuO and (C(c-c)) CHT2.0–CuO nanocomposites in Nyquist and Bode representations.
Sustainability 14 07981 g003
Figure 4. Equivalent circuit used to fit the experimental data for (a) blank and (b) CHT–CuO nanocomposite and in combination with KI as well as representative of the fitted impedance for (c) blank and (d) 0.5% CHT0.5–CuO nanocomposite.
Sustainability 14 07981 g004
Figure 5. Plots of (a) corrosion rate and (b) inhibition efficiency for X60 steel in 5% HCl without and with (A) 0.5% of CHT0.5–CuO, (B) CHT1.0–CuO and (C) CHT2.0–CuO nanocomposites at different temperatures.
Sustainability 14 07981 g005
Figure 6. Potentiodynamic polarization plots for X60 carbon steel in 5 wt.% HCl solution without and in the presence of 0.5% (a) CHT0.5–CuO, (b) CHT1.0–CuO and (c) CHT2.0–CuO nanocomposites and in combination with KI (3 mM) at 25 °C.
Sustainability 14 07981 g006
Figure 7. Impedance plots for X60 carbon steel in 5 wt.% HCl solution without and in the presence of 0.5% for (A(a-a)) CHT0.5–CuO, (B(b-b)) CHT1.0–CuO and (C(c-c)) CHT2.0–CuO nanocomposites and in combination with 3 mM KI at 25 °C in Nyquist and Bode representations.
Sustainability 14 07981 g007aSustainability 14 07981 g007b
Figure 8. SEM micrographs of (a) polished X60 carbon steel, (b) X60 steel immersed in 5% HCl solution, (c) X60 steel immersed in 5% HCl solution in the presence of 0.5% CHT0.5–CuO nanocomposite, (d) X60 steel immersed in 5% HCl solution in the presence of 0.5% CHT1.0–CuO nanocomposite, (e) X60 steel immersed in 5% HCl solution in the presence of 0.5% CHT0.5–CuO nanocomposite + 3 mM KI and (f) X60 steel immersed in 5% HCl solution in the presence of 0.5% CHT1.0–CuO nanocomposite + 3 mM KI at 25 co. for 24 h.
Sustainability 14 07981 g008
Figure 9. EDS spectrum of (a) abraded X60 carbon steel, (b) X60 steel immersed in 5% HCl solution (c), X60 steel immersed in 5% HCl solution in the presence of 0.5% CHT1.0–CuO nanocomposite, and (d) X60 steel immersed in 5% HCl solution in the presence of 0.5% CHT1.0–CuO nanocomposite + 3 mM KI at 25 °C for 24 h.
Sustainability 14 07981 g009
Figure 10. Surface profilometer images of (a) polished X60 carbon steel, (b) X60 steel immersed in 5% HCl solution, (c) X60 steel immersed in 5% HCl solution in the presence of 0.5% CHT0.5–CuO nanocomposite, (d) X60 steel immersed in 5% HCl solution in the presence of 0.5% CHT1.0–CuO nanocomposite. (e) X60 steel immersed in 5% HCl solution in the presence of 0.5% CHT0.5–CuO nanocomposite + 3 mM KI and (f) X60 steel immersed in 5% HCl solution in the presence of 0.5% CHT1.0–CuO nanocomposite + 3 mM KI at 25 °C for 24 h.
Sustainability 14 07981 g010
Table 1. PDP and LPR parameters obtained during acid corrosion of X60 carbon steel in 5 wt.% HCl solution without and with different concentrations of CHT–CuO nanocomposite at 25 °C.
PDP Method LPR Method
System/
Concentration
−Ecorr
(mV/Ag/AgCl)
icorr
(µA cm–2)
βa
(mV dec–1)
−βc
(mV dec–1)
fafcIE (%)Rp
(Ω cm2)
IE
(%)
Blank443.973.2083.4880.25---247.73-
CHT0.5–CuO
0.1%418.014.9156.5486.090.320.2779.63880.3871.86
0.3%415.114.5654.8189.790.340.2780.11899.3672.45
0.5%409.111.7349.4190.860.320.2383.98931.7973.41
CHT1.0–CuO
0.1%418.413.1955.9581.750.280.2581.98915.8873.05
0.3%409.611.2450.6186.340.300.2384.64955.6174.07
0.5%400.19.7548.88101.610.330.2086.681174.0078.89
CHT2.0–CuO
0.1%419.214.9955.2090.410.320.2779.52795.9268.87
0.3%412.314.2551.9093.580.360.2780.53865.9671.39
0.5%409.111.8049.8792.550.320.2383.88934.4373.49
Table 2. Impedance parameters obtained during acid corrosion of X60 carbon steel in 5 wt.% HCl solution without and with different concentrations of CHT–CuO nanocomposite at 25 °C.
Conc.
(ppm)
Rs
(Ω cm2)
CPEfRf
(Ω cm2)
CPEdlRct
(Ω cm2)
(Rp = Rf + Rct)
(Ω cm2)
Cdl
(mFcm–2)
x 2
(×10–3)
IE
(%)
Yf
(µFcm–2 sn–1)
nfYdl
(µF cm–2 sn–1)
ndl
Blank1.8164.51.007.15 552.0 0.6174.8 81.95 4.505.43
CHT0.5–CuO
0.1%1.54541.00.991.91157.00.87277.9279.810.3610.6470.71
0.3% 1.65192.00.9314.76105.00.91733.7748.460.179.6589.05
0.5%1.57175.00.9415.17105.00.93766.8781.970.1510.0589.52
CHT1.0–CuO
0.1%1.56174.00.9511.36106.00.87778.2789.560.239.7889.62
0.3%1.49177.00.9510.73106.00.88832.3849.130.2111.8590.34
0.5%1.52201.00.9311.19100.00.88838.4849.590.199.8990.35
CHT2.0–CuO
0.1%1.57158.00.9317.18105.00.87733.3750.480.229.2089.08
0.3%1.57175.00.9415.17100.00.88806.6821.770.1910.0190.03
0.5%1.55169.00.9416.9094.00.88815.7832.600.189.5990.16
Table 3. PDP and LPR parameters obtained during acid corrosion of X60 carbon steel in 5 wt.% HCl solution without and in the presence of 0.5% CHT–CuO nanocomposite and in combination with KI (3 mM) at 25 °C.
PDP Method LPR Method
System/
Concentration
−Ecorr
(mV/Ag/AgCl)
icorr
(µA cm–2)
βa
(mV dec–1)
–βc
(mV dec–1)
fafcIE (%)Rp
(Ω cm2)
IE
(%)
Blank443.973.2083.4880.25---247.73-
CHT0.5-CuO409.111.7349.4190.860.320.2383.98931.7973.41
CHT1.0-CuO400.19.7548.88101.610.330.2086.681174.0078.89
CHT2.0-CuO409.111.8049.8792.550.320.2383.88934.4373.74
3 mM KI417.118.6746.59101.710.450.3374.49802.3869.13
CHT0.5-CuO + KI 378.35.1629.30117.380.660.1292.951519.0083.69
CHT1.0-CuO + KI387.83.3232.7589.590.250.0895.461950.0087.29
CHT2.0-CuO + KI382.34.0732.2988.230.370.1194.441834.0086.49
Table 4. Impedance parameters obtained during acid corrosion of X60 carbon steel in 5 wt.% HCl solution without and in the presence of 0.5% CHT–CuO nanocomposite and in combination with KI (3 mM) at 25 °C.
Conc.
(ppm)
Rs
(Ω cm2)
CPEfRf
(Ω cm2)
CPEdlRct
(Ω cm2)
(Rp = Rf + Rct)
(Ω cm2)
Cdl
(mFcm–2)
x 2
(×10–3)
IE
(%)
Yf
(µFcm–2 sn–1)
nfYdl
(µF cm–2 sn–1)
ndl
Blank1.81 64.51.007.15 552.0 0.6174.8 81.95 4.505.43
CHT0.5-CuO1.57175.00.9415.17105.00.93766.8781.970.1510.0589.52
CHT1.0-CuO 1.52201.00.9311.19100.00.88838.4849.590.199.8990.35
CHT2.0-CuO 1.55169.00.9416.9094.00.88815.7832.600.189.5990.16
3 mM KI 1.5958.00.9328.16104.00.95874.6902.760.1412.3490.92
CHT0.5-CuO + KI1.5561.40.92103.874.60.941346.01449.800.1012.2094.35
CHT1.0-CuO + KI1.5567.80.9188.9188.60.941477.01565.910.1212.1594.76
CHT2.0-CuO + KI1.5463.70.92107.668.30.951329.01436.600.0912.4294.29
Table 5. Calculated values of corrosion rate and inhibition efficiency for X60 steel in 5% HCl without and with 0.5% CHT–CuO nanocomposite and in combination with KI (3 mM) at 25 and 60 °C.
System/ConcentrationCorrosion Rate (mm/yr)Inhibition Efficiency (%)
25 °C60 °C25 °C60 °C
Blank0.444.02--
CHT0.5-CuO0.242.8644.8028.50
CHT1.0-CuO0.192.1357.6046.99
CHT2.0-CuO0.212.4351.2039.42
3 mM KI0.191.4156.8065.01
CHT0.5-CuO + KI 0.141.1168.0072.49
CHT1.0-CuO + KI0.121.0172.8074.76
CHT2.0-CuO + KI0.161.1462.4071.71
Table 6. Synergism Parameter (S1) for CHT–CuO nanocomposite containing varying amount of chitosan from EIS, LPR and PDP measurements at 25 °C and Weight loss (WL) measurements at 25 °C and 60 °C.
SystemSynergism Parameter (S1)
PDPLPREISWL 25 °CWL 60 °C
CHT0.5–CuO 0.590.500.170.740.89
CHT1.0–CuO0.680.540.200.670.74
CHT2.0–CuO0.690.580.170.660.75
Table 7. Surface parameters derived from profilometer surface analysis of the corroded X60 carbon steel immersed in 5% HCl without and with 0.5% CHT1.0–CuO nanocomposite and in combination with KI (3 mM) at 25 °C.
Systems/ConcentrationSurface Roughness
RA (µm)RRMS (µm)RT (µm)
Polished X60 carbon steel0.0710.1101.558
X60 steel in blank at 25 °C0.3840.6809.895
X60 steel inhibited with CHT0.5-CuO0.1280.1673.918
X60 steel inhibited with CHT1.0-CuO0.1240.1613.761
X60 steel inhibited with CHT0.5-CuO + KI0.1160.1566.638
X60 steel inhibited with CHT1.0-CuO + KI0.1040.1374.288
Publisher’s Note: MDPI stays neutral with regard to jurisdictional claims in published maps and institutional affiliations.

