Article

Effects of Synthesis Gas Concentration, Composition, and Operational Time on Tubular Solid Oxide Fuel Cell Performance

1
Mechanical and Aerospace Engineering, Syracuse University, 263 Link Hall, Syracuse, NY 13244, USA
2
School for Engineering of Matter, Transport and Energy, Arizona State University, 501 E. Tyler Mall, Tempe, AZ 85281, USA
*
Author to whom correspondence should be addressed.
Sustainability 2022, 14(13), 7983; https://doi.org/10.3390/su14137983
Submission received: 17 May 2022 / Revised: 16 June 2022 / Accepted: 23 June 2022 / Published: 30 June 2022
(This article belongs to the Section Energy Sustainability)

Abstract

:
There is tremendous potential to utilize the exhaust gases and heat already present within combustion chambers to generate electrical power via solid oxide fuel cells (SOFCs). Variations in system design have been investigated as well as thorough examinations into the impacts of environmental conditions and fuel composition/concentration on SOFC performance. In an attempt to isolate the impacts of carbon monoxide and hydrogen concentration ratios within the exhaust stream, this work utilizes multi-temperature performance analyses with simulated methane combustion exhaust as fuel combined with dilute hydrogen baseline tests. These comparisons reveal the impacts of the complex reaction pathways carbon monoxide participates in when used as an SOFC fuel. Despite these complexities, performance reductions as a result of the presence of carbon monoxide are low when compared to similarly dilute hydrogen as a fuel. This provides further motivation for the continued development of SOFC-CHP systems. Stability testing performed over 80 h reveals the need for careful control of the operating environment as well as signs of carbon deposition. As a result of gas flow disruption, impacts of anode oxidation that may normally not hinder power production become significant factors in addition to coarsening of the anode material. Thermal management and strategies to minimize these impacts are a topic of future research.

1. Introduction

Combustion chambers produce heat and reform hydrocarbons into synthesis gas (syngas). These two conditions combined are ideal for solid oxide fuel cell (SOFC) operation. This means SOFCs can be placed within a combustion chamber and produce electrical power with the processes already occurring as part of the system’s operation. SOFCs may be placed directly within the combustion reaction yielding direct flame fuel cells (DFFCs) [1,2,3]. DFFC instability caused by variations in flame structure and therefore variation in temperature and fuel concentration/composition have motivated the development of alternative strategies. By separating the combustion reaction and SOFCs, these instabilities may be avoided while still utilizing the heat and exhaust species produced via hydrocarbon combustion, yielding flame-assisted fuel cells (FFCs) [4,5,6,7,8,9,10]. Within the context of heating systems such as furnaces and boilers, this ability to use FFCs is a particularly powerful concept and many SOFC-combined heat and power (CHP) systems have been investigated [4,11,12,13,14,15,16,17]. To permit the development of these systems, a thorough understanding of how SOFCs perform in the gas mixtures available in hydrocarbon exhaust as well as within the thermal environment is necessary. Substantial investigations have been performed focusing on all aspects of this complex problem [1,3,4,7,8,18,19,20] but given the interactions between different environmental aspects such as fuel concentration/composition, temperature, and length of testing, there is still motivation to continue this work with examinations that isolate previously coupled factors.
Previous work has thoroughly studied the efficiency of micro-tubular SOFCs (mT-SOFCs) operating in the exhaust of methane combustion using a two-stage combustor [21,22]. This work showed high efficiencies could be obtained by using fuel-rich combustion to produce syngas and heat for mT-SOFC operation, then fuel-lean combustion to react any remaining fuel species. Variations in cell performance resulted from the variations in temperature, syngas dilution, sooting, and exhaust composition. Given the nature of mT-SOFCs operating in real methane exhaust, the influences from each factor were coupled and inseparable. In one study, a simulated exhaust composition was used and the total flow rates were associated with a constant pre-combustion methane flow rate [22]. This study revealed valuable insights into SOFC-CHP system operation with a focus on the ability to fully utilize the syngas produced by partial oxidation of the methane fuel. Comparisons against cells operating on hydrogen were also made to illustrate differences between cogeneration operation and maximum fuel cell efficiency. These comparisons indicated an approximately 60% decrease in peak power production. This decrease is a result of the combination of slower reaction kinetics associated with CO as well as the dilution of the fuels by inert gases. To aid in the advancement of mT-SOFC design, it is desirable to isolate the influences of fuel dilution, gas composition, sooting, and temperature as is conducted in the work presented here. This can be performed by matching the free electrons for all testing conditions available from the electrochemical reactions of carbon monoxide and hydrogen within the fuel stream. This highlights the impacts of the kinetics of the reactants, especially the complicated pathways through which carbon monoxide may be utilized within an SOFC [23], as well as dilution by inert gases. Dilution effects can then be eliminated by utilizing dilute hydrogen baseline tests which match total flow rate as well as free electrons, allowing just fuel composition to vary.
In addition to isolating the influence of key factors on cell behavior, it is important to fully explore the range of possible operating conditions for optimal performance. The upper flammability limit of a combustible gas is determined by a variety of factors including temperature, pressure, and chamber geometry [24,25,26,27]. The upper flammability limit the SOFC-CHP system may operate in is therefore difficult to predict, but an estimate may be given by combining previous investigations of a residential boiler [28] and analyses from the literature [26,27]. These sources gave an approximate methane concentration of 16 mol%, which corresponds to an equivalence ratio of 1.6. With the use of a porous media combustor, however, significantly higher equivalence ratios can be utilized, obtaining higher syngas concentrations [4,8,9]. To address this range of possible operating conditions, equivalence ratios from 1.1 to 1.9 were used during performance testing, expanding the range of conditions previously examined within one experiment. Though dependent on temperature and mixing of fuel and oxidant, the general critical sooting limit for methane can be given as 1.8 [21,29]. This means cells operating in exhaust streams at and above this limit are at risk of sooting which would cause large drops in performance due to clogging of the anode pores. Though the higher syngas concentrations associated with these high equivalence ratios are desirable, this sooting issue outweighs these benefits, demotivating investigation into extremely high equivalence ratios.
Carbon deposition is possible not only through soot formation but also through reactions of carbon-containing gases such as the carbon monoxide disproportionation reaction, however, this is mainly present at temperatures below 800 °C [30]. Given the intended application of SOFCs within combustion chambers, it is necessary to investigate to what extent carbon deposition occurs. This can be achieved using stability tests where changes in power density may occur over the course of tens of hours. Scanning electron microscopy (SEM) can be used to identify carbon deposits along with energy dispersive spectroscopy (EDS). In addition to carbon deposition, mechanical failure as a result of frequent thermal cycling is an issue within SOFC-CHP systems, however, this has been studied previously by subjecting an mT-SOFC stack to 3000 rapid thermal cycles, replicating what might be experienced during the stack lifetime [31]. Fortunately, minimal degradation in cell potential was observed and no degradation in power density or mechanical strength was observed. This previous examination, however, did not analyze the effects of the continuous high-temperature operation of mT-SOFCs nor did it include disruptions to the gas flow to the cell which can contribute to the reoxidation of the anode. The change in the oxidative state of the anode, as well as changes in cell microstructure, may affect the performance of the cell motivating the stability testing performed in this study. Additionally, extended operation can impact the integrity of the ceramic sealant and cell interconnects significantly affecting cell lifetime [32,33,34,35]. These vulnerabilities, however, are minimized by using mT-SOFCs which gain enhanced mechanical stability via their self-supporting geometry [36,37,38,39,40,41], leaving the previously discussed carbon deposition, anode reoxidation, and microstructural changes as the primary factors affecting cell performance during stability testing.

2. Materials and Methods

Impacts of fuel composition, dilution, environment temperature, structural changes, and carbon deposition were observed with a combination of performance tests and stability tests. To evaluate the performance of mT-SOFCs within a combustion chamber, a simulated combustion exhaust mixture was fed to an mT-SOFC within a horizontal tube furnace while power and polarization data were obtained with a Keithley 2420 Sourcemeter (Tektronix, Beaverton, OR, USA). By comparing all simulated exhaust combustion tests against a dilute hydrogen baseline, the impacts of composition were isolated. The effects of dilution were examined by comparing different dilutions of the hydrogen baselines at a constant temperature. Similarly, by using a controlled temperature environment, flame temperature effects were eliminated. Finally, by operating at a stable temperature and fuel concentration for an extended period of time, the impacts of carbon deposition and structural changes were examined. Stability tests were performed at a temperature of 800 °C with an exhaust mixture corresponding to methane combusted at an equivalence ratio of 1.6. Combined, these results allow for the analysis of the discrete impacts operating within simulated combustion exhaust has on mT-SOFC operation.

2.1. Fuel Cell Manufacturing

MT-SOFCs were fabricated following previously reported methods which are presented here in a reduced format. Additional details pertaining to the fabrication of the mT-SOFCs may be found in the reference material of this manuscript [22]. The anode-supported SOFCs were prepared by extruding a NiO + (Y2O3)0.08(ZrO2)0.92 (YSZ) (60%wt/40%wt, respectively) tubular anode via ram extrusion. The extruded anodes were allowed to dry in ambient air for 24 h before a pre-sintering stage at 1000 °C for 4 h. A YSZ electrolyte was applied by dip-coating. Similarly, the electrolyte was dried in ambient air for 24 h. The anode and electrolyte layers were then co-sintered at 1400 °C in air. The sintered anode and electrolyte tubes measured 2.4 mm inner diameter and 3.2 mm outer diameter. The electrolyte layer was measured via SEM at a thickness of 20 μm. The cathode, (La0.8Sr0.2)0.95MnO3−x (LSM) + YSZ (50%wt/50%wt), was then added by dip-coating. The cathode was again dried for 24 h prior to sintering. The cathode was sintered at 1100 °C for 2 h in air. The mT-SOFCs were prepared in the traditional manner, in that each layer (electrolyte and cathode) was added circumferentially to the outer surface of the anode support. Sintered gold metal paste was utilized for anode current collection [9]. Silver conductive ink was applied to the cathode for current collection. The total active cathode area of the experimentally tested mT-SOFC was 1.8 cm2. These cells were then mounted to a quartz tube with ceramic sealant.

2.2. Performance Testing

The mounted and wired mT-SOFCs were connected to a Keithley 2420 SourceMeter and a gas line connected to four flowmeters as shown in Figure 1. The cell was placed inside of a horizontal tube furnace fitted with a K-Type thermocouple close to the outside of the cell to accurately monitor the temperature of the area immediately around the cell. Before any tests were run, the cell was reduced by flowing 100 mL∙min−1 of hydrogen into the cell for one hour at 700 °C. This process removes the oxygen from the NiO anode, leaving only Ni.
The composition of simulated exhaust supplied to the fuel cell was varied to match the adiabatic combustion composition of methane exhaust at different equivalence ratios ϕ shown in Equation (1):
Equivalence ratio:
ϕ = ( A F ) s t o i c h i o m e t r i c A F
Predicted by the NASA Chemical Equilibrium Analysis (CEA) shown in Figure 2 and observed in a previous examination of a residential boiler [28]. Total flow rates were scaled so that the free electrons from the reactive species remained constant for all tests. The anode reactions for hydrogen and carbon monoxide are as follows:
Electrochemical hydrogen oxidation:
H 2 + O 2 H 2 O + 2 e
Electrochemical carbon monoxide oxidation:
CO + O 2 CO 2 + 2 e
Indicating both reactions involve two free electrons. Thus, the combined flow rate of hydrogen and carbon monoxide is kept at 100 mL∙min−1 for all tests, yielding a constant free electron number. This allows testing to highlight the effects of dilution and activity of the reactants. All simulated combustion exhaust tests were compared against a dilute hydrogen baseline test where the total flow rate was matched to each exhaust mixture by adding the appropriate amount of nitrogen. This comparison eliminates dilution effects isolating activity of reactants and impacts of carbon-containing species within the exhaust stream. All exhaust and baseline flow rates are given in Table 1.
In addition to variation caused by exhaust composition, the effects of temperature were studied. This was achieved by varying the temperature of the horizontal tube furnace. Temperatures were varied between 650 °C and 800 °C. Below these temperatures, the activity of the cell is extremely low and above these temperatures, rapid degradation of the current collectors has been observed [42].
For stability testing, the environment temperature was maintained at 800 °C and a simulated exhaust composition corresponding to an equivalence ratio of 1.6 was used. A constant current density of 350 mA∙cm−2 was drawn from the cell. This current density gives a power density of approximately 80% that of the peak power density in these conditions before the test was performed. Operating at this slightly reduced power is a common practice to avoid severe degradation of the cell seen when operating at excessive current densities [43]. SEM, performed with a JEOL JSM-IT100 (JEOL Ltd., Tokyo, Japan), was used to identify changes in microstructure and carbon deposition as a result of these stability tests. Samples were prepared by longitudinally bifurcating the cells with a ceramic saw, then fracturing into cross sections revealing both the inner anode surface and all cell layers. Two cells were imaged, one without any stability testing and one after the 80-h test. Though it would be desirable to image the same cell before and after testing, the destructive sample preparations needed prevent this. Samples were secured to decontaminated aluminum stubs using carbon tape. The stubs were then mounted in the chamber and the chamber was pumped down to a vacuum to initiate SEM analysis. Secondary electron imaging was used with an accelerating voltage of 20 kV and probe current of 50. EDS was also performed in the JEOL SEM to determine the elemental compositions of the samples. EDS scans were run for approximately 10 min and averaged over 1000 characteristic X-ray counts per second.

3. Results

3.1. Performance Tests with Varying Temperature, Fuel Composition, and Fuel Dilution

The variation in OCV and power density as a result of varying the combustion equivalence ratio is shown in Figure 3 along with dilute hydrogen baselines with the same total flow rate and free electrons as the simulated combustion tests. Though these curves only show the power and polarization curves obtained at 800 °C, tests were performed at 650–800 °C with peak power densities and OCVs for each test compiled in Figure 4. Overall, there is minimal oscillation in polarization during testing, indicating stable power production. Recombination reactions occurring at the outlet of the cell where unreacted fuel species combine with ambient oxygen could contribute to the small noise seen. The increasing slope of the curve at a higher equivalence ratio indicates a decrease in activation and mass transport losses. Recent work has shown that the FFCs operating on exhaust mixtures from low equivalence ratio combustion reactions at high fuel utilization experience high activation losses, making these effects significant for FFCs [44]. This is also confirmed by the change in OCV as the equivalence ratio changes. Higher equivalence ratio tests are expected to have lower activation losses, producing higher OCVs [45]. At higher equivalence ratios, higher current densities are achieved. Mass concentration losses increase at high current densities as shown by the slightly decreasing slope for equivalence ratios above 1.4 at current densities of 300 mW∙cm−2 for the simulated combustion tests and 420 mW∙cm−2 for the hydrogen baseline. The delayed onset of these losses for the hydrogen baseline can be explained by the relatively small hydrogen molecules being more easily transported through the anode pores [46] and the much faster hydrogen reaction kinetics than carbon monoxide [47].
OCV also increases at higher equivalence ratios. The variations in OCV can be predicted by the Nernst potential (Equation (4)):
E = E 0 + Δ s ^ n F ( T T 0 ) R T n F ln a p r o d u c t s v i a r e a c t a n t s v i
where the variation from the standard electrode potential, E0, which is obtained for a hydrogen-air or carbon monoxide-air fuel cell operating at standard conditions is predicted as a result of temperature and concentration changes. The variation as a result of temperature difference from the standard temperature, TT0, is related to the change in entropy of the reaction, Δŝ, the moles of electrons transferred from the anode to the cathode per mole of chemical reaction, n, and the Faraday constant, F. The variation as a result of pressure is related to the gas constant, R, and the activity of product and reactant species, a, as well as the number of moles of each product in the stoichiometric redox reaction, v, as well as the previously described n, F, and T. Following the Nernst potential, dilution of the fuel lowers the cell potential. Greater variation is seen in the simulated combustion tests in Figure 3a than in the dilute hydrogen baseline in Figure 3c. In addition to dilution, the composition of the fuel mixture affects cell potential. At lower equivalence ratios where the carbon monoxide to hydrogen ratio is higher, lower potential is observed due to the slower reaction rate of carbon monoxide electrochemical oxidation [30]. In addition to the electrochemical oxidation of carbon monoxide shown in Equation (3) above, a water–gas shift reaction may occur as shown by Equation (5). The hydrogen produced by this reaction may then be electrochemically oxidized. Again, this overall set of reactions is slower than the direct hydrogen reaction, yielding lowered cell potential. As the carbon monoxide to hydrogen ratio decreases, the overall faster reaction rate at the anode allows the cell potential to increase to a greater extent than when only dilution effects are present.
Water–gas shift:
CO + H 2 O CO 2 + H 2
Figure 3b,d further highlights the effects of dilution and fuel composition. The same trends seen with the polarization curves are observed as a result of changing equivalence ratio. Comparing the peak power densities, an increase of 19% is seen at an equivalence ratio of 1.9 with dilute hydrogen as a fuel. This is a result of the slower carbon monoxide reaction rates. A much larger increase of 75% is observed at an equivalence ratio of 1.1. This indicates the unfavorable reaction kinetics of the carbon monoxide become significant at lower equivalence ratios where less hydrogen is present. This motivates using the highest equivalence ratio obtainable by a combustion chamber to maximize potential power production from an integrated SOFC stack.
Figure 4 shows the trends in OCV and peak power density for all temperatures examined. Interestingly, although the OCVs for the 650 °C and 700 °C tests for both simulated exhaust and baseline tests are approximately equal, the reduction in ohmic resistance, as well as activation losses at higher temperatures, causes an approximately two-fold increase in power density. Similarly, although cell potential decreases from 750 °C to 800 °C, improved reaction kinetics and again lower ohmic losses allow for an increase in power density, although the increase is small compared to the comparison between 650 °C and 700 °C, as well as 700 °C and 750 °C tests.
Figure 4a,b also shows minimal increases in OCV at equivalence ratios above 1.4. At low equivalence ratios, the concentration of syngas within the exhaust stream is very low, less than 4 mol%, so to maintain free electron number, very high dilution with nitrogen is needed as seen in Table 1. These changes become more gradual at higher equivalence ratios, lessening changes in OCV. Interestingly, unlike OCV, peak power density grows substantially between moderate to high equivalence ratios when at high temperatures with approximately 38% increase for the simulated combustion tests, and a 25% increase for the dilute hydrogen baseline at 800 °C. Although the increase for the simulated combustion exhaust is greater, the overall higher power density for the baseline test causes increased losses from transport within the cell. With identical cell morphology, transport of fuel and exhaust species becomes increasingly difficult at high current densities, so these losses are more significant with the baseline preventing substantial performance increases even at higher equivalence ratios. In comparison, at 650 °C, the increases for simulated combustion and baseline peak power densities are 18% and 12%, respectively. The relatively low current densities seen here cause the impacts of mass concentration losses to be low, causing fewer changes between the simulated exhaust and baseline test conditions.

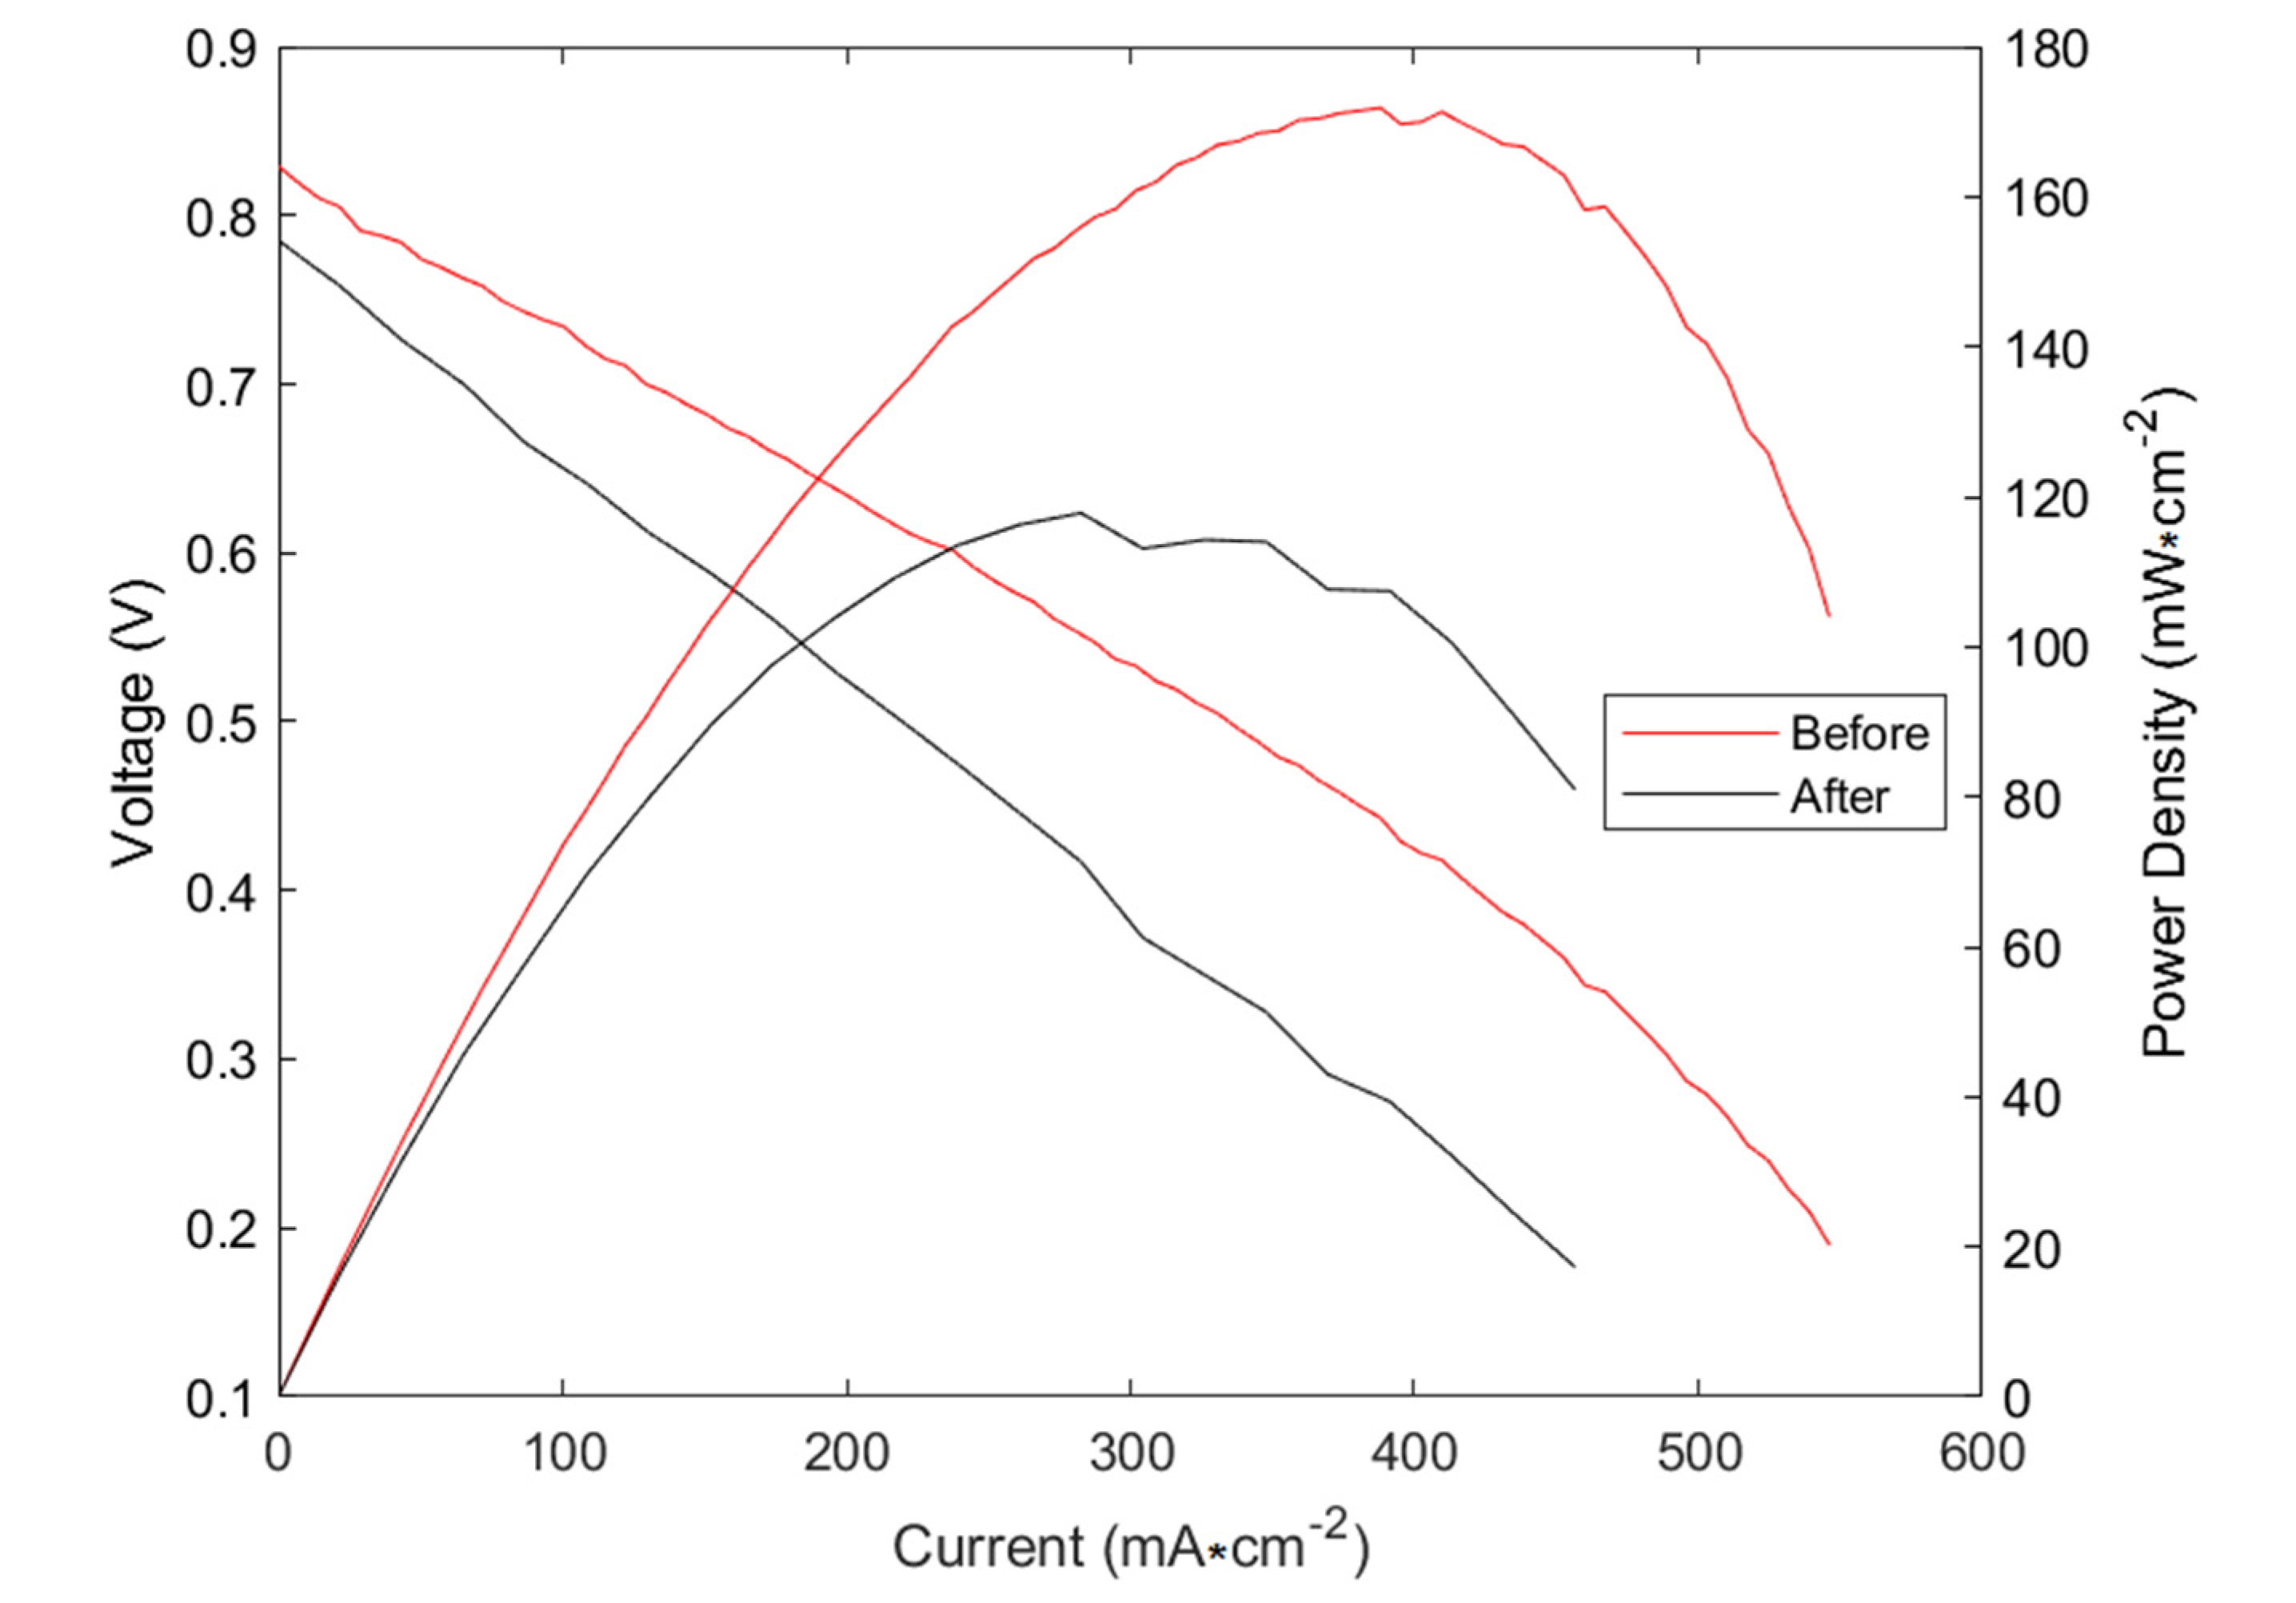
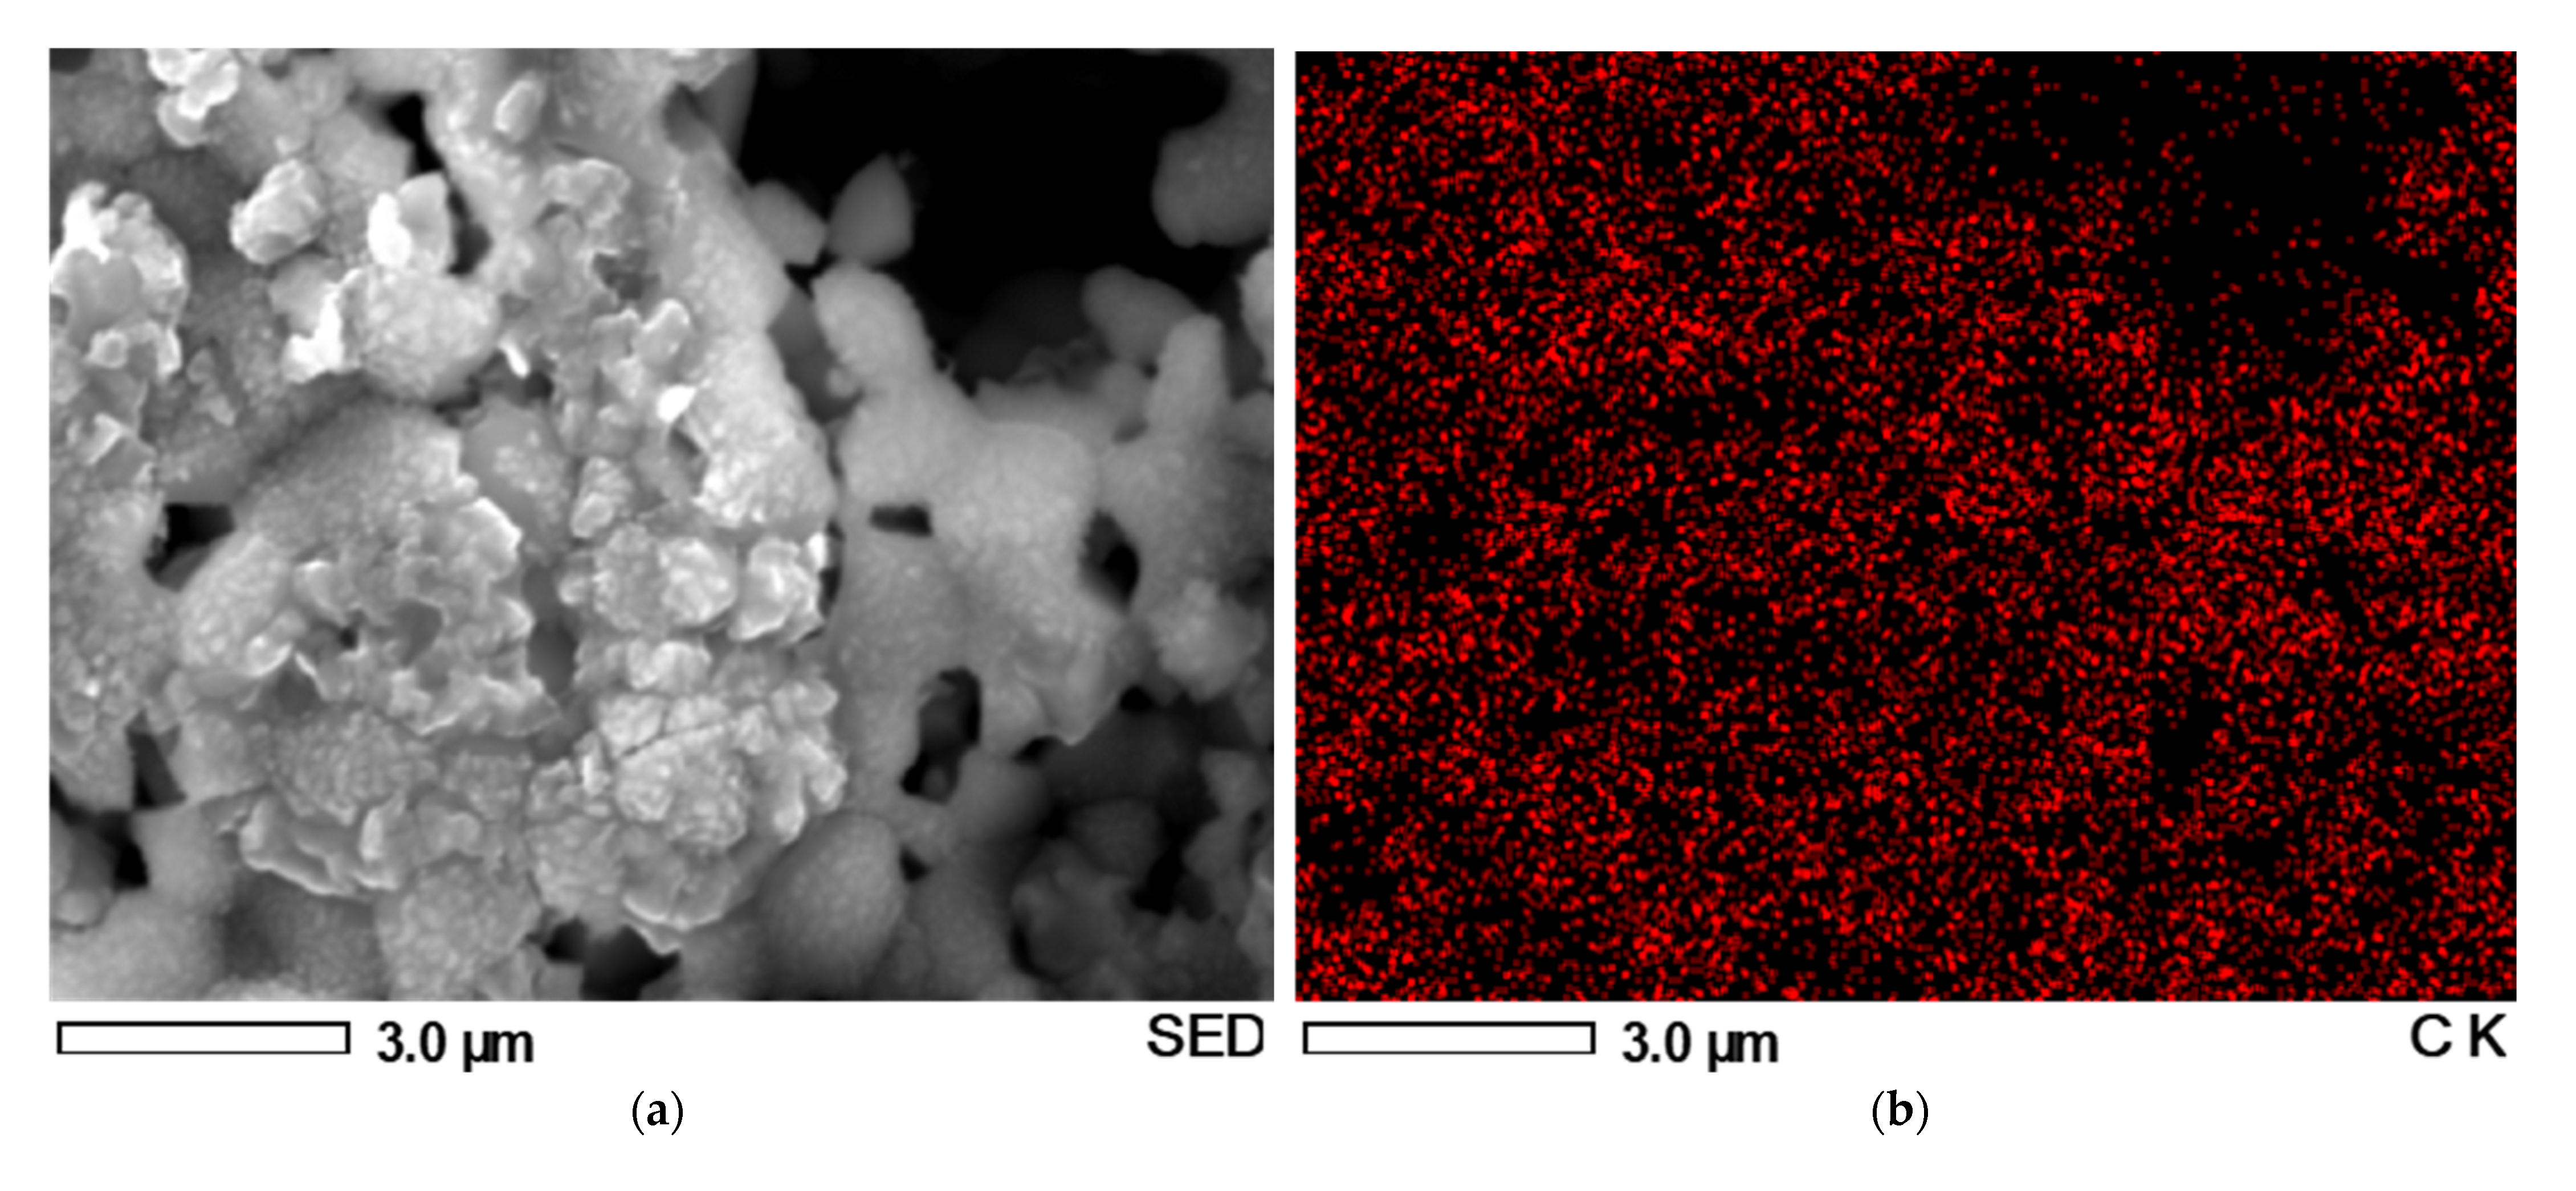
3.2. Longevity and Carbon Deposition Examinations

The eighty-hour-long performance test shown in Figure 5 revealed the impacts of extended operation on SOFC power production. The initial power density was 162 mW∙cm−2, consistent with the power density observed during testing at 800 °C with varying simulated methane exhaust composition. Over the course of the next two hours, the power density increased to 175 mW∙cm−2 most likely as a result of the cell temperature increasing slightly as the fuel was oxidized, releasing heat. After this initial rise, the power dropped slightly over the course of the next ten hours before again rising slightly and remaining stable. At hour 27, however, the flow of fuel to the cell was stopped for approximately half an hour while a hydrogen gas supply tank was replaced. Without fuel flowing to the anode, the nickel was able to reoxidize, significantly reducing power when the simulated exhaust mixture was again supplied to the anode. The nickel oxide was then reduced again, but even over the course of two hours, the power density did not return to its previous level. The drop in power production was 12%. From this point at hour 35 until approximately hour 40, the power remained stable at this lower level but then began to drop steadily until the end of testing, with a decrease of 20% during this last half of testing. Overall, the power decreased by 32%. As seen in previous work, a variety of factors could contribute to this including changes in cell morphology, carbon deposition, and issues with anode reduction in the dilute fuel stream after halting flow. Changes in cell morphology have however shown to be minimal in previous work, with carbon deposition dominating cell performance variation [31]. The absence of methane from the fuel stream prevents hydrocarbon cracking [48,49], but carbon monoxide disproportionation may occur, as in Equation (5).
Carbon monoxide disproportionation:
2 CO ( g ) CO 2 ( g ) + C ( s )
The gradual decrease in power seen in Figure 5 is indicative of some gradual carbon deposition as well as anode structural changes. Previous work has shown power production may remain constant even with small amounts of carbon coke [31], however, these deposits may hinder the reduction of the anode when fuel flow is disrupted.
SEM imaging reveals the structural changes and minor carbon deposition causing performance degradation during stability testing. The anode surface is shown at 2000× magnification in Figure 6a prior to stability testing and in Figure 6b it is shown after stability testing. It can be seen that many of the 5–10 μm pores caused by pore former burnout during the sintering process are not present after stability testing due to significant coarsening of the anode. In addition to coarsening, the surface after testing became rough as compared to the surface without testing. Figure 6c,d, taken at 5000× magnification, show that the porosity of the inner anode material, even within 2 μm of the interior surface, is still highly porous for both, prior to and after stability tests. Particularly clear in Figure 6d are the pores discussed, with Figure 6a created by the pore former The more significant factor affecting performance degradation during stability testing is the structural change of the anode. As the FFC operates within the 800 °C environment, the anode coarsens over time, reducing porosity. This limits transport within the cell, causing performance losses. Furthermore, the drop in power at hour 27 previously discussed could be a result of the anode remaining partially unreduced. Even as the anode reduces again with the flow of fuel species, the transition from Ni to NiO and then back to Ni can cause mechanical stress on the cell. This redox cycling can also contribute to performance losses as well as permanent mechanical degradation [50]. While in this previous work, flow was halted, this was coupled with a drop in temperature, preventing rapid oxidation of the anode. In the test performed here, the cell temperature was maintained while flow was interrupted allowing for rapid reoxidation of the anode.
The issues with oxidation of the anode are supported by Figure 7, where the slope of the polarization curve is higher after the longevity test indicating higher losses within the cell despite the temperature remaining constant. The rapid redox cycling could contribute to these losses by reducing overall anode porosity causing increased mass transport losses, reducing the availability of active sites increasing activation losses, and introducing unreduced NiO zones as well as structural changes increasing ohmic losses. The OCV is also lower despite there being no changes in operating conditions and therefore no change in losses as predicted by the Nernst potential Equation (3). This again supports the idea that the anode structural changes deactivate some of the electrochemically active regions.
Initially, it was believed that the difference in the anode structure before and after testing was due to the deposition of a carbon layer throughout testing. However, the use of energy dispersive spectroscopy (EDS) revealed that carbon deposition plays a minimal role in the decreased cell performance. As shown in Table 2, there is only a 1.29% increase by mass and a 1.92% increase by atom of carbon after stability testing. It is important to note this EDS analysis was not calibrated with a known sample for carbon so absolute concentrations of carbon may not be highly accurate, but relative percentages between stability and no stability tests should be accurate confirming the minimal change in carbon. It should also be noted that some residual carbon may be present in the room which houses the SEM, and in the SEM chamber itself, leading to excess carbon detection by the EDS scan. However, the samples were analyzed at the same time and were exposed to the same environmental factors, meaning that the amount of carbon deposition from stability testing was obtained from the difference in mass and atom percentages.
The EDS mapping in Figure 8 reveals that the rough formations seen in SEM imaging of cells after stability testing are composed of nickel rather than carbon. Additionally, Figure 8c,d shows overlapping regions of oxygen and nickel, meaning that some amount of the oxygen must be accounted for by nickel oxide though some of this oxygen could be from YSZ below the Ni/NiO deposit. The presence of nickel oxide here is a clear issue within the cell structure as it reduces anode conductivity. The remaining oxygen is accounted for by the overlap of yttrium and zirconium with oxygen in Figure 8c,e,f, forming the yttrium oxide and zirconium dioxide present in the electrolyte material. Results from SEM and EDS show that the decrease in cell performance after stability testing comes primarily from the altered and oxidized nickel structure of the anode, and secondarily from small amounts of carbon deposition.

4. Conclusions

The performance tests carried out at varying temperatures and equivalence ratios motivate the continued development of SOFC-CHP systems. Despite the complex and slow reaction pathways associated with oxidation of CO, performance reductions were minimal when compared to similarly dilute hydrogen over a wide range of operational temperatures and fuel compositions. Stability tests performed in this study have shown a remaining vulnerability to morphological changes of the anode due to extended exposure to high-temperature environments which needs to be addressed in future work, though carbon deposition was shown to be minimal. Careful thermal management and fuel control are, therefore, necessary to avoid issues with coking and anode oxidation. Fortunately, these issues can be resolved by re-reducing the anode and oxidizing carbon or removing carbon through the reverse disproportionation or Boudouard reaction. Despite these issues, the methodology for SOFC examination, as well as the promising results, motivates and informs future work into SOFC-CHP systems.

Author Contributions

Conceptualization, A.R.H. and J.A.; methodology, A.R.H.; manufacturing, T.S.W.; electrochemical characterization, A.R.H.; SEM and EDS characterization, C.A.W.; writing—original draft preparation, A.R.H., C.A.W. and T.S.W.; writing—review and editing, T.S.W., R.J.M. and J.A.; supervision, J.A.; project administration, J.A. All authors have read and agreed to the published version of the manuscript.

Funding

This material is based upon work supported by an Agreement with Syracuse University awarded by its Syracuse Center of Excellence in Environmental and Energy Systems with funding under prime award number DE-EE0006031 from the US Department of Energy and matching funding under award number 53367 from the New York State Energy Research and Development Authority (NYSERDA) and under NYSERDA contract 61736.

Institutional Review Board Statement

Not applicable.

Informed Consent Statement

Not applicable.

Data Availability Statement

The data presented in this study are available in the article.

Conflicts of Interest

The authors declare no conflict of interest.

References

  1. Wang, Y.; Shi, Y.; Yu, X.; Cai, N.; Qian, J.; Wang, S. Experimental Characterization of a Direct Methane Flame Solid Oxide Fuel Cell Power Generation Unit. J. Electrochem. Soc. 2014, 161, F1348–F1353. [Google Scholar] [CrossRef]
  2. Wang, K.; Zeng, P.; Ahn, J. High Performance Direct Flame Fuel Cell Using a Propane Flame. Proc. Combust. Inst. 2011, 33, 3431–3437. [Google Scholar] [CrossRef]
  3. Wang, K.; Milcarek, R.J.; Zeng, P.; Ahn, J. Flame-Assisted Fuel Cells Running Methane. Int. J. Hydrogen Energy 2015, 40, 4659–4665. [Google Scholar] [CrossRef] [Green Version]
  4. Wang, Y.; Zeng, H.; Shi, Y.; Cao, T.; Cai, N.; Ye, X.; Wang, S. Power and Heat Co-Generation by Micro-Tubular Flame Fuel Cell on a Porous Media Burner. Energy 2016, 109, 117–123. [Google Scholar] [CrossRef]
  5. Hartwell, A.R.; Welles, T.S.; Ahn, J. The Anode Supported Internal Cathode Tubular Solid Oxide Fuel Cell: Novel Production of a Cell Geometry for Combined Heat and Power Applications. Int. J. Hydrogen Energy 2021, 46, 37429–37439. [Google Scholar] [CrossRef]
  6. Milcarek, R.J.; Wang, K.; Falkenstein-Smith, R.L.; Ahn, J. Micro-Tubular Flame-Assisted Fuel Cells for Micro-Combined Heat and Power Systems. J. Power Sources 2016, 306, 148–151. [Google Scholar] [CrossRef] [Green Version]
  7. Wang, Y.; Shi, Y.; Cai, N.; Ye, X.; Wang, S. Performance Characteristics of a Micro-Tubular Solid Oxide Fuel Cell Operated with a Fuel-Rich Methane Flame. ECS Trans. 2015, 68, 2237–2243. [Google Scholar] [CrossRef]
  8. Wang, Y.; Zeng, H.; Cao, T.; Shi, Y.; Cai, N.; Ye, X.; Wang, S. Start-up and Operation Characteristics of a Flame Fuel Cell Unit. Appl. Energy 2016, 178, 415–421. [Google Scholar] [CrossRef]
  9. Zeng, H.; Gong, S.; Shi, Y.; Wang, Y.; Cai, N. Micro-Tubular Solid Oxide Fuel Cell Stack Operated with Catalytically Enhanced Porous Media Fuel-Rich Combustor. Energy 2019, 179, 154–162. [Google Scholar] [CrossRef]
  10. Wang, Y.Q.; Shi, Y.X.; Yu, X.K.; Cai, N.S.; Li, S.Q. Integration of Solid Oxide Fuel Cells with Multi-Element Diffusion Flame Burners. J. Electrochem. Soc. 2013, 160, F1241–F1244. [Google Scholar] [CrossRef]
  11. Yari, M.; Mehr, A.S.; Mahmoudi, S.M.S.; Santarelli, M. A Comparative Study of Two SOFC Based Cogeneration Systems Fed by Municipal Solid Waste by Means of Either the Gasifier or Digester. Energy 2016, 114, 586–602. [Google Scholar] [CrossRef]
  12. Gandiglio, M.; Lanzini, A.; Santarelli, M.; Acri, M.; Hakala, T.; Rautanen, M. Results from an Industrial Size Biogas-Fed SOFC Plant (the DEMOSOFC Project). Int. J. Hydrogen Energy 2020, 45, 5449–5464. [Google Scholar] [CrossRef]
  13. Knight, I.; Ugursal, I. Residential Cogeneration Systems: A Review of the Current Technologies. 2005. Available online: https://www.osti.gov/etdeweb/biblio/20671036 (accessed on 16 May 2022).
  14. Dentice d’Accadia, M.; Sasso, M.; Sibilio, S.; Vanoli, L. Micro-Combined Heat and Power in Residential and Light Commercial Applications. Appl. Therm. Eng. 2003, 23, 1247–1259. [Google Scholar] [CrossRef]
  15. Naimaster, E.J.; Sleiti, A.K. Potential of SOFC CHP Systems for Energy-Efficient Commercial Buildings. Energy Build. 2013, 61, 153–160. [Google Scholar] [CrossRef]
  16. Farhad, S.; Hamdullahpur, F.; Yoo, Y. Performance Evaluation of Different Configurations of Biogas-Fuelled SOFC Micro-CHP Systems for Residential Applications. Int. J. Hydrogen Energy 2010, 35, 3758–3768. [Google Scholar] [CrossRef] [Green Version]
  17. Sorace, M.; Gandiglio, M.; Santarelli, M. Modeling and Techno-Economic Analysis of the Integration of a FC-Based Micro-CHP System for Residential Application with a Heat Pump. Energy 2017, 120, 262–275. [Google Scholar] [CrossRef]
  18. Milcarek, R.J.; Ahn, J. Rich-Burn, Flame-Assisted Fuel Cell, Quick-Mix, Lean-Burn (RFQL) Combustor and Power Generation. J. Power Sources 2018, 381, 18–25. [Google Scholar] [CrossRef]
  19. Milcarek, R.J.; Nakamura, H.; Tezuka, T.; Maruta, K.; Ahn, J. Microcombustion for Micro-Tubular Flame-Assisted Fuel Cell Power and Heat Cogeneration. J. Power Sources 2019, 413, 191–197. [Google Scholar] [CrossRef]
  20. Wang, Y.; Shi, Y.; Ni, M.; Cai, N. A Micro Tri-Generation System Based on Direct Flame Fuel Cells for Residential Applications. Int. J. Hydrogen Energy 2014, 39, 5996–6005. [Google Scholar] [CrossRef]
  21. Milcarek, R.J.; Ahn, J. Micro-Tubular Flame-Assisted Fuel Cells Running Methane, Propane and Butane: On Soot, Efficiency and Power Density. Energy 2018, 169, 776–782. [Google Scholar] [CrossRef]
  22. Milcarek, R.J.; Garrett, M.J.; Wang, K.; Ahn, J. Micro-Tubular Flame-Assisted Fuel Cells Running Methane. Int. J. Hydrogen Energy 2016, 41, 20670–20679. [Google Scholar] [CrossRef] [Green Version]
  23. Penchini, D.; Cinti, G.; Discepoli, G.; Sisani, E.; Desideri, U. Characterization of a 100 W SOFC Stack Fed by Carbon Monoxide Rich Fuels. Int. J. Hydrogen Energy 2013, 38, 525–531. [Google Scholar] [CrossRef]
  24. Fthenakis, V.M.; Trammell, S.R. Reference Guide for Hazard Analysis in PV Facilities. 2003. Available online: https://www.researchgate.net/profile/Vasilis-Fthenakis-2/publication/228611604_Reference_Guide_for_Hazard_Analysis_in_PV_Facilities/links/56b1188d08aed7ba3feaf653/Reference-Guide-for-Hazard-Analysis-in-PV-Facilities.pdf (accessed on 16 May 2022).
  25. Bioche, K.; Vervisch, L.; Ribert, G. Premixed Flame-Wall Interaction in a Narrow Channel: Impact of Wall Thermal Conductivity and Heat Losses. J. Fluid Mech. 2018, 856, 5–35. [Google Scholar] [CrossRef]
  26. Zlochower, I.A.; Green, G.M. The Limiting Oxygen Concentration and Flammability Limits of Gases and Gas Mixtures. J. Loss Prev. Process Ind. 2009, 22, 499–505. [Google Scholar] [CrossRef]
  27. Vanderstraeten, B.; Berghmans, J.; Tuerlinckx, D.; Smit, B.; Van’t Oost, E.; Vliegen, S. Experimental Study of the Pressure and Temperature Dependence on the Upper Flammability Limit of Methane/Air Mixtures. J. Hazard. Mater. 1997, 56, 237–246. [Google Scholar] [CrossRef]
  28. Chu, M.; Hartwell, A.R.; Ahn, J. Flame-Assisted Fuel Cell Boiler for Combined Heating and Micro-Power Generation. In Proceedings of the Nineteenth International Symposium on Advanced Fluid Information, Sendai, Japan, 6–8 November 2019; Volume 28. [Google Scholar]
  29. Haynes, B.S.; Wagner, H.G.G. Soot Formation. Prog. Energy Combust. Sci. 1981, 7, 229–273. [Google Scholar] [CrossRef]
  30. Sumi, H.; Lee, Y.H.; Muroyama, H.; Matsui, T.; Kamijo, M.; Mimuro, S.; Yamanaka, M.; Nakajima, Y.; Eguchi, K. Effect of Carbon Deposition by Carbon Monoxide Disproportionation on Electrochemical Characteristics at Low Temperature Operation for Solid Oxide Fuel Cells. J. Power Sources 2011, 196, 4451–4457. [Google Scholar] [CrossRef]
  31. Milcarek, R.J.; Garrett, M.J.; Welles, T.S.; Ahn, J. Performance Investigation of a Micro-Tubular Flame-Assisted Fuel Cell Stack with 3,000 Rapid Thermal Cycles. J. Power Sources 2018, 394, 86–93. [Google Scholar] [CrossRef]
  32. Fergus, J.W. Sealants for Solid Oxide Fuel Cells. J. Power Sources 2005, 147, 46–57. [Google Scholar] [CrossRef]
  33. Tulyaganov, D.U.; Reddy, A.A.; Kharton, V.V.; Ferreira, J.M.F. Aluminosilicate-Based Sealants for SOFCs and Other Electrochemical Applications-A Brief Review. J. Power Sources 2013, 242, 486–502. [Google Scholar] [CrossRef]
  34. Brandon, N.P.; Ruiz-Trejo, E.; Boldrin, P. Solid Oxide Fuel Cell Lifetime and Reliability; Joe Hayton: London, UK, 2017. [Google Scholar]
  35. Hatae, T.; Sato, K.; Somekawa, T.; Matsuzaki, Y.; Amaha, S.; Yoshikawa, M.; Mugikura, Y.; Miyara, K.; Oshima, T.; Taniguchi, S.; et al. Durability Assessment of SOFC Stacks with Several Types of Structures for Thermal Cycles during Their Lifetimes on Residential Use. ECS Trans. 2015, 68, 2209–2216. [Google Scholar] [CrossRef]
  36. Sarkar, P.; Yamarte, L.; Rho, H.; Johanson, L. Anode-Supported Tubular Micro-Solid Oxide Fuel Cell. Int. J. Appl. Ceram. Technol. 2007, 4, 103–108. [Google Scholar] [CrossRef]
  37. Winkler, W.; Krüger, J. Design and Manufacturing of a Tubular Solid Oxide Fuel Cell Combustion System. J. Power Sources 1998, 71, 244–248. [Google Scholar] [CrossRef]
  38. Kong, W.; Zhang, W.; Zhang, S.; Zhang, Q.; Su, S. Residual Stress Analysis of a Micro-Tubular Solid Oxide Fuel Cell. Int. J. Hydrogen Energy 2016, 41, 16173–16180. [Google Scholar] [CrossRef] [Green Version]
  39. Serincan, M.F.; Pasaogullari, U.; Sammes, N.M. Thermal Stresses in an Operating Micro-Tubular Solid Oxide Fuel Cell. J. Power Sources 2010, 195, 4905–4914. [Google Scholar] [CrossRef]
  40. Du, Y.; Sammes, N.M. Fabrication and Properties of Anode-Supported Tubular Solid Oxide Fuel Cells. J. Power Sources 2004, 136, 66–71. [Google Scholar] [CrossRef]
  41. Sin, Y.W.; Galloway, K.; Roy, B.; Sammes, N.M.; Song, J.H.; Suzuki, T.; Awano, M. The Properties and Performance of Micro-Tubular (Less than 2.0 Mm O.D.) Anode Suported Solid Oxide Fuel Cell (SOFC). Int. J. Hydrogen Energy 2011, 36, 1882–1889. [Google Scholar] [CrossRef]
  42. Hartwell, A.R.; Ahn, J. Complex Material Behavior Seen with Novel Internal Cathode Tubular Solid Oxide Fuel Cells. In ASME International Mechanical Engineering Congress and Exposition; American Society of Mechanical Engineers: New York, NY, USA, 2021. [Google Scholar]
  43. O’Hayre, R.P.; Cha, S.-W.; Colella, W.G.; Prinz, F.B. Fuel Cell Fundamentals, 3rd ed.; John Wiley & Sons: Hoboken, NJ, USA, 2016; ISBN 9781119191766. [Google Scholar]
  44. Ghotkar, R.; Milcarek, R.J. Modeling of the Kinetic Factors in Flame-Assisted Fuel Cells. Sustainability 2022, 14, 4121. [Google Scholar] [CrossRef]
  45. Fergus, J.W.; Hui, R.; Li, X.; Wilkinson, D.P.; Zhang, J. Solid Oxide Fuel Cells Materials Properties and Performance; CRC Press: Boca Raton, FL, USA, 2009. [Google Scholar]
  46. Shi, Y.; Li, C.; Cai, N. Experimental Characterization and Mechanistic Modeling of Carbon Monoxide Fueled Solid Oxide Fuel Cell. J. Power Sources 2011, 196, 5526–5537. [Google Scholar] [CrossRef]
  47. Yao, W. Hydrogen and Carbon Monoxide Electrochemical Oxidation Reaction Kinetics on Solid Oxide Fuel Cell Anodes. 2013. Available online: http://hdl.handle.net/10012/7772 (accessed on 16 May 2022).
  48. Li, C.; Shi, Y.; Cai, N. Carbon Deposition on Nickel Cermet Anodes of Solid Oxide Fuel Cells Operating on Carbon Monoxide Fuel. J. Power Sources 2013, 225, 1–8. [Google Scholar] [CrossRef]
  49. Lawlor, V. Review of the Micro-Tubular Solid Oxide Fuel Cell (Part II: Cell Design Issues and Research Activities). J. Power Sources 2013, 240, 421–441. [Google Scholar] [CrossRef]
  50. Pihlatie, M.; Kaiser, A.; Mogensen, M. Mechanical Properties of NiO/Ni-YSZ Composites Depending on Temperature, Porosity and Redox Cycling. J. Eur. Ceram. Soc. 2009, 29, 1657–1664. [Google Scholar] [CrossRef]
Figure 1. Schematic of testing setup for FFC. Fuel supply consists of mixtures of hydrogen, carbon monoxide, carbon dioxide, and nitrogen. Environment temperature is controlled by a horizontal tube furnace with a K-type thermocouple placed near the cell. The cell is mounted to a quartz tube with power and polarization curves being obtained with a Keithley 2420 Sourcemeter.
Sustainability 14 07983 g001
Figure 2. Molar concentrations of exhaust species predicted by NASA CEA of adiabatic methane combustion at equivalence ratios ranging from 0.5 to 1.9.
Sustainability 14 07983 g002
Figure 3. Power and polarization curves for mT-SOFC operating on simulated combustion exhaust and dilute hydrogen at 800 °C. (a) Polarization curve with simulated combustion exhaust of methane corresponding to various equivalence ratios as shown in the legend. (b) Power density curves corresponding to polarization curves in (a). (c) Polarization curves for mT-SOFC operating on dilute hydrogen. Comparable equivalence ratio refers to the methane exhaust composition to which the total flow rate is matched. (d) Power density curves corresponding to polarization curves in (c).
Sustainability 14 07983 g003
Figure 4. Variations in peak power density and OCV due to equivalence ratio and temperature. (a) Changes in OCV as a result of varying the equivalence ratio of methane combustion used to describe exhaust composition separated by temperature. (b) Changes in OCV as a result of varying the comparable equivalence ratio for dilute hydrogen tests separated by temperature. (c) Peak power densities for simulated combustion tests at varying equivalence ratios separated by temperature. (d) Peak power densities for dilute hydrogen baseline tests at varying equivalence ratios separated by temperature.
Sustainability 14 07983 g004
Figure 5. Long term performance test of an mT-SOFC supplied with simulated combustion exhaust with composition correlating to a methane combustion reaction at an equivalence ratio of 1.6. Temperature was maintained at 800 °C. A constant current density of 350 mA∙cm−2 was drawn from the cell.
Sustainability 14 07983 g005
Figure 6. Scanning electron micrographs of mT-SOFCs without stability testing and after stability testing. (a) Surface of anode without stability testing. (b) Surface of anode with stability testing. (c) Cross-section of interior anode surface without stability testing. (d) Cross-section of interior anode surface with stability testing.
Sustainability 14 07983 g006
Figure 7. Power and polarization curves for mT-SOFC before and after 80-h stability test. Temperature was 800 °C, and the fuel stream consisted of simulated combustion exhaust correlated to a methane combustion reaction at an equivalence ratio of 1.6.
Sustainability 14 07983 g007
Figure 8. Energy dispersive spectroscopy graphs of interior mT-SOFC (a) of species including carbon (b), oxygen (c), nickel (d), yttrium (e), and zirconium (f).
Sustainability 14 07983 g008aSustainability 14 07983 g008b
Table 1. Gas flow rates for all simulated combustion exhaust tests and dilute hydrogen baseline tests. Equivalence ratio refers to the combustion reaction producing the exhaust mixture listed. Total flow rates for simulated combustion exhaust and dilute hydrogen are the same at each equivalence ratio. Free electrons generated by the syngas remain constant for all tests.
Flow Rate (mL·min−1)
Simulated Combustion ExhaustDilute Hydrogen
Equivalence RatioH2COCO2N2H2N2
1.1326832118551002177
1.237631459821001128
1.3425886670100757
1.4465459513100572
1.5505044420100462
1.6524834356100390
1.7554528311100339
1.8574324277100301
1.9584221250100271
Table 2. Mass% and atom% of primary species observed on tSOFCs with and without stability testing obtained using energy dispersive spectroscopy.
No Stability TestStability Test
ElementMass%Atom%Mass%Atom%
C4.9415.816.2317.73
O19.7347.3822.7848.71
Ni21.4614.0433.1419.31
Y7.73.335.542.13
Zr46.1619.4432.3112.12
Publisher’s Note: MDPI stays neutral with regard to jurisdictional claims in published maps and institutional affiliations.

