Abstract
Green innovation, which combines “innovation-driven” and “green development,” is one of the most powerful ways to overcome resource and environmental constraints and enhance manufacturing industry sustainability. Based on the innovation value chain perspective, the green innovation process of manufacturing industry is decomposed into two stages: green scientific and technological R&D and achievement transformation. Then, using the three-stage DEA and Malmquist index model to measure the green innovation performance of China’s manufacturing industry, and compare its regional heterogeneity from the dual perspectives of static efficiency and dynamic productivity. In addition, this paper further discusses the improvement path of green innovation performance of China’s manufacturing industry. The findings are as follows: (1) The green innovation efficiency of manufacturing industry in China is at a comparatively low degree and has great potential for improvement. Moreover, it shows apparent regional heterogeneity: The green innovation efficiency in the eastern region is higher than that in the western region, and both are higher than that in the center region, confirming the phenomenon of “central collapse”. (2) The green innovation productivity of China’s manufacturing industry shows a “W-type” dynamic evolution tendency, with green technological progress as the key driving factor, while the green technical efficiency does not clearly exhibit a “catch-up effect”. Additionally, it shows significant regional heterogeneity: green innovation productivity in the western region is higher than that in the central and eastern regions, indicating a potential “backwardness advantage”. (3) The eastern region of China is located in combination IV, which indicates that it has a high rate of green innovation efficiency but a low rate of green innovation productivity; the central region is located in combination III, which indicates that it has a low rate of both green innovation efficiency and productivity; and the western region is located in combination II, which indicates that it has a low rate of green innovation efficiency but a high rate of green innovation productivity. Last but not least, this paper puts forward three kinds of paths for the improvement of the green innovation performance of China’s manufacturing industry: unilateral breakthrough, step-by-step and stimulating jumping type.
1. Introduction
China’s manufacturing industry has made tremendous historical successes and established a modern industrial system with a complete range of categories since its reform and opening up. Data released by World Bank shows that the value-added of China’s manufacturing industry overtook the United States in 2010, making it the world’s largest country. From 2012 to 2020, China’s manufacturing industry contributed RMB 16.98 trillion to RMB 26.6 trillion, accounting for approximately 30% of global added value. China’s manufacturing industry has ranked first in the world for eleven years. However, China’s manufacturing industry is “large but not strong” on the whole, facing a serious development bottleneck [1]. On the one hand, China’s extensive high-speed and low-quality economic development model in the past has been challenged unprecedentedly. China utilized 2.252 billion tons of oil equivalent energy in 2009, surpassing the US’ 2.17 billion tons, according to the International Energy Agency (IEA). Consequently, China has surpassed the U.S. as the world’s greatest energy consumer. Furthermore, The Environmental Performance Index (EPI) score of China was only 37.3, ranking 120th out of 180 countries, according to the 2020 Global EPI survey, which is jointly produced by Yale University and other research organizations. Therefore, it is unavoidable to speed the manufacturing industry green development for the transformation of China’s economic growth. On the other hand, compared with the manufacturing powers, China’s manufacturing industry has been at the low-end of value chain for a long time, and its independent innovation ability is limited. On 13 July 2018, the Vice Minister of the Ministry of Industry and Information Technology of China said, according to the Ministry of Industry and Information Technology, who undertake the survey in 2018 on more than 130 key basic materials used by more than 30 large-scale firms in China, 32% of key materials are blank in China, and 52% are imported. These fully expose that the manufacturing industry of China is highly dependent on foreign countries, the core technology is in short supply, and the ability of independent innovation is weak. Further analysis, in terms of innovation input, based on the latest data released by OECD, the U.S. continued to lead the world in R&D expenditure, at $612.7 billion in 2019; China’s R&D expenditure in 2019 was $514.8 billion, which is the second-largest in the world after surpassing the EU-27 in 2015, and the growth rate in China’s R&D expenditure is significantly faster than other countries. According to the current growth rate, it is expected that China’s R&D investment in scientific and technological will surpass the U.S. around 2022. Meanwhile, in 2019, China ranks first globally in the number of R&D personnel, which reached more than 240,000; Considering the innovation output, according to the statistical results published by the China Institute of Science and Technology Information, 6456 papers were published in the three journals of science, nature and cell, which are internationally recognized scientific and technological journals with high academic reputation, 425 of which were from China, ranking 4th in the world, while the U.S. firmly ranked first in the world, and the United Kingdom and Germany ranked second and third respectively. From the perspective of innovation input-output analysis, it can be seen that there is still a big difference between China’s innovation performance and the manufacturing powers. Therefore, China’s manufacturing industry still has a long way to go in terms of improving its innovation performance [2,3,4,5].
“Made in China 2025”puts forward the basic policy of “innovation-driven, quality first, green development, structural optimization and talent oriented”; The Fifth Plenary Session of the 18th CPC Central Committee puts forward the five development concepts of “innovation, coordination, green, openness and sharing”; The 19th National Congress of the CPC has also repeatedly proposed “promote green development and accelerate the establishment of an innovation-driven country”. Green innovation, as an organic combination of green development and innovation-driven, plays a self-evident role in the critical period of deeply promoting the construction of ecological civilization and vigorously implementing the innovation-driven development strategy [6,7,8]. According to the Guiding Opinions on Building a Market-Oriented Green Technology Innovation System released on 15 April 2019, green technology innovation are a vital driving force for green development and important support for pollution prevention and management. The 14th Five-Year Plan for National Economic and Social Development of the People’s Republic of China officially released on 12 March 2021, calls for green development and man in harmony with nature. It expounds on accelerating the green transformation of development mode from four aspects: resource utilization efficiency, utilization system, green economy, and policy system. In order to achieve these goals, technology innovation is particularly important.
Therefore, for the sake of breaking the developmental “bottle-neck” and promoting China’s manufacturing industry from big to strong, China must adhere to innovation-driven and green development, consequently, to strengthen the green innovation performance [9,10,11,12,13]. With the new round of scientific and technological revolutions and industrial reforms hastening the rebuilding of the global competition structure, focusing on the analysis of manufacturing industry’s green innovation performance and further investigating its regional heterogeneity. It will not only assist in exploring the path to improving the manufacturing industry’s green innovation performance, as well as the deep-seated reasons why China’s manufacturing industry is “large but not strong,” therefore facilitating the green innovation transformation, and promoting China’s manufacturing industry from the low-end to the middle and high-end of the global value chain; And it is also conducive to in-depth analysis of the regional heterogeneity in manufacturing industry’s green innovation performance and the possible reasons behind them, as a result, improve the manufacturing industry’s green innovation performance effectively in all regions of China. Simultaneously, this practice formulates differentiated policies of industrial development to guide the coordinated development of China’s manufacturing industry, for the sake of accelerating the breakthrough of development “bottle-neck”, ultimately promoting and implementing the strategy of manufacturing power in China.
Recently, the pattern of world science and technology competition is accelerating reconstruction. Green innovation, which is characterized by reducing the power consumption, lowering the pollution emissions, and enhancing the ecological environment, has emerged as a significant way to lead manufacturing industry transformation and upgrading [14,15,16]. The connotation of green innovation became popular in academic circles in 2005.
In general, the connotation of green innovation can be divided into the following two views: Green innovation, according to the first viewpoint, is an idea innovation that aims to stimulate innovative vigor, achieve energy efficiency and emission control and green output, as a result, lessen the negative environmental effect [17,18,19,20]; According to the second viewpoint, green innovation refers to process or technology innovation that aims to reduce energy consumption and pollution discharge, that is, green innovation has the features that can achieve energy conservation and environmental improvement in addition to the novelty and value characteristics of general innovation [21]. It can be seen that scholars have not yet reached a consensus on the connotation of green innovation.
Meanwhile, when poor innovation performance, the environment degradation, and energy supply-demand imbalance gradually becoming the major factors impeding innovation and sustainable development of China’s manufacturing industry, the green innovation performance has become increasingly the center of attention in China.
Judging from the existing literature, most research on green innovation performance is conducted from the perspective of static efficiency, scholars mainly adopt the following two methods to quantify and study the static green innovation efficiency: (1) Data Envelopment Analysis (DEA). Lin et al. utilized the DEA method to assess the green technology innovation efficiency of the manufacturing industry in China [22]. Zhang and Cui used a relational network DEA method to evaluate China’s innovation efficiency of resource-based cities [23]. The Super-SBM model was used to quantify the efficiency of green innovation efficiency in China’s Yangtze River Economic Belt [24]; The Super-SBM and Tobit models were used to measure the green innovation efficiency of China’s pollution-intensive industry [25]; Liu et al. used selected panel data within a super-efficient SBM model, in which undesirable outputs were considered, to evaluate the green innovation efficiency of Chinese provinces and cities in mainland [26]; Zeng et al. used the Super-Slack measurement and Malmquist-Luenberger index to assess the efficiency of green innovation in China’s Yangtze River Delta [27]. (2) Stochastic Frontier Analysis (SFA). Battese and Coelli used the SFA method to evaluate and analyze the regional innovation efficiency [28]; Diaz and Sánchez utilized the SFA model to assess the innovation efficiency of the small and medium-sized manufacturing industry [29]. Hong et al. utilized the SFA method to assess the innovation efficiency of the high technology industry [30]; The SFA method was used to measure the efficiency of green innovation for China’s high technical industries [31]; The RAGA-PP-SFA method, which based on traditional SFA method, was used to evaluate the green technology innovation efficiency of the manufacturing industry which are the high-end [32]; The SFA method was used to assess the efficiency of green innovation for heavy polluting sectors which located in China [33]; The technological innovation efficiency of industrial enterprises was assessed through using the SFA method [34].
Existing studies have provided us some references for accurate analysis of green innovation, but there are still the following areas that need to be further expanded: (1) It is difficult to choose input and output indicators for measuring green innovation performance of manufacturing industry, due to there being no consensus on the connotation of green innovation in the current available literature. Furthermore, there primarily focus on the perspective of static green innovation efficiency when measuring the green innovation performance, paying less attention to the undesirable output which is pollutant emissions of innovation activities, and ignoring the slack or congestion of input factors, resulting in a slight deviation in the study findings of green innovation performance. In addition, there is a lack of additional investigation into the internal reasons for the intertemporal improvement or decline of green innovation performance from the dynamic green innovation productivity perspective, that is it ignores the intertemporal changes in green technical efficiency and green technological progress. (2) The existing literature almost views the green innovation process of the manufacturing industry as a “black box”, so it lacks analysis and revelation of the phased dynamic mechanism of manufacturing industry’s green innovation, which results in the interpretability of the calculation results is insufficient; At the same time, the existing literature is relatively less from the dual perspective of static efficiency and dynamic productivity to further analyze the possible regional heterogeneity of the manufacturing industry’s green innovation performance. (3) The existing literature only uses the DEA or SFA method to study the manufacturing industry’s green innovation performance, but on the one hand, the DEA models such as CCR, BCC, and SBM are all used to conduct horizontal static analysis at the same time point, as a result, the green innovation performance obtained is not always dynamically comparable, and when the total number of the decision units is close to the number of input-output indicators, the deviation between measured value and actual value is large; On the other hand, using the SFA model, which needs to estimate the production function, and the function form set is critical. Simultaneously, only a single output can be measured, which leads to the limitations of the measurement of green innovation performance.
In view of this, this study attempts to make efforts in the following aspects: (1) This paper fully considers the benefits of the innovation activities, based on the connotation of green innovation, selects reasonable input-output indicators to evaluate the green innovation performance, and incorporates the undesirable output (pollutant emission) into the measurement system, then to address the problems that are “slack” or “congestion” of input factors. Meanwhile, this paper not only evaluates the manufacturing industry’s green innovation performance from the static efficiency perspective, to conduct a horizontal analysis on it at the same time point; but also further studies the green innovation performance from the spatial and temporal dimensions from the perspective of dynamic productivity, to explore its dynamic changing trend, consequently provide the necessary basis for tracing the underlying cause of the intertemporal improvement or decline of green innovation performance in China’s manufacturing industry. (2) In view of the perspective of innovation value chain, the green innovation process contains two mainly stages: green scientific and technological R&D and achievement transformation. And the performance in each stage is further analyzed, to improve the comprehensiveness of analysis on green innovation performance and the interpretability of measurements. Moreover, this paper further explores the differences and interval distribution of green innovation efficiency and green innovation productivity of the manufacturing industry in China’s various regions through two-dimensional cluster analysis, thus provide references for improving the overall green innovation performance in China’s manufacturing industry, promoting coordinated development of regional green innovation, and accelerating the construction of beautiful China and an innovation-oriented country. (3) To overcome the shortcomings of traditional methods, the three-stage DEA and Malmquist index method are comprehensively used to study manufacturing industry’s green innovation performance in which the influence of environmental effect and random error can be eliminated. And dynamic analysis is added to reflect its evolution trend at different time points. Moreover, it can organically integrate the advantages of the three-stage DEA and Malmquist index method, effectively making up for the inherent defects of the single measurement method, as a result, make the measurement results more reliable and accurate. Last but not least, based on the above research result, for the manufacturing industry’s green innovation performance in China, this paper finally puts forward three kinds of improvement paths: unilateral breakthrough, step-by-step and stimulating jumping type.
However, it is worth noting that the research limitations of this paper mainly lie in that, under the existing theoretical background, the academic circles have not reached a consensus on the connotation of green innovation. Therefore, even though this paper fully considers the economic, social, and environmental benefits of innovation activities and incorporates the undesirable output (pollutant emission) of innovation activities into the measurement system, the input-output indicators selected may still have some limitations, and this may lead to the green innovation performance evaluation of China’s manufacturing industry is not completely precise.
Based on the above ideas, as shown in Figure 1, this paper is structured as follows: Section 1 introduces the research purpose and necessity, at the same time illustrates the theoretical background and innovation points of this paper; Section 2 clarifies the index system and data resources; Section 3 elaborates the methodologies, which include three-stage DEA model and Malmquist index method; Section 4 presents empirical results and discusses the analysis results; Section 5 summarizes the research findings and puts up forward policy recommendations.
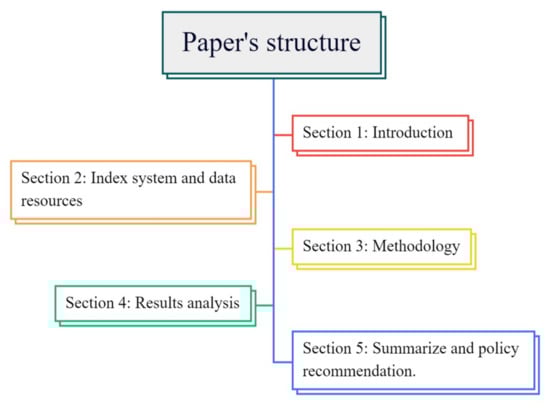
Figure 1.
The organizational structure of this paper.
2. Green Innovation Performance Measurement Index System and Data Sources
2.1. Green Innovation Performance Measurement Index System of Manufacturing Industry
In view of the perspective of the innovation value chain, the manufacturing industry’s green innovation process contains two mainly stages: green scientific and technological R&D and achievement transformation, referencing to Yang et al. [35] and Yin et al. [36]. Then, comprehensively considering the connotation of green innovation (pursuing economic, social, and environmental benefits, and considering the undesirable output of innovation activities), the principle of indicator selection and the availability of data, this paper further constructs the measurement index system of manufacturing industry’s green innovation performance in China, including three first-level indicators such as green scientific and technological R&D investment, intermediate output, and final output of green innovation achievements (taking into account both desirable output and undesirable output), and 12 s-level indicators, which is shown in Table 1.

Table 1.
Measurement index system of green innovation performance of manufacturing industry.
- (1)
- Green scientific and technological R&D investment
Generally speaking, the green scientific and technological R&D investment of manufacturing industry mainly includes the investment of R&D personnel and R&D expenditure in the green innovation process. Referencing to Tian and Wang [37], Luo et al. [38], and Huang and Chen [39], the full-time equivalent of R&D personnel is selected to reflect the investment of R&D personnel. Moreover, the R&D intensity, number of R&D projects, and expenditure on new product development are the preconditions for the manufacturing industry to develop green innovation activities, which indicates the investment of scientific and technological funds in the process of green innovation. In addition, the investment in environmental pollution control reflects the investment in manufacturing industry’s green innovation activities to reduce environmental pollution.
- (2)
- Intermediate output of green innovation achievements
The intermediate output of green innovation achievements is the transition stage between green scientific and technological R&D and achievement transformation. This is not only the output of the green scientific and technological R&D stage, but also is the input of the achievement transformation stage. In general, the intermediate output is the scientific and technological knowledge output, the number of green invention patent and scientific papers published is important scientific and technological knowledge outputs in the green innovation process [40,41]. Among them, the number of green invention patent is widely used to measure the degree of new knowledge creation, which is an important intermediate output of green innovation process; the number of scientific papers published reflects the knowledge output of green innovation at theoretical level, which can be used to compare the gap between theory and practice of green innovation. Therefore, the number of green invention patent and the number of scientific papers published are selected to measure the intermediate output of innovation achievements.
- (3)
- Final output of green innovation achievements
The final output of green innovation achievements is the output of achievement transformation stage in the green innovation process, which can generally be split into desirable output and undesirable output. The desirable output is directly related to the commercialization and marketization of innovation achievements. Therefore, the sales revenue of new products and contract amount in technology market are selected as the desirable output indicators. Meanwhile, referencing to Yang and Wei [42], and Chen et al. [43], the industrial wastewater emission, industrial SO2 emissions, and industrial solid waste are selected to measure the undesirable output, to evaluate the environmental effects of green innovation activities of China’s manufacturing industry.
2.2. Data Sources
The data mainly comes from China Statistical Yearbook (2010–2019), China Statistical Yearbook on Science and Technology (2010–2019), China Statistics Yearbook on High Technology Industry (2010–2019), and China Energy Statistical Yearbook (2010–2019). The statistical coverage covers the industrial enterprises above the designated size. Additionally, taking into account the certain time lag in the transformation of input into output in green innovation process of manufacturing industry, the data is processed with a one-year lag and the undesirable output is taken into the reciprocal forms. Due to a severe data shortage in Tibet, the research scope of this paper is the remaining 30 provincial-level regions except for Tibet. And the missing data of individual years is supplemented by the interpolation method.
3. Methodology
3.1. Three-Stage DEA Model
DEA model is a typical non-parametric static efficiency analysis method [44,45]. Based on the classic DEA model, Fried et al. proposed a new research method of static efficiency, which is the three-stage DEA model [46]. This method combines the advantages of non-parametric DEA model and stochastic frontier analysis (SFA) of parametric method. By eliminating environmental factors and random interference, the accuracy and objectivity of the research results are effectively improved [47,48,49]. The specific steps of building a three-stage DEA model are as follows:
Stage 1: the traditional DEA model
The first stage of three-stage DEA model is the calculation of the traditional DEA model. According to the characteristics of manufacturing industry, the BCC model is selected for the first stage. Assuming that the output factor of the decision unit is , the input factor is , the weight matrices corresponding to the output factor and the input factor are as follows respectively:
The analysis result of the static green innovation efficiency of manufacturing industry for the decision unit is:
Then, the BCC model of static green innovation efficiency of manufacturing industry under variable return to scale (VRS) is further built as follow:
Stage 2: similar SFA model
According to the first stage of three-stage DEA model, the SFA model is built as follow:
where denotes the slack value of the input for the decision unit, denotes the functional form related to the environment variable and the parameter of environment variable, corresponding to the slack value of each input; denotes the mixed error term; represents the random error term, which conforms to the normal distribution ; denotes management inefficiency (Note: Through the unilateral generalized likelihood ratio test, it is found that there is a problem of management inefficiency.), which conforms to the normal distribution , and they are independent from each other. Setting that , whose value is between 0 and 1; When is close to 1, it is technical inefficiency, namely that the management inefficiency is main reason, and the less the random error matters.
Then, the original data can be adjusted by using the results of SFA model analysis, as shown in Equation (4):
where is the adjusted input value, is the input value before the adjustment, is the adjustment of relevant factors of environment variables, and is the adjustment of relevant factors of random error term. Thus, the influence of environmental factors and random error factors can be eliminated.
Stage 3: Adjusted DEA model
In the third stage, the initial measurement results can be adjusted according to the adjustment in the second stage, so that more accurate research results without environmental factors and random error factors can be obtained. The TE obtained after analysis is manufacturing industry’s green innovation efficiency, which is the distance between the decision-making unit (DMU) and the frontier under the condition of VRS, represents the gap between the current resource allocation and the optimal allocation of DMU, and it reflects the comprehensive competitiveness of DMU. The greater the green innovation efficiency, the smaller the distance between DMU and the frontier, and the stronger the comprehensive competitiveness; On the contrary, the smaller the green innovation efficiency, the bigger the distance between DMU and the frontier, and the weaker the comprehensive competitiveness.
3.2. Malmquist Index Method
The Malmquist index method is widely used after improvement by Fare and Caves et al., which is a non-parametric method to measure the dynamic productivity of the DMU in different periods. Therefore, the Malmquist index method can be used to measure the manufacturing industry’s dynamic green innovation performance. Referencing to Wu et al. [50], Chen et al. [51], Huang et al. [52], Lu et al. [53], the operation process of Malmquist index method is as follows:
Assuming that each period , the region , carries out the input and gets the output, which is . The green innovation productivity of manufacturing industry under technical conditions in the period can be given as follow:
The green innovation productivity of manufacturing industry under technical conditions in the t + 1 period can be given as follow:
Then, the Malmquist index of manufacturing industry’s dynamic green innovation productivity from period to period t + 1 can be further obtained as:
where TECH denotes the green technical efficiency index of manufacturing industry, when TECH > 1, it represents the green technical efficiency of decision-making unit increases; On the contrary, when TECH < 1, it represents that decreases. TPCH denotes the green technological progress index of manufacturing industry, when TPCH > 1, it represents the green technological progress index of decision-making unit increases; On the contrary, when TPCH < 1, it represents that decreases. Through the analysis of the measurement results, it can be known that whether the change of dynamic green innovation productivity of decision-making unit of manufacturing industry is driven by the change of green technical efficiency or the change of green technological progress.
Three-stage DEA model decomposes slack variables into environmental effect, management inefficiency, and random error in the second stage, which can effectively distinguish environmental variables and random factors, so that it can avoid the impact of mandatory adjustments on the results [54,55,56]; The Malmquist index method can not only compare the green innovation performance of 30 provincial-level manufacturing industry in different periods, but also can make up for the shortcomings of the traditional DEA model that cannot be used for dynamic measurement. Therefore, the three-stage DEA model and Malmquist index method are used in this paper to measure the green innovation performance in China’s manufacturing industry from 2009 to 2017, based on the dual perspectives of static efficiency and dynamic productivity, and then further analyze its regional heterogeneity.
4. Results Analysis and Discussion
4.1. Analysis on the Static Efficiency Perspective
In view of the perspective of the innovation value chain, the green innovation process of manufacturing industry contains two mainly stages: green scientific and technological R&D and achievement transformation. From the static efficiency perspective, this paper uses three-stage DEA method to measure the green innovation performance of manufacturing industry in the whole country of China and eastern, central, and western regions from 2009 to 2017. Moreover, this paper further calculates the green innovation performance of manufacturing industry in the eastern, central, and western regions, in order to intuitively compare their regional heterogeneity, the measurement results are shown in Table 2.
Table 2.
Measurement results from the static efficiency perspective.
As Table 2 shows, the manufacturing industry’s green innovation efficiency from 2009 to 2017 is 0.673 in the whole country of China, which is at a relatively low level and still has great potential for improvement. Moreover, from a further stage analysis, the efficiency of green scientific and technological R&D stage and achievement transformation stage of China’s manufacturing industry are 0.568 and 0.617 respectively, which are far less than 1. The main reasons are shown as follows: On the one hand, although China has become the largest manufacturing country, it is dependent on excessive energy consumption and serious environmental pollution [57,58,59], and the idea of green development is still relatively weak. Moreover, the manufacturing industry started late in China, the capability of technological innovation is comparatively weak, and the utilization efficiency of innovation input is low, the output performance needs to be strengthened urgently. On the other hand, the R&D personnel of China’s manufacturing industry is often more inclined to theoretical innovation, but less attention is paid to the application of scientific and technological R&D. As a result, many manufacturing enterprises find it difficult to apply the relevant research results in practice when transforming achievements. In addition, the products of scientific and technological research and development are divorced from the practical application of production, which greatly restricts the efficiency of achievement transformation stage. Under the comprehensive influence of these two aspects, the green innovation of China’s manufacturing industry is still in an initial development stage. Concurrently, relevant technical standards and science and technology policies are imperfect [60], and the innovation process is not strictly supervised. As a result, the scientific and technological research and development lags behind and the transformation of scientific research achievements is slow, which leads to the bottleneck constraints of manufacturing enterprises in the transformation to green innovation. Consequently, the green innovation efficiency of manufacturing industry in China is low, which needs to be urgently improved.
The green innovation efficiency of manufacturing industry shows clear regional variation in the eastern, central, and western areas of China, as illustrated in Figure 2. It can be observed that the efficiency of green innovation in the eastern region (0.768) is higher than that in the western region (0.638), and both are higher than that in the central region (0.589), which confirms the phenomenon of “central collapse” to a certain extent. The main reason lies in that the central region is located inland, manufacturing enterprise capital, human capital, technological level, industrial foundation, institutional policies, and location advantages are relatively weak, the R&D intensity is low, and the proportion of state-owned enterprises is too high, which leads to the innovation vitality is not enough. Moreover, the dependence on resources and environment is strong in the central region. In sharp contrast, there are many universities and research institutions in the eastern region. Therefore, the communication channels are wider and opportunities are more intensive for manufacturing enterprises, which can effectively solve the problems of information asymmetry in the scientific and technological R&D stage and usage phase. These lead to a low level of green innovation efficiency of manufacturing industry in the central region, which is much lower than that in the eastern region. In addition, compared with the western region, manufacturing industry in the central region has become a “policy depression” due to the lack of the policy inclination for innovation. The innovation soft environment such as policy and system are relatively backward in the central region. As a result, there is a disparity in green innovation efficiency of manufacturing industry between the central region and the western region.
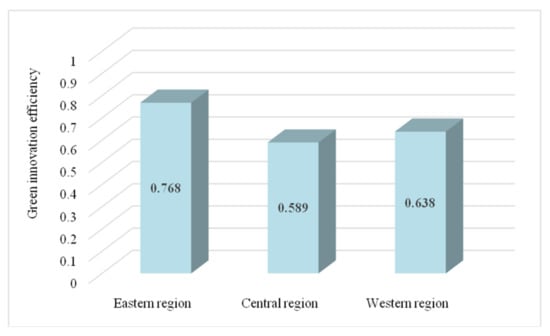
Figure 2.
Green innovation efficiency of China’s manufacturing industry in eastern, central and western regions.
4.2. Analysis on the Dynamic Productivity Perspective
4.2.1. Overall Analysis in the Whole Country
Using Malmquist index method, this paper studies on the dynamic green innovation performance index (TFP) of China’s manufacturing industry from 2009 to 2017 from the dynamic productivity perspective, and further decomposes it into the green technical efficiency index (TECH) and the green technological progress index (TPCH). The results are shown in Table 3.
Table 3.
Overall analysis results from the dynamic productivity perspective.
As shown in Table 3, the dynamic green innovation productivity of China’s manufacturing industry from 2009 to 2017 displayed “W-type” fluctuation evolution characteristics. The dynamic green innovation productivity first decreased from 1.583 in 2009–2010 to 0.859 in 2012–2013, then increased to 1.400 in 2014–2015, then decreased to 1.035 in 2015–2016, and finally increased to 1.142 in 2016–2017, it can be calculated that the annual average growth rate is 10%. Concurrently, TECH is always 1, while the average value of TPCH is greater than 1, and TPCH > TECH. The above analysis indicates that from the dynamic productivity perspective, the green innovation performance of China’s manufacturing industry shows a dynamic evolution trend, and green technological progress is the main driving force, while the green technical efficiency does not have an obvious “catch-up effect”. The reasons may be that with the in-depth implementation of the concept of green development, in order not to be eliminated by the market and grasp the development opportunity, manufacturing enterprises are forced to continuously strengthen scientific and technological research and development and tackle key technology problems [61,62], thereby accelerating the green technology innovation and the dissemination of green technology innovation successes, then promoting the progress of green technological, and finally realizing the dynamic green innovation productivity improvement of China’s manufacturing industry. However, due to the late start of manufacturing industry in China, lack of independent innovation ability, strong technical dependence, and the technical restrictions and technical barriers implemented by the manufacturing power [63], which resulted in the improving effect of green technical efficiency is not apparent, and the green technical efficiency has not shown an obvious “catch-up effect”. Hence, in China, green technical efficiency has not become the primary motivator for promoting the dynamic green innovation productivity of manufacturing industry.
4.2.2. Regional Analysis in the Eastern, Central and Western Regions
Based on the overall analysis in the whole country of China, this paper further analyzes the green innovation productivity of manufacturing industry in the eastern, central and western regions. The results are shown in Table 4.
Table 4.
Regional analysis results from the dynamic productivity perspective.
As Table 4 shows, the dynamic green innovation productivity of manufacturing industry in the eastern, central, and western regions of China is 1.042, 1.065, and 1.078, respectively, with the western region having the highest dynamic green innovation productivity. This indicates that although the manufacturing industry’s green innovation efficiency in the western region is lower than that in the eastern region, its growth rate (dynamic green innovation productivity) is dramatically higher than that in the eastern region, which displays an obvious “advantages of backwardness”. The main reasons are that with the continuous advancement of the western development strategy, the western region has got remarkable achievements in economic growth, social development, and environmental improvement. Meanwhile, it has obtained certain knowledge and technology spillover through industrial gradient transfer and technology diffusion. Moreover, compared with the eastern coastal areas, the technology introduction is less costly and faster in the western region, so that its technological innovation can be promoted rapidly at a lower cost. In recent years, the implementation of a series of innovative development strategies and the inclined policies for innovation have also brought valuable opportunities to the innovation and development of manufacturing industry in the western region. Additionally, the western region has abundant advantages of ecological resources, which is beneficial to promoting energy saving and emission reduction, and developing a circular economy, for the purpose of supporting green development, and then promoting an increase in the pace of green innovation growth (dynamic green innovation productivity).
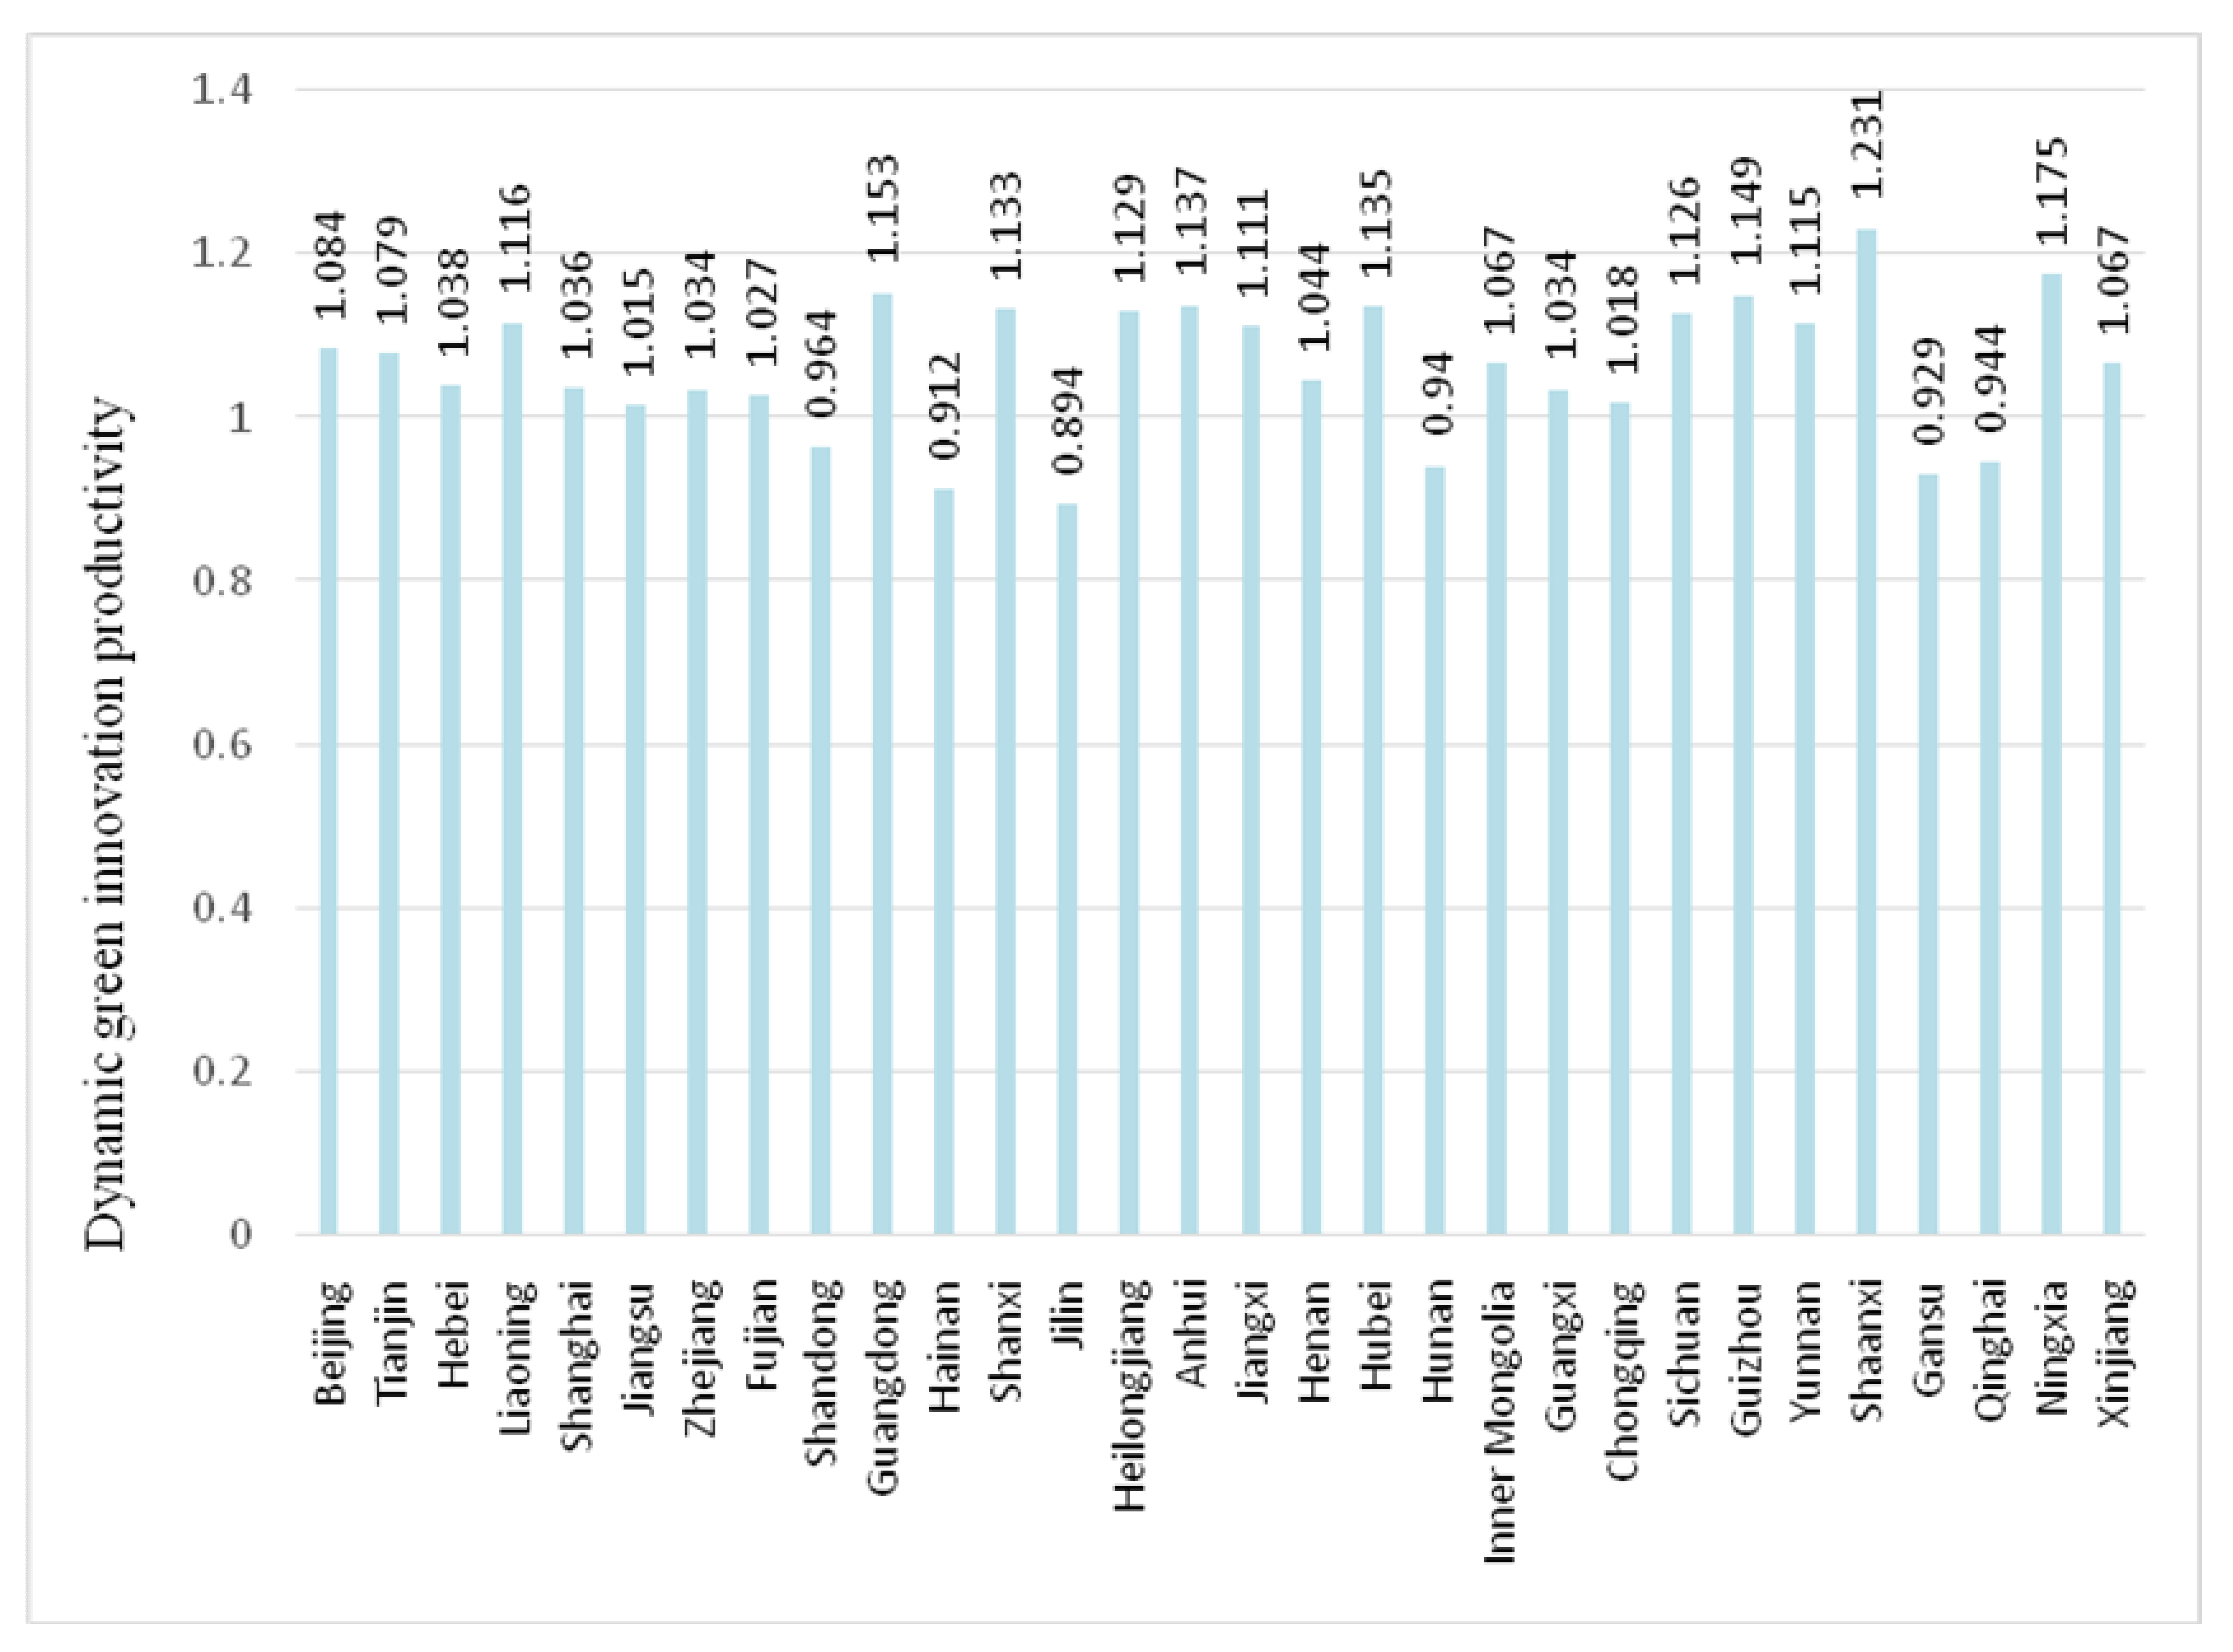
It is noteworthy that, as shown in Figure 3, the dynamic green innovation productivity of manufacturing industry in most provinces of China shows an upward trend, such as the dynamic green innovation productivity in Liaoning & Guangdong, Anhui & Hubei, and Shaanxi & Ningxia show a significant upward trend. However, the dynamic green innovation productivity in Shandong & Hainan, Jilin & Hunan, and Gansu & Qinghai show a downward trend. Among which, the dynamic green innovation productivity in Hainan, Hunan, and Qinghai show a downward trend, which is mainly due to the decline of green technological progress index; While the downward trend of dynamic green innovation productivity in Shandong, Jilin and Gansu Province are caused by the combined effect of the decline of green technological progress index and green technical efficiency index.
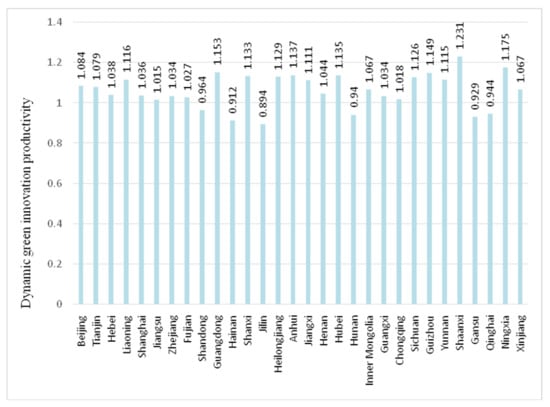
Figure 3.
Dynamic green innovation productivity of China’s provincial-level manufacturing industry.
4.2.3. Path Analysis of Green Innovation Performance Improvement
For the sake of improving the green innovation performance of China’s manufacturing industry effectively, based on the measurement results shown in Table 2 and Table 4, the path map of green innovation performance improvement for China’s manufacturing industry can be constructed. As shown in Figure 4, the horizontal axis represents the green innovation efficiency of manufacturing industry, and the vertical axis represents the green innovation productivity of manufacturing industry.
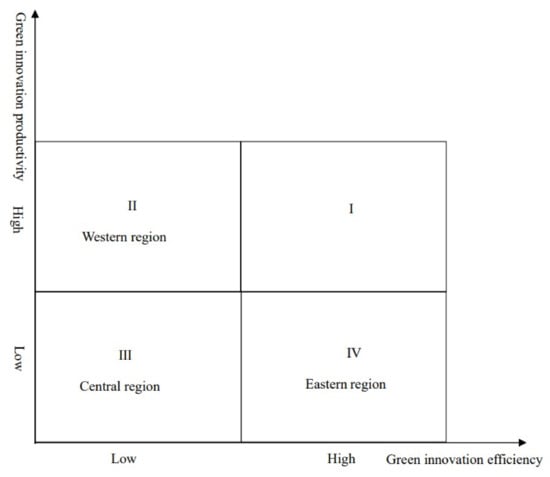
Figure 4.
Path map of green innovation performance improvement of manufacturing industry.
As shown in Figure 4, four combinations of I, II, III, and IV are divided based on the two dimensions of green innovation efficiency and green innovation productivity growth rate in the eastern, central, and western regions. With the combination I being the optimal, different combinations represent different ways to improve the green innovation performance in China’s manufacturing industry. It can be seen as follows:
- (1)
- The eastern region of China is located in the combination IV, which means that green innovation efficiency of its manufacturing industry is high, while the green innovation productivity is low. The main reasons are as follows: the eastern region has developed economy, rich resources and obvious location advantages [64], additionally, universities and research institutions in the eastern region are relatively dense, so that the green innovation efficiency of its manufacturing industry is high. However, for one side, due to unbalanced development of green innovation among the provinces in the eastern region’s manufacturing industry [65], although the provinces with high green innovation efficiency have a leading role in the overall green innovation efficiency of manufacturing industry, the provinces with low rate offset the leading advantages of the provinces with high rate, thus inhibiting the overall green innovation development of manufacturing industry in the eastern region. Concequently, for the eastern region, the growth rate of green innovation efficiency (green innovation productivity) of manufacturing industry increases slowly; For the other side, the eastern region is experiencing a key stage of industrial structure transition, and the green innovation development of manufacturing industry is also experiencing a bottleneck. Moreover, the development ideas formed in the past extensive development model in the eastern region are incompatible with the current green development path of ecological priority [66], which leads to the speed of green innovation development decline, further lead to the green innovation productivity of manufacturing industry in the eastern region is relatively low.
- (2)
- The central region is located in the combination III, which means that green innovation efficiency and green innovation productivity of its manufacturing industry are both low. The main reasons are as follows: For one side, the central region serves as a hub of China’s industrial transfer and resource allocation, as well as an important energy and raw material base for manufacturing industry, while the manufacturing industry development in the central region is frequently accompanied by issues of environmental damage and resource loss, which runs contrary to the green innovation concept of sustainable development [67]. Therefore, in the central region, it leads to the “collapse” of green innovation efficiency of manufacturing industry; On the other side, for the eastern and western regions, in terms of national policies, the manufacturing industry has its own exclusive green innovation development policies, while the central region lacks corresponding preferential policies [68], which results in the green innovation development of manufacturing industry in the central region lacks necessary policy support and incentive measures. Furthermore, the lack of green innovation resources and vitality leads to the phenomenon that, in the central region, green innovation efficiency and green innovation productivity of its manufacturing industry are both low.
- (3)
- The western region is located in the combination II, which means that the green innovation efficiency of its manufacturing industry is low, while the green innovation productivity is high. The main reasons are as follows: For the western region of China, the green innovation of manufacturing industry is still in infancy, human capital, technological level, and industrial foundations are relatively weak, and the locational conditions are relatively poor, which are in a large gap with the eastern region. Therefore, the green innovation efficiency of its manufacturing industry is still at a relatively low level. However, since the implementation of the western development strategy [69], the process of urbanization in the western region has accelerated, the modernization construction has achieved remarkable achievements, the development of regional characteristics and advantageous industries has accelerated, as well as the economic development and technological research and development have advanced significantly. Moreover, for the western region, with the support of the national innovation policy, the innovation vitality and innovation soft environment of manufacturing industry have been strengthened, as well as the green innovation productivity has been significantly improved. As a result, the growth rate of green innovation efficiency (dynamic green innovation productivity) of manufacturing industry in the western region, is significantly higher than that in the eastern region, reflecting the potential “advantages of backwardness” of green innovation development [70].
On the basis of the above analysis and discussion, this paper puts forward three kinds of improvement paths for the green innovation performance of China’s manufacturing industry, which are unilateral breakthrough, step-by-step, and stimulating jumping type, respectively.
- (1)
- The unilateral breakthrough improvement path from combination II to combination I or from combination IV to combination I, namely that in the process of the green innovation development, taking the goal of relatively low green innovation efficiency or growth rate of green innovation productivity as a unilateral breakthrough, continuously improve the green innovation efficiency of the western region or the green innovation productivity of the eastern region, accordingly enhance the green innovation performance of China’s manufacturing industry.
- (2)
- The step-by-step improvement path from combination III to combination II to combination I, or from combination III to combination IV to combination I, namely that since the central region’s green innovation efficiency and green innovation productivity are both low, it is necessary to fully exploit its advantages and compensate for its disadvantages in the process of green innovation development. After transitioning from combination II or IV to unilateral breakthrough, the green innovation performance of manufacturing industry in the central region moves toward combination I, in which the green innovation efficiency and green innovation productivity growth rate are both high.
- (3)
- The stimulating jumping improvement path from combination III to combination I, namely that in the central region of China, the green innovation development of manufacturing industry from the state of green innovation efficiency and green innovation productivity both are low to the state of that both are high. This stimulating jumping improvement path is hard to achieve in general, but it still has operational possibilities under the guidance of national policies.
5. Conclusions and Policy Recommendations
In view of the perspective of the innovation value chain, the green innovation process of manufacturing industry contains two mainly stages: green scientific and technological R&D and achievement transformation. Then, using the three-stage DEA model and Malmquist index method to measure the green innovation performance of China’s manufacturing industry, and compares its regional heterogeneity from the dual perspectives of static efficiency and dynamic productivity. Last but not least, this paper further discusses the improvement path of the green innovation performance of China’s manufacturing industry. The findings are as follows:
(1) Based on the analysis on the efficiency of green scientific and technological R&D stage and achievement transformation stage, it can be known that the green innovation efficiency of China’s manufacturing industry is at a comparatively low level and still has great potential for improvement. Further, it shows apparent regional heterogeneity which is that the green innovation efficiency in the eastern region is higher than that in the western region, and both are higher than that in the central region, confirming the phenomenon of “central collapse”. (2) The green innovation productivity of China’s manufacturing industry shows a dynamic evolution trend of “W-type”, with green technological progress as the key driving factor, while the green technical efficiency does not have an obvious “catch-up effect”. Additionally, it shows significant regional heterogeneity: green innovation productivity in the western region is higher than that in the central and eastern regions, indicating a potential “backwardness advantage”. (3) The eastern region is located in combination IV, which indicates that it has a high rate of green innovation efficiency but a low rate of green innovation productivity; the central region is located in combination III, which indicates that it has a low rate of both green innovation efficiency and productivity; and the western region is located in combination II, which indicates that it has a low rate of green innovation efficiency but a high rate of green innovation productivity. Last but not least, there are three kinds of improvement paths: unilateral breakthrough, step-by-step and stimulating jumping type, which are for the green innovation performance of China’s manufacturing industry.
Finally, on the basis of the above conclusions, this paper puts forward the following policy recommendations:
- (1)
- For one side, China is supposed to take the construction of “a beautiful China” as a opportunity, focusing more on the green development of manufacturing industry, promoting sustainable development, and establishing the development concept that lucid waters and lush mountains are invaluable assets, consequently build up a corresponding green technology innovation system. For the other side, China should take the implementation of innovation-driven development strategy and the construction of an innovation-oriented country as a favorable opportunity, continue to strengthen scientific and technological research and development and tackle key technology problems, and actively promote the industrialization of scientific and technological achievements of China’s manufacturing industry. In addition, China is supposed to focus on the organic connection of scientific and technological research and development and achievement transformation, in the cause of effectively avoiding the disconnection between scientific and technological R&D and practical production application.
- (2)
- The eastern region ought to make reasonable use of its advantages in capital, human capital, technical level, institutional policies, location advantages of manufacturing industry, effectively give play to its “leading and demonstration” role in green innovation development, encourage and advocate its support for underdeveloped regions, and expand its penetration and radiation effect to other regions. Furthermore, the eastern region should endeavor to support the long-term and sound growth of green innovation in order to achieve the “double improvement” of green innovation efficiency and productivity. In response to the phenomena of “central collapse,” the central region should seek to enhance the R&D investment intensity, effectively solve the imperfections of institutional policies, and stimulate regional innovation potential and vitality. Moreover, with the help of the innovation guiding role of regional policies, the central region should actively integrate into the general pattern of national innovation development strategy, cultivate a number of manufacturing industries with regional characteristics, and reduce excessive dependence on resources and environment. For the western region, it should fully utilize the potential “advantages of backwardness” in green innovation development, and reasonably formulate the supporting policies, as a result, actively build a modern green industry system led by innovation.
- (3)
- It is important for China to accelerate the research and development of key technologies, using the driving role of technology to accelerate the breakthrough of development “bottle-neck” of China’s manufacturing industry, ultimately promoting manufacturing industry’s green innovation performance. Moreover, China is ought to grasp the innovation demand and achievement transformation of the current manufacturing industry, clarify the innovation direction and green development trend in advance, and carry out scientific and technological R&D and achievement transformation in a timely and effective manner, and accordingly to improve the efficiency of green scientific and technological R&D and achievement transformation in the innovation process of manufacturing industry, then to enhance regional green innovation performance, actively guide the transformation towards green innovation development of China’s manufacturing industry, and finally, for the eastern, central and western regions of China, to effectively promote the green innovation performance of manufacturing industry towards combination I.
Author Contributions
Data curation, H.Y.; Formal analysis, H.Y.; Methodology, X.Z.; Software, H.Y.; Supervision, H.Y. All authors have read and agreed to the published version of the manuscript.
Funding
This research was funding by the National Natural Science Foundation of China (Grant No.72004087; Grant No.72102061; Grant No.72163021; Grant No.72064017; Grant No.71862024), Social Science Fund Project of Jiangxi Province, China (Grant No.21YJ28), Humanities and Social Science Research Youth Fund Project of Ministry of Education of China (Grant No.20YJC790161), Research Fund Project of Humanities and Social Science of Universities in Jiangxi Province, China (Grant No.JJ20209), National Social Science Major Project of China (Grant No.16ZDA047; Grant No.18ZDA047), Key Project of Education Science Planning of Jiangxi Province, China (Grant No.20ZD004).
Institutional Review Board Statement
Not applicable.
Informed Consent Statement
Not applicable.
Data Availability Statement
All data generated or analyzed during this study are included in this published article.
Conflicts of Interest
The authors declare no conflict of interest.
References
- Yang, H.; Zhang, F.; He, Y. Exploring the effect of producer services and manufacturing industrial co-agglomeration on the ecological environment pollution control in China. Environ. Dev. Sustain. 2021, 23, 16119–16144. [Google Scholar] [CrossRef]
- Deng, Z.; Jean, R.-J.B.; Sinkovics, R.R. Determinants of international innovation performance in Chinese manufacturing firms: An integrated perspective. Asian Bus. Manag. 2012, 11, 31–55. [Google Scholar] [CrossRef]
- Lu, F.; He, W.; Cheng, Y.; Chen, S.; Ning, L.; Mei, X. Exploring the upgrading of Chinese automotive manufacturing industry in the global value chain: An empirical study based on panel data. Sustainability 2015, 7, 6189–6211. [Google Scholar] [CrossRef] [Green Version]
- Tang, X.; Zhang, W.; Lin, W.; Lao, H. Low-carbon sustainable development of China's manufacturing industries based on development model change. Sci. Total Environ. 2020, 737, 140397. [Google Scholar] [CrossRef]
- Yang, H.; Li, L.; Liu, Y. The effect of manufacturing intelligence on green innovation performance in China. Technol. Forecast. Soc. Chang. 2022, 178, 121569. [Google Scholar] [CrossRef]
- Aguilera-Caracuel, J.; Ortiz-de-Mandojana, N. Green innovation and financial performance: An institutional approach. Organ. Environ. 2013, 26, 365–385. [Google Scholar] [CrossRef]
- Wu, W.; Sheng, L.; Tang, F.; Zhang, A.; Liu, J. A system dynamics model of green innovation and policy simulation with an application in Chinese manufacturing industry. Sustain. Prod. Consum. 2021, 28, 987–1005. [Google Scholar] [CrossRef]
- Yang, Y.; Liu, D.; Zhang, L.; Yin, Y. Social Trust and Green Technology Innovation: Evidence from Listed Firms in China. Sustainability 2021, 13, 4828. [Google Scholar] [CrossRef]
- De Medeiros, J.F.; Ribeiro, J.L.D.; Cortimiglia, M.N. Success factors for environmentally sustainable product innovation: A systematic literature review. J. Clean. Prod. 2014, 65, 76–86. [Google Scholar] [CrossRef]
- Ghisetti, C.; Quatraro, F. Green technologies and environmental productivity: A cross-sectoral analysis of direct and indirect effects in Italian regions. Ecol. Econ. 2017, 132, 1–13. [Google Scholar] [CrossRef]
- Qu, Y.; Yu, Y.; Appolloni, A.; Li, M.; Liu, Y. Measuring green growth efficiency for Chinese manufacturing industries. Sustainability 2017, 9, 637. [Google Scholar] [CrossRef] [Green Version]
- Gao, K.; Yuan, Y. The effect of innovation-driven development on pollution reduction: Empirical evidence from a quasi-natural experiment in China. Technol. Forecast. Soc. Chang. 2021, 172, 121047. [Google Scholar] [CrossRef]
- Yang, H.; Xu, X.; Zhang, F. Industrial co-agglomeration, green technological innovation, and total factor energy efficiency. Environ. Sci. Pollut. Res. 2022, 29, 1–20. [Google Scholar] [CrossRef]
- Chen, J.; Cheng, J.; Dai, S. Regional eco-innovation in China: An analysis of eco-innovation levels and influencing factors. J. Clean. Prod. 2017, 153, 1–14. [Google Scholar] [CrossRef]
- Luan, B.; Huang, J.; Zou, H.; Huang, C. Determining the factors driving China’s industrial energy intensity: Evidence from technological innovation sources and structural change. Sci. Total Environ. 2020, 737, 139767. [Google Scholar] [CrossRef]
- Shi, X.; Wang, X.; Chen, P. A network-based approach for analyzing industrial green transformation: A case study of Beijing, China. J. Clean. Prod. 2021, 317, 128281. [Google Scholar] [CrossRef]
- Gee, S.; McMeekin, A. Eco-innovation systems and problem sequences: The contrasting cases of US and Brazilian biofuels. Ind. Innov. 2011, 18, 301–315. [Google Scholar] [CrossRef]
- García-Pozo, A.; Sánchez-Ollero, J.L.; Marchante-Lara, M. Eco-innovation and management: An empirical analysis of environmental good practices and labour productivity in the Spanish hotel industry. Innovation 2015, 17, 58–68. [Google Scholar] [CrossRef]
- Feng, Z.; Chen, W. Environmental regulation, green innovation, and industrial green development: An empirical analysis based on the Spatial Durbin model. Sustainability 2018, 10, 223. [Google Scholar] [CrossRef] [Green Version]
- Yin, J.; Wang, D. Dynamic evaluation of green innovation efficiency of patent-intensive industries: Evidence from the new equipment manufacturing. Technol. Anal. Strateg. Manag. 2021, 33, 1–14. [Google Scholar] [CrossRef]
- Mirata, M.; Emtairah, T. Industrial symbiosis networks and the contribution to environmental innovation: The case of the Landskrona industrial symbiosis programme. J. Clean. Prod. 2005, 13, 993–1002. [Google Scholar] [CrossRef]
- Lin, S.; Sun, J.; Marinova, D.; Zhao, D. Evaluation of the green technology innovation efficiency of China’s manufacturing industries: DEA window analysis with ideal window width. Technol. Anal. Strateg. Manag. 2018, 30, 1166–1181. [Google Scholar] [CrossRef]
- Zhang, Y.; Cui, M. Determining the innovation efficiency of resource-based cities using a relational network dea model: Evidence from China. Extr. Ind. Soc. 2020, 7, 1557–1566. [Google Scholar] [CrossRef]
- Xu, S.; Wu, T.; Zhang, Y. The spatial-temporal variation and convergence of green innovation efficiency in the Yangtze River Economic Belt in China. Environ. Sci. Pollut. Res. 2020, 27, 26868–26881. [Google Scholar] [CrossRef]
- Li, D.; Zeng, T. Are China’s intensive pollution industries greening? An analysis based on green innovation efficiency. J. Clean. Prod. 2020, 259, 120901. [Google Scholar] [CrossRef]
- Liu, B.; Sun, Z.; Li, H. Can carbon trading policies promote regional green innovation efficiency? Empirical data from pilot regions in China. Sustainability 2021, 13, 2891. [Google Scholar] [CrossRef]
- Zeng, J.; Škare, M.; Lafont, J. The co-integration identification of green innovation efficiency in Yangtze River Delta region. J. Bus. Res. 2021, 134, 252–262. [Google Scholar] [CrossRef]
- Battese, G.E.; Coelli, T.J. A model for technical inefficiency effects in a stochastic frontier production function for panel data. Empir. Econ. 1995, 20, 325–332. [Google Scholar] [CrossRef] [Green Version]
- Díaz, M.; Sánchez, R. Firm size and productivity in Spain: A stochastic frontier analysis. Small Bus. Econ. 2008, 30, 315–323. [Google Scholar] [CrossRef]
- Hong, J.; Hong, S.; Wang, L.; Xu, Y.; Zhao, D. Government grants, private R&D funding and innovation efficiency in transition economy. Technol. Anal. Strateg. Manag. 2015, 27, 1068–1096. [Google Scholar]
- Miao, C.; Fang, D.; Sun, L.; Luo, Q. Natural resources utilization efficiency under the influence of green technological innovation. Resour. Conserv. Recycl. 2017, 126, 153–161. [Google Scholar] [CrossRef]
- Li, T.; Liang, L.; Han, D. Research on the efficiency of green technology innovation in China’s provincial high-end manufacturing industry based on the RAGA-PP-SFA model. Math. Probl. Eng. 2018, 2018, 9463707. [Google Scholar] [CrossRef]
- Fang, Z.; Bai, H.; Bilan, Y. Evaluation research of green innovation efficiency in China’s heavy polluting industries. Sustainability 2019, 12, 146. [Google Scholar] [CrossRef] [Green Version]
- Miao, C.-L.; Meng, X.-N.; Duan, M.-M.; Wu, X.-Y. Energy consumption, environmental pollution, and technological innovation efficiency: Taking industrial enterprises in China as empirical analysis object. Environ. Sci. Pollut. Res. 2020, 27, 34147–34157. [Google Scholar] [CrossRef] [PubMed]
- Yang, Z.; Shao, S.; Li, C.; Yang, L. Alleviating the misallocation of R&D inputs in China’s manufacturing sector: From the perspectives of factor-biased technological innovation and substitution elasticity. Technol. Forecast. Soc. Chang. 2020, 151, 119878. [Google Scholar]
- Yin, S.; Zhang, N.; Li, B.; Dong, H. Enhancing the effectiveness of multi-agent cooperation for green manufacturing: Dynamic co-evolution mechanism of a green technology innovation system based on the innovation value chain. Environ. Impact Assess. Rev. 2021, 86, 106475. [Google Scholar] [CrossRef]
- Tian, X.; Wang, J. Research on the disequilibrium development of output of regional innovation based on R&D personnel. Sustainability 2018, 10, 2708. [Google Scholar]
- Luo, Q.; Miao, C.; Sun, L.; Meng, X.; Duan, M. Efficiency evaluation of green technology innovation of China’s strategic emerging industries: An empirical analysis based on Malmquist-data envelopment analysis index. J. Clean. Prod. 2019, 238, 117782. [Google Scholar] [CrossRef]
- Huang, J.; Chen, X. Domestic R&D activities, technology absorption ability, and energy intensity in China. Energy Policy 2020, 138, 111184. [Google Scholar]
- Kim, Y.J.; Brown, M. Impact of domestic energy-efficiency policies on foreign innovation: The case of lighting technologies. Energy Policy 2019, 128, 539–552. [Google Scholar] [CrossRef] [Green Version]
- Ma, T.; Cao, X. FDI, technological progress, and green total factor energy productivity: Evidence from 281 prefecture cities in China. Environ. Dev. Sustain. 2021, 23, 1–31. [Google Scholar] [CrossRef]
- Yang, Z.; Wei, X. The measurement and influences of China’s urban total factor energy efficiency under environmental pollution: Based on the game cross-efficiency DEA. J. Clean. Prod. 2019, 209, 439–450. [Google Scholar] [CrossRef]
- Chen, W.; Wang, X.; Peng, N.; Wei, X.; Lin, C. Evaluation of the green innovation efficiency of Chinese industrial enterprises: Research based on the three-stage chain network SBM model. Math. Probl. Eng. 2020, 2020, 3143651. [Google Scholar] [CrossRef]
- Von Hirschhausen, C.; Cullmann, A.; Kappeler, A. Efficiency analysis of German electricity distribution utilities—Non-parametric and parametric tests. Appl. Econ. 2006, 38, 2553–2566. [Google Scholar] [CrossRef]
- Xia, P.; Wu, J.; Ji, X.; Xi, P. A DEA-based empirical analysis for dynamic performance of China’s regional coke production chain. Sci. Total Environ. 2020, 717, 136890. [Google Scholar] [CrossRef]
- Fried, H.O.; Lovell, C.K.; Schmidt, S.S.; Yaisawarng, S. Accounting for environmental effects and statistical noise in data envelopment analysis. J. Product. Anal. 2002, 17, 157–174. [Google Scholar] [CrossRef]
- Wang, R. Energy efficiency in China’s industry sectors: A non-parametric production frontier approach analysis. J. Clean. Prod. 2018, 200, 880–889. [Google Scholar] [CrossRef]
- Zhou, Y.; Kong, Y.; Zhang, T. The spatial and temporal evolution of provincial eco-efficiency in China based on SBM modified three-stage data envelopment analysis. Environ. Sci. Pollut. Res. 2020, 27, 8557–8569. [Google Scholar] [CrossRef]
- Zhou, Y.; Liu, Z.; Liu, S.; Chen, M.; Zhang, X.; Wang, Y. Analysis of industrial eco-efficiency and its influencing factors in China. Clean Technol. Environ. Policy 2020, 22, 2023–2038. [Google Scholar] [CrossRef]
- Wu, H.; Chen, J.; Jiao, H. Dynamic capabilities as a mediator linking international diversification and innovation performance of firms in an emerging economy. J. Bus. Res. 2016, 69, 2678–2686. [Google Scholar] [CrossRef]
- Chen, X.; Liu, X.; Gong, Z.; Xie, J. Three-stage super-efficiency DEA models based on the cooperative game and its application on the R&D green innovation of the Chinese high-tech industry. Comput. Ind. Eng. 2021, 156, 107234. [Google Scholar]
- Huang, H.; Mo, R.; Chen, X. New patterns in China’s regional green development: An interval Malmquist-Luenberger productivity analysis. Struct. Chang.Econ. Dyn. 2021, 58, 161–173. [Google Scholar] [CrossRef]
- Lu, L.C.; Chiu, Y.-H.; Chiu, S.-Y.; Chang, T.-H. Do Forests help environmental development of Cities in China? Environ. Dev. Sustain. 2022, 24, 6602–6629. [Google Scholar] [CrossRef]
- Li, K.; Lin, B. Impact of energy conservation policies on the green productivity in China’s manufacturing sector: Evidence from a three-stage DEA model. Appl. Energy 2016, 168, 351–363. [Google Scholar] [CrossRef]
- Zhao, C.; Zhang, H.; Zeng, Y.; Li, F.; Liu, Y.; Qin, C.; Yuan, J. Total-factor energy efficiency in BRI countries: An estimation based on three-stage DEA model. Sustainability 2018, 10, 278. [Google Scholar] [CrossRef] [Green Version]
- Wang, C.; Li, J. The evaluation and promotion path of green innovation performance in Chinese pollution-intensive industry. Sustainability 2020, 12, 4198. [Google Scholar] [CrossRef]
- Li, L.; Lei, Y.; Pan, D. Study of CO2 emissions in China’s iron and steel industry based on economic input-output life cycle assessment. Nat. Hazards 2016, 81, 957–970. [Google Scholar] [CrossRef] [Green Version]
- Lin, B.; Chen, Y. Will land transport infrastructure affect the energy and carbon dioxide emissions performance of China’s manufacturing industry? Appl. Energy 2020, 260, 114266. [Google Scholar] [CrossRef]
- Pei, Y.; Zhu, Y.; Liu, S.; Xie, M. Industrial agglomeration and environmental pollution: Based on the specialized and diversified agglomeration in the Yangtze River Delta. Environ. Dev. Sustain. 2021, 23, 4061–4085. [Google Scholar] [CrossRef]
- Wu, X.; Lu, Y.; Xu, H.; Lv, M.; Hu, D.; He, Z.; Liu, L.; Wang, Z.; Feng, Y. Challenges to improve the safety of dairy products in China. Trends Food Sci. Technol. 2018, 76, 6–14. [Google Scholar] [CrossRef]
- Sun, C.; Tong, Y.; Zou, W. The evolution and a temporal-spatial difference analysis of green development in China. Sustain. Cities Soc. 2018, 41, 52–61. [Google Scholar] [CrossRef]
- Zhang, J.; Li, M. The profit model design and development strategy of Industry 4.0 under the concept of green and low-carbon. Int. J. Technol. Manag. 2020, 84, 177–196. [Google Scholar] [CrossRef]
- Bao, X.; Qiu, L.D. Do technical barriers to trade promote or restrict trade? Evidence from China. Asia-Pac. J. Account. Econ. 2010, 17, 253–278. [Google Scholar] [CrossRef] [Green Version]
- Wu, M.; Zhao, M.; Wu, Z. Evaluation of development level and economic contribution ratio of science and technology innovation in eastern China. Technol. Soc. 2019, 59, 101194. [Google Scholar] [CrossRef]
- Miao, C.-L.; Duan, M.-M.; Zuo, Y.; Wu, X.-Y. Spatial heterogeneity and evolution trend of regional green innovation efficiency—An empirical study based on panel data of industrial enterprises in China’s provinces. Energy Policy 2021, 156, 112370. [Google Scholar] [CrossRef]
- Zhang, H.; Geng, Z.; Yin, R.; Zhang, W. Regional differences and convergence tendency of green development competitiveness in China. J. Clean. Prod. 2020, 254, 119922. [Google Scholar] [CrossRef]
- Wu, J.; Huang, D.; Zhou, Z.; Zhu, Q. The regional green growth and sustainable development of China in the presence of sustainable resources recovered from pollutions. Ann. Oper. Res. 2020, 290, 27–45. [Google Scholar] [CrossRef]
- Hu, S.; Liu, S. Do the coupling effects of environmental regulation and R&D subsidies work in the development of green innovation? Empirical evidence from China. Clean Technol. Environ. Policy 2019, 21, 1739–1749. [Google Scholar]
- Zhuo, C.; Deng, F. How does China’s Western Development Strategy affect regional green economic efficiency? Sci. Total Environ. 2020, 707, 135939. [Google Scholar] [CrossRef]
- Wen, H.; Dai, J. Green Technological Progress and the Backwardness Advantage of Green Development: Taking the Sustainable Development Strategy of Central and Western China as an Example. Sustainability 2021, 13, 7567. [Google Scholar] [CrossRef]


Publisher’s Note: MDPI stays neutral with regard to jurisdictional claims in published maps and institutional affiliations. |
© 2022 by the authors. Licensee MDPI, Basel, Switzerland. This article is an open access article distributed under the terms and conditions of the Creative Commons Attribution (CC BY) license (https://creativecommons.org/licenses/by/4.0/).