
Antibiotic Resistance Genes Associated with Marine Surface Sediments: A Baseline from the Shores of Kuwait

 ,
,  ,
, 
Abstract
:1. Introduction
2. Materials and Methods
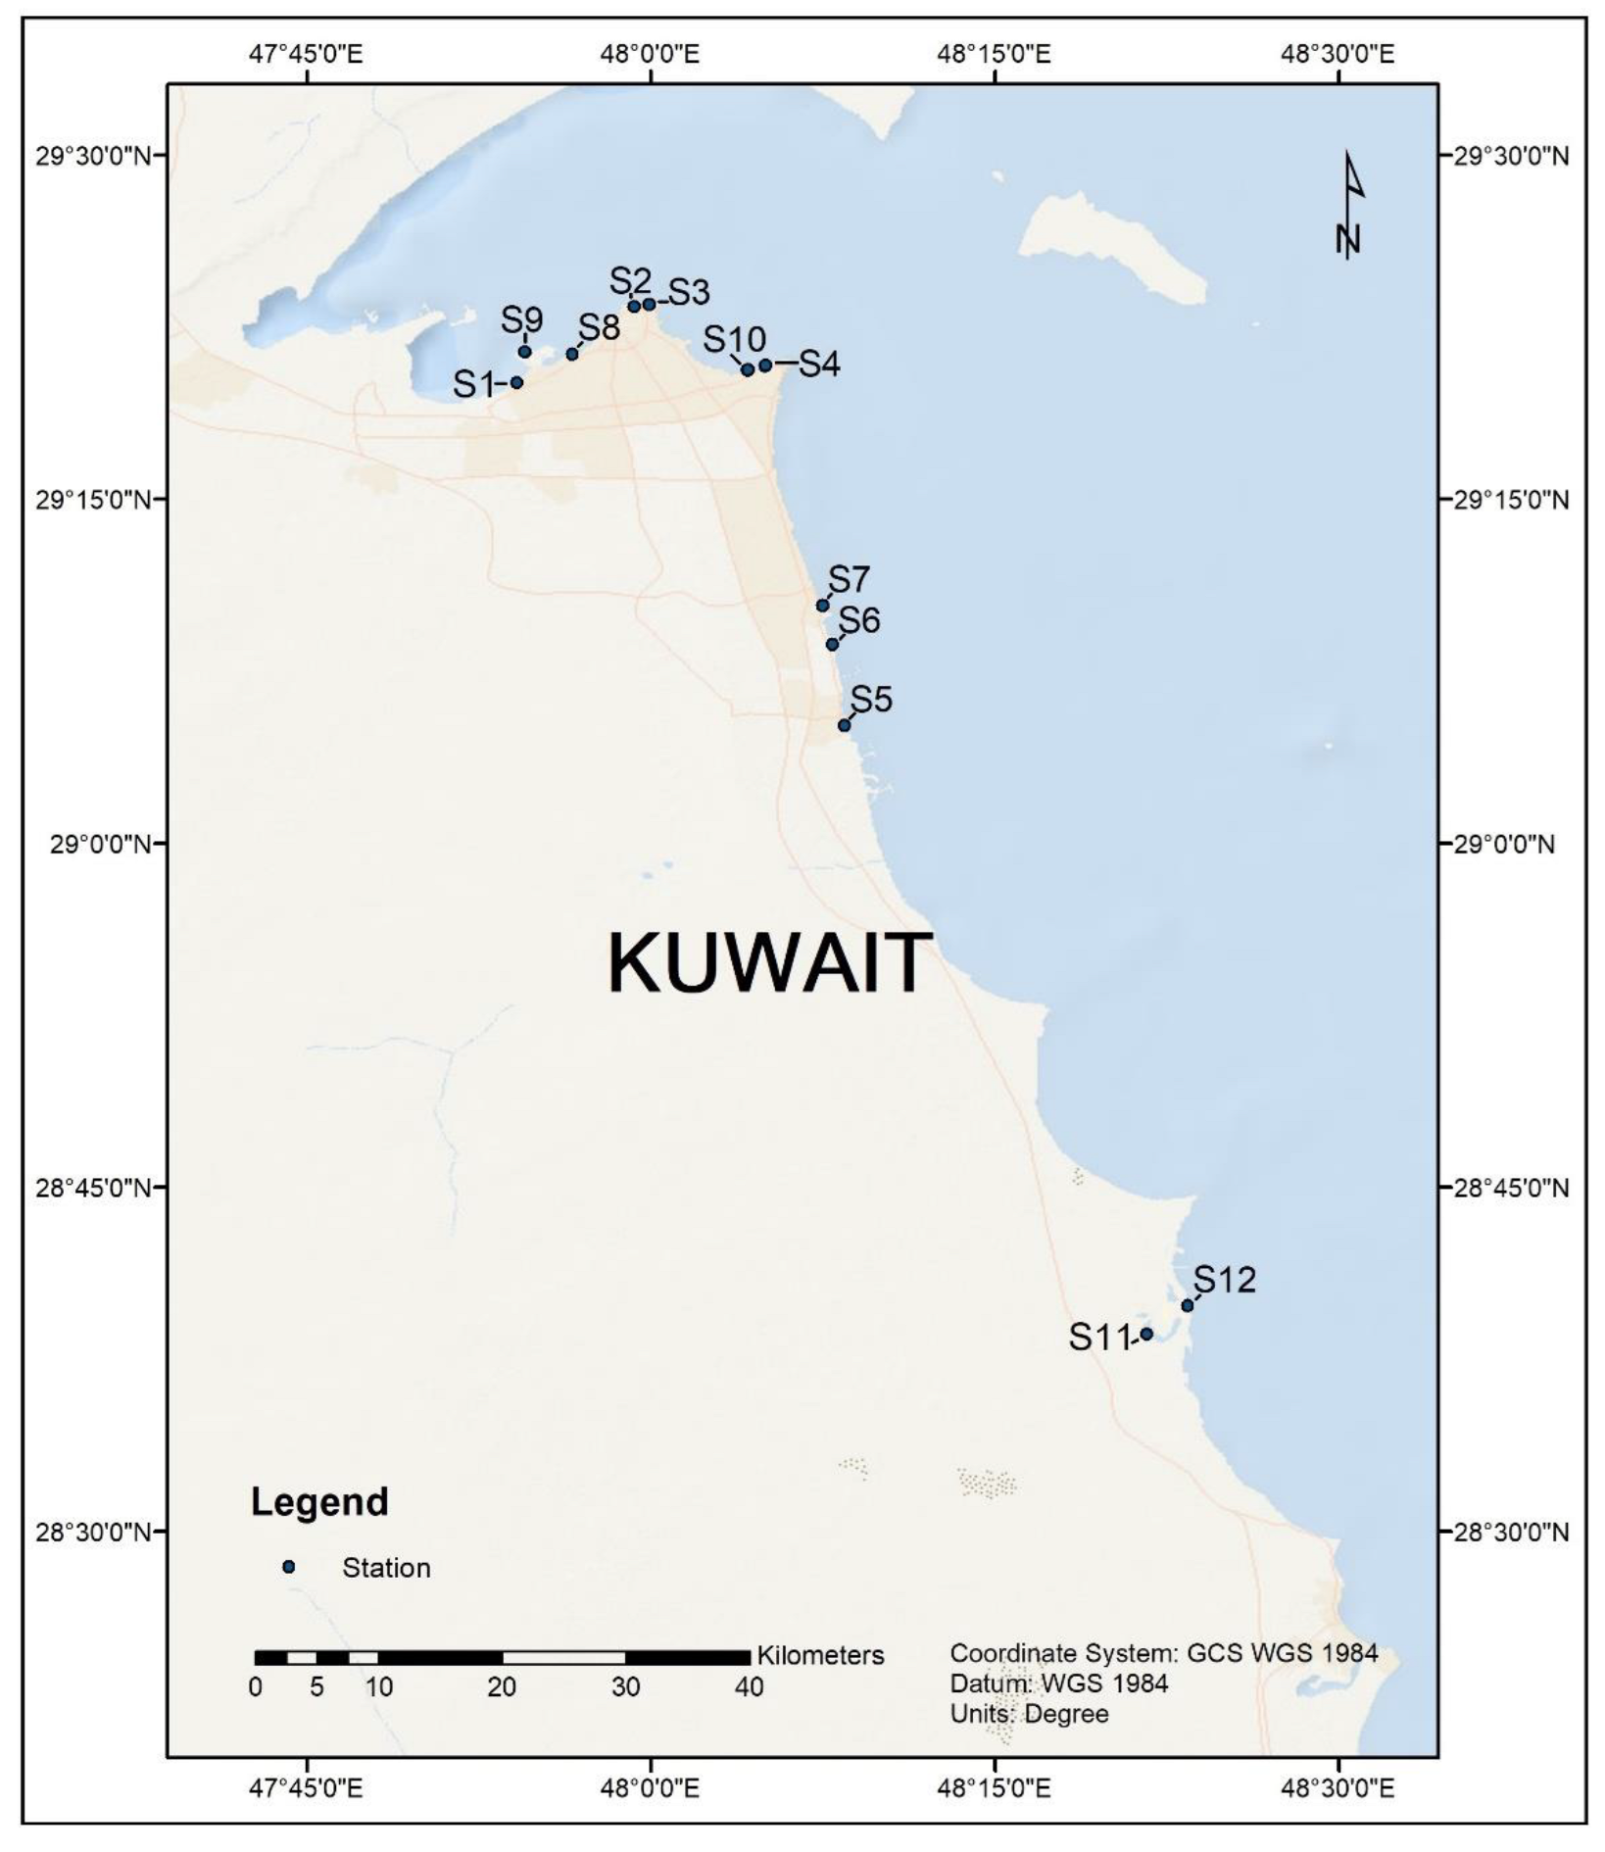
2.1. Sample Collection and DNA Extraction
2.2. Metagenomic Sequencing
2.3. Analysis of Antibiotic Resistance Genes
3. Results
3.1. Metagenomic Sequencing and Assembly
3.2. Antibiotic Resistance Gene Profiles
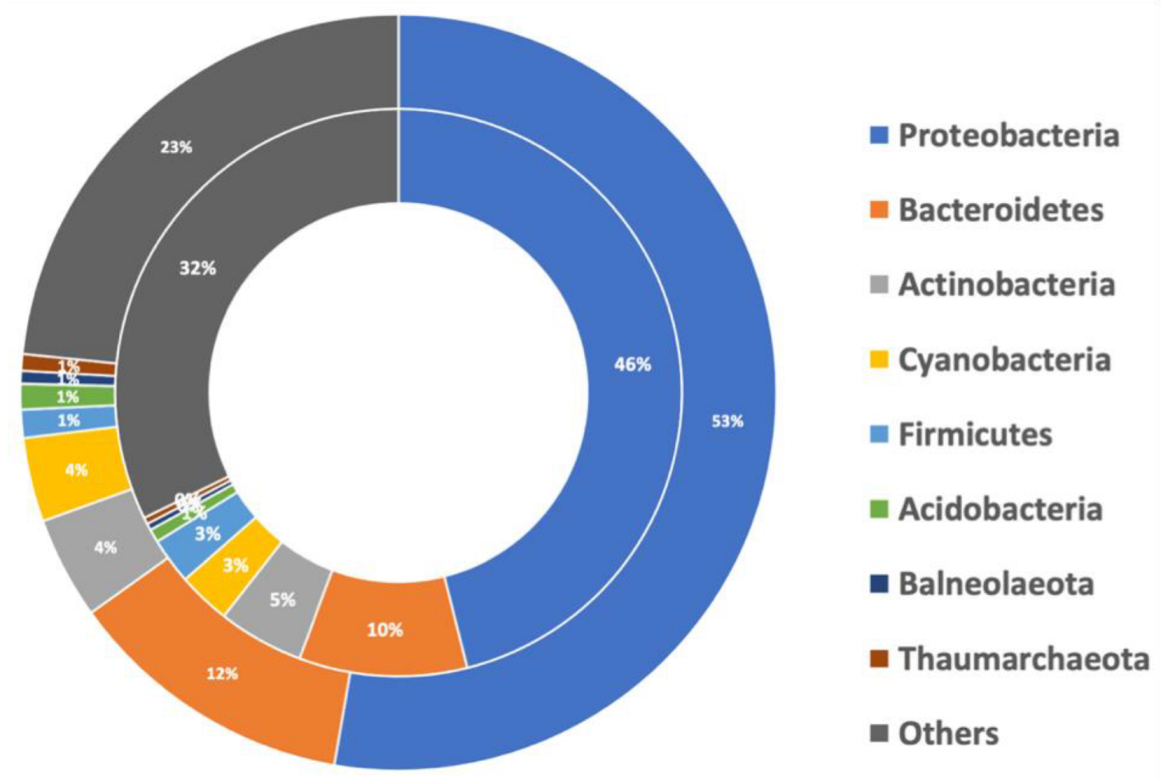
3.3. Major Contributing Phyla
3.4. ARGs against Drug Classes
3.5. Mode of Action of ARGs
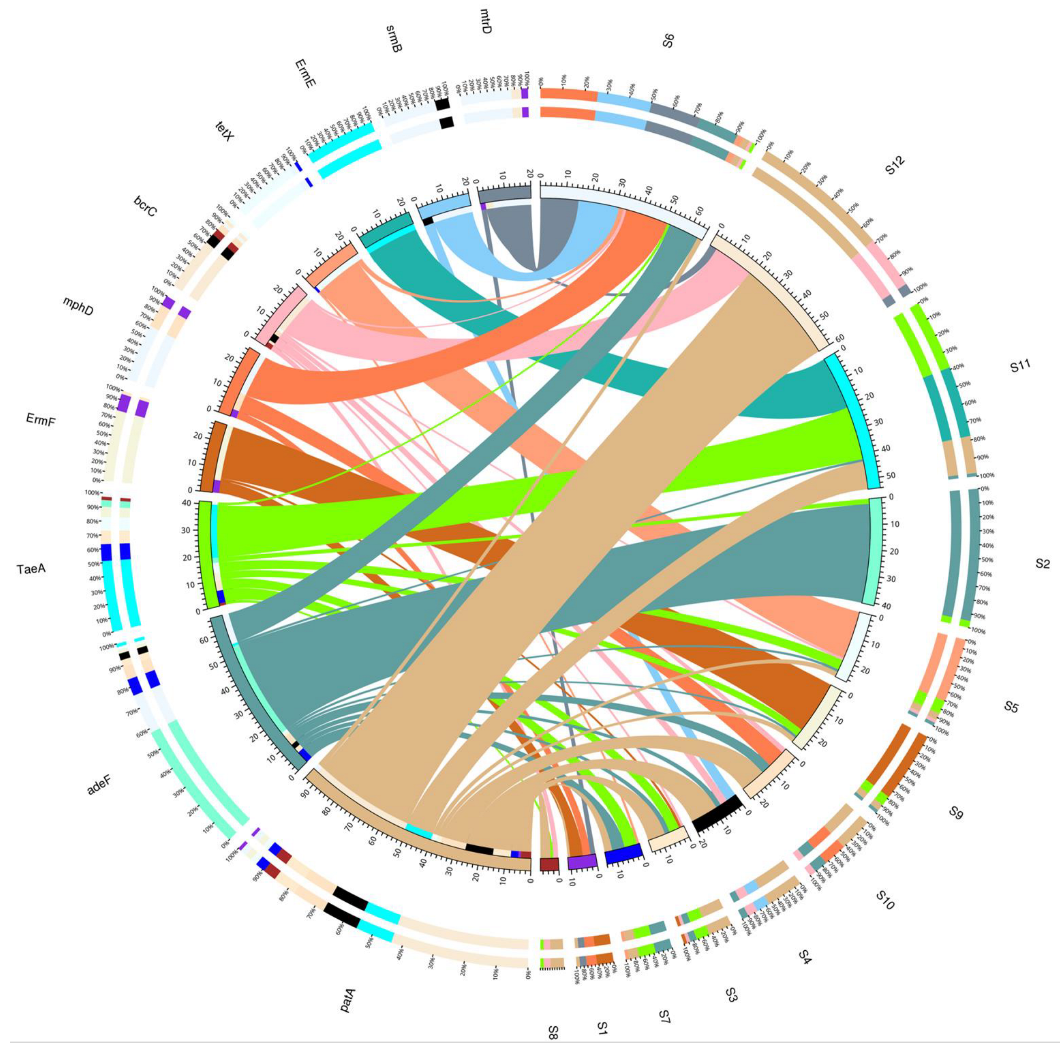
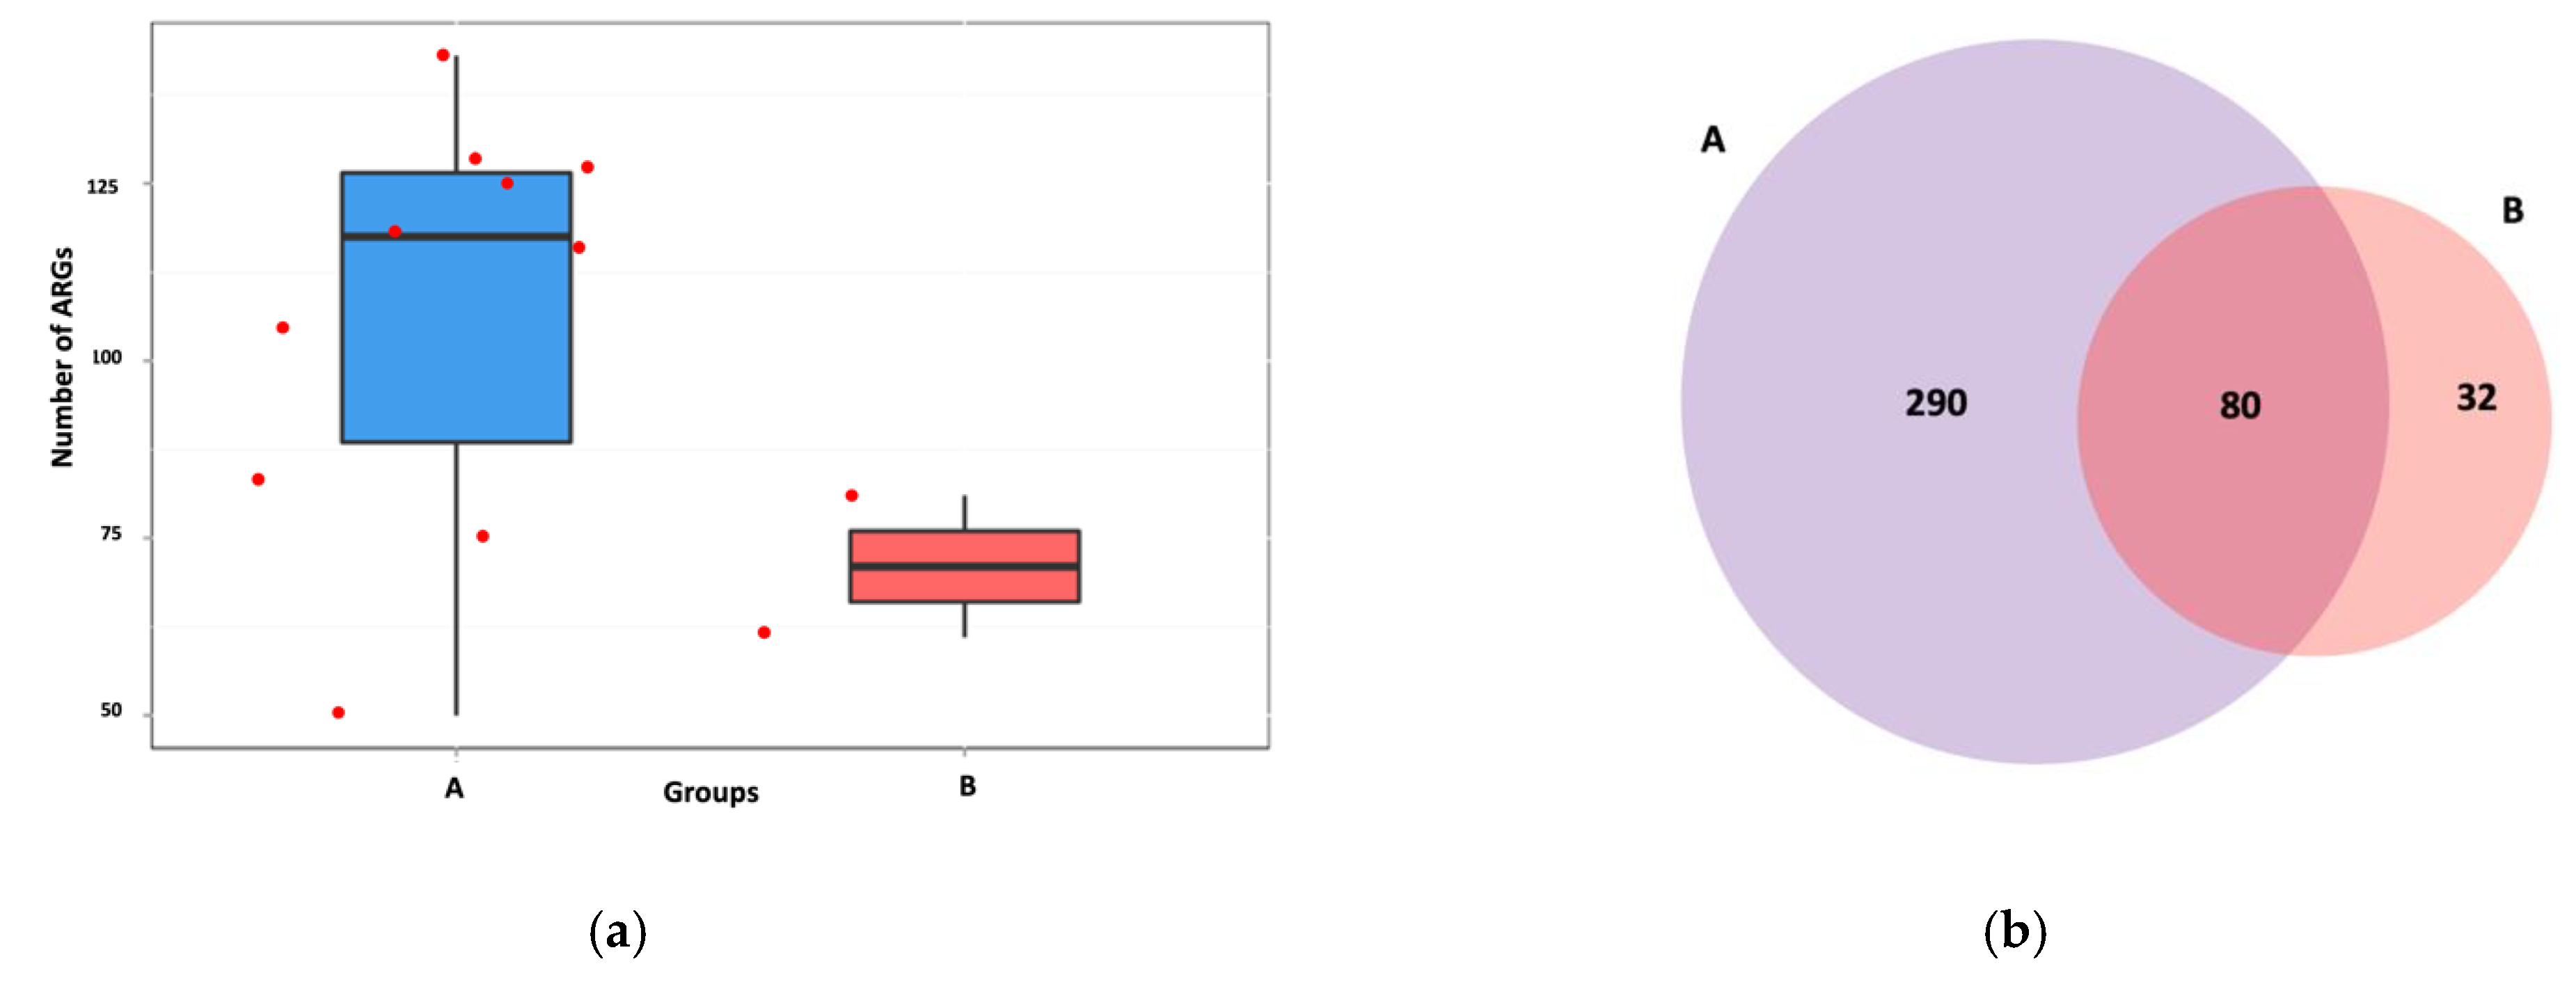
3.6. Intersite Variability of ARGs
4. Discussion
5. Conclusions
Supplementary Materials
Author Contributions
Funding
Institutional Review Board Statement
Informed Consent Statement
Data Availability Statement
Acknowledgments
Conflicts of Interest
References
- Al-Gadhban, A.N.; Uddin, S.; Beg, M.U.; Al-Dousari, A.M.; Gevao, B. Ecological Consequences of River Manipulation and Drainage of Mesopotamian Marshes on the Arabian Gulf Ecosystem: Investigations on Changes in Sedimentology and Environment Quality with Special Reference to Kuwait Bay; Kuwait Institute for Scientific Research: Safat, Kuwait, 2008. [Google Scholar] [CrossRef]
- Al-Ghadban, A.; Uddin, S.; Aba, A.; Behbehani, M. Baseline Radionuclide Specific Activity in Commercial Fishes of Kuwait. Aquat. Ecosyst. Health Manag. 2012, 15, 45–49. [Google Scholar] [CrossRef]
- Al-Sarawi, H.A.; Jha, A.N.; Al-Sarawi, M.A.; Lyons, B.P. Historic and contemporary contamination in the marine environment of Kuwait: An overview. Mar. Pollut. Bull. 2015, 100, 621–628. [Google Scholar] [CrossRef] [PubMed]
- Al-Sarawi, H.A.; Jha, A.N.; Baker-Austin, C.; Al-Sarawi, M.A.; Lyons, B.P. Baseline screening for the presence of antimicrobial resistance in E. coli isolated from Kuwait’s marine environment. Mar. Pollut. Bull. 2018, 129, 893–898. [Google Scholar] [CrossRef] [PubMed]
- Devlin, M.; Le Quesne, W.J.; Lyons, B.P. The marine environment of Kuwait—Emerging issues in a rapidly changing environment. Mar. Pollut. Bull. 2015, 100, 593–596. [Google Scholar] [CrossRef] [PubMed]
- Elkadiri, R.; Manche, C.; Sultan, M.; Al-Dousari, A.; Uddin, S.; Chouinard, K.; Abotalib, A.Z. Development of a Coupled Spatiotemporal Algal Bloom Model for Coastal Areas: A Remote Sensing and Data Mining-Based Approach. IEEE J. Sel. Top. Appl. Earth Obs. Remote Sens. 2016, 9, 5159–5171. [Google Scholar] [CrossRef]
- Gevao, B.; Jaward, F.M.; Uddin, S.; Al-Ghadban, A.N. Occurrence and concentrations of polychlorinated dibenzo-p-dioxins (PCDDs) and polychlorinated dibenzofurans (PCDFs) in coastal marine sediments in Kuwait. Mar. Pollut. Bull. 2009, 58, 452–455. [Google Scholar] [CrossRef]
- Gevao, B.; Aba, A.A.; Al-Ghadban, A.N.; Uddin, S. Depositional history of polychlorinated biphenyls in a dated sediment core from the northwestern Arabian Gulf. Arch. Environ. Contam. Toxicol. 2012, 62, 549–556. [Google Scholar] [CrossRef]
- Habibi, N.; Uddin, S.; Bottein, M.-Y.D.; Faizuddin, M. Ciguatera in the Indian Ocean with Special Insights on the Arabian Sea and Adjacent Gulf and Seas: A Review. Toxins 2021, 13, 525. [Google Scholar] [CrossRef]
- Lyons, B.; Barber, J.; Rumney, H.; Bolam, T.; Bersuder, P.; Law, R.; Mason, C.; Smith, A.; Morris, S.; Devlin, M. Baseline survey of marine sediments collected from the State of Kuwait: PAHs, PCBs, brominated flame retardants and metal contamination. Mar. Pollut. Bull. 2015, 100, 629–636. [Google Scholar] [CrossRef]
- Uddin, S.; Aba, A.; Fowler, S.; Behbehani, M.; Ismaeel, A.; Al-Shammari, H.; Alboloushi, A.; Mietelski, J.; Al-Ghadban, A.; Al-Ghunaim, A. Radioactivity in the Kuwait marine environment—baseline measurements and review. Mar. Pollut. Bull. 2015, 100, 651–661. [Google Scholar] [CrossRef]
- Uddin, S.; Al Ghadban, A.N.; Khabbaz, A. Localized hyper saline waters in Arabian Gulf from desalination activity—An example from South Kuwait. Environ. Monit. Assess. 2011, 181, 587–594. [Google Scholar] [CrossRef] [PubMed]
- Uddin, S.; Gevao, B.; Al-Ghadban, A.; Nithyanandan, M.; Al-Shamroukh, D. Acidification in Arabian Gulf–Insights from pH and temperature measurements. J. Environ. Monit. 2012, 14, 1479–1482. [Google Scholar] [CrossRef] [PubMed]
- Uddin, S.; Al Dosari, A.; Al Ghadban, A.N.; Aritoshi, M. Use of interferometric techniques for detecting subsidence in the oil fields of Kuwait using Synthetic Aperture Radar Data. J. Pet. Sci. Eng. 2006, 50, 1–10. [Google Scholar] [CrossRef]
- Uddin, S.; Behbehani, M. Concentrations of selected radionuclides and their spatial distribution in marine sediments from the northwestern Gulf, Kuwait. Mar. Pollut. Bull. 2018, 127, 73–81. [Google Scholar] [CrossRef] [PubMed]
- Uddin, S.; Fowler, S.W.; Saeed, T. Microplastic particles in the Persian/Arabian Gulf–A review on sampling and identification. Mar. Pollut. Bull. 2020, 154, 111100. [Google Scholar] [CrossRef] [PubMed]
- Al Salameen, F.; Habibi, N.; Uddin, S.; Al Mataqi, K.; Kumar, V.; Al Doaij, B.; Al Amad, S.; Al Ali, E.; Shirshikhar, F. Spatio-temporal variations in bacterial and fungal community associated with dust aerosol in Kuwait. PLoS ONE 2020, 15, e0241283. [Google Scholar] [CrossRef]
- Habibi, N.; Uddin, S.; Salameen, F.A.; Behbehani, M.; Shirshikhar, F.; Razzack, N.A.; Shajan, A.; Zakir Hussain, F. Collection of Bacterial Community Associated with Size Fractionated Aerosols from Kuwait. Data 2021, 6, 123. [Google Scholar] [CrossRef]
- Behbehani, M.; Carvalho, F.P.; Uddin, S.; Habibi, N. Enhanced Polonium Concentrations in Aerosols from the Gulf Oil Producing Region and the Role of Microorganisms. Int. J. Environ. Res. Public Health 2021, 18, 13309. [Google Scholar] [CrossRef]
- Bar-On, Y.M.; Milo, R. Towards a quantitative view of the global ubiquity of biofilms. Nat. Rev. Microbiol. 2019, 17, 199–200. [Google Scholar] [CrossRef]
- Hoshino, T.; Doi, H.; Uramoto, G.-I.; Wörmer, L.; Adhikari, R.R.; Xiao, N.; Morono, Y.; D’Hondt, S.; Hinrichs, K.-U.; Inagaki, F. Global diversity of microbial communities in marine sediment. Proc. Natl. Acad. Sci. USA 2020, 117, 27587–27597. [Google Scholar] [CrossRef]
- Gevao, B.; Uddin, S.; Dupont, S. Baseline concentrations of pharmaceuticals in Kuwait’s coastal marine environment. Mar. Pollut. Bull. 2021, 173, 113040. [Google Scholar] [CrossRef] [PubMed]
- Gevao, B.; Uddin, S.; Krishnan, D.; Rajagopalan, S.; Habibi, N. Antibiotics in Wastewater: Baseline of the Influent and Effluent Streams in Kuwait. Toxics 2022, 10, 174. [Google Scholar] [CrossRef] [PubMed]
- Amarasiri, M.; Sano, D.; Suzuki, S. Understanding human health risks caused by antibiotic resistant bacteria (ARB) and antibiotic resistance genes (ARG) in water environments: Current knowledge and questions to be answered. Crit. Rev. Environ. Sci. Technol. 2020, 50, 2016–2059. [Google Scholar] [CrossRef]
- Guo, X.-P.; Zhao, S.; Chen, Y.-R.; Yang, J.; Hou, L.-J.; Liu, M.; Yang, Y. Antibiotic resistance genes in sediments of the Yangtze Estuary: From 2007 to 2019. Sci. Total Environ. 2020, 744, 140713. [Google Scholar] [CrossRef] [PubMed]
- Zhang, Y.; Lu, J.; Wu, J.; Wang, J.; Lin, Y. Occurrence and distribution of antibiotic resistance genes in sediments in a semi-enclosed continental shelf sea. Sci. Total Environ. 2020, 720, 137712. [Google Scholar] [CrossRef]
- Marti, E.; Variatza, E.; Balcazar, J.L. The role of aquatic ecosystems as reservoirs of antibiotic resistance. Trends Microbiol. 2014, 22, 36–41. [Google Scholar] [CrossRef]
- Cummings, D.E.; Archer, K.F.; Arriola, D.J.; Baker, P.A.; Faucett, K.G.; Laroya, J.B.; Pfeil, K.L.; Ryan, C.R.; Ryan, K.R.; Zuill, D.E. Broad dissemination of plasmid-mediated quinolone resistance genes in sediments of two urban coastal wetlands. Environ. Sci. Technol. 2011, 45, 447–454. [Google Scholar] [CrossRef]
- Chen, B.; Yang, Y.; Liang, X.; Yu, K.; Zhang, T.; Li, X. Metagenomic profiles of antibiotic resistance genes (ARGs) between human impacted estuary and deep ocean sediments. Environ. Sci. Technol. 2013, 47, 12753–12760. [Google Scholar] [CrossRef]
- Chen, J.; McIlroy, S.E.; Archana, A.; Baker, D.M.; Panagiotou, G. A pollution gradient contributes to the taxonomic, functional, and resistome diversity of microbial communities in marine sediments. Microbiome 2019, 7, 104. [Google Scholar] [CrossRef] [Green Version]
- Qiao, M.; Ying, G.-G.; Singer, A.C.; Zhu, Y.-G. Review of antibiotic resistance in China and its environment. Environ. Int. 2018, 110, 160–172. [Google Scholar] [CrossRef] [Green Version]
- Singer, A.C.; Shaw, H.; Rhodes, V.; Hart, A. Review of antimicrobial resistance in the environment and its relevance to environmental regulators. Front. Microbiol. 2016, 7, 1728. [Google Scholar] [CrossRef] [Green Version]
- World Health Organization. List of Bacteria for Which New Antibiotics Are Urgently Needed; WHO Press: Geneva, Switzerland, 2021. [Google Scholar]
- Habibi, N.; Al Salameen, F.; Al Surrayai, T.; Kumar, V.; Al Amad, S. Phase-III: Field Implications of Molecular Microbial Management for Integrity Enhancement of KOC Facilities; Kuwait Institute for Scientific Research: Safat, Kuwait, 2021. [Google Scholar]
- Habibi, N.; Uddin, S.; Al-Salameen, F.; Al-Amad, S.; Kumar, V.; Al-Otaibi, M.; Razzack, N.A.; Shajan, A.; Shirshikar, F. SARS-CoV-2, other respiratory viruses and bacteria in aerosols: Report from Kuwait’s hospitals. Indoor Air 2021, 31, 1815–1825. [Google Scholar] [CrossRef] [PubMed]
- Habibi, N.; Behbehani, M.; Uddin, S.; Al-Salameen, F.; Shajan, A.; Zakir, F. A safe and effective sample collection method for assessment of SARS-CoV-2 in aerosol samples. In Environmental Resilience and Transformation in Times of COVID-19; Elsevier: Amsterdam, The Netherlands, 2021; pp. 173–178. [Google Scholar]
- Habibi, N.; Uddin, S.; Al Salameen, F.; Al Amad, S.; Kumar, V.; Al Otaibi, M. Identification and Characterization of Novel Corona and Associated Respiratory Viruses in Aerosols; Kuwait Institute For Scientific Research: Safat, Kuwait, 2021. [Google Scholar]
- Khan, M.W.; Habibi, N.; Shaheed, F.; Mustafa, A.S. Draft genome sequences of five clinical strains of Brucella melitensis isolated from patients residing in Kuwait. Genome Announc. 2016, 4, e01144-16. [Google Scholar] [CrossRef] [PubMed] [Green Version]
- Xing, J.; Ying, Y.; Mao, C.; Liu, Y.; Wang, T.; Zhao, Q.; Zhang, X.; Yan, F.; Zhang, H. Hypoxia induces senescence of bone marrow mesenchymal stem cells via altered gut microbiota. Nat. Commun. 2018, 9, 2020. [Google Scholar] [CrossRef]
- Habibi, N.; Mustafa, A.S.; Khan, M.W. Composition of nasal bacterial community and its seasonal variation in health care workers stationed in a clinical research laboratory. PLoS ONE 2021, 16, e0260314. [Google Scholar] [CrossRef]
- Langmead, B.; Trapnell, C.; Pop, M.; Salzberg, S.L. Ultrafast and memory-efficient alignment of short DNA sequences to the human genome. Genome Biol. 2009, 10, R25. [Google Scholar] [CrossRef] [Green Version]
- Zhu, W.; Lomsadze, A.; Borodovsky, M. Ab initio gene identification in metagenomic sequences. Nucleic Acids Res. 2010, 38, e132. [Google Scholar] [CrossRef] [PubMed] [Green Version]
- Li, W.; Godzik, A. Cd-hit: A fast program for clustering and comparing large sets of protein or nucleotide sequences. Bioinformatics 2006, 22, 1658–1659. [Google Scholar] [CrossRef] [PubMed] [Green Version]
- Langmead, B.; Salzberg, S.L. Fast gapped-read alignment with Bowtie 2. Nat. Methods 2012, 9, 357–359. [Google Scholar] [CrossRef] [Green Version]
- McArthur, A.G.; Waglechner, N.; Nizam, F.; Yan, A.; Azad, M.A.; Baylay, A.J.; Bhullar, K.; Canova, M.J.; De Pascale, G.; Ejim, L. The comprehensive antibiotic resistance database. Antimicrob. Agents Chemother. 2013, 57, 3348–3357. [Google Scholar] [CrossRef] [Green Version]
- Segata, N.; Izard, J.; Waldron, L.; Gevers, D.; Miropolsky, L.; Garrett, W.S.; Huttenhower, C. Metagenomic biomarker discovery and explanation. Genome Biol. 2011, 12, R60. [Google Scholar] [CrossRef] [PubMed] [Green Version]
- Buchfink, B.; Xie, C.; Huson, D.H. Fast and sensitive protein alignment using DIAMOND. Nat. Methods 2015, 12, 59–60. [Google Scholar] [CrossRef] [PubMed]
- Zhang, H.; Meltzer, P.; Davis, S. RCircos: An R package for Circos 2D track plots. BMC Bioinform. 2013, 14, 1–5. [Google Scholar] [CrossRef] [Green Version]
- Dong, X.; Lan, H.; Huang, L.; Zhang, H.; Lin, X.; Weng, S.; Peng, Y.; Lin, J.; Wang, J.-H.; Peng, J. Metagenomic views of microbial communities in sand sediments associated with coral reefs. Microb. Ecol. 2022, 1–13. [Google Scholar] [CrossRef]
- Nathani, N.M.; Mootapally, C.; Dave, B.P. Antibiotic resistance genes allied to the pelagic sediment microbiome in the Gulf of Khambhat and Arabian Sea. Sci. Total Environ. 2019, 653, 446–454. [Google Scholar] [CrossRef]
- Chakraborty, J.; Sapkale, V.; Rajput, V.; Shah, M.; Kamble, S.; Dharne, M. Shotgun metagenome guided exploration of anthropogenically driven resistomic hotspots within Lonar soda lake of India. Ecotoxicol. Environ. Saf. 2020, 194, 110443. [Google Scholar] [CrossRef] [PubMed]
- Yang, H.; Liu, R.; Liu, H.; Wang, C.; Yin, X.; Zhang, M.; Fang, J.; Zhang, T.; Ma, L. Evidence for Long-Term Anthropogenic Pollution: The Hadal Trench as a Depository and Indicator for Dissemination of Antibiotic Resistance Genes. Environ. Sci. Technol. 2021, 55, 15136–15148. [Google Scholar] [CrossRef] [PubMed]
- Chen, Y.-R.; Guo, X.-P.; Niu, Z.-S.; Lu, D.-P.; Sun, X.-L.; Zhao, S.; Hou, L.-J.; Liu, M.; Yang, Y. Antibiotic resistance genes (ARGs) and their associated environmental factors in the Yangtze Estuary, China: From inlet to outlet. Mar. Pollut. Bull. 2020, 158, 111360. [Google Scholar] [CrossRef]
- Wang, J.; Wang, J.; Zhang, Z.; Li, Z.; Zhang, Z.; Zhao, D.; Wang, L.; Lu, F.; Li, Y.-Z. Shifts in the bacterial population and ecosystem functions in response to vegetation in the yellow river delta wetlands. Msystems 2020, 5, e00412–e00420. [Google Scholar] [CrossRef]
- Li, Y.; Zeng, C.; Long, M. Variation of soil nutrients and bacterial community diversity of different land utilization types in Yangtze River Basin, Chongqing Municipality. PeerJ 2020, 8, e9386. [Google Scholar] [CrossRef]
- Xiang, S.; Wang, X.; Ma, W.; Liu, X.; Zhang, B.; Huang, F.; Liu, F.; Guan, X. Response of microbial communities of karst river water to antibiotics and microbial source tracking for antibiotics. Sci. Total Environ. 2020, 706, 135730. [Google Scholar] [CrossRef] [PubMed]
- Yang, X.; Yan, L.; Yang, Y.; Zhou, H.; Cao, Y.; Wang, S.; Xue, B.; Li, C.; Zhao, C.; Zhang, X. The Occurrence and Distribution Pattern of Antibiotic Resistance Genes and Bacterial Community in the Ili River. Front. Environ. Sci. 2022, 212, 13677. [Google Scholar] [CrossRef]
- Light, E.; Baker-Austin, C.; Card, R.M.; Ryder, D.; Alves, M.T.; Al-Sarawi, H.A.; Abdulla, K.H.; Stahl, H.; Aliya, A.-G.; Al Ghoribi, M. Establishing a marine monitoring programme to assess antibiotic resistance: A case study from the Gulf Cooperation Council (GCC) region. medRxiv 2022. [Google Scholar] [CrossRef]
- Asokan, G.V.; Vanitha, A. WHO global priority pathogens list on antibiotic resistance: An urgent need for action to integrate One Health data. Perspect. Public Health 2018, 138, 87–88. [Google Scholar]
- Imchen, M.; Kumavath, R. Shotgun metagenomics reveals a heterogeneous prokaryotic community and a wide array of antibiotic resistance genes in mangrove sediment. FEMS Microbiol. Ecol. 2020, 96, fiaa173. [Google Scholar] [CrossRef]
- Mootapally, C.; Nathani, N.M.; Poriya, P.; Beleem, I.; Dabhi, J.C.; Gadhvi, I.R.; Joshi, C.G. Antibiotic Resistome Biomarkers associated to the pelagic Sediments of the Gulfs of Kathiawar peninsula and Arabian Sea. Sci. Rep. 2019, 9, 17281. [Google Scholar] [CrossRef] [Green Version]
- Wright, G.D. The antibiotic resistome: The nexus of chemical and genetic diversity. Nat. Rev. Microbiol. 2007, 5, 175–186. [Google Scholar] [CrossRef]
- Van Bambeke, F.; Balzi, E.; Tulkens, P.M. Antibiotic efflux pumps. Biochem. Pharmacol. 2000, 60, 457–470. [Google Scholar] [CrossRef]


| Site/Sample Code | Site Description | GPS Coordinates | Date of Sample Collection | DNA Yield (µg g−1 Mean ± SD | Cells g−1 SedimentMean |
|---|---|---|---|---|---|
| S1 | KISR Outfall | 29.334824 N, 47.902379 E | 16.09.2021 | 3.63 ± 0.80 | 4.07 × 10⁴ |
| S2 | Sharq Fisherman’s village | 29.390016 N, 47.987360 E | 16.09.2021 | 2.22 ± 0.98 | 6.28 × 10⁴ |
| S3 | Kuwait towers | 29.391912 N, 47.998332 E | 16.09.2021 | 0.72 ± 0.25 | 3.49 × 10⁷ |
| S4 | Marina Beach | 29.346564 N, 48.080955 E | 16.09.2021 | 0.03 ± 0.00 | 1.34 × 10³ |
| S5 | Fahaheel | 29.085652 N, 48.140467 E | 16.09.2021 | 0.53 ± 0.24 | 3.75 × 10⁶ |
| S6 | Mahboula | 29.144615 N, 48.131618 E | 16.09.2021 | 0.67 ± 0.28 | 6.03 × 10⁶ |
| S7 | Fintas/Eaigila | 29.172970 N, 48.124410 E | 16.09.2021 | 0.96 ± 0.38 | 1.08 × 10⁷ |
| S8 | KPC beach | 29.355843 N, 47.942600 E | 01.10.2021 | 2.02 ± 0.38 | 8.03 × 10⁹ |
| S9 | Kuwait free-trade zone | 29.356870 N, 47.908080 E | 01.10.2021 | 3.05 ± 0.66 | 7.64 × 10⁸ |
| S10 | Marina Main Outfall | 29.347422 N, 48.083147 E | 01.10.2021 | 1.96 ± 0.46 | 4.88 × 10⁸ |
| S11 | Khairan Fisherman’s village | 28.643537 N, 48.360438 E | 13.10.2021 | 2.24 ± 0.57 | 3.52 × 10⁶ |
| S12 | Khairan inlet | 28.664389 N, 48.389889 E | 13.10.2021 | 0.11 ± 0.06 | 3.12 × 10⁶ |
| Sample ID | Total Length (bp) | Number | Average Length (bp) | N50 Length (bp) | N90 Length (bp) | Max Length (bp) |
|---|---|---|---|---|---|---|
| S1 | 273,079,570 | 292,818 | 932.59 | 930 | 553 | 65,370 |
| S2 | 283,332,790 | 285,490 | 992.44 | 997 | 556 | 90,537 |
| S3 | 144,882,306 | 175,136 | 827.26 | 782 | 535 | 64,264 |
| S4 | 170,434,411 | 206,843 | 823.98 | 776 | 533 | 118,582 |
| S5 | 188,487,038 | 215,400 | 875.06 | 835 | 538 | 49,103 |
| S6 | 248,200,658 | 234,528 | 1058.30 | 1096 | 561 | 564,351 |
| S7 | 126,649,852 | 162,005 | 781.77 | 739 | 529 | 33,109 |
| S8 | 162,644,191 | 194,236 | 837.35 | 797 | 536 | 30,935 |
| S9 | 137,440,619 | 166,332 | 826.3 | 784 | 533 | 28,815 |
| S10 | 128,300,180 | 159,858 | 802.59 | 755 | 530 | 29,166 |
| S11 | 63,498,148 | 87,889 | 722.48 | 681 | 523 | 32,735 |
| S12 | 75,920,164 | 105,385 | 720.41 | 683 | 523 | 11,228 |
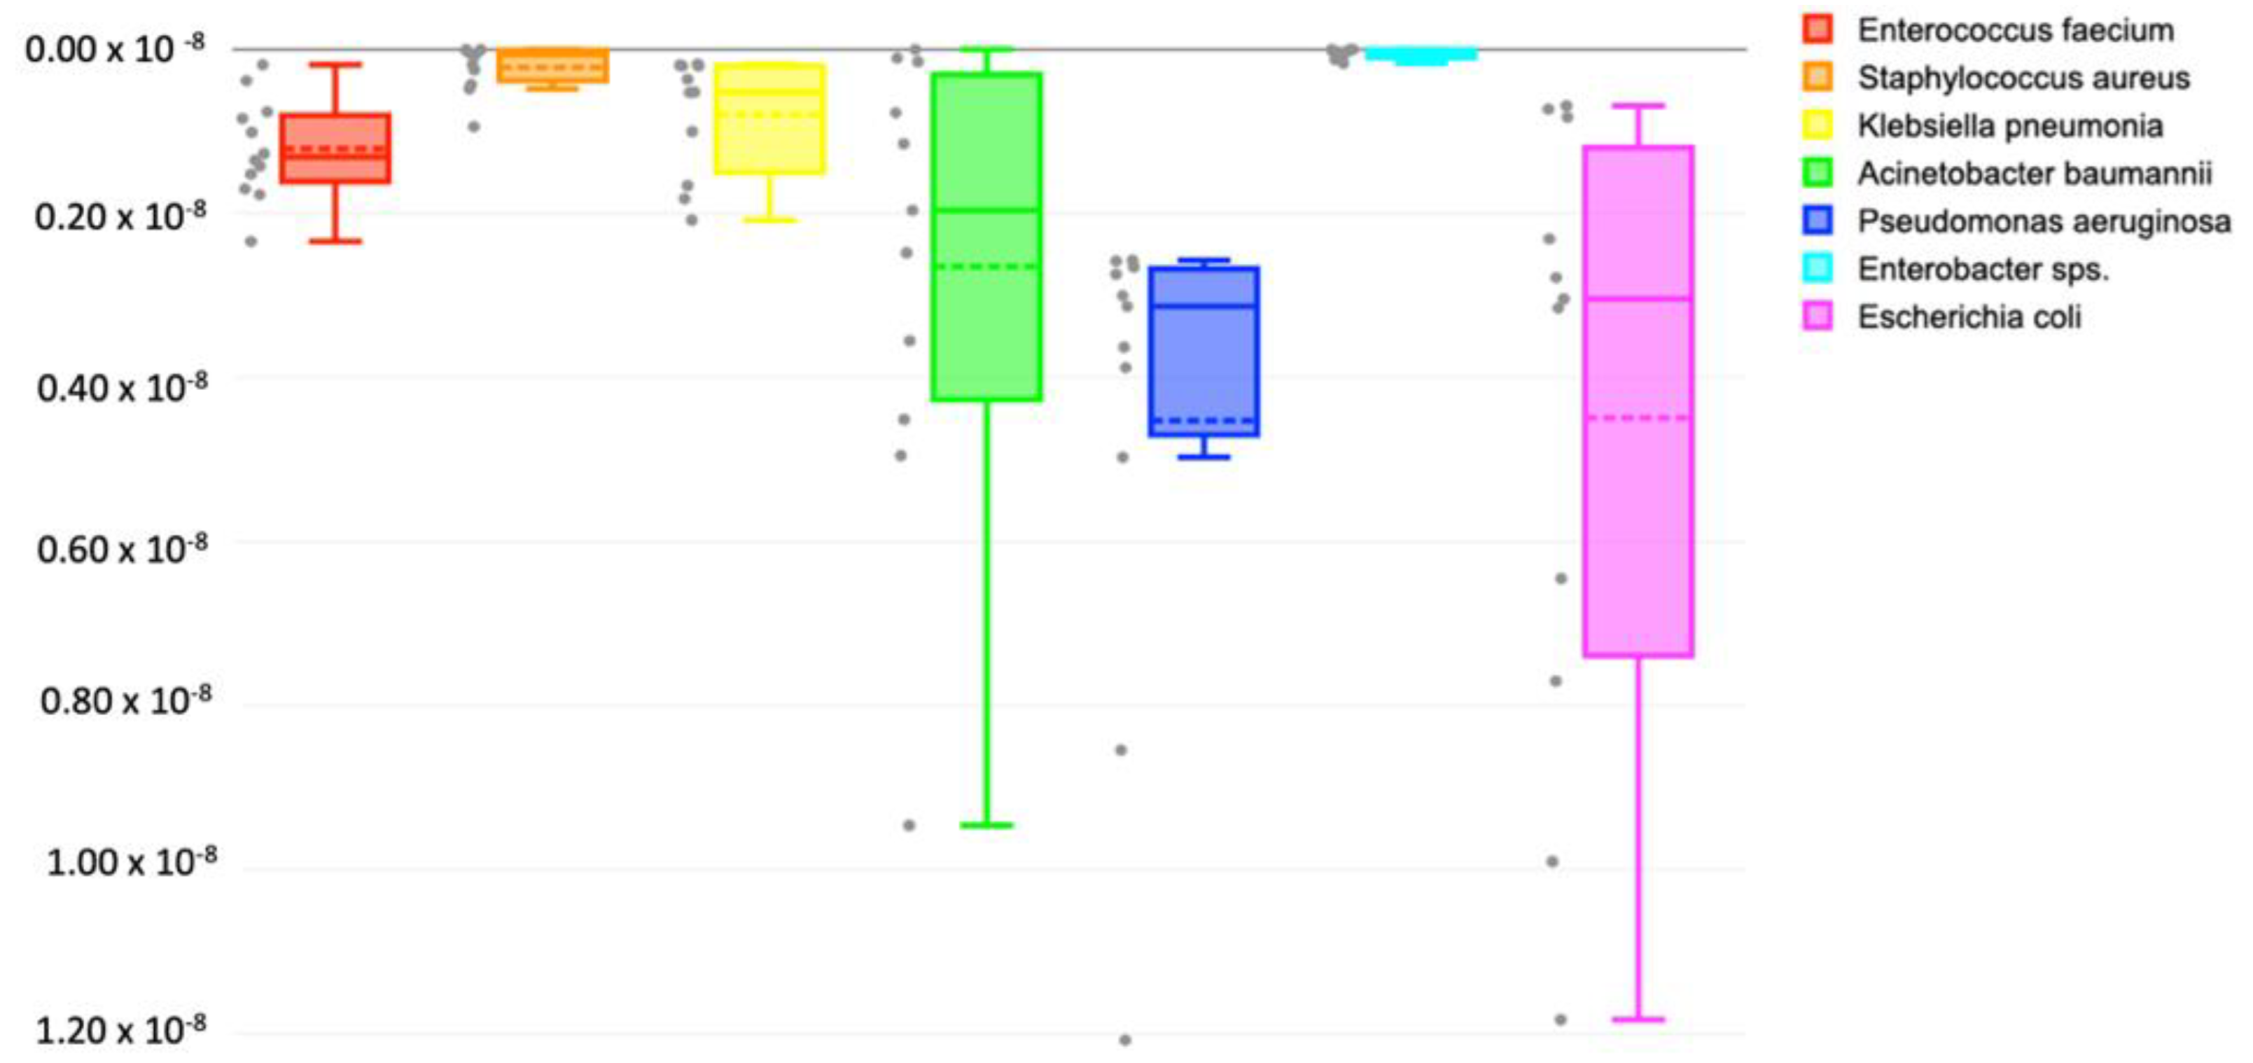
| ESKAPEE Pathogens | Absolute Abundance (OTUs) | Average | |||||||||||
|---|---|---|---|---|---|---|---|---|---|---|---|---|---|
| S1 | S2 | S3 | S4 | S5 | S6 | S7 | S8 | S9 | S10 | S11 | S12 | ||
| Escherichia coli | 3996 | 64 | 680 | 204 | 874 | 569 | 73 | 246 | 1044 | 268 | 278 | 61 | 696 |
| Klebsiella pneumoniae | 161 | 18 | 18 | 147 | 46 | 88 | 46 | 32 | 183 | 16 | 17 | 362 | 94 |
| Staphylococcus aureus | 0 | 22 | 5 | 16 | 1 | 42 | 83 | 807 | 5 | 0 | 37 | 1 | 85 |
| Pseudomonas aeruginosa | 265 | 227 | 242 | 1067 | 439 | 277 | 320 | 234 | 754 | 228 | 343 | 5590 | 832 |
| Acinetobacter baumannii | 835 | 13 | 398 | 102 | 314 | 437 | 9 | 68 | 0 | 1558 | 219 | 173 | 344 |
| Enterococcus faecium | 74 | 34 | 67 | 157 | 89 | 120 | 16 | 134 | 125 | 151 | 207 | 112 | 107 |
| Enterobacter sps. | 11 | 0 | 28 | 67 | 26 | 0 | 10 | 26 | 0 | 8 | 15 | 841 | 86 |
| Total | 5343 | 377 | 1438 | 1759 | 1789 | 1534 | 558 | 1547 | 2112 | 2229 | 1116 | 7138 | 2245 |
Publisher’s Note: MDPI stays neutral with regard to jurisdictional claims in published maps and institutional affiliations. |
© 2022 by the authors. Licensee MDPI, Basel, Switzerland. This article is an open access article distributed under the terms and conditions of the Creative Commons Attribution (CC BY) license (https://creativecommons.org/licenses/by/4.0/).
Share and Cite
Habibi, N.; Uddin, S.; Lyons, B.; Al-Sarawi, H.A.; Behbehani, M.; Shajan, A.; Razzack, N.A.; Zakir, F.; Alam, F. Antibiotic Resistance Genes Associated with Marine Surface Sediments: A Baseline from the Shores of Kuwait. Sustainability 2022, 14, 8029. https://doi.org/10.3390/su14138029
Habibi N, Uddin S, Lyons B, Al-Sarawi HA, Behbehani M, Shajan A, Razzack NA, Zakir F, Alam F. Antibiotic Resistance Genes Associated with Marine Surface Sediments: A Baseline from the Shores of Kuwait. Sustainability. 2022; 14(13):8029. https://doi.org/10.3390/su14138029
Chicago/Turabian StyleHabibi, Nazima, Saif Uddin, Brett Lyons, Hanan A. Al-Sarawi, Montaha Behbehani, Anisha Shajan, Nasreem Abdul Razzack, Farhana Zakir, and Faiz Alam. 2022. "Antibiotic Resistance Genes Associated with Marine Surface Sediments: A Baseline from the Shores of Kuwait" Sustainability 14, no. 13: 8029. https://doi.org/10.3390/su14138029