Article

A Complete Information Interaction-Based Bus Passenger Flow Control Model for Epidemic Spread Prevention

1
School of Traffic & Transportation, Chongqing Jiaotong University, Chongqing 400074, China
2
Chongqing Productivity Council, Chongqing 401147, China
3
Ningbo Citizen Card Operation Management Co., Ltd., Ningbo 315199, China
4
Chongqing Ulit Technology Co., Ltd., Chongqing 408319, China
*
Author to whom correspondence should be addressed.
Sustainability 2022, 14(13), 8032; https://doi.org/10.3390/su14138032
Submission received: 20 May 2022 / Revised: 23 June 2022 / Accepted: 28 June 2022 / Published: 30 June 2022

Abstract

:
Because the strategy of stopping bus lines during an epidemic can negatively impact residents, this study proposes a bus passenger flow control model to optimize the safety of and access to bus transport. The information interaction environment can provide a means for the two-way regulation of buses and passengers. In this model, passengers first request their pick-up and drop-off location, and then the bus feeds back information on whether it accepts the request. Through this method, passenger flow control can be realized through complete information interaction. The study aimed to establish a multi-objective function that minimizes the weighted total cost of the safety cost, the passenger travel cost, and the bus travel cost during an epidemic. The constraints were the full load and riding rates of urban buses in peak periods under the condition of epidemic prevention and control. The results showed that, in the morning peak period, the passenger flow control scheme reduced the passenger infection probability by 17.89%, compared with no passenger flow control scheme. The weighted total cost of the epidemic safety cost, the passenger travel cost, and the bus operation cost was reduced by 8.04%. The optimization effect of the passenger flow control scheme of this model is good, and not only reduces the probability of passengers being infected, but also meets the requirements of epidemic prevention and the travel needs of residents.

1. Introduction

In January 2020, the coronavirus disease pandemic broke out and caused serious losses all over the world. In the early stage of the pandemic, China implemented effective measures, such as the daily detection and isolation of patients, the isolation of residents at home, and the control of the public transport system [1]. However, the struggle against the pandemic is not yet over, and it is still necessary to strictly control the source and route of transmission of the virus. Denphedtnong et al. [2] showed that urban traffic affects the number of infected people and the duration of the outbreak. Moreover, because the public transport system has remarkable characteristics of high capacity and high density, it has become an efficient way to spread the virus, and some residents avoid using it. Mehdi et al. [3] described how the mutual spread of fear and danger among a large number of people resulted in the avoidance of public transport. Wang [4] simulated the travel dynamics of the public during the severe acute respiratory syndrome epidemic and found that half of the passengers reduced the use of public transport during the peak period of the epidemic. Kwok [5] investigated the willingness of Hong Kong residents to travel in the early stage of the pandemic. The study found that 39% of the respondents avoided using buses. Tiikkaja et al. [6] demonstrated that the number of public transport passengers in the Tampere area in May 2020 was significantly lower than that in January. The impact of the pandemic on public transport has attracted the attention of many researchers, and research on the transmission model of the virus in the public transport network and the relevant prevention measures is extremely important.
The spread of a virus is an extremely complex process. It is necessary to use models to analyze the spread of a virus in order to study the internal law of the spread of a virus in the public transport system. Roosa et al. [7] first used the GLM method and the Richard model to predict the spread of COVID-19 in Guangdong and Zhejiang, China. The results showed that China’s epidemic prevention and control strategy can successfully reduce the spread of the virus [8]. Kucharski et al. [9] established a dynamic model of random transmission of the virus and predicted the number of infections in the peak period of the epidemic. With more and more studies, the most widely used epidemic dynamics models for COVID-19 are the susceptible-infectious(SI), susceptible-infectious-removed(SIR), susceptible-infectious-susceptible(SIS), and susceptible-exposed-infectious-removed (SEIR) models. Abrams et al. [10] used the improved SEIR model to predict the prevalence of COVID-19 over time in different age groups. The results showed that it could quite accurately predict the hospitalization of the Belgian population during the epidemic and the deaths related to coronavirus disease in 2019. Babajanyan et al. [11] used the SIR model to explore disease outbreak and transmission among young people and older adults of different ages. The study found that older adults are more vulnerable to infection and death and proposed that a partial blockade strategy is a more desirable response. Leonenko et al. [12] studied the application of a continuous SEIR model described by ordinary differential equations and a discrete model represented by difference equations in the prediction of influenza outbreak peak in Russian cities. A number of researchers have used the SEIR model to analyze and predict the epidemic situation in other places, such as Chile [13] and Algeria [14], and have demonstrated the applicability of the SEIR model in the analysis of the spread of the pandemic.
According to the existing research, COVID-19 spreads most easily through close contact between people in closed environments [15]. Therefore, ways to minimize contact between people in a bus and better implement prevention measures in the public transport system are particularly important. Taking the London underground as the research object, Goscé et al. [16] analyzed the relationship between airborne infectious diseases and the use intensity of urban public transport. The study proposed the need for certain intervention measures for public transport. Aloi et al. [17] studied the impact of quarantine measures in Santander city on the internal mobility of the city during the epidemic period, showing that the use of public transport decreased the most, and the travel demand decreased by 93%. Tirachini et al. [18] put forward a series of measures on public transport to prevent and control the epidemic, pointing out that the effective management of congestion is very important to reduce public health risks. Musselwhite et al. [19] pointed out that a common measure provided by the authorities is to ensure the internal cleanliness and hygiene of public transport vehicles. The study believed that this requires a lot of human resources, and its logistics may be very complex. Sogbe [20] pointed out that the Ministry of Transport instructed that the physical distance of passengers should be maintained in the bus, the bus should be cleaned regularly, and each passenger should wear a mask, but these instructions were not followed. Yuan Quan et al. [21] observed that 25 cities took measures to completely shut down urban conventional public transport during the first wave of COVID-19 in China (20 January to 15 February 2020). Mou Zhenhua et al. [22] studied the impact of bus travel on virus transmission and formulated macro-control and micro-adjustment strategies, that is, stopping some bus lines and adjusting departure interval and full load rates. Hu et al. [23] considered that measures such as increasing seating distances, reducing passenger density, and using personal hygiene protection should be taken to reduce the transmission risk of the virus within public transport.
This study believes that the common measures to ensure the internal cleanliness of public transport vehicles cannot be continuously observed, and the strategy of stopping public transport lines has seriously affected the lives of residents, especially those in low-risk and medium-risk areas. They maintain that such measures impede necessary travel and increase travel cost and time. Therefore, it is necessary not only to improve the safety of passengers taking the bus as much as possible, but also to meet the necessary travel needs of residents. In light of the fact that the existing research lacks overall consideration of pandemic situation and information interaction, this study aimed to establish a bus passenger flow control model to optimize the safety of and access to bus transport. In the information interaction environment, the bus service level and travel efficiency can be improved through the submission of passengers’ demand and the acceptance or rejection of passengers’ demand by the bus, which provides a means for the two-way regulation of bus and passengers. In this model, passengers request service in advance and passenger flow control can be realized through complete information interaction. The model can serve as a multi-objective function that minimizes the weighted total cost of the safety cost, the passenger travel cost, and the bus travel cost during an epidemic.

2. Problem Description

In a bus, the risk of infection spread mainly comes from the contact between passengers and latent and infected people in a closed environment. At present, the public transport infection prevention strategies implemented during the pandemic mainly consist of measures such as the complete or partial shutdown of bus lines. Although such measures can reduce the spread of the virus, they do not support the travel needs of passengers. Moreover, conventional buses cannot provide information on public transport in real time, which can cause long wait times and missed buses. Nowadays, the information interaction environment enables buses to better serve passengers and improve resident travel conditions. This study developed a model based on complete information interaction aimed at reducing the possibility of passengers being infected, improving travel efficiency and bus services, and realizing the control of bus passenger flow through advanced reserved bus travel and feedback information.
For a certain bus line, assuming that there are z buses running, passengers need to submit travel information in advance, including the pick-up and drop-off locations, and make an appointment for, say, the d bus ( d = 1 ,   2 ,   ,   z ). The reservation time should be before the departure time of the bus. After receiving the advance booking information of all passengers before departure, the d bus obtains the initial passenger demand set; establishes a bus passenger flow interactive control model considering the impact of the virus; considers the safety, passenger travel, and bus operation costs under the impact of the epidemic; establishes a multi-objective function with the minimum total cost of the three; and judges whether to accept the reservation demand of the passenger. If the passenger’s reservation demand is rejected, these passengers will be offered the next bus, so as to realize the control of bus passenger flow. The flow chart for bus passenger flow is shown in Figure 1.

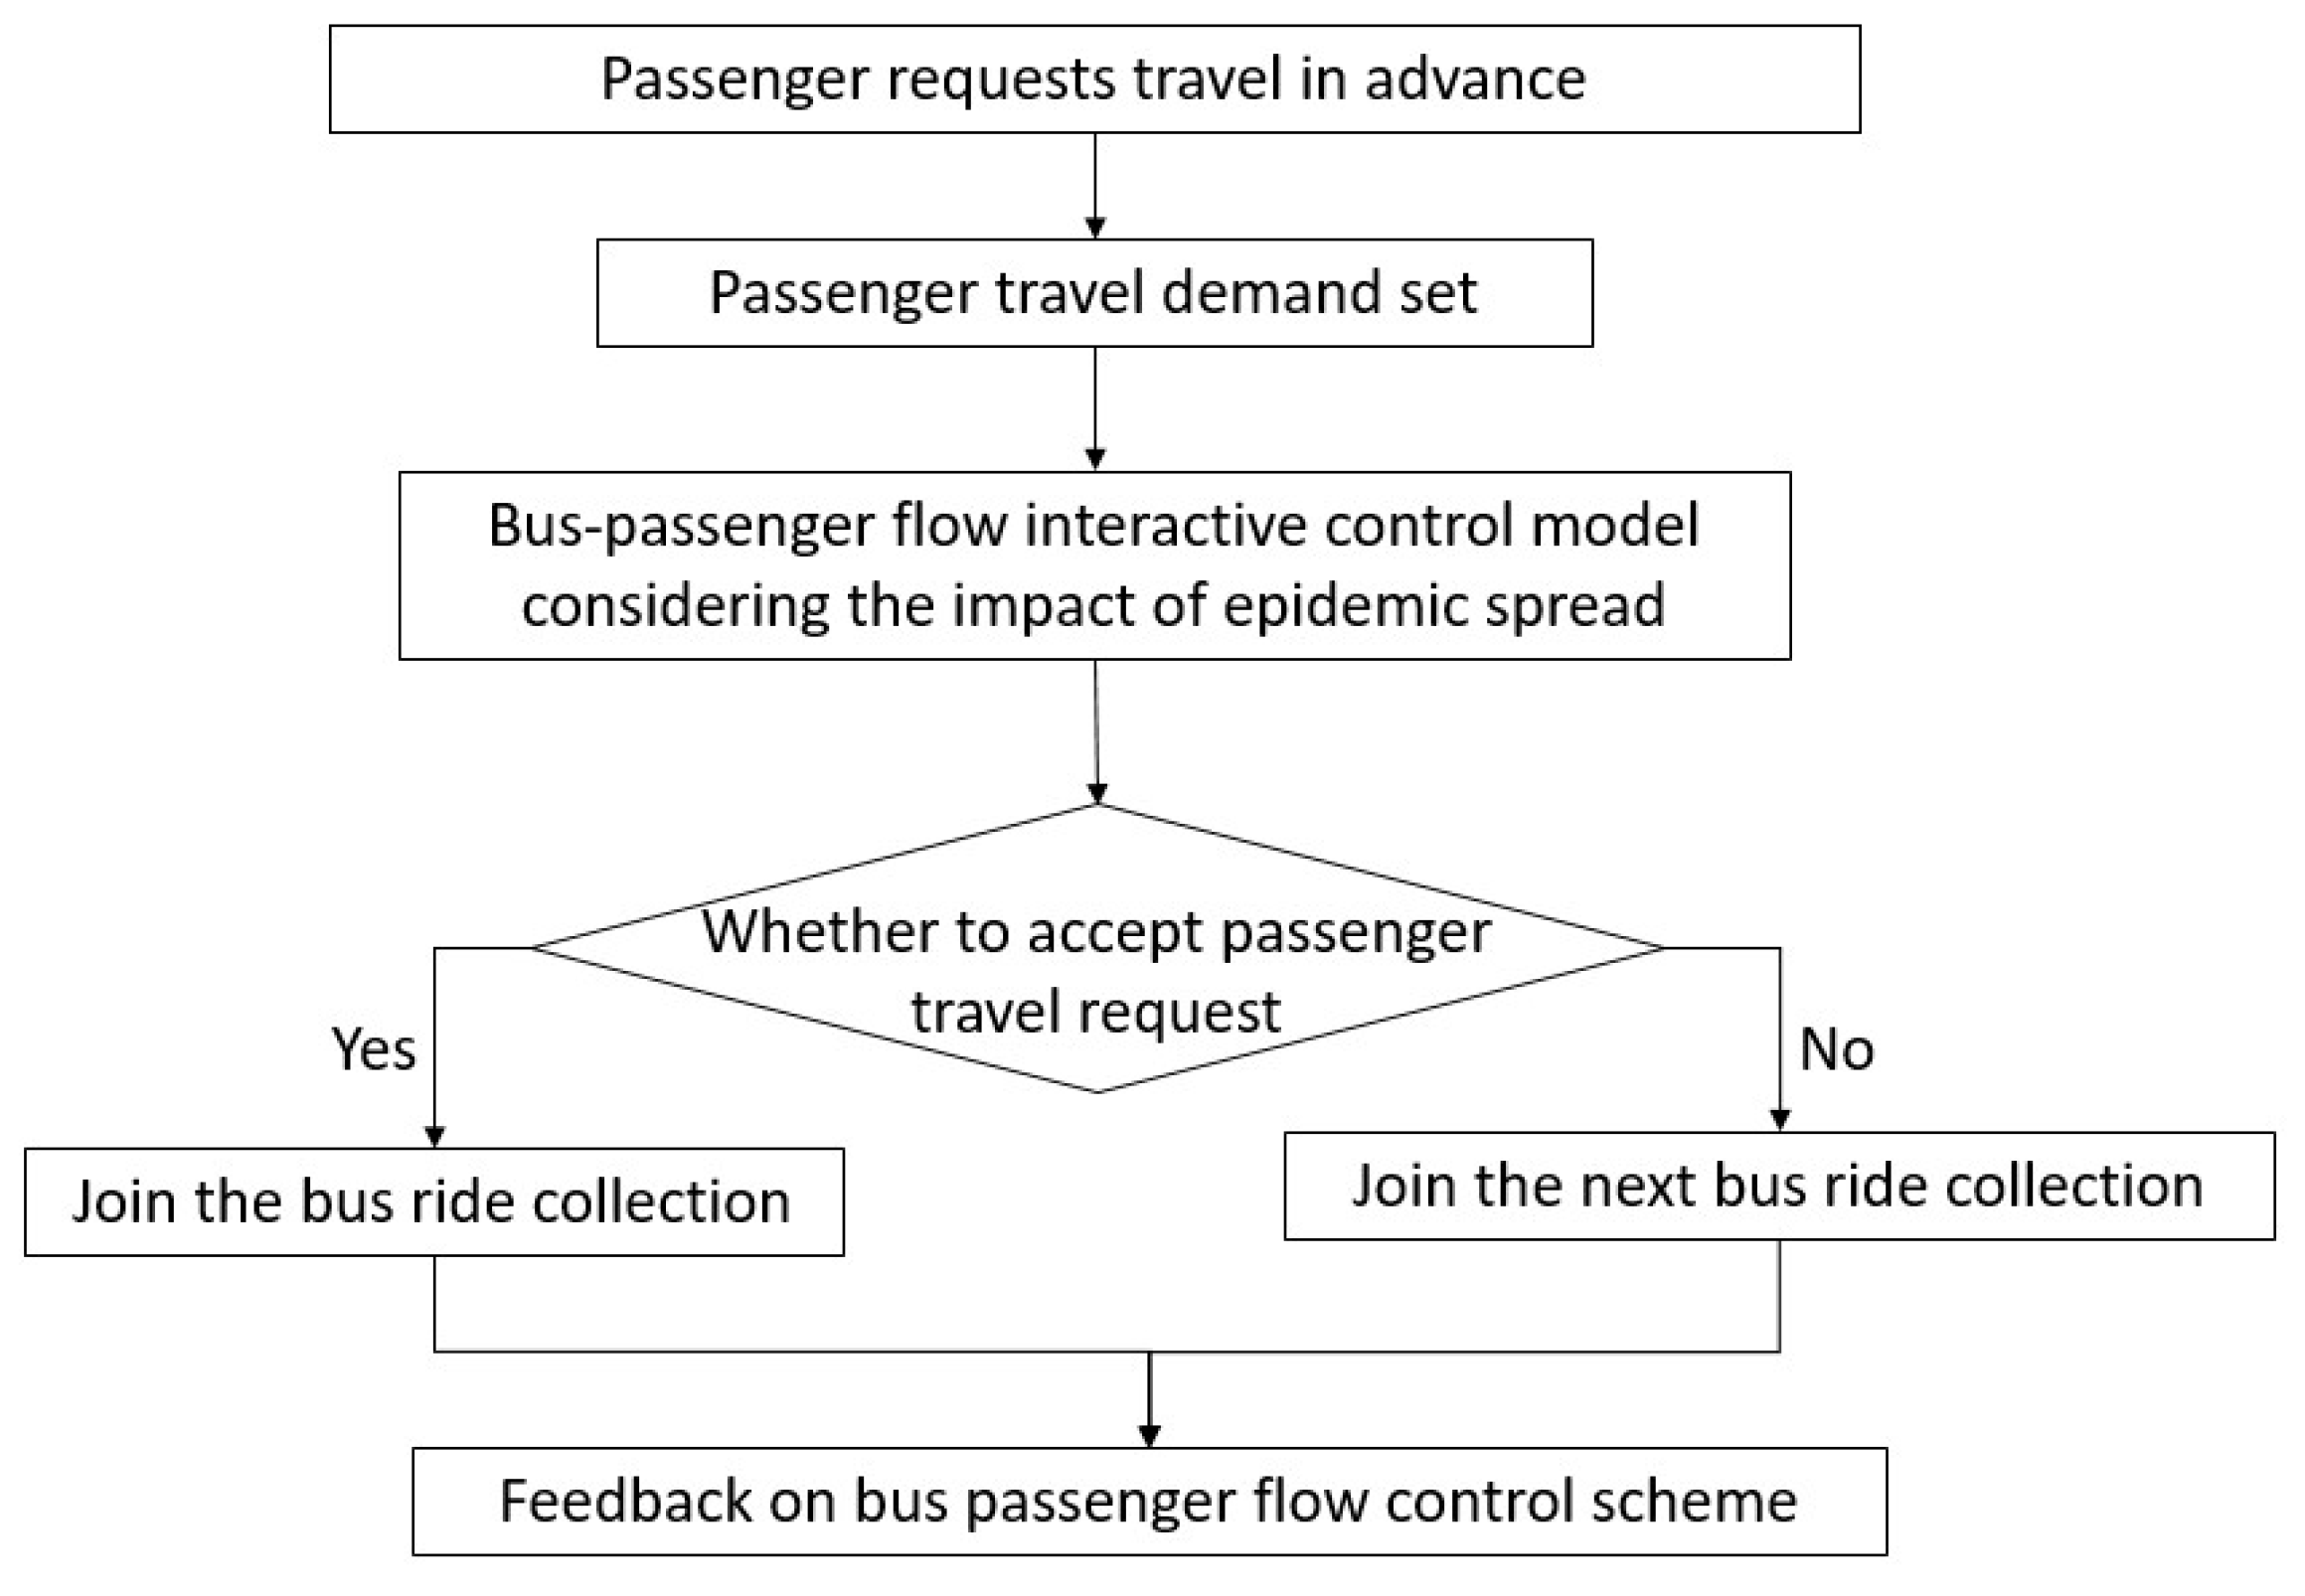
3. A Bus Passenger Flow Interactive Control Model Based on the Impact of COVID-19 Spread

The purpose of this study is to control the flow of bus passengers in the information interaction environment, realize the coordinated passengers dispatching, and improve the travel efficiency of passengers and the service level of buses. The main problem studied is to minimize the possibility of infection of passengers when they take the bus, and reduce the loss of bus operators and passengers under the influence of the epidemic.

3.1. Basic Assumptions

In order to simplify the problem and facilitate the establishment and solution of the model, the following assumptions are made in this paper:
  • The travel needs of passengers are known, that is, the pick-up and drop-off locations, regardless of the passenger travel time window and transfer;
  • The bus obtains the travel needs of passengers in advance, leaves the station on time according to the departure schedule, and runs according to the fixed bus line. The bus will not accept any changes in passenger destination after departure;
  • The determination of the spread of the epidemic is based on the risk of transmission on the bus, not the risk of waiting at a stop and getting on and off the bus;
  • Each passenger pays the same fare for one trip, regardless of the distance traveled. In addition, during the bus ride, there are no traffic jams or emergencies on the road, and the bus moves forward at a constant speed.

3.2. Basic Model of Infection Transmission via Bus Transport

Complex network disease transmission models mainly include the SI, SIR, SIS, and SEIR models, which play a very important role in the analysis of disease transmission. The SEIR model divides the population into the susceptible (S), latent (E), infectious (I), and immune (R) states, which is suitable for the current epidemic situation. This model is used to study the development trend of infectious disease transmission speed, and plays a guiding role in infectious disease control and prevention [24].
This study chose the SEIR model to describe the transmission process of an infectious disease inside the bus. However, the people in the latent state in the SEIR model are not infectious, which is inconsistent with the fact that individuals with COVID-19 can infect others in the closed environment of vehicles when they are in the incubation period. Therefore, given that COVID-19 can spread through contact and droplet infection among passengers in the public transport system, this study establishes a bus epidemic transmission model based on the improved SEIR model. Considering the limited time spent on the bus, only close contacts are considered, and secondary close contacts are not considered; thus, this study assumed that a newly infected person will not spread the virus to others during the journey. Therefore, the intra-bus transmission model only considers the process of a healthy person transitioning to a latent person.
In this study, the internal epidemic transmission model of the bus has a short ride time; thus, only the infection of susceptible people is studied, and the transitioning of latent people to infected people and infected people to immunized people is not studied. Assuming the possibility m of susceptible persons in the bus being infected by latent and infected persons is proportional to the time Δ t in the bus and the contact infection rate α and virus density ρ [25]:
m = ( a ρ + h ) Δ t
ρ = v b Δ t V
h = α b
Here, a is the positive proportional coefficient, v is the intensity of virus release, b is the number of passengers with infectious characteristics, and V is the volume of the bus.
Then, when there are b infectious persons within Δ t , the infection possibility m of the susceptible person can be expressed as:
m = a v b V Δ t 2 + α b Δ t  

3.3. Complete Information Interaction-Based Bus Passenger Flow Control Model

In order to reduce the risk of infection in the bus, we should reduce the full load rate of bus vehicles and limit the number of passengers as much as possible, which is conducive to reducing the possibility of passengers being infected, so as to reduce the probability of the spread of the virus. However, blindly limiting the low full load rate for a long time will also have an impact on the urban economy. Therefore, we need to both effectively carry out prevention measures and minimize the losses to bus operation companies and passengers. Therefore, this study established a complete information interaction-based bus passenger flow control model, that is, a multi-objective function aimed at minimizing the epidemic safety cost Z 1 , the passenger travel cost Z 2 , and the bus operation cost Z 3 .
(1) Epidemic safety cost Z 1
If the number of passengers getting on at a location i and getting off at a location j is Q i , j , then when the bus leaves location k , the number of passengers in the bus is Q k :
O i = j = i + 1 n Q i , j
D j = i = 1 j 1 Q i , j  
Q k = f = 1 k ( O f D f )  
If the probability that the passengers are infectious (latent and infected) is p and the probability that they are susceptible is 1 p , the probability P i , b that there are b infectious persons in the bus is:
P i , b = C Q i b p b ( 1 p ) Q i b
Then, the infection probability m i , b caused by b infected persons in the time period t i from location i to location i + 1 on the bus is:
m i , b = b C Q i b p b ( 1 p ) Q i b ( a v V t i 2 + α t i )  
Therefore, the probability q that a passenger is infected during the time from location 1 to location n is:
q = i = 1 n 1 b = 1 Q i m i , b  
Then, the epidemic safety cost Z 1 is:
m i n Z 1 = β q = β i = 1 n 1 b = 1 Q i m i , b
In this formula, β is the economic cost of infection.
(2) Passenger travel cost Z 2
Because the pick-up and drop-off times at each location are short, this study assumed that there would be no spread of the virus during this period, and the pick-up and drop-off times of passengers at the bus stop are ignored. Each bus departs in strict accordance with the departure time schedule, and the estimated time of arrival at each bus stop will be displayed in advance. Passengers will go to the reserved pick-up location according to the estimated time and wait for boarding. Therefore, the passenger travel cost Z 2 in this case is:
Z 2 = θ [ t i = 1 n 1 O i y i + γ h d , d + 1 i = 1 n 1 O i ( 1 y i ) ]
O i = O i y i  
y i = { 1     0    
In this formula, θ is the waiting time cost of passengers per unit time, t is the expected waiting time when passengers arrive at the bus stop in advance, O i is the actual number of passengers when receiving the demand of passengers at location i ; O i is the number of passengers demanded in advance at location i , y i indicates whether to accept the passenger demand at location i , γ is the penalty factor when the bus refuses the passenger request, h d , d + 1 is the departure interval between the d bus reserved by the passenger, and the next bus d + 1 .
(3) Bus operation cost Z 3
The cost incurred by the bus in the running process is mainly the cost of fuel and energy consumption, and the revenue generated is the travel cost of each passenger. The bus operation cost Z 3 is:
Z 3 = c 1 l + c 2 c 3 i = 1 n 1 O i
In this formula, c 1 is the cost of the bus traveling 1 km on the bus line, l is the total length of the bus traveling from the initial to the final location on the bus line, c 2 is the additional cost of the bus, and c 3 is the unit fare of the bus.
Then, the weighted total cost objective function is:
m i n A = σ 1 Z 1 + σ 2 Z 2 + σ 3 Z 3  
In this formula, σ 1 ,   σ 2 , and σ 3 are the weight coefficients of the epidemic safety cost, the passenger travel cost, and the bus operation cost, respectively.
Restrictions:
S m i = 1 n 1 O i i = 1 n 1 O i  
Q i S     ( i = 1 , 2 , , n 1 )  
λ = S S  
λ m i n λ λ m a x  
σ 1 + σ 2 + σ 3 = 1  
In this formula, S m is the minimum occupancy rate of the bus, S is the limited number of people on the bus under the condition of infection prevention and control, S is the standard limited number of people on the bus, λ is the full load rate of the bus, λ m i n is the minimum full load of the bus, and λ m a x is the maximum full load rate of the bus. Formulas (3)–(21) indicates that the sum of the weight coefficients of the objective function is 1.
For better understanding the model, the parameters during bus driving are shown in Figure 2:

4. Solving the Model

The following steps were carried out to solve the model:
Step 1. First, the data on the pick-up and drop-off locations reserved in advance by passengers were processed to form a passenger origin–destination (OD) travel data table with the number of people who get on the bus at stop i and get off at stop j as Q i , j .
Step 2. Using formulas (22) and (23), O i and D j (the number of passengers getting on and off at each stop, respectively, reserved in advance) were calculated:
O i = j = i + 1 n Q i , j  
D j = i = 1 j 1 Q i , j  
Step 3. By analyzing the objective function, it was found that the number of passengers refused was related to the number of passengers getting on the bus, and the solution was limited, so that the search scope of the solution could be quickly narrowed.
Step 4. On the basis of formula (17), the enumeration method was used to obtain all the candidate solutions. Formula (24) was used to calculate the number of passengers who got off the bus at subsequent stops when the bus refused to board passengers at location i under various candidate schemes, and the actual number of passengers on the bus leaving each location could be calculated by Equation (7).
D j = D j Q i , j  
Step 5. All the candidate bus passenger flow control schemes obtained above were imported into Formula (18) for inspection, and the schemes that did not meet the conditions were eliminated.
Step 6. The remaining candidate schemes that met the conditions were imported into the objective function, so that the scheme with the lowest epidemic safety cost, passenger travel cost, and total bus operation cost was determined as the optimal passenger flow control scheme.

5. Case Analysis

5.1. Research Object

Due to the lack of a completely interactive information environment at present, this study took a certain bus line in a certain place as the research object. Based on the existing data collection technology, the OD data information of the bus of this shift obtained from the investigation is used as the passenger reservation information in this case analysis, so as to analyze the correctness and effectiveness of the model. The passenger flow data at each bus stop were retrieved. There were 15 bus stops on the line. The average one-way operation time of vehicles was about 40 min. During the peak period of the epidemic, the single vehicle passenger flow was about 120 people. The OD data of a certain bus are shown in Table 1 below. The information on the number of passengers picked up and dropped off at each bus stop could be obtained by sorting, as shown in Table 2.

5.2. Value Calibration

Before optimizing the model, a series of parameters required calibration. For the epidemic safety cost, the probability of each passenger becoming an infectious person was set at 0.01, and the probability of being a susceptible person was set at 0.99. According to the region’s per capita gross domestic product in 2021, the gross domestic product per capita was CNY 105,600/year, and the economic loss cost of the epidemic situation β was set at CNY 2025. Following past research [17], the proportional coefficient a was set at 0.005, and v was set at 10. The volume of the bus was set at 60 m3. The novel coronavirus pneumonia virus is highly contagious, but considering the limited full load rate of buses and that the range in the bus was small, the value of the contact infection rate α was set at 0.4.
For the travel cost of passengers, θ was the waiting time cost of the passengers per unit time. Based on 8 h of work per day and a total of 5 working days per week, the waiting time cost θ of each passenger per unit time was set at CNY 50.63/h; and t was the expected waiting time when passengers arrived at the bus stop in advance, generally 3–5 min, which was set as 4 min.
For the bus operation cost, the penalty factor γ when the bus rejects the passenger request was 1.2. The departure interval h d , d + 1 between buses during peak hours was 5 min. The cost of the bus traveling 1 km on the bus line c 1 was CNY 4. The total length l of the bus on the bus line from the initial location to the final location was 20 km. The average additional cost of each bus, c 2 , was CNY 20; and c 3 was the unit fare of the bus, set to CNY 2.
Because the focus of this study was to minimize the infection probability under the influence of the epidemic, the weight coefficients σ 1 , σ 2 , and σ 3   of the epidemic safety cost, the passenger travel cost, and the bus operation cost were set at 0.6, 0.2, and 0.2, respectively. According to the constraints, S m was the minimum bus occupancy rate of 85%–90%, taken as 87%; the full load rate λ of urban large buses during the peak period under the condition of epidemic prevention and control was taken as 0.8. Then, the bus limit number of passengers S was taken as 48 people.

5.3. Analysis of the Results

In the Table 2, the number of passengers booked in advance on the bus in this shift was 123. Given that the full load rate of the bus was 48, the minimum number of passengers was no less than 108. The passenger flow control scheme that did not meet the conditions was excluded, and then the software was used to write a program to calculate the cost indicators under different passenger flow control schemes, as shown in Table 3.
In the Table 3, y 1 = 0 indicates that the bus refused the demand of passengers getting on at location 1; y 1 = 0, y 12 = 0 indicates that the bus refused the demand of passengers getting on at locations 1 and 12 at the same time, and so on; and y 6 = 0, y 12 = 0, y 14 = 0 indicates that the bus rejected the passenger demand at locations 6, 12, and 14 at the same time. There are 18 better passenger flow control schemes in the Table 3, all of which met the requirements of the 48-load limit and no less than the 87% occupancy rate. According to the model, the scheme that minimized the weighted total cost under the constraints was the best passenger flow control scheme for the bus in this shift.
When the riding rate was 100% in Table 3, that is, when no passenger flow control measures were taken, the probability of infection of passengers was the highest, at 0.104011, and the weighted total cost at that time was 180.21. According to the model, when y 2   = 0, y 14   = 0, the probability of infection of passengers was the lowest, at 0.084809, which reduced the infection probability by 18.46% and the weighted total cost by 7.22%. When y 2   = 0, the probability of infection of passengers was 0.085408, which reduced the probability of infection by 17.89%; at the same time, the weighted total cost was the lowest, at 165.72, presenting a 8.04% reduction. To sum up, when y 2   = 0, that is, when the bus refused the passenger demand at location 2, and the occupancy rate was 91.06%, the optimal passenger flow control scheme was obtained, and the results showed that the optimization effect of the passenger flow control scheme of this model was good.

6. Conclusions

In light of the fact that the existing research lacks overall consideration of the pandemic situation and information interaction, stopping bus lines during an epidemic disrupts the necessary travel of residents, and conventional buses cannot provide information on public transport in real time, which causes problems such as long waiting times and missed buses. On the basis of complete information interaction, this study proposes that passengers reserve buses in advance and buses feedback information to passengers. Based on the bus epidemic transmission model, this study established a bus passenger flow control model under information interaction, that is, a multi-objective function with the minimum weighted total cost of the epidemic safety cost, the passenger travel cost, and the bus operation cost under the influence of the epidemic. The results showed that with the flow control scheme, the infection probability of passengers was 17.89% lower than it was without the scheme, and the weighted total cost of the epidemic safety cost, the passenger travel cost, and the bus operation cost was reduced by 8.04%. The optimization result of the model was good—not only was the infection probability of passengers reduced to a great extent, meeting the epidemic prevention requirements, but the necessary travel needs of residents was also met. Moreover, the model strengthens the research on public transport travel under the influence of pandemic spread to a certain extent.
This model also has disadvantages. First, this study only examined the spread of an infectious virus inside the bus, and did not consider the susceptibility of passengers waiting for the bus at the platform and getting on and off the bus. Second, due to the limited time for passengers to take the bus, the study only considered the state in which susceptible people are infected and become latent carriers in the bus; that is, only close contacts, were studied as opposed to sub-close contacts. Furthermore, due to the lack of a fully interactive information environment at present, the case study is out of reality and basic assumptions are ideal. However, with the development of technology, the scenario of fully interactive information can be developed and applied to real life, which can make the bus better serve passengers and greatly improve the travel efficiency of residents. This study will have certain practical value in the future information interaction environment, though there may be limitations on the elderly and children who cannot use the intelligent system of appointment system.

Author Contributions

Conceptualization, X.H. and Y.X.; methodology, W.L. and Y.X; software, J.G.; validation, X.H., W.L. and T.Z.; formal analysis, X.Z. and J.G.; investigation, Y.X.; resources, X.H.; data curation, T.Z.; writing—original draft preparation, Y.X.; writing—review and editing, X.H., W.L., Y.X. and Y.B.; visualization, X.Z.; supervision, W.L.; project administration, X.H. All authors have read and agreed to the published version of the manuscript.

Funding

This research was supported in part by the Chongqing Social Science Planning Project under grant 2021NDYB035, in part by the Sichuan Science and Technology Program under grant 2022YFG0132 and in part by the Chongqing Postgraduate Joint Training Base Project (Chongqing Jiaotong University-Chongqing Ulit Technology Co., Ltd. Joint Training Base for Postgraduates in Transportation).

Data Availability Statement

Data available on request due to restrictions of privacy.

Conflicts of Interest

The authors declare no conflict of interest.

References

  1. Anderson, R.M.; Heesterbeek, H.; Klinkenberg, D.; Hollingsworth, T.D. How will country-based mitigation measures influence the course of the COVID-19 epidemic? Lancet 2020, 395, 931–934. [Google Scholar] [CrossRef]
  2. Denphedtnong, A.; Chinviriyasit, S.; Chinviriyasit, W. On the dynamics of SEIRS epidemic model with transport-related infection. Math. Biosci. 2013, 245, 188–205. [Google Scholar] [CrossRef]
  3. Moussaïd, M. Opinion formation and the collective dynamics of risk perception. PLoS ONE 2013, 8, e84592. [Google Scholar]
  4. Wang, K.Y. How change of public transportation usage reveals fear of the SARS virus in a city. PLoS ONE 2014, 9, e89405. [Google Scholar] [CrossRef] [Green Version]
  5. Kwok, K.O.; Li, K.K.; Chan, H.H.; Yi, Y.Y.; Tang, A.; Wei, W.I.; Wong, Y.S. Community responses during the early phase of the COVID-19 epidemic, Hong Kong. Emerg. Infect. Dis. 2020, 26, 1575–1579. [Google Scholar] [CrossRef]
  6. Tiikkaja, H.; Viri, R. The Effects of COVID-19 Epidemic on Public Transport Ridership and Frequencies. A Case Study from Tampere, Finland. Transp. Res. Interdiscip. Perspect. 2021, 10, 100348. [Google Scholar] [CrossRef]
  7. Roosa, K.; Lee, Y.; Luo, R.; Kirpich, A.; Rothenberg, R.; Hyman, J.M.; Yan, P.; Chowell, G. Short-term Forecasts of the COVID-19 Epidemic in Guangdong and Zhejiang, China: 13–23 February 2020. J. Clin. Med. 2020, 9, 596. [Google Scholar] [CrossRef] [Green Version]
  8. Roosa, K.; Lee, Y.; Luo, R.; Kirpich, A.; Rothenberg, R.; Hyman, J.; Yan, P.; Chowell, G. Real-time forecasts of the 2019-nCoV epidemic in China from February 5th to February 24th, 2020. Infect. Dis. Model. 2020, 5, 256–263. [Google Scholar]
  9. Kucharski, A.J.; Russell, T.W.; Diamond, C.; CMMID nCoV Working Group; Funk, S.; Eggo, R.M. Early dynamics of transmission and control of COVID-19: A mathematical modelling study. Lancet Infect. Dis. 2020, 20, 553–558. [Google Scholar] [CrossRef] [Green Version]
  10. Abrams, S.; Wambua, J.; Santermans, E.; Willem, L.; Kuylen, E.; Coletti, P.K.; Libin, P.; Faes, C.; Petrof, O.; Herzog, S.A.; et al. Modeling the early phase of the Belgian COVID-19 epidemic using a stochastic compartmental model and studying its implied future trajectories. Epidemics 2021, 35, 100449. [Google Scholar] [CrossRef]
  11. Babajanyan, S.; Cheong, K.H. Age-structured SIR model and resource growth dynamics: A COVID-19 study. Nonlinear Dyn. 2021, 104, 2853–2864. [Google Scholar] [CrossRef]
  12. Leonenko, V.N.; Ivanov, S.V. Prediction of influenza peaks in Russian cities: Comparing the accuracy of two SEIR models. Math. Biosci. Eng. 2018, 15, 209. [Google Scholar]
  13. Guerrero-Nancuante, C.; Manríquez, P.R. An epidemiological forecast of COVID-19 in Chile based on the generalized SEIR model and the concept of recovered. Medwave 2020, 20, e7898. [Google Scholar] [CrossRef]
  14. Bentout, S.; Chekroun, A.; Kuniya, T. Parameter estimation and prediction for coronavirus disease outbreak 2019 (COVID-19) in Algeria. AIMS Public Health 2020, 7, 306. [Google Scholar] [CrossRef]
  15. Lowen, A.C.; Mubareka, S.; Tumpey, T.M.; García-Sastre, A.; Palese, P. The guinea pig as a transmission model for human influenza viruses. Proc. Natl. Acad. Sci. USA 2006, 103, 9988–9992. [Google Scholar] [CrossRef] [Green Version]
  16. Goscé, L.; Johansson, A. Analysing the link between public transport use and airborne transmission: Mobility and contagion in the London underground. Environ. Health 2018, 17, 84. [Google Scholar] [CrossRef] [Green Version]
  17. Aloi, A.; Alonso, B.; Benavente, J.; Cordera, R.; Echániz, E.; González, F.; Ladisa, C.; Lezama-Romanelli, R.; López-Parra, Á.; Mazzei, V.; et al. Effects of the COVID-19 Lockdown on Urban Mobility: Empirical Evidence from the City of Santander (Spain). Sustainability 2020, 12, 3870. [Google Scholar] [CrossRef]
  18. Tirachini, A.; Cats, O. COVID-19 and public transportation: Current assessment, prospects, and research needs. J. Public Transp. 2020, 22, 1. [Google Scholar] [CrossRef]
  19. Musselwhite, C.; Avineri, E.; Susilo, Y. Editorial JTH 16 –The Coronavirus Disease COVID-19 and implications for transport and health. J. Transp. Health 2020, 16, 100853. [Google Scholar] [CrossRef]
  20. Sogbe, E. The evolving impact of coronavirus (COVID-19) pandemic on public transportation in Ghana. Case Stud. Transp. Policy 2021, 9, 1607–1614. [Google Scholar] [CrossRef]
  21. Analysis of Urban Traffic Control Measures to Deal with Serious Public Health Events: City Bus. Available online: https://umi.tongji.edu.cn/info/1074/1198.htm (accessed on 13 April 2022).
  22. Mou, Z.H.; Li, X.; Yan, K.L.; Guo, J.J. COVID-19 transmission model and effectiveness analysis of epidemic prevention strategies in public transport networks. Traffic Inf. Saf. 2021, 39, 111–117. [Google Scholar]
  23. Hu, M.; Lin, H.; Wang, J.; Xu, C.; Tatem, A.J.; Meng, B.; Zhang, X.; Liu, Y.; Wang, P.; Wu, G.; et al. Risk of Coronavirus Disease 2019 Transmission in Train Passengers: An Epidemiological and Modeling Study. Clin. Infect. Dis. 2021, 72, 604–610. [Google Scholar] [CrossRef]
  24. Partohaghighi, M.; Akgül, A. Modelling and simulations of the SEIR and Blood Coagulation systems using Atangana-Baleanu-Caputo derivative. Chaos Solitons Fractals 2021, 150, 111135. [Google Scholar] [CrossRef]
  25. Zhang, Y.; Tian, W.L.; Wu, Z.G.; Chen, Z.W.; Wang, J. COVID-19 transmission mechanism along traffic routes based on improved SEIR model. J. Traffic Transp. Eng. 2020, 20, 150–158. [Google Scholar]
Figure 1. Bus passenger flow control process.
Sustainability 14 08032 g001
Figure 2. The parameters during bus driving.
Sustainability 14 08032 g002
Table 1. OD information on buses reserved by passengers in advance.
Bus Stop123456789101112131415
1022202030200000
2000200210102201
3000133022030000
4000020202012001
5000001422120000
6000000112300020
7000000000220131
8000000002004210
9000000000322013
10000000000002320
11000000000000232
12000000000000200
13000000000000033
14000000000000003
15000000000000000
Table 2. Passenger flow information at each bus stop.
Bus Stop123456789101112131415
on131114101299911772630
off0225569910121012121514
Table 3. Cost indicators under different passenger flow control schemes.
Control SchemeOccupancy RateInfection ProbabilityEpidemic Safety CostPassenger Travel CostBus Operation CostWeighted Total Cost
//100.00%0.104011210.62415.17 −146180.21
y1 = 0/89.43%0.089809181.86437.11 −120172.54
y12 = 087.80%0.089409181.05440.48 −116173.53
y2 = 0/91.06%0.085408172.95433.73 −124165.72
y12 = 089.43%0.085009172.14437.11 −120166.71
y14 = 088.62%0.084809171.74438.79 −118167.20
y3 = 0/88.62%0.089409181.05438.79 −118172.79
y4 = 0/91.87%0.091610185.51432.04 −126172.51
y12 = 090.24%0.091209184.70435.42 −122173.50
y14 = 089.43%0.091009184.29437.11 −120174.00
y12 = y14 = 087.80%0.090609183.48440.48 −116174.99
y5 = 0/90.24%0.093810189.97435.42 −122176.66
y12 = 088.62%0.093410189.16438.79 −118177.65
y14 = 087.80%0.093210188.75440.48 −116178.15
y6 = 0/92.68%0.094610191.59430.36 −128175.42
y12 = 091.06%0.094210190.78433.73 −124176.41
y13 = 087.80%0.092810187.94440.48 −116177.66
y14 = 090.24%0.094010190.37435.42 −122176.91
y12 = y14 = 087.80%0.093610189.56440.48 −116178.63
Publisher’s Note: MDPI stays neutral with regard to jurisdictional claims in published maps and institutional affiliations.

