
Multicriteria Approach for Supplier Selection: Evidence from a Case Study in the Fashion Industry

 ,
, 
Abstract
:1. Introduction
2. Literature Review
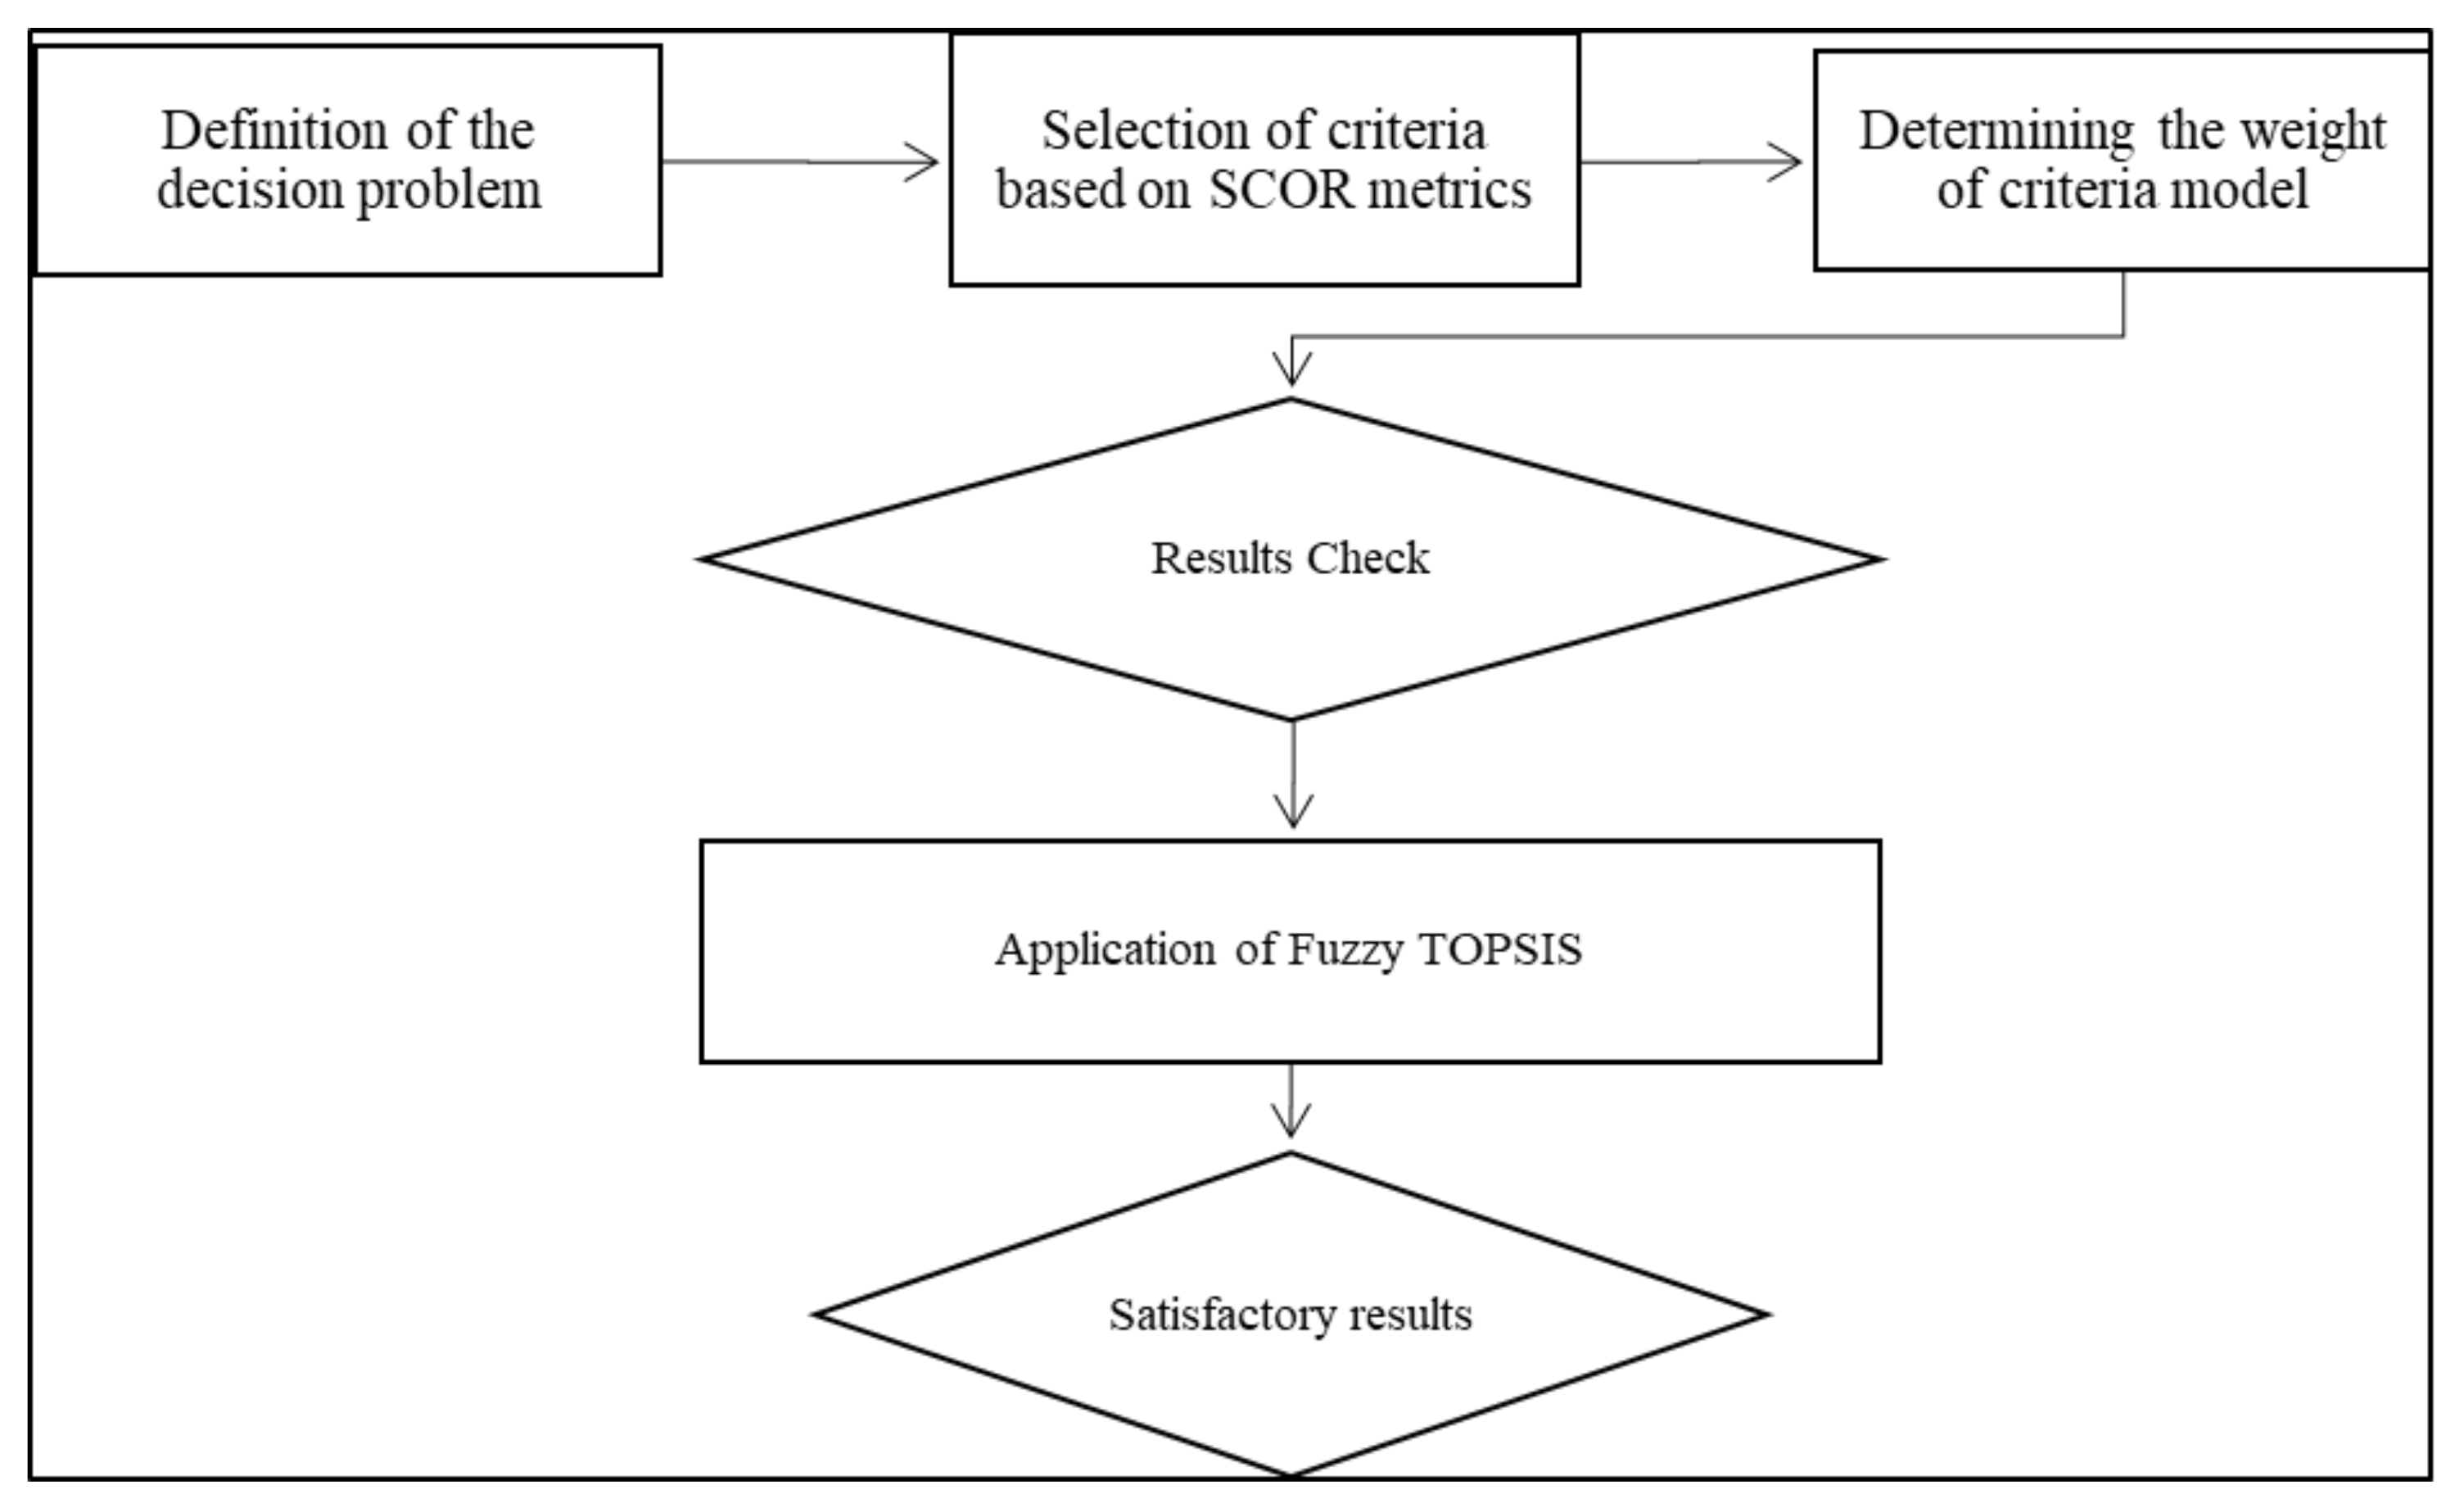
3. Materials and Methods
- −
- Establishing goals and criteria: SCOR metrics and literature reviews were used to develop robust criteria for assessing and selecting suppliers.
- −
- Including all potentially efficient suppliers, through a model which determines the weight of all criteria and sub-criteria.
- −
- By applying a fuzzy TOPSIS model, the set of probable suppliers is ranked and, based on PIS and NIS, the optimum supplier is proposed.
3.1. Methods for the Selection of Criteria
3.1.1. Reliability
3.1.2. Responsiveness
3.1.3. Flexibility Factor
3.1.4. Cost Factor
3.1.5. Asset Management Efficiency
3.2. Fuzzy Set Theory and Technique for Order Preference by Similarity to Ideal Solution (TOPSIS)
3.2.1. Fuzzy Set Theory
3.2.2. Fuzzy TOPSIS (FTOPSIS)
- Positive-ideal alternative: the alternative achieving the highest score with reference to all the attributes involved in the analysis, or say differently, “all best criteria values attainable”. This solution leads to the maximization of all benefits and a minimization of costs.
- Negative-ideal alternative: by reporting the lowest level of the attributes considered, or say differently, “all worst criteria values attainable”, this alternative results in benefit minimization and cost maximization [94].
4. Results
5. Discussion, Conclusions and Future Perspectives
- Reliability: On time delivery, geographic location and delivery of the right quantity.
- Responsiveness: Order fulfilment cycle time and processing time of returns.
- Flexibility: Order fulfilment lead time, continuous quality improvement programs and certification.
- Cost: Freight cost, processing cost of returns and cost of materials.
- Assets: Cash-to-cash cycle time, asset turns and inventory value.
Author Contributions
Funding
Institutional Review Board Statement
Informed Consent Statement
Data Availability Statement
Conflicts of Interest
Appendix A

| Criteria | Weights |
|---|---|
| On time delivery A1 | (0.5, 0.833, 0.9) |
| Geographic location A2 | (0.5, 0.767, 0.9) |
| Delivery the right quantity A3 | (0.3, 0.633, 0.9) |
| Order fulfilment cycle time B1 | (0.5, 0.833, 0.9) |
| Processing time of returns B2 | (0.5, 0.7, 0.9) |
| Order fulfilment lead time C1 | (0.7, 0.9, 0.9) |
| Continuous quality improvement programs C2 | (0.3, 0.7, 0.9) |
| Certification C3 | (0.30.567, 0.9) |
| Freight cost D1 | (0.3, 0.633, 0.9) |
| Processing cost of returns D2 | (0.3, 0.567, 0.9) |
| Cost of materials D3 | (0.5, 0.833, 0.9) |
| Cash-to-cash cycle time E1 | (0.5, 0.767, 0.9) |
| Asset turns E2 | (0.3, 0.7, 0.9) |
| Inventory value E3 | (0.5, 0.767, 0.9) |
| Criteria | Decision-Maker 1 | Decision-Maker 2 | Decision-Maker 3 | ||||||
|---|---|---|---|---|---|---|---|---|---|
| S1 | S2 | S3 | S1 | S2 | S3 | S1 | S2 | S3 | |
| A1 | H | A | H | A | L | H | A | A | VH |
| A2 | VH | L | VL | H | A | VL | VH | L | L |
| A3 | H | A | VH | A | L | H | A | A | H |
| B1 | A | H | H | L | A | A | VL | A | A |
| B2 | H | VL | L | A | L | L | H | H | VL |
| C1 | H | H | A | H | A | A | VH | A | A |
| C2 | L | H | VH | A | VH | VH | L | H | H |
| C3 | A | H | VH | A | VH | VH | L | H | VH |
| D1 | VH | L | VL | VH | A | L | H | L | VL |
| D2 | A | L | L | A | A | L | H | L | L |
| D3 | A | H | VL | A | VH | L | A | H | VL |
| E1 | A | A | VH | A | H | H | L | VH | VH |
| E2 | A | L | H | A | A | VH | L | H | VH |
| E3 | L | VH | A | L | H | H | VL | H | H |
Appendix B
| Criteria | S1 | S2 | S3 |
|---|---|---|---|
| A1 | 0.125 | 0.248 | 0 |
| A2 | 0 | 0.287 | 0.421 |
| A3 | 0.090 | 0.194 | 0 |
| B1 | 0 | 0.355 | 0.355 |
| B2 | 0.364 | 0.068 | 0 |
| C1 | 0 | 0.146 | 0.212 |
| C2 | 0.251 | 0.030 | 0 |
| C3 | 0.235 | 0.062 | 0 |
| D1 | 0.451 | 0.120 | 0 |
| D2 | 0.351 | 0.022 | 0 |
| D3 | 0.397 | 0.474 | 0 |
| E1 | 0 | 0.349 | 0.418 |
| E2 | 0 | 0.014 | 0.418 |
| E3 | 0 | 0.437 | 0.367 |
| 2.264 | 2.805 | 2.192 |
| Criteria | S1 | S2 | S3 |
|---|---|---|---|
| A1 | 0.150 | 0 | 0.248 |
| A2 | 0.421 | 0.152 | 0 |
| A3 | 0.133 | 0 | 0.194 |
| B1 | 0.355 | 0 | 0 |
| B2 | 0 | 0.350 | 0.364 |
| C1 | 0.212 | 0.121 | 0 |
| C2 | 0 | 0.227 | 0.251 |
| C3 | 0 | 0.184 | 0.235 |
| D1 | 0 | 0.419 | 0.451 |
| D2 | 0 | 0.348 | 0.350 |
| D3 | 0.077 | 0 | 0.473 |
| E1 | 0.419 | 0.070 | 0 |
| E2 | 0.418 | 0.417 | 0 |
| E3 | 0.437 | 0 | 0.070 |
| 2.623 | 2.288 | 2.639 |
References
- Arikan, F. A fuzzy solution approach for multi objective supplier selection. Expert Syst. Appl. 2013, 40, 947–952. [Google Scholar] [CrossRef]
- D’Amico, G.; Arbolino, R.; Shi, L.; Yigitcanlar, T.; Ioppolo, G. Digitalisation driven urban metabolism circularity: A review and analysis of circular city initiatives. Land Use Policy 2022, 112, 105819. [Google Scholar] [CrossRef]
- Petković, B.; Zandi, Y.; Agdas, A.S.; Nikolić, I.; Denić, N.; Kojić, N.; Selmi, A.; Issakhov, A.; Milošević, S.; Khan, A. Adaptive neuro fuzzy evaluation of energy and non-energy material productivity impact on sustainable development based on circular economy and gross domestic product. Bus. Strategy Environ. 2022, 31, 129–144. [Google Scholar] [CrossRef]
- Mina, H.; Kannan, D.; Gholami-Zanjani, S.M.; Biuki, M. Transition towards circular supplier selection in petrochemical industry: A hybrid approach to achieve sustainable development goals. J. Clean. Prod. 2021, 286, 125273. [Google Scholar] [CrossRef]
- Lenzo, P.; Traverso, M.; Salomone, R.; Ioppolo, G. Social life cycle assessment in the textile sector: An italian case study. Sustainability 2017, 9, 2092. [Google Scholar] [CrossRef] [Green Version]
- Nejat, V.S.; Darestani, S.A.; Omidvari, M.; Adibi, M.A. Evaluation of green lean production in textile industry: A hybrid fuzzy decision-making framework. Environ. Sci. Pollut. Res. 2021, 29, 11590–11611. [Google Scholar] [CrossRef]
- Ragatz, G.L.; Handfield, R.B.; Scannell, T.V. Success factors for integrating supplier into new product development. J. Prod. Innov. Manag. 1997, 14, 190–203. [Google Scholar] [CrossRef]
- Lin, R.H. An integrated model for supplier selection under a fuzzy situation. Int. J. Prod. Econ. 2012, 138, 55–61. [Google Scholar] [CrossRef]
- Alavi, B.; Tavana, M.; Mina, H. A Dynamic Decision Support System for Sustainable Supplier Selection in Circular Economy. Sustain. Prod. Consum. 2021, 27, 905–920. [Google Scholar] [CrossRef]
- Ciliberto, C.; Szopik-Depczyńska, K.; Tarczyńska-Łuniewska, M.; Ruggieri, A.; Ioppolo, G. Enabling the Circular Economy transition: A sustainable lean manufacturing recipe for Industry 4.0. Bus. Strategy Environ. 2021, 30, 3255–3272. [Google Scholar] [CrossRef]
- Tozanli, O.; Kongar, E.; Gupta, S.M. A supplier selection model for end-of-life product recovery: An industry 4.0 perspective. In Responsible Manufacturing—Issues Pertaining to Sustainability; Chapter 14; Alqahtani, A.Y., Kongar, E., Pochampally, K.K., Gupta, S.M., Eds.; CRC Press: Boca Raton, FL, USA, 2019; pp. 323–344. ISBN 978-081-537-507-4. [Google Scholar]
- Sarkis, J. A strategic decision framework for green supply chain management. J. Clean. Prod. 2003, 11, 397–409. [Google Scholar] [CrossRef]
- Frej, E.A.; Roselli, L.R.P.; Araújo de Almeida, J.; de Almeida, A.T. A multicriteria decision model for supplier selection in a food industry based on FITradeoff method. Math. Probl. Eng. 2017, 2017, 4541914. [Google Scholar] [CrossRef]
- Li, F.; Wu, C.H.; Zhou, L.; Xu, G.; Liu, Y.; Tsai, S.B. A model integrating environmental concerns and supply risks for dynamic sustainable supplier selection and order allocation. Soft Comput. 2021, 25, 535–549. [Google Scholar] [CrossRef]
- Chen, K.S.; Chung, L.; Chang, T.C. Developing a quality-based supplier selection model from the buying company perspective. Qual. Technol. Quant. Manag. 2021, 18, 267–284. [Google Scholar] [CrossRef]
- Gözükara, İ.; Çolakoğlu, N.; Şimşek, Ö.F. Development culture and TQM in Turkish healthcare: Importance of employee empowerment and top management leadership. Total Qual. Manag. Bus. Excell. 2019, 30, 1302–1318. [Google Scholar] [CrossRef]
- Dickson, G.W. An analysis of vendor selection systems and decisions. J. Purch. 1966, 2, 5–17. [Google Scholar] [CrossRef]
- Aissaoui, N.; Haouari, M.; Hassini, E. Supplier selection and order lot sizing modeling: A review. Comput. Oper. Res. 2007, 34, 3516–3540. [Google Scholar] [CrossRef]
- Ho, W.; Dey, P.K.; Bhattacharya, A. Strategic supplier selection using multi-stakeholder and multi-perspective approaches. Int. J. Prod. Econ. 2015, 166, 152–154. [Google Scholar] [CrossRef] [Green Version]
- Taherdoost, H.; Brard, A. Analyzing the process of supplier selection criteria and methods. Procedia Manuf. 2019, 32, 1024–1034. [Google Scholar] [CrossRef]
- Weber, C.A.; Current, J.R.; Benton, W.C. Vendor selection criteria and methods. Eur. J. Oper. Res. 1991, 50, 2–18. [Google Scholar] [CrossRef]
- Liao, Z.; Rittscher, J. A multi-objective supplier selection model under stochastic demand conditions. Int. J. Prod. Econ. 2007, 105, 150–159. [Google Scholar] [CrossRef]
- Tzeng, G.H.; Huang, J.J. Multiple Attribute Decision Making: Methods and Applications; CRC Press: Boca Raton, FL, USA, 2011. [Google Scholar]
- Keeney, R.L.; Raiffa, H. Decisions with Multiple Objectives: Preferences and Value Tradeoffs; John Wiley and Sons: New York, NY, USA, 1976. [Google Scholar]
- Boffardi, R.; De Simone, L.; De Pascale, A.; Ioppolo, G.; Arbolino, R. Best-compromise solutions for waste management: Decision support system for policymaking. Waste Manag. 2021, 121, 441–451. [Google Scholar] [CrossRef]
- Sonmez, M. Review and Critique of Supplier Selection Process and Practices ©; Loughborough University: Loughborough, UK, 2006. [Google Scholar]
- Wang, J.W.; Cheng, C.H.; Huang, K.C. Fuzzy hierarchical TOPSIS for supplier selection. Appl. Soft Comput. 2009, 9, 377–386. [Google Scholar] [CrossRef]
- Lima-Junior, F.R.; Carpinetti, L.C.R. Combining SCOR model and fuzzy TOPSIS for supplier evaluation and management. Int. J. Prod. Econ. 2016, 174, 128–141. [Google Scholar] [CrossRef]
- Junior, F.R.L.; Osiro, L.; Carpinetti, L.C.R. A comparison between Fuzzy AHP and Fuzzy TOPSIS methods to supplier selection. Appl. Soft Comput. 2014, 21, 194–209. [Google Scholar] [CrossRef]
- Wątróbski, J.; Bączkiewicz, A.; Ziemba, E.; Sałabun, W. Sustainable cities and communities assessment using the DARIA-TOPSIS method. Sustain. Cities Soc. 2022, 83, 103926. [Google Scholar] [CrossRef]
- Alfaro-Garcia, V.G.; Blanco-Mesa, F.; León-Castro, E.; Merigo, J.M. Bonferroni Weighted Logarithmic Averaging Distance Operator Applied to Investment Selection Decision Making. Mathematics 2022, 10, 2100. [Google Scholar] [CrossRef]
- Dezert, J.; Tchamova, A.; Han, D.; Tacnet, J.M. The SPOTIS rank reversal free method for multi-criteria decision-making support. In Proceedings of the 2020 IEEE 23rd International Conference on Information Fusion (FUSION), Rustenburg, South Africa, 6–9 July 2020; pp. 1–8. [Google Scholar]
- Chmielarz, W.; Zborowski, M. On analysis of e-banking websites quality–comet application. Procedia Comput. Sci. 2018, 126, 2137–2152. [Google Scholar] [CrossRef]
- Sałabun, W. The characteristic objects method: A new distance-based approach to multicriteria decision-making problems. J. Multi-Criteria Decis. Anal. 2015, 22, 37–50. [Google Scholar] [CrossRef]
- Bolstorff, P.; Rosenbaum, R. Supply chain excellence: A handbook for dramatic improvement using the SCOR model. J. Supply Chain Manag. 2003, 39, 38. [Google Scholar]
- Huan, S.H.; Sheoran, S.K.; Wang, G. A review and analysis of supply chain operations reference (SCOR) model. Supply Chain. Manag. Int. J. 2004, 9, 23–29. [Google Scholar] [CrossRef]
- Chan, F.T.; Qi, H.J. An innovative performance measurement method for supply chain management. Supply Chain. Manag. Int. J. 2003, 8, 209–223. [Google Scholar] [CrossRef]
- Bai, C.; Sarkis, J. Integrating sustainability into supplier selection with grey system and rough set methodologies. Int. J. Prod. Econ. 2010, 124, 252–264. [Google Scholar] [CrossRef]
- Soffer, P.; Wand, Y. Goal-driven multi-process analysis. J. Assoc. Inf. Syst. 2007, 8, 9. [Google Scholar] [CrossRef] [Green Version]
- Gumus, A.T.; Guneri, A.F.; Ulengin, F. A new methodology for multi-echelon inventory management in stochastic and neuro-fuzzy environments. Int. J. Prod. Econ. 2010, 128, 248–260. [Google Scholar] [CrossRef]
- Wang, C.N.; Huang, Y.F.; Cheng, I.F.; Nguyen, V.T. A multi-criteria decision-making (MCDM) approach using hybrid SCOR metrics, AHP, and TOPSIS for supplier evaluation and selection in the gas and oil industry. Processes 2018, 6, 252. [Google Scholar] [CrossRef] [Green Version]
- Sellitto, M.A.; Pereira, G.M.; Borchardt, M.; da Silva, R.I.; Viegas, C.V. A SCOR-based model for supply chain performance measurement: Application in the footwear industry. Int. J. Prod. Res. 2015, 53, 4917–4926. [Google Scholar] [CrossRef]
- Van Weele, A.J. Purchasing and Supply Management: Analysis, Strategy, Planning and Practice, 5th ed.; Cengage Learning: Boston, MA, USA, 2010. [Google Scholar]
- Petroni, A.; Braglia, M. Vendor Selection Using Principal Component Analysis. J. Supply Chain Manag. 2000, 36, 63–69. [Google Scholar] [CrossRef]
- Farzad, T.; Mohammad Rasid, O.; Aidy, A.; Rosnah Mohd, Y. A review of supplier selection methods in manufacturing industries. Suranaree J. Sci. Technol. 2008, 15, 201–208. [Google Scholar]
- Beil, D. Supplier Selection; Stephen, M., Ed.; Ross School of Business: Ann Arbor, MI, USA, 2009. [Google Scholar]
- Basílio, M.P.; Pereira, V.; Costa, H.G.; Santos, M.; Ghosh, A. A Systematic Review of the Applications of Multi-Criteria Decision Aid Methods (1977–2022). Electronics 2022, 11, 1720. [Google Scholar] [CrossRef]
- Lambert, D.M.; Adams, R.J.; Emmelhainz, M.A. Supplier selection criteria in the healthcare industry: A comparison of importance and performace. Int. J. Purch. Mater. Manag. 1997, 33, 16–22. [Google Scholar] [CrossRef]
- Karray, S.; Martín-Herrán, G. The impact of a store brand introduction in a supply chain with competing manufacturers: The strategic role of pricing and advertising decision timing. Int. J. Prod. Econ. 2022, 244, 108378. [Google Scholar] [CrossRef]
- O’Brien, J. Category Management in Purchasing: A Strategic Approach to Maximize Business Profitability; Kogan Page: London, UK, 2009. [Google Scholar]
- Narasimhan, R.; Talluri, S.; Mendez, D. Supplier evaluation and rationalization via data envelopment analysis: An empirical examination. J. Supply Chain Manag. 2001, 37, 28–37. [Google Scholar] [CrossRef] [Green Version]
- Li, X.; Dai, J.; Li, J.; He, J.; Liu, X.; Huang, Y.; Shen, Q. Research on the Impact of Enterprise Green Development Behavior: A Meta-Analytic Approach. Behav. Sci. 2022, 12, 35. [Google Scholar] [CrossRef]
- Zheng, H.; Li, X.; Zhu, X.; Huang, Y.; Liu, Z.; Liu, Y.; Liu, J.; Li, X.; Li, Y.; Li, C. Impact of Recycler Information Sharing on Supply Chain Performance of Construction and Demolition Waste Resource Utilization. Int. J. Environ. Res. Public Health 2022, 19, 3878. [Google Scholar] [CrossRef]
- Appolloni, A.; D’Adamo, I.; Gastaldi, M.; Yazdani, M.; Settembre-Blundo, D. Reflective backward analysis to assess the operational performance and eco-efficiency of two industrial districts. Int. J. Product. Perform. Manag. 2021; in press. [Google Scholar] [CrossRef]
- Testa, F.; Nucci, B.; Iraldo, F.; Appolloni, A.; Daddi, T. Removing obstacles to the implementation of LCA among SMEs: A collective strategy for exploiting recycled wool. J. Clean. Prod. 2017, 156, 923–931. [Google Scholar] [CrossRef]
- Handfield, R.; Walton, S.V.; Sroufe, R.; Melnyk, S.A. Applying environmental criteria to supplier assessment: A study in the application of the analytical hierarchy process. Eur. J. Oper. Res. 2002, 141, 70–87. [Google Scholar] [CrossRef]
- Lu, L.Y.Y.; Wu, C.H.; Kuo, T.-C. Environmental principles applicable to green supplier evaluation by using multi-objective decision analysis. Int. J. Prod. Res. 2007, 45, 4317–4331. [Google Scholar] [CrossRef]
- Govindan, K.; Haq, A.N.; Sasikumar, P.; Arunachalam, S. Analysis and selection of green suppliers using interpretative structural modelling and analytic hierarchy process. Int. J. Manag. Decis. Mak. 2008, 9, 163–182. [Google Scholar]
- Freeman, J.; Chen, T. Green supplier selection using an AHP-entropy-TOPSIS framework. Supply Chain Manag. Int. J. 2015, 20, 327–340. [Google Scholar] [CrossRef] [Green Version]
- Govindan, K.; Sivakumar, R. Green supplier selection and order allocation in a low-carbon paper industry: Integrated multi-criteria heterogeneous decision-making and multi-objective linear programming approaches. Ann. Oper. Res. 2015, 238, 243–276. [Google Scholar] [CrossRef]
- Uygun, Ö.; Dede, A. Performance evaluation of green supply chain management using integrated fuzzy multi-criteria decision making techniques. Comput. Ind. Eng. 2016, 102, 502–511. [Google Scholar] [CrossRef]
- Soni, G.; Kumar, S.; Mahto, R.V.; Mangla, S.K.; Mittal, M.L.; Lim, W.M. A decision-making framework for Industry 4.0 technology implementation: The case of FinTech and sustainable supply chain finance for SMEs. Technol. Forecast. Soc. Change 2022, 180, 121686. [Google Scholar] [CrossRef]
- Yadav, A.K.; Kumar, D. A fuzzy decision framework of lean-agile-green (LAG) practices for sustainable vaccine supply chain. Int. J. Product. Perform. Manag. 2022; in press. [Google Scholar] [CrossRef]
- Jankowski, M.; Borsukiewicz, A.; Szopik-Depczyńska, K.; Ioppolo, G. Determination of an optimal pinch point temperature difference interval in ORC power plant using multi-objective approach. J. Clean. Prod. 2019, 217, 798–807. [Google Scholar] [CrossRef]
- De Boer, L.; Labro, E.; Morlacchi, P. A Review of Methods Supporting Supplier Selection. Eur. J. Purch. Supply Manag. 2001, 7, 75–89. [Google Scholar] [CrossRef]
- Yildiz, A.; Yayla, A.Y. Multi-criteria decision-making methods for supplier selection: A literature review. S. Afr. J. Ind. Eng. 2015, 26, 158–177. [Google Scholar] [CrossRef] [Green Version]
- Dubey, R.; Gunasekaran, A.; Papadopoulos, T.; Childe, S.J. Green supply chain management enablers: Mixed methods research. Sustain. Prod. Consum. 2015, 4, 72–88. [Google Scholar] [CrossRef] [Green Version]
- Pamucar, D.; Torkayesh, A.E.; Biswas, S. Supplier selection in healthcare supply chain management during the COVID-19 pandemic: A novel fuzzy rough decision-making approach. Ann. Oper. Res. 2022, 1–43. [Google Scholar] [CrossRef]
- Beikkhakhian, Y.; Javanmardi, M.; Karbasian, M.; Khayambashi, B. The application of ISM model in evaluating agile suppliers selection criteria and ranking suppliers using fuzzy TOPSIS-AHP methods. Expert Syst. Appl. 2015, 42, 6224–6236. [Google Scholar] [CrossRef]
- Fülöp, J. Introduction to decision making methods. In BDEI-3 Workshop; Hungarian Academy of Sciences: Budapest, Hungary, 2005. [Google Scholar]
- Supply Chain Council (SCC). SCOR: Supply Chain Operations Reference Model Revision 11.0. Printed in the United States of America. 2012. Available online: https://docs.huihoo.com/scm/supply-chain-operations-reference-model-r11.0.pdf (accessed on 26 June 2022).
- Stephens, S. Supply chain operations reference model version 5.0: A new tool to improve supply chain efficiency and achieve best practice. Inf. Syst. Front. 2001, 3, 471–476. [Google Scholar] [CrossRef]
- Vanany, I.; Suwignjo, P.; Yulianto, D. Design of supply chain performance measurement system for lamp industry. In Proceedings of the 1st International Conference on Operations and Supply Chain Management, Bali, Indonesia, 15–17 December 2005; pp. 78–86. [Google Scholar]
- Russell, D.M.; Ruamsook, K.; Thomchick, E.A. Ethanol and the petroleum supply chain of the future: Five strategic priorities of integration. Transp. J. 2009, 48, 5–22. [Google Scholar] [CrossRef]
- Schmitz, P.M.U. The Use of Supply Chains and Supply Chain Management to Improve the Efficiency and Effectiveness of GIS Units. Ph.D. Thesis, University of Johannesburg, Johannesburg, South Africa, 2010. [Google Scholar]
- Ellram, L.M.; Tate, W.L.; Billington, C. Understanding and managing the services supply chain. J. Supply Chain Manag. 2004, 40, 17–32. [Google Scholar] [CrossRef]
- Malin, J.H.; Reichardt, E. Strengthen the six sigma portfolio. Quality 2005, 44, 40. [Google Scholar]
- Subhani, M.I.; Osman, A. Factors Affecting the Decision Making of Out-Sourcing in Textile in Pakistan. 2010. Available online: https://mpra.ub.uni-muenchen.de/27006/ (accessed on 26 June 2022).
- Lee, H.L. The triple-A supply chain. Harv. Bus. Rev. 2004, 82, 102–113. [Google Scholar]
- Vickery, S.N.; Calantone, R.; Dröge, C. Supply chain flexibility: An empirical study. J. Supply Chain Manag. 1999, 35, 16–24. [Google Scholar] [CrossRef]
- Jack, E.P.; Raturi, A. Sources of volume flexibility and their impact on performance. J. Oper. Manag. 2002, 20, 519–548. [Google Scholar] [CrossRef]
- Jammernegg, W.; Reiner, G. Performance improvement of supply chain processes by coordinated inventory and capacity management. Int. J. Prod. Econ. 2007, 108, 183–190. [Google Scholar] [CrossRef]
- Au, K.F.; Wong, M.C. Decision factors in global textile and apparel sourcing after quota elimination. Bus. Rev. 2008. [Google Scholar]
- Mentzer, J.T. Fundamentals of Supply Chain Management: Twelve Drivers of Competitive Advantage; SAGE Publications, Inc.: Thousand Oaks, CA, USA, 2004. [Google Scholar]
- Navarro, P. The economics of the “China Price”. China Perspect. 2009, 2006, 13–27. [Google Scholar] [CrossRef] [Green Version]
- Benitez, J.; Chen, Y.; Teo, T.S.; Ajamieh, A. Evolution of the impact of e-business technology on operational competence and firm profitability: A panel data investigation. Inf. Manag. 2018, 55, 120–130. [Google Scholar] [CrossRef]
- Beamon, B.M. Supply chain design and analysis: Models and methods. Int. J. Prod. Econ. 1998, 55, 281–294. [Google Scholar] [CrossRef]
- Zadeh, L.A. The concept of a linguistic variable and its application to approximate reasoning—II. Inf. Sci. 1975, 8, 301–357. [Google Scholar] [CrossRef]
- Buckley, J.J. Solving fuzzy equations in economics and finance. Fuzzy Sets Syst. 1992, 48, 289–296. [Google Scholar] [CrossRef]
- Kaufman, A.; Gupta, M.M. Introduction to Fuzzy Arithmetic; Van Nostrand Reinhold Company: New York, NY, USA, 1991. [Google Scholar]
- Zimmermann, H.J. Fuzzy set theory. Wiley Interdiscip. Rev. Comput. Stat. 2010, 2, 317–332. [Google Scholar] [CrossRef]
- Yuan, Y.; Shaw, M.J. Induction of fuzzy decision trees. Fuzzy Sets Syst. 1995, 69, 125–139. [Google Scholar] [CrossRef]
- Hwang, C.L.; Yoon, K. Methods for multiple attribute decision making. In Multiple Attribute Decision Making; Springer: Berlin/Heidelberg, Germany, 1981; pp. 58–191. [Google Scholar]
- Krohling, R.A.; Pacheco, A.G. A-TOPSIS—An approach based on TOPSIS for ranking evolutionary algorithms. Procedia Comput. Sci. 2015, 55, 308–317. [Google Scholar] [CrossRef] [Green Version]
- Pavić, Z.; Novoselac, V. Notes on TOPSIS method. Int. J. Res. Eng. Sci. 2013, 1, 5–12. [Google Scholar]
- Wątróbski, J.; Sałabun, W.; Ladorucki, G. The temporal supplier evaluation model based on multicriteria decision analysis methods. In Asian Conference on Intelligent Information and Database Systems; Springer: Cham, Switzerland, 2017; pp. 432–442. [Google Scholar]
- Palczewski, K.; Sałabun, W. The fuzzy TOPSIS applications in the last decade. Procedia Comput. Sci. 2019, 159, 2294–2303. [Google Scholar] [CrossRef]
- Shekhovtsov, A.; Kaczyńska, A.; Sałabun, W. Why Does the Choice of Normalization Technique Matter in Decision-Making. In Multiple Criteria Decision Making; Springer: Singapore, 2022; pp. 107–120. [Google Scholar]
| Author(s) | Technique | Application | Contribution |
|---|---|---|---|
| Petroni and Braglia (2000) | Multivariate statistical methods—PCA | Medium-sized manufacturer of bottling machinery and complete packaging lines | Innovative model allowing one to objectively determine the relative importance of each vendor and (ii) involve individual judgments and measures in the analysis |
| Farzad et al. (2008) | Review of several techniques (AHP) | - | Discusses advantages and disadvantages of the most-used techniques |
| Basilio-Pereira et al. (2022) | Review of different techniques—AHP, TOSIS, VIKOR, PROMETHEE, ANP | - | Discusses advantages and disadvantages of the most-used techniques |
| Weber et al. (1991) | Supplier selection criteria analysis | Healthcare industry | Overview of the issue of multicriteria techniques over more than 40 years |
| Karray and Martin-Herran (2022) | Game-theoretic model | Manufacturing sector | Sheds light on competitive interactions and contractual agreements in the manufacturing industry and the impact of store branding |
| O’Brien (2009) | Strategic category management | - | Provides a large review of best practices in purchasing category management, together with a wide review of the literature |
| Narasimhan et al. (2001) | Data envelopment analysis | Telecommunications company | Overcomes several shortcomings from other econometric and multicriterial techniques, allowing cost-effective and swift collection and organization of data |
| Li et al. (2022) | Meta-analysis | Enterprises | Identifies a set of moderators affecting green development behavior of firms (mainly tangible and intangible resources; size; region) |
| Zheng et al. (2022) | Bayesian equilibrium solution | Construction and demolition industry | New evidence on the role of information sharing in the recycling sector |
| Appolloni et al. (2022) | Data envelopment analysis | Two Spanish ceramic industrial sectors | An innovative integration of the reflective management approach with DEA-based backward analysis |
| Testa et al. (2017) | Life cycle assessment-based product environmental footprint | Recycled wool industry | Shows how SMEs can cooperate with their major stakeholders to respond to external financial pressure and that cooperation facilitates the adoption of LCA in clusters |
| Handfield et al. (2002) | Analytical hierarchy process (AHP) | A group of companies considering including environmental decisions into the supplier selection process | Integration of environmental criteria in AHP for supporting managerial decision making about supplying |
| Lu et al. (2007) | Analytical hierarchy process (AHP) | Electronic industry | Innovative method using simple and efficient procedures to evaluate the effectiveness, by using a multi-objective decision-making tool for GSC management (GSCM) |
| Govindan et al. (2008) | Interpretive structural modeling (ISM) and AHP model | Automobile company | Incorporating criteria for green supplier selection into interpretative structural modeling and analytic hierarchy process |
| Freeman and Chen (2015) | AHP–Entropy–TOPSIS framework | Electronic machinery manufacturer | Expanding potential application of AHP–Entropy/TOPSIS methodology to real-life SCM cases |
| Govindan and Sivakumar (2015) | Fuzzy TOPSIS | Low-carbon paper industry | New approach for creating a heterogeneous group decision-making model for selecting suppliers, evaluating them based on green criteria and allocating orders |
| Uygun and Dede (2016) | Fuzzy DEMATEL, fuzzy ANP and fuzzy TOPSIS | Machine manufacturing | Identifies GSCM dimensions and related criteria through a new model based on the integration of different selection techniques for evaluating GSCM performance of companies |
| Soni et al. (2022) | Hesitant fuzzy-based Industry 4.0 technology selection model | A group of SMEs | Develops a new framework to support SMEs in decision making for FinTech integration in their in their supply chains |
| Yadav and Kumar (2022) | A fuzzy decision framework of importance performance analysis (IPA)– AHP–TOPSIS | Vaccine supply chain | Novel methods for including lean-agile-green practices in vaccine supply chains |
| Jankowski et al. (2019) | Multi-objective optimization | Organic Rankine cycle power plant | Develops a novel approach which allows economic and environmental evaluation separately in the determination of the optimal pinch point temperature |
| De Boer et al. (2001) | Review of different techniques | - | - |
| Yildiz and Yayla (2015) | Review of different techniques | Different industries: electrical–electronics, automotive and others | Provides a novel guide for literature on the use of techniques in decision making |
| Dubey et al. (2015) | MICMAC analysis | Firms from 16 industries | Proposes a mixed-methods technique for the management of green supply chain at firm level |
| Pamucar et al. (2022) | Categorical-based evaluation technique (MACBETH) and a distance-based assessment method | Healthcare supply chain management | Proposes a novel methodology to face supplier selection problems, combining MACBETH and CODAS methods |
| Beikkhakhian et al. (2015) | ISM, Fuzzy TOPSIS, AHP | Industrial organizations which manufacture polyethylene products and couplings | Develops of a model which allows firms to identify the most suitable supplier and a set of variables derived from the interpretive structural model which increases efficiency and agility on behalf of the supplier |
| Main Criteria | Sub-Criteria |
|---|---|
| Reliability (A) | On time delivery A1 Geographic location a2 Delivered the right quantity A3 |
| Responsiveness (B) | Order fulfilment cycle time B1 Processing time of returns B2 |
| Flexibility(C) | Order fulfilment lead time C1 Continuous quality improvement programs C2 Certification C3 |
| Cost (D) | Freight cost D1 Processing cost of returns D2 Cost of materials D3 |
| Assets (E) | Cash-to-cash cycle time E1 Asset turns E2 Inventory value E3 |
| Linguistic Values | Fuzzy Number |
|---|---|
| Very low (VL) | (0.1, 0.1, 0.3) |
| Low (L) | (0.1, 0.3, 0.5) |
| Medium (M) | (0.3, 0.5, 0.7) |
| High (H) | (0.5, 0.7, 0.9) |
| Very high (VH) | (0.7, 0.9, 0.9) |
| DM1 | DM2 | DM3 | |||||||
|---|---|---|---|---|---|---|---|---|---|
| Criteria | S1 | S2 | S3 | S1 | S2 | S3 | S1 | S2 | S3 |
| A1 | (0.5, 0.7, 0.9) | (0.3, 0.5, 0.7) | (0.5, 0.7, 0.9) | (0.3, 0.5, 0.7) | (0.1, 0.3, 0.5) | (0.5, 0.7, 0.9) | (0.3, 0.5, 0.7) | (0.3, 0.5, 0.7) | (0.7, 0.9, 0.9) |
| A2 | (0.7, 0.9, 0.9) | (0.1, 0.3, 0.5) | (0.1, 0.1, 0.3) | (0.5, 0.7, 0.9) | (0.3, 0.5, 0.7) | (0.1, 0.1, 0.3) | (0.7, 0.9, 0.9) | (0.1, 0.3, 0.5) | (0.1, 0.3, 0.5) |
| A3 | (0.5, 0.7, 0.9) | (0.3, 0.5, 0.7) | (0.7, 0.9, 0.9) | (0.3, 0.5, 0.7) | (0.1, 0.3, 0.5) | (0.5, 0.7, 0.9) | (0.3, 0.5, 0.7) | (0.3, 0.5, 0.7) | (0.5, 0.7, 0.9) |
| B1 | (0.3, 0.5, 0.7) | (0.5, 0.7, 0.9) | (0.5, 0.7, 0.9) | (0.1, 0.3, 0.5) | (0.3, 0.5, 0.7) | (0.3, 0.5, 0.7) | (0.1, 0.1, 0.3) | (0.3, 0.5, 0.7) | (0.3, 0.5, 0.7) |
| B2 | (0.5, 0.7, 0.9) | (0.1, 0.1, 0.3) | (0.1, 0.3, 0.5) | (0.3, 0.5, 0.7) | (0.1, 0.3, 0.5) | (0.1, 0.3, 0.5) | (0.5, 0.7, 0.9) | (0.5, 0.7, 0.9) | (0.1, 0.1, 0.3) |
| C1 | (0.5, 0.7, 0.9) | (0.5, 0.7, 0.9 | (0.3, 0.5, 0.7) | (0.5, 0.7, 0.9) | (0.3, 0.5, 0.7) | (0.3, 0.5, 0.7) | (0.7, 0.9, 0.9) | (0.3, 0.5, 0.7) | (0.3, 0.5, 0.7) |
| C2 | (0.1, 0.3, 0.5) | (0.5, 0.7, 0.9) | (0.7, 0.9, 0.9) | (0.3, 0.5, 0.7) | (0.7, 0.9, 0.9) | (0.7, 0.9, 0.9) | (0.1, 0.3, 0.5) | (0.5, 0.7, 0.9) | (0.5, 0.7, 0.9) |
| C3 | (0.3, 0.5, 0.7) | (0.5, 0.7, 0.9) | (0.7, 0.9, 0.9) | (0.3, 0.5, 0.7) | (0.7, 0.9, 0.9) | (0.7, 0.9, 0.9) | (0.1, 0.3, 0.5) | (0.5, 0.7, 0.9) | (0.7, 0.9, 0.9) |
| D1 | (0.7, 0.9, 0.9) | (0.1, 0.3, 0.5) | (0.1, 0.1, 0.3) | (0.7, 0.9, 0.9) | (0.3, 0.5, 0.7) | (0.1, 0.3, 0.5) | (0.5, 0.7, 0.9) | (0.1, 0.3, 0.5) | (0.1, 0.1, 0.3) |
| D2 | (0.3, 0.5, 0.7) | (0.1, 0.3, 0.5) | (0.1, 0.3, 0.5) | (0.3, 0.5, 0.7) | (0.3, 0.5, 0.7) | (0.1, 0.3, 0.5) | (0.5, 0.7, 0.9) | (0.1, 0.3, 0.5) | (0.1, 0.3, 0.5) |
| D3 | (0.3, 0.5, 0.7) | (0.5, 0.7, 0.9) | (0.1, 0.1, 0.3) | (0.3, 0.5, 0.7) | (0.7, 0.9, 0.9) | (0.1, 0.3, 0.5) | (0.3, 0.5, 0.7) | (0.5, 0.7, 0.9) | (0.1, 0.1, 0.3) |
| E1 | (0.3, 0.5, 0.7) | (0.3, 0.5, 0.7) | (0.7, 0.9, 0.9) | (0.3, 0.5, 0.7) | (0.5, 0.7, 0.9) | (0.5, 0.7, 0.9) | (0.1, 0.3, 0.5) | (0.7, 0.9, 0.9) | (0.7, 0.9, 0.9) |
| E2 | (0.3, 0.5, 0.7) | (0.1, 0.3, 0.5) | (0.5, 0.7, 0.9) | (0.3, 0.5, 0.7) | (0.3, 0.5, 0.7) | (0.7, 0.9, 0.9) | (0.1, 0.3, 0.5) | (0.5, 0.7, 0.9) | (0.7, 0.9, 0.9) |
| E3 | (0.1, 0.3, 0.5) | (0.7, 0.9, 0.9) | (0.3, 0.5, 0.7) | (0.1, 0.3, 0.5) | (0.5, 0.7, 0.9) | (0.5, 0.7, 0.9) | (0.1, 0.1, 0.3) | (0.5, 0.7, 0.9) | (0.5, 0.7, 0.9) |
| Criteria | S1 | S2 | S3 |
|---|---|---|---|
| A1 | (0.333, 0.630, 1) | (0.111, 0.481, 0.778) | (0.556, 0.852, 1) |
| A2 | (0.556, 0.923, 1) | (0.111, 0.407, 0.778) | (0.111, 0.185, 0.556) |
| A3 | (0.333, 0.623, 1) | (0.111, 0.481, 0.778) | (0.556, 0.852, 1) |
| B1 | (0.143, 0.333, 1) | (0.111, 0.176, 0.333) | (0.111, 0.177, 0.333) |
| B2 | (0.111, 0.158, 0.333) | (0.111, 0.273, 1) | (0.2, 0.429, 1) |
| C1 | (0.556, 0.852, 1) | (0.333, 0.629, 1) | (0.333, 0.556, 0.778) |
| C2 | (0.111, 0.407, 0.778) | (0.556, 0.852, 1) | (0.556, 0.926, 1) |
| C3 | (0.111, 0.481, 0.778) | (0.556, 0.852, 1) | (0.778, 1, 1) |
| D1 | (0.111, 0.12, 0.2) | (0.143, 0.273, 1) | (0.2, 0.6, 1) |
| D2 | (0.111, 0.176, 0.333) | (0.143, 0.273, 1) | (0.2, 0.333, 1) |
| D3 | (0.143, 0.2, 0.333) | (0.111, 0.130, 0.2) | (0.2, 0.6, 1) |
| E1 | (0.143, 0.231, 1) | (0.111, 0.143, 0.333) | (0.111, 0.12, 0.2) |
| E2 | (0.143, 0.231, 1) | (0.111, 0.2, 1) | (0.111, 0.12, 0.2) |
| E3 | (0.2, 0.429, 1) | (0.111, 0.130, 0.2) | (0.111, 0.158, 0.333) |
| Criteria | S1 | S2 | S3 |
|---|---|---|---|
| A1 | (0.1667, 0.525, 0.9) | (0.056, 0.401, 0.7) | (0.278, 0.709, 0.9) |
| A2 | (0.2778, 0.709, 0.9) | (0.056, 0.312, 0.7) | (0.056, 0.142, 0.5) |
| A3 | (0.1, 0.399, 0.9) | (0.033, 0.305, 0.7) | (0.167, 0.539, 0.9) |
| B1 | (0.071, 0.278, 0.9) | (0.056, 0.147, 0.3) | (0.056, 0.147, 0.3) |
| B2 | (0.0556, 0.111, 0.3) | (0.056, 0.191, 0.9) | (0.1, 0.3, 0.9) |
| C1 | (0.389, 0.767, 0.9) | (0.233, 0.567, 0.9) | (0.23, 0.5, 0.7) |
| C2 | (0.033, 0.285, 0.7) | (0.167, 0.596, 0.9) | (0.167, 0.648, 0.9) |
| C3 | (0.033, 0.272, 0.7) | (0.167, 0.483, 0.9) | (0.233, 0.567, 0.9) |
| D1 | (0.0333, 0.076, 0.18) | (0.043, 0.173, 0.9) | (0.06, 0.38, 0.9) |
| D2 | (0.033, 0.1, 0.3) | (0.043, 0.155, 0.9) | (0.06, 0.189, 0.9) |
| D3 | (0.071, 0.167, 0.3) | (0.056, 0.109, 0.18) | (0.1, 0.5, 0.9) |
| E1 | (0.071, 0.177, 0.9) | (0.056, 0.109, 0.3) | (0.056, 0.092, 0.18) |
| E2 | (0.0423, 0.161, 0.9) | (0.033, 0.14, 0.9) | (0.033, 0.084, 0.18) |
| E3 | (0.1, 0.329, 0.9) | (0.056, 0.1, 0.18) | (0.056, 0.121, 0.3) |
| Criteria | Z+ | Z− |
|---|---|---|
| A1 | (0.278, 0.709, 0.9) | (0.056, 0.401, 0.7) |
| A2 | (0.278, 0.709, 0.9) | (0.056, 0.1412, 0.5) |
| A3 | (0.167, 0.539, 0.9) | (0.033, 0.305, 0.7) |
| B1 | (0.071, 0.278, 0.9) | (0.056, 0.147, 0.3) |
| B2 | (0.1, 0.3, 0.9) | (0.056, 0.111, 0.3) |
| C1 | (0.389, 0.767, 0.9) | (0.233, 0.5, 0.7) |
| C2 | (0.167, 0.648, 0.9) | (0.033, 0.285, 0.7) |
| C3 | (0.23, 0.5667, 0.9) | (0.033, 0.273, 0.7) |
| D1 | (0.06, 0.38, 0.9) | (0.033, 0.076, 0.18) |
| D2 | (0.06, 0.189, 0.9) | (0.033, 0.1, 0.3) |
| D3 | (0.1, 0.5, 0.9) | (0.056, 0.109, 0.18) |
| E1 | (0.071, 0.177, 0.9) | (0.056, 0.092, 0.18) |
| E2 | (0.043, 0.162, 0.9) | (0.033, 0.084, 0.18) |
| E3 | (0.1, 0.3289, 0.9) | (0.0556, 0.1, 0.18) |
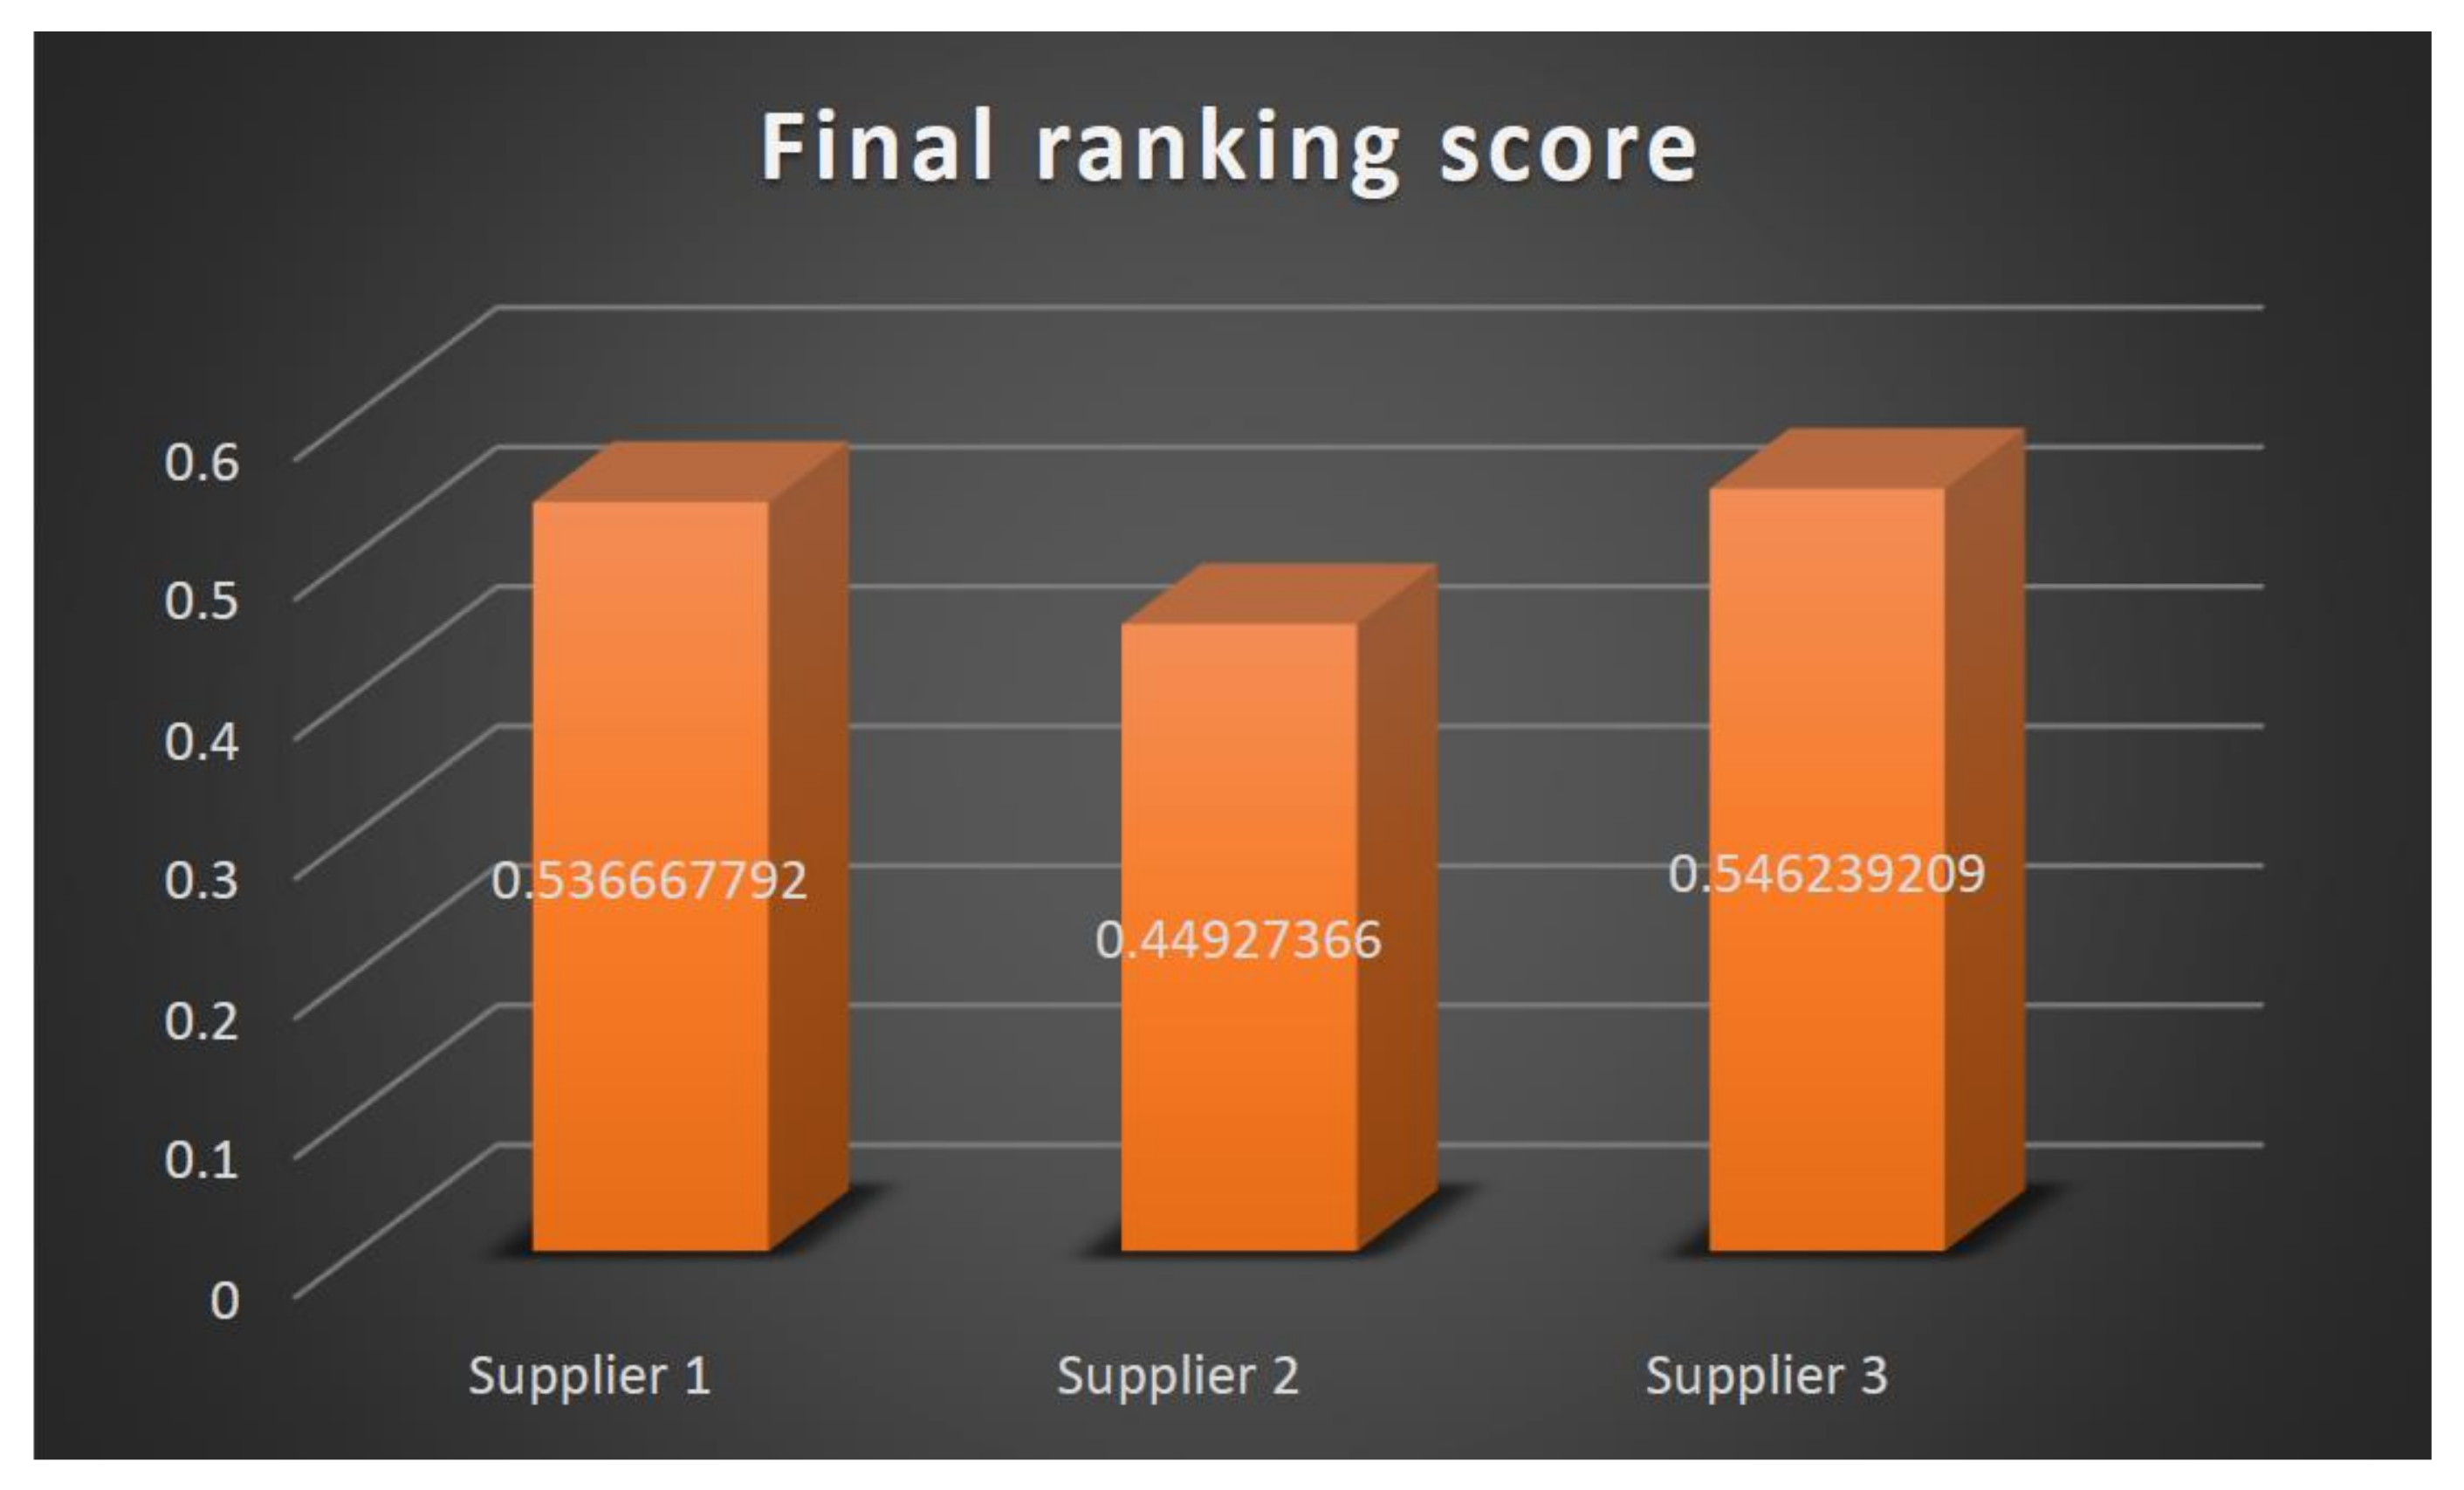
| Supplier | CCi | Ranking | ||
|---|---|---|---|---|
| S1 | 2.264 | 2.623 | 0.536 | 2 |
| S2 | 2.805 | 2.288 | 0.449 | 3 |
| S3 | 2.192 | 2.639 | 0.546 | 1 |
Publisher’s Note: MDPI stays neutral with regard to jurisdictional claims in published maps and institutional affiliations. |
© 2022 by the authors. Licensee MDPI, Basel, Switzerland. This article is an open access article distributed under the terms and conditions of the Creative Commons Attribution (CC BY) license (https://creativecommons.org/licenses/by/4.0/).
Share and Cite
Caristi, G.; Boffardi, R.; Ciliberto, C.; Arbolino, R.; Ioppolo, G. Multicriteria Approach for Supplier Selection: Evidence from a Case Study in the Fashion Industry. Sustainability 2022, 14, 8038. https://doi.org/10.3390/su14138038
Caristi G, Boffardi R, Ciliberto C, Arbolino R, Ioppolo G. Multicriteria Approach for Supplier Selection: Evidence from a Case Study in the Fashion Industry. Sustainability. 2022; 14(13):8038. https://doi.org/10.3390/su14138038
Chicago/Turabian StyleCaristi, Giuseppe, Raffaele Boffardi, Cristina Ciliberto, Roberta Arbolino, and Giuseppe Ioppolo. 2022. "Multicriteria Approach for Supplier Selection: Evidence from a Case Study in the Fashion Industry" Sustainability 14, no. 13: 8038. https://doi.org/10.3390/su14138038
APA StyleCaristi, G., Boffardi, R., Ciliberto, C., Arbolino, R., & Ioppolo, G. (2022). Multicriteria Approach for Supplier Selection: Evidence from a Case Study in the Fashion Industry. Sustainability, 14(13), 8038. https://doi.org/10.3390/su14138038