Article

Green Areas and Climate Change Adaptation in a Urban Environment: The Case Study of “Le Vallere” Park (Turin, Italy)

by
Francesco Busca
1,* and
Roberto Revelli
1,2
1
Department of Environment, Land and Infrastructure Engineering, Politecnico di Torino, 10129 Turin, Italy
2
F.U.L.L.—The Future Urban Legacy Lab, Politecnico di Torino, 10129 Turin, Italy
*
Author to whom correspondence should be addressed.
Sustainability 2022, 14(13), 8091; https://doi.org/10.3390/su14138091
Submission received: 27 May 2022 / Revised: 23 June 2022 / Accepted: 27 June 2022 / Published: 1 July 2022
(This article belongs to the Special Issue Assessing and Valuing Ecosystem Services)

Abstract

:
The balance governing the exploitation of resources on Earth is nowadays undermined by different accelerating processes, as population growth, pollution increase and, above all, climate change: the consequences on human well-being and on natural ecosystems health is incontrovertible. Hence, there is the need to undertake mitigation actions aimed at slowing down the uncontrolled development of negative effects. Within this work, the goal is to analyze the role of urban green infrastructures in the complex panorama of the climate change fight, through the ability to restore ecological functions. A quantification study of the Ecosystem Services (ES) offered by “Le Vallere” Park, a green area of about 340 thousand square meters in the Turin metropolitan area (North Italy), was conducted. The project combines the complex ES theme of urban adaptation to climate change, through i-Tree, a software suite born to evaluate the benefits provided by vegetation. Particularly, through i-Tree Hydro, the quantity and quality of runoff rainwater are analyzed considering the comparison between different scenarios: we analyze a present case (2019) and future cases (2071–2100), with reference to climate projections for Representative Concentration Pathways (RCP) 4.5 scenario (considering climate change mitigation actions) and RCP 8.5 scenario (no actions) of the COSMO-CLM regional climate model, produced by the Euro-Mediterranean Center for Climate Change (CMCC). The discussion focuses on comparing the results obtained in the different scenarios, deepening the role of a medium-sized urban green infrastructure on the surrounding environment as the climate and vegetative conditions vary.

1. Introduction

In the last decades and, specifically, in the last 70 years, the world has experienced an uncontrolled urbanization process: in 1950, the urban areas represented 30% of the entire world population, reaching 50% nowadays [1]. United Nations estimate a percentage of 65% for urban population of the world by 2050 [2] compared to only 2.4% of urban area coverage of the Earth’s surface [3] with a very high population density. Linked to the urbanization and population increase processes, the problem of air pollution has become increasingly important in the urban context, so that it has required the intervention of specific territorial regulations to avoid exceeding the pollution limits allowed in cities. This phenomenon has a negative impact from many points of view, especially on the health of the population, e.g., there is scientific evidence that indicates a correlation between the increase in cases of respiratory diseases and the health of the environment in which these people live [4]. The combustion of fossil fuels is the main cause of current air pollution, significantly increasing the concentrations of anthropogenic greenhouse gas emissions [5]. Regarding problems generated by human activity, a further connected theme is the exploitation of natural resources and, specifically, the problem of over-exploitation. With annual consumption of natural resources almost tripled in the last 50 years [6], the situation is such that the existence of many plant and animal species is threatened, with all the problems deriving from the loss and degradation of biodiversity that will ensue [7]. However, as the ecosystems are largely influenced by human footprint, the well-being of the inhabitants of these highly modified landscapes can be influenced by ecosystems in urban areas [8]. Indeed, the state of human well-being is inextricably associated with ecosystem processes [9], capable of developing the successful state of society throughout history [10]. Services and goods that ecosystems are able to supply can represent a valid strategy to slow down the negative effects produced by the processes mentioned above and to contribute to climate change adaptation. In particular, in [3] a reference on the concept of Ecosystem Services (ES) in the last century was investigated, from its birth as an abstract concept passing through its changed use up to the corresponding economic connotation.
Then, ES classifications has been carried out by other different organizations, such as the European Environment Agency (EEA) that develop the Common International Classification of Ecosystem Services (CICES) [11]. The Intergovernmental Science-Policy Platform on Biodiversity and Ecosystem Services (IPBES) has also developed its own organization of ecosystem services that defines new characteristics with respect to the Millennium Ecosystem Assessment (MA) [12], but which is largely consistent with CICES and the importance of the basic functions of ecosystem at different scales. Currently, this report constitutes the most updated documentation on the health of biodiversity and the services that ecosystems offer to mankind.
The IPBES defines all the contributions of nature to the quality of life of human beings as Nature Contributions to People (NCP), on which the classification of ES is based, distinguishing three broad groups: regulatory, material, and non-material contributions. (i) Regulatory contributions include the functional and structural aspects of organisms and ecosystems that modify the environmental conditions in which people live and regulate the generation of tangible and intangible benefits such as water purification, climate, and soil erosion regulation, etc. The regulation ES defined by MA fall largely into this category. (ii) Material contributions include substances, objects, or other material elements of nature that support the physical existence of people and the infrastructure necessary for the functioning of a company or business; they are usually physically “consumed”, e.g., when plants or animals are transformed into food, energy, or various materials. This category includes the supply ES defined in MA. Finally, (iii) non-material contributions are those that consider the indirect influence of nature on the quality of people’s cultural life. The resources that provide this type of contribution can be physically consumed during the process or preserved as a source of inspiration. Many cultural ES of MA classification fall into this category [12].
At the urban scale, a considerable role to promote quality of life and climate change adaptation is represented by urban Green Infrastructure (GI), which key providers of ES. There are several definitions to describe GI, such as the EU’s: “strategically planned network of high quality natural and semi-natural areas with over environmental features, which is designed and managed to deliver a wide range of ecosystem services and protect biodiversity in both rural and urban settings” [13]. In the urban context, several structures fall within this definition, e.g., urban green areas and parks, since “they are part of an interconnected network and are delivering multiple ecosystem services” [14]; green areas can be defined as spaces that extensively contribute “to the ecological, aesthetic or public health needs of the urban environment” [15]. They provide various ES, such as carbon sequestration, microclimate regulation, air and water quality improvement, and social well-being [1]. Types of ES and the quantity of their supply are strongly influenced by the context in which the parks themselves are located and by community uses. However, the presence of green spaces within an urban context represents one of the possible strategies to counter the greenhouse effect through sequestration and storage of carbon dioxide, carried out by plants [16]. Specifically, carbon storage consists of the process of fixing this element in plant tissues during the growth process of the tree, while carbon sequestration is the removal of carbon dioxide from the atmosphere through chlorophyll photosynthesis. Both mechanisms are proportional to the increase in leaf biomass and influenced by the growth process of plants, therefore by their rate of growth and mortality, depending on species, age, structure, and health condition of tree individuals [17]. The air matrix also benefits from the vegetation in terms of reducing noise and light pollution and thermoregulation by mitigating the Urban Heat Island (UHI) effects [18], interrupting the action of the wind and limiting climatic stress. UHI represent portions of urban land where the temperature is significantly higher than the surrounding natural and rural environment, especially at night. The climatic discomfort of urban environments derives from the overheating of the air due to heat, dust, and pollutants produced by city activities, the physical characteristics of the materials that make up the gray infrastructures, and the conformation of the city, i.e., the size and location of buildings within the urban context. In the city center, the massive presence of built-up areas and road pavements, combined with the thermal conductivity of some materials, such as reinforced concrete, result in an absorption of 10% more solar energy than a corresponding vegetated area [19]. This is a reality found in all the largest cities in the world, regardless of their extension and geographical position, the extent of which varies between 4 °C in Athens and Sydney and up to 12 °C in the metropolis of Tokyo [20]. In this context, the presence of trees is a valid mitigation action of the phenomenon as they absorb part of the visible radiation and transform it into biochemical energy through the photosynthetic process, a mechanism that determines a reduction of solar radiation incident on buildings. Furthermore, since a green mantle emits less infrared radiation than artificial materials, the presence of trees modifies the long-wave radiation exchanges between surfaces and the environment by regulating temperature variations. Green areas also act as regulation service providers of the urban hydrological cycle: through interception and storage processes by vegetation and infiltration and evapotranspiration by soil, a green space can generate a reduction in the surface water runoff produced [21]. In cities, during rainfall events, surface outflow is generally collected in the drainage system and, subsequently, in the corresponding receiving water body [22]. Many of the problems related to the management of urban runoff volumes depend on the characteristics of the land cover and use [23] and are closely linked to the uncontrolled overbuilding process that affected, more or less, all the industrialized cities of the world in the last decades. The presence of green areas in the city, fighting this process, has a beneficial effect on the quantities of water that the sewage systems must bear during extreme events. A final important benefit brought by tree populations to urban realities is the regulation of the city microclimate [24] to the extent that the plants are able to take on carbon dioxide.
For all the reason mentioned above, it results that the ES provision by urban green areas play a crucial role in strategies for dealing with climate change: mitigation and adaptation [25], contributing to the achievement of Goal 13 (Climate Action) of Agenda 2030, defined by the United Nations: “take urgent action to combat climate change and its impacts” [26]. This work aims at analyzing and quantifying ES offered by an urban greenspace in Turin (Italy), comparing the present scenario of the park at the current state with two possible future scenarios, defined in terms of temperature and precipitation by a specific climate model. The paper is divided into several sections: Section 2 presents a brief summary of the main characteristics of i-Tree tools implemented for the analysis, focusing on input and output data and on the fundamental equations; Section 3 describes the study area, together with its main input data entered into the suite; in Section 4, the main results obtained are reported; and finally, Section 5 concentrates on the discussion and conclusions drawn from the project, with a focus on its implications on the future of the green area.

2. Materials and Methods

The evaluation was carried out at a quantitative level using a specific software suite for vegetation. The suite i-Tree is a collection of analysis and assessment tools designed and developed by the United States Forest Service, part of the United States Department of Agriculture (USDA), to quantify the ES provided by a green area (i.e., street-lined, park, neighborhood, city, or an entire region). The software suite consists of a series of applications divided by: (i) core-set, composed by the flagship tools; (ii) utilities, that are additional tools for the former; (iii) research; and (iv) legacy [27].
The project is particularly focused on Hydro functionality, a flagship tool supported by Canopy. The obtained results, which will be described in Section 4, derive from the implementation of the aforementioned software, whose algorithms are based on fundamental equations and whose general characteristics are deepened in the following subsections.

2.1. i-Tree Canopy

Canopy makes a statistical estimate of the land cover (tree, grass, building, road, etc.) based on satellite images or shape files [28] and the information provided by this tool is used within the i-Tree Hydro simulation as input parameters. One of the results provided by the program concern the percentages of land cover, evaluated through a statistical analysis (see Table 1). It consists of the following steps: (i) definition of the project area by tracing boundaries on an image from Google Maps or by means of a georeferenced shapefile; (ii) entry of locality information; (iii) cover class attribution (see Table 1) to each point randomly generated by the program; and (iv) export of the report containing graphs and tables about the outputs [29].
It should be noted that for the classes relating to tree cover, the distinction between tree cover on a permeable surface (Tree-Pervious, T) and an impermeable surface (Tree-Impervious, NT) has been considered, including in NT all those cases of trees inserted in parking lots, courtyards, streets, etc.
The accuracy of the analysis depends on the user’s ability to recognize the type of coverage from aerial images; the number of sampled points is chosen arbitrarily by the user according to the desired level of accuracy, in order to minimize the related standard error.
Regarding the cover class, the program returns number of points relating to each class with the relative values (in percentage and in meter square) and their standard errors, by means of a statistical analysis based on Bernoulli process.

2.2. i-Tree Hydro

i-Tree Hydro is a flagship tool based on the urban hydrology model specific for vegetation and allows to simulate the effects of changes in tree cover at the urban level on local hydrology. In other words, it is a desktop-based program aimed at studying the hydrogeological impact of different types of coverage [30].
It is based on a hydrological topographically based model, the Urban Forest Effects (UFORE)-Hydro Model that has been developed through the Object-oriented, Topographic (OBJTOP) structure, and on algorithms which work with interception, storage, infiltration, evaporation, and runoff data. It is an easy-to-use model for researchers, urban planners, or environmental technicians, who are required to insert minimal input data [31]. The version used, on which all the model updates depend, involves the use of an urban scheme of soil-vegetation-atmosphere exchanges represented by vertical layers. Furthermore, the surface is recognized as permeable or impermeable and coverage percentage due to the presence of albedo is quantified.
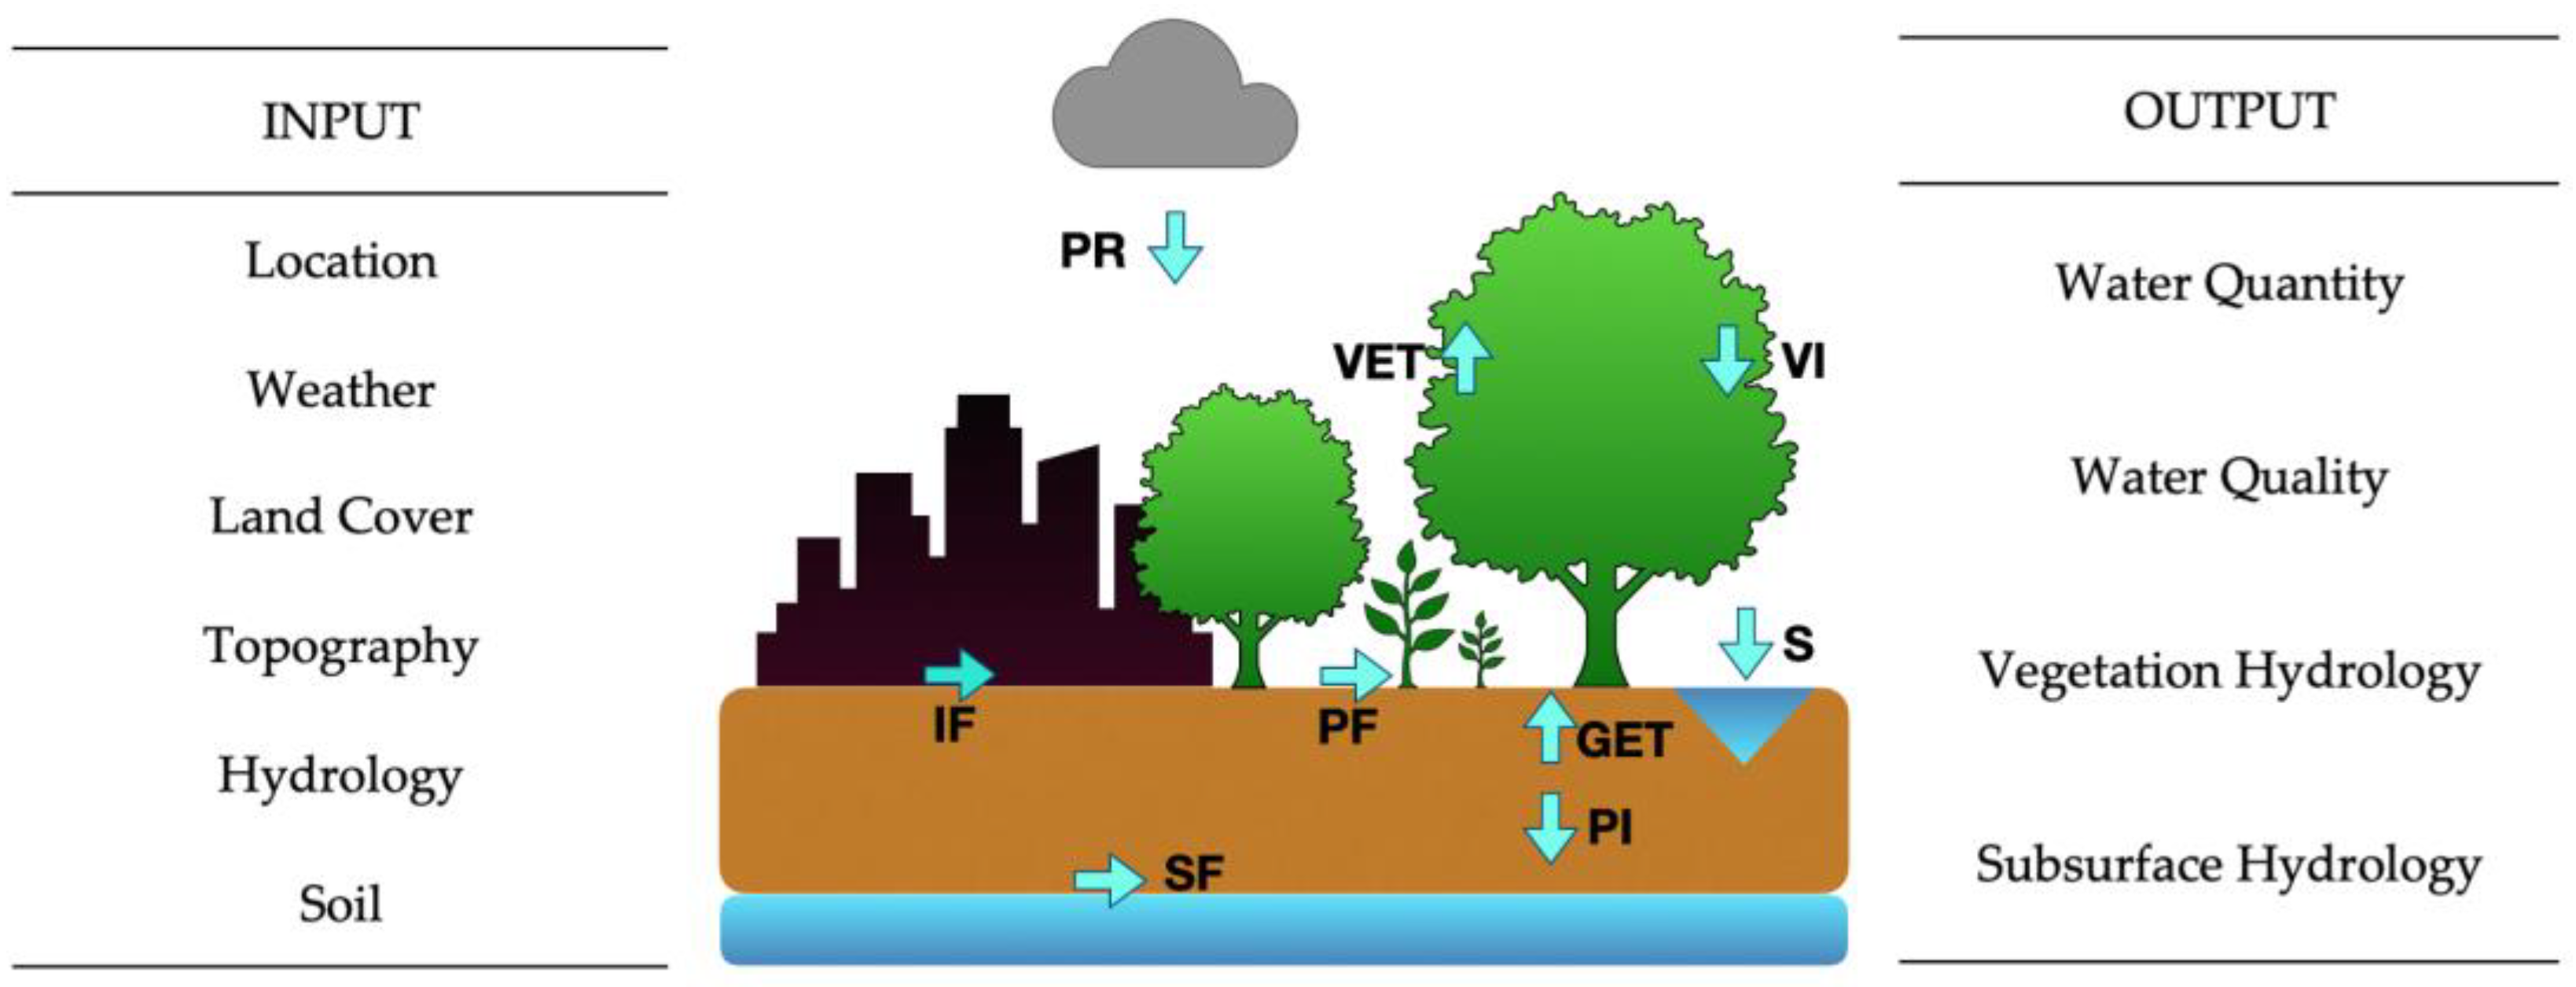
Equation (1) represents the water balance taken as model in Hydro, whose components are represented in Figure 1.
PR = VET + VI + S + PI + PF + IF + SF + GET
with [mm] as unit of measure for all terms and where PR is the precipitation; VET and GET are vegetation and soil evapotranspiration, respectively; VI is vegetation interception; S is storage in soil depressions; PI is infiltration on permeable soil; and PF, IF, and SF are permeable, impermeable, and subsurface runoff, respectively.
Figure 1 shows the five categories of input data for i-Tree Hydro: (i) Project Area information: location, area size, and time period of simulation; (ii) Weather data, uploaded manually from the nearest weather station; (iii) Land cover data, referring to the cover categories defined in i-Tree Canopy, whose results are used as input data; (iv) Elevation data, through the preparation and upload of the Digital Elevation Model (DEM) of the selected area; and finally, (v) hydrological and soil parameters, with suggested default values that can be modified to better represent the specific analysis. More detailed information about input data and, in particular, about (ii) and (v) can be found in Section 3.2 and Section 3.3.
Among land cover inputs, a fundamental parameter required is the Directly Connected Impervious Area (DCIA) defined as “the portion of waterproof area with direct hydraulic connection to the urban drainage system or to a watercourse through continuous paved surfaces, gutters, discharge or other transport and holding facilities that do not reduce the volume of outflow” [32]. The definition of DCIA therefore excludes insulated impermeable surfaces without direct connection to the sewer system, a river, or another body of water. This parameter significantly affects the outflows on impermeable surfaces as it directs the precipitation flows that fall on these roofs within the project area [30].
There are various methods to determine the DCIA: if there is not enough information, the value that can be attributed to this parameter is the one proposed by default by the program; alternatively, approximate estimates can be made based on knowledge of the site and waterproof cover, through an empirical method [33] recommended by the United States Environmental Protection Agency (USEPA) [34] which estimates the parameter as percentage, function of the type of land use, and the estimates of total impermeable surface.
Specifically, for “Le Vallere” Park (see Section 3), it was decided to apply the equation valid for “partially connected areas”, i.e., for areas in which 50% of the rainwater does not reach the urban drainage system but affects open section roads, depressions grassy, unconnected residential roofs, and partially infiltrates the ground. Since the program requires this parameter to be expressed as a fraction of the impermeable area percentage, the DCIA value to be entered is calculated as:
DCIA = 4 (%IA)0.7
where IA is the percentage of the total impermeable area. Furthermore, software requests data relating to the crown of trees and shrubs: Leaf Area Index (LAI), defined in Equation (3) as shrubs and herbaceous cover, with a particular focus on percentage of evergreen trees.
LAI = Leaf   area   ( m 2 ) Tree   canopy   ( m 2 )
LAI is a dimensionless index representing the leaf area per surface unit [35] and it is defined as the ratio between the leaf area, obtained from results by i-Tree Eco application, and the area occupied by tree canopy, assumed to be the result from i-Tree Canopy (see Section 2.2), as shown in Equation (3). i-Tree Eco is a tool of the suite aimed at providing information on the structure of urban greenery and its environmental effects on the surrounding context.
Input data required for the scenario under consideration allow i-Tree Hydro to show its hydrological impact, significantly affected by the type and distribution of land cover. Working with different scenarios, as done in this work, the software simulates the effects of changes between them on the hydrological cycle, including streamflow and water quality. Main output data are related to four categories (Figure 1), which will be further explored in Section 4, i.e., (i) Water Quantity and (ii) Water Quality as well as advanced outputs, such as (iii) Vegetation Hydrology and (iv) Subsurface Hydrology.

3. Study Area and Input Data

The project site is an urban greenspace located in Moncalieri, in the Metropolitan City of Turin (Italy, NW), which covers a surface of 47.53 square kilometers and has a population of 57,528 inhabitants. The city is 262 m above the sea level and the average temperature is 12 Celsius degrees with the warmest month in July; according to Köppen and Geiger, the climate is classified as Cfa (Humid subtropical climate).

3.1. Study Area

The study area is “Le Vallere” Park, an extensive semi-urban green space located at the confluence of the Po River and Sangone Torrent, with an extension of about 1.3 square kilometers. Nowadays, it is part of the Piedmont Po Natural Park, the protected areas along the Po River of Piedmont, one of the 20 Italian administrative regions, whose structure and composition is shown in the left-side box of Figure 2. The land use is characterized by an alternation of intensive forage crops and clearings with groves. The coexistence between agricultural landscape and public park, together with the environmental and landscape restoration interventions of the banks of the Po River, made it possible to re-establish a fundamental stretch of the ecological network of the Metropolitan Area of Turin, highlighting its importance in order to conserve biodiversity and preserve ecological functionality.
The project has been focused on a portion of the green area which covers a surface of about 340,000 square meters, in collaboration with the Management Institution of the Piedmont Po Protected Areas (Figure 2). Within the park, recreational activities are widespread: a children’s playground, sport and picnic areas, a botanical-phenological garden, and different paths for biking, walking, and horse riding. With the help of the technicians of the aforementioned institution, reliable and up-to-date technical data have been obtained, together with the integration through a measurement campaign, carried out in July 2020 in order to retrieve detailed information on tree population required by the program such as species, DBH (Diameter at Breast Height), health crown condition, land use and land cover, etc. [36].
Regarding meteorological data, Hydro simulation permitted to customize the climate information: “Torino Vallere” weather station has been selected, located inside the park and managed by the Regional Environmental Protection Agency (ARPA Piemonte), part of the Italian public administration, whose data have been integrated with datasets surveyed by the Observatory of Carlo Alberto College, Italian Metrological Society in Moncalieri, a couple of kilometers away. All meteorological data implemented refer to 2019.

3.2. Land Cover Parameters

To conduct a project with i-Tree Hydro, the first step is collecting the input data, as described in Section 2.2. Subsequently, the project requires the definition of the percentages of land cover, with respect to total surface of the project area, through the online application i-Tree Canopy, whose model has been described in Section 2.1. The shapefile created with ArcGIS containing the park boundaries has been imported: in this phase, since Turin is not among the cities already listed in the database, a reference location has been set in the US territory (almost totally loaded in the software), representative of the metropolitan city of Turin in terms of climate, altitude, and latitude: Minneapolis, in the county of Hennepin (Minnesota). This information is required as a starting point for the selection of preloaded input data and as a basis for specific model calculations.
The definition of land cover distribution was made by identifying 1300 points on the park boundaries and assigning a land cover category to each of them (see Table 1), with a corresponding standard error below 3%. The values shown in Figure 3 highlight the preponderance of permeable cover (herbaceous and tree cover, for a total of about 90%) compared to other types of soil: the impervious cover was detected only in 70 points for less than 6% of the total area, taking into account both Impervious Ground and Tree-Impervious categories. These percentages were multiplied by the total area of the park, providing the square meters of coverage belonging to each category.
In addition to the percentages of land cover defined through the Canopy application, the main additional parameters related to land cover and entered in Hydro are shown in Table 2, referring to Equations (2) and (3) of Section 2.2. DCIA value has been calculated considering IA equal to 3.77% while the Evergreen Tree Canopy and Evergreen Shrub Canopy values has been assumed equal to 10% (default value) and 0% (scarce presence of shrubs). For LAI calculation, leaf area was previously obtained with i-Tree Eco, equal to 213,300 m2. For more information, refer to [36].

3.3. Hydrological Parameters and Pollutant Coefficient

The hydrological parameters, reported in Table 3, were manually calibrated according to the hydrogeological notions that can be acquired on the project area and the available meteorological data. Default values suggested by the program were maintained for most of the parameters while, among those modified manually, it can be found the Annual Average Flow of Project Area, i.e., the average annual quantity of water that flows on the portion of the analyzed territory, was used for the calculation of various terms related to underground water flows, including soil moisture [37]. This value, starting from a default value of rainfall intensity, was calculated by inserting the average value (1.05 × 10⁻⁴ mh−1) calculated on the hourly rainfall data referring to the year 2019, obtaining the value that figures in Table 3. The values of Wetting Front Suction and Effective Porosity depend on the physical properties of the soil, i.e., the choice of the Soil Type (Sandy Loam).
The last set of parameters required by Hydro concerns the pollutant coefficients to estimate the quality of surface water. The choice of coefficients for the 10 standard water quality pollutants, reported in Table 4, is the result of a bibliographic research which, starting from the default values given by the program [38], has allowed to customize the set to the Italian [39,40] and European context [41]. The annual load of each pollutant transported by the runoff water into the urban drainage network is provided by multiplying the relative coefficient by the annual surface runoff estimated by the program.
The Biochemical Oxygen Demand (BOD) and Chemical Oxygen Demand (COD) are among the most commonly used parameters to estimate the polluting load of water as they represent an indirect measure of the organic matter content; phosphorus is usually measured in two ways: SP is the chemically active form, absorbed directly by trees, while tP also includes phosphorus in plant fragments, suspended in water; Total Kjeldahl Nitrogen (TKN) is defined as the sum of organic nitrogen and nitrogen in ammonia and in ammonium [42] present in the water outflow.

4. Results

This section presents the main results obtained in relation to the water-related ES of the park: first, the current hydrological situation of the area (Present Scenario, PS) has been analyzed, subsequently compared with two possible Future Scenarios (FS.1, FS.2). FS.1 and FS.2 differ from PS in two main aspects: (i) variations in temperature and precipitation, based on the COSMO-CLM climate model, and (ii) implementation of a planting program for new tree individuals at defined time intervals. Through the usage of i-Tree, hourly and total changes in stream flow and water quality have been quantified and illustrated.

4.1. Present Scenario (PS)

Present Scenario (PS) refers to the input data for 2019. As already explained, Hydro is a specific hydrological model for vegetation, used in the project of “Le Vallere” park, in the first instance, in order to assess the effect of vegetation on the water quantity and quality of the selected area, examining the hydrological response to varying land use, providing useful considerations for better management of natural resources, and controlling the concentrations of pollutants circulating in the urban context analyzed. Output data are organized in terms of water quality, water quantity, and advanced outputs, a category that includes an in-depth analysis on the hydrology of vegetation and substrate.

4.1.1. Water Quantity

The analysis carried out on the basis of the UFORE-Hydro mathematical model led to the quantification of the Total Flow and its partition into: (i) surface runoff on permeable soil (Pervious Flow), i.e., the flow rates deriving from the volume of water that falls on the permeable surfaces of the soil and which originates when the rainfall intensity exceeds the filtration rate and/or when the soil is saturated; (ii) runoff on impermeable soil (Impervious Flow), which originates when the height of rain exceeds the maximum level that these surfaces can contain, beyond which rainfall is totally transformed into surface runoff; and (iii) subsurface outflow (Base Flow), powered by filtration through soil porosity, depending on the soil transmissivity, the soil average slope, and the soil water content if the soil is not saturated.
Table 5 highlights the predominance of Pervious Flow (about 99%) in PS that annually flow to the urban drainage system and the adjacent water bodies (see Section 3.1), with just 1500 cubic meters of outflow which come from waterproof surfaces. In this regard, it is evident how the results are connected to the distribution of the ground cover and, specifically, to the low value of the equivalent impermeable ground (less than 6%, see Section 3.2). The quantity relating to the Base Flow is significantly lower than the surface outflows, considering the characteristic slow response of the base flows.

4.1.2. Water Quality

The quality of surface water runoff of “Le Vallere” park has been examined by estimating the load of the 10 characteristic pollutants, whose coefficients have been reported in Table 4. These indicators permit to know with a good approximation the pollution state of the runoff water: Table 6 shows the main results for PS in the first row, in which there is a clear prevalence of TSS, BOD, and COD (so-called primary pollutants), whose values are greater than the others (secondary pollutants) by at least two orders of magnitude; this is linked to the pollutant coefficients choice made in the input data phase, based on different analysis on the surface runoff in a similar context (refer to Section 3.3).
These data will be proposed again in Section 4.3.2 and compared with the state of water pollution of FS.1 and FS.2.

4.1.3. Advanced Outputs

Since Hydro is a specific hydrological model for vegetation, there is a further advanced output section relating to the hydrology of the vegetation and subsurface, working on a tree-scale water balance. Vegetation Hydrology includes all the processes that prevent the formation of surface runoff at the beginning of the meteoric event, i.e., interception by leaf cover (Interception by vegetation) and accumulation by leaves and barks (Storage on vegetation surface), evaporation from the leaf apparatus of the tree (Evaporation from vegetation), and throughfall of water on the ground once the maximum storage capacity of the canopy has been reached (Throughfall from Vegetation); Figure 4 shows the monthly trend of such components (bar chart), compared to the accumulated monthly rainfall (line chart) for 2019 (PS). The quantities of the four components have ranged between 102 and 104 cubic meters per month, varying within the reference year (2019).
The influence of the monthly rainfall distribution has been particularly evident on two components (Storage on vegetation surface, Figure 4c, and Throughfall from vegetation, Figure 4d) while there did not seem to be a continuous correlation with the phenomena of Interception by vegetation (Figure 4a) and Evaporation from vegetation (Figure 4b), especially in autumn, close to October and November. Volumes of intercepted water in October and November (about 600 m3) and December (about 350 m3) were evidently smaller than in the spring and summer months, despite a more abundant monthly precipitation (peak in November with more than 250 mm); this phenomenon depends on the seasonal characteristics of trees, whose leaves, except for evergreen plants, represent the main accumulator of intercepted rain. Regarding Figure 4b, the monthly trend within 2019 can be explained through the intrinsic link between the evaporative process and the climatic conditions of the area (temperature, relative humidity); in the last quarter of the year, the amount of evaporated volumes (about 1600 m3) has been significantly lower than in the third quarter (3250 m3 from July to September), although the cumulative quarterly rain has been greater (about 420 mm in the last quarter, against 290 mm in the third one).
In absolute terms, components with the largest annual volume are Throughfall from vegetation (about 280,000 cubic meters), followed by Storage on vegetation surface (about 140,000 cubic meters), whose peaks tend to be concentrated in the months of greater rainfall. The simulation carried out has highlighted a strong relationship between processes occurring at the canopy level, the characteristics of rain events, and the seasonal period, without a direct coincidence of the monthly rainfall peak with peaks of the different components analyzed. This topic has been further explored in Section 4.3.3., comparing the results of Vegetation Hydrology obtained for PS with those relating to the hypothesized future scenarios.

4.2. Future Scenarios (FS)

With a view to future climate change affecting the whole planet and, consequently, the study area, two future scenarios have been selected to be compared with PS, which represent two different conditions that may occur.
Specifically, the Representative Concentration Pathways (RCP) 4.5 and 8.5 have been taken as reference, which are greenhouse gas concentration trajectories adopted by the Intergovernmental Panel on Climate Change (IPCC) based on possible future range of radiative forcing values and respectively represent the scenario with significant mitigation actions which provide for a stabilization of the CO2 concentration in the atmosphere after the middle of the current century (4.5 Wm−2, intermediate case) and the scenario in which no initiative to reduce the effects of climate change will be undertaken (8.5 Wm−2, worst case). The attention has been focused on two of the indicators highlighted by IPCC as most significant for future climate projections in the Mediterranean area, i.e., the rise in temperatures and the reduction of annual rainfall. The work has been conducted referring to the data reported in [43,44], based on the high resolution simulations of the regional climatic model COSMO-CLM [45], produced by the Euro-Mediterranean Center on Climate Change (CMCC), considering the thirty years period 2071–2100 for the emission scenarios RCP4.5 (so-called Future Scenario 1, FS.1) and RCP8.5 (so-called Future Scenario 2, FS.2). For FS.1, as defined, a mitigation action has been considered, i.e., a future planting program up to the selected period (2071–2100), developed in agreement with the technicians of the management institution of the park in order to adapt the conditions to the future changes. It has been made possible by the implementation of Forecast, a i-Tree Eco component based on growth and mortality rates of trees and deepened in Section 4.2.3.

4.2.1. Temperature Variation

The future temperature projections have been assessed by taking into consideration the increases in seasonal average temperature (national average) referring to the 2071–2100 time period compared to the 1971–2000 period [44]. These values have been adapted to the Turin context assuming an increase in the average temperature for the thirty years considered equal to +3.3 °C for the RCP4.5 Scenario and +6.0 °C for the RCP8.5 Scenario [43]. More specifically, according to the increase in the national seasonal average temperatures and to the annual increase in average temperature for Turin, expected for the 2071–2100 period, the future seasonal trend for the city of Turin has been calculated. Table 7 shows the national seasonal temperature trend for the 2071–2100 period [44] and the estimated average seasonal increase for Turin. The values show a more marked increased trend for Turin in all seasons compared to the Italian context, with an average annual increase of 2.47 °C in Italy and 3.30 °C in Turin estimated for the RCP4.5 scenario and 4.45 °C in Italy and 6.00 °C in Turin for RCP8.5.
Based on these previsions, data had to be processed in hourly series for the implementation in i-Tree Hydro, referring to a representative year for the 2071–2100 period. Firstly, the monthly values of the series relating to 2019 have been increased by the quantities obtained for the respective seasonal periods referring to the Turin context; then, for each month considered, the hourly data for 2019, used as input data in PS, have been increased by the quantities of the corresponding month. Figure 5 shows the estimated trends of the annual temperature for FS.1 and FS.2 according to the two emission scenarios, compared with PS.
The monthly temperature values for the three scenarios considered, from which Figure 5 has been obtained, are reported in Appendix A (Table A1).

4.2.2. Precipitation Variation

The future rainfall projections have been assessed by taking into consideration the total annual and monthly cumulative values estimates for 2071–2100 [43] relating to both future scenarios. In addition to a reduction in the total annual amount of rainfall, the simulation has also considered a decrease in the number of rainy days; conventionally, a rainy day is defined as a day in which the rain gauge records a value greater than 1 mm. In Table 8, a summary of the estimated values can be found, which have been used to derive the trend of future rainfall for the reference time period, in the two different scenarios considered.
To obtain the estimated hourly rainfall distribution for each Future Scenario FS.x, the following methodology has been adopted: (i) The hourly rainfall data recorded by the “Torino-Vallere” weather station for 2019 have been grouped daily; (ii) According to the daily values, the number of rainy days has been reduced, following the values shown in Table 8. The choice of the days to be eliminated, for which the amount of precipitation has been set equal to zero, has been randomly made among those days with an amount of rain less than 5 mm. The choice of eliminating rainy days characterized by a precipitation amount between 1 mm and 5 mm is consistent with future projections about the tendency of meteoric events to increase in intensity and decreasing in number; (iii) The new daily rainfall values have been summed up in order to obtain the cumulative precipitation for the whole year, called PnewPS,x; (iv) Since the annual precipitation value recorded for PS (PPS), equal to 914.5 mm (2019), must be kept unchanged, the remaining rainy days, i.e., those not previously eliminated, have been multiplied by the index iPS,x (Equation (4)).
i PS , x = P PS P newPS , x
This methodology has led to new series of daily data, according to the reduction of rainy days foreseen for each FS.x. Then, starting from the monthly precipitation values estimated for FS.x [44] and listed in Table 9, it has been proceeded to obtain the final estimated hourly-based rainfall distribution.
(v) Daily rainfall values of “new PS.x” have been grouped on a monthly basis; (vi) For each n-month, a new index (Equation (5)) has been created to adapt rainfall values of “new PS.x” to the monthly amounts of FS.x (Table 9); (vii) Finally, for each n-month, hourly rainfall amounts for “PS” have been multiplied by the relative index in,FS.x.
i n , FS . x = P n ,   FS . x P n ,   new   PS . x
This led to new series of hourly rainfall data for a complete representative year for the 2071–2100 period, relating to both FS.1 (x = 1) and FS.2 (x = 2), ready to be processed in i-Tree Hydro.
Parameters requested as input relating to land cover have been kept unchanged; the Annual Average Flow of Project Area (reference in Table 3) flowing from the portion of the territory examined has been changed depending on the variation on annual rainfall forecasts for the two future scenarios considered. More specifically, the simulations conducted for the 2071–2100 period have considered a value equal to 9.821 × 10⁻³ m3 s−1 and 8.446 × 10⁻³ m3 s−1 for the RCP4.5 and RCP8.5 scenarios, respectively, compared to a value of 9.986 × 10⁻³ m3 s−1 for 2019.

4.2.3. Mitigation Action

In order to be consistent with the definition of the RCP4.5 scenario, contemplating future actions to mitigate climate change effects, a detailed future arboreal management program has been considered, according to the management institution of the area: it has included both maintenance of current tree population and a new planting program and it has been implemented through the use of Forecast, a supplementary tool of i-Tree Eco that allows future forecasts to be made both on the structure composition of an urban forest and on the removal of pollutants. This tool has required to assign a value to the following variables: (i) number of years of the forecast; (ii) number of days per year with temperatures above 0 °C; and (iii) annual death rate of plants defined as a function of their health condition. The number of years of the forecast has been assumed to be 65, considering 2085 as reference for 2071–2100 period starting from 2020, the first year after the current year of the analysis. The number of days per year with temperatures higher than 0 °C has been obtained by difference starting from the number of frost days [43]. Finally, the mortality rates of plants, assumed equal to 0.50% for healthy trees (corresponding to a dieback condition of 0–49%), 10.30% for sick trees (50–74% dieback), and 50% for dying trees (75–99% dieback), have been selected together with the park management institution and confirmed by literature data [46].
The following Planting Program (PP) has been assumed in FS.1, without any specifics on tree species allowed by Forecast:
  • Planting of 170 trees during the second year of simulation, compensating for the felling of plants located within the site area envisaged as part of the bank defenses and recalibration project of the Po River;
  • Planting of 33 trees during the third year of the simulation, compensating for the loss of the tree-lined path within the same site area under construction;
  • Planting of 20 trees per year starting from the fourth year of the simulation for 61 years with the goal of preserving the current structure of the park over time.
In order to make some comparisons between FS.1 and the RCP4.5 scenario counting only for temperature and precipitation variation, and not for the PP, a new scenario has been created and called FS.1b, remembering that land cover parameters of PS have been attributed to FS.1b. The number of trees expected for the FS.1 obtained from Forecast implementation has been used to estimate the new land cover distribution and LAI, whose values have been reported in Table 10, where it could be highlighted that the percentage of permeable soil covered by trees crown (Tree-Pervious) has almost doubled following the PP implementation, consequently causing the reduction of the other land cover categories. Herbaceous cover has undergone an almost 50% decrease, having been largely replaced by the crowns of new trees planted; for Soil-Bare Ground cover, a 2% reduction has been assumed, considering the future ground grassing of the embankment under construction; finally, Impervious Ground decreased by 1% and led to a variation of DCIA (calculated as in Section 2.2).
Similar to the analysis of results relating to PS (Section 4.1), the discussion of outputs has been articulated according to the different output categories of i-Tree Hydro. It should be noted that this comparison has been performed to show the variation in land cover input data depending on PP, but the scenario associated with RCP4.5 will remain FS.1 in the discussion of outputs.

4.3. Outputs Comparison

4.3.1. Water Quantity

This subsubsection analyzes the comparison of water outflows generated in “Le Vallere” park over a whole year of the three different scenarios, both in total terms (Total flow) and in its components (Base flow, Pervious runoff, and Impervious runoff). Table 5 shows Water Quantity comparison, highlighting the differences (Δ) in absolute terms of FS.1 and FS.2 compared to the original scenario PS.
The comparison has underlined a general decrease in the Total flow quantities as rainfall has decreased, with a more marked reduction for the FS.2, characterized by lower annual precipitation values. The main differences between the two future scenarios concern the distribution of the total outflow into its three components: for FS.2, the percentages of the three components have remained almost unchanged compared to PS, while in FS.1 Pervious runoff and Impervious runoff components moved respectively from 98.9% and 0.7% for PS to 99.1% and 0.5%. This outflow variation on permeable and impermeable ground is due to the modification of land cover parameters involved in FS.1 (Section 4.2.3), depending on the planting program adopted.

4.3.2. Water Quality

Generally, Water Quality outputs have shown an overall reduction trend for all the pollutants considered (Figure 6) for both future scenarios, more marked for FS.2 (16% reduction) than for FS.1 (7% reduction). Firstly, the reduction for FS.2 is consistent with the reduction of Water Quantity outputs, induced by the decrease in annual rainfall estimates and particularly with the reduction of surface water runoff (about 183,000 for FS.2) compared to PS (about 218,000 cubic meters). Instead, for FS.1, the reduction of the polluting load (6%) has not been precisely proportional with the decrease in the total flow generated annually, equal to approximately 208,000 cubic meters, corresponding to a reduction of about 4% compared to PS, Meanwhile, for FS.2 corresponding to the RCP8.5 scenario (worst case), the same pollutant coefficients of PS have been maintained (Table 4); for FS.1, the coefficients of TSS and secondary pollutants have been reduced by 5% and 10%, respectively, assuming an improvement in the pollution conditions of a scenario characterized by the implementation of various mitigation actions against climate change. The reduction of TSS has been studied considering human pollution and soil erosion, mitigated within RCP4.5 scenario, among the main causes of this pollutant while the choice of reducing the coefficients of the secondary pollutants has been dictated by the corresponding decrease of air pollutants [36].
In Figure 6, pollutant estimates have been subdivided into primary (Figure 6a) and secondary pollutants (Figure 6b) according to the different order of magnitude of concentration between the two groups.

4.3.3. Advanced Outputs

After the discussion on the monthly trend of the four components of Vegetation Hydrology (Figure 4) for PS, the comparison with FS.1 and FS.2 has been reported in total annual terms, as in Figure 7, considering that the monthly distribution varies according to the rainfall trend within the year, which is different for each considered scenario.
First of all, it is evident how the two future scenarios have shown variations of opposite sign with respect to PS: a tendency of increase of all hydrological components has turned out in FS.1 while FS.2 has been characterized by a general decrease; if such result was predictable for FS.2, associated with an expected annual precipitation value less than 15% (see Table 8) compared to the PS one, further investigation is required for FS.1. Despite the fact that this scenario is also characterized by a decrease in annual rainfall (1.5%), all the hydrological quantities considered have been found to be greater than those for PS. This phenomenon highlights the predominant influence of the planting program introduced in FS.1 as a climate change mitigation action, which significantly has affected the hydrological mechanisms linked to the vegetation: the greatest increase in percentage terms (about 50%) has been recorded for Storage on Vegetation Surfaces, a component particularly influenced by the variation in the land cover distribution of the area and, specifically, by the rise in tree cover which has corresponded to a considerable increase in the total leaf surface (Table 10).
A further result generated by Hydro regarding “Le Vallere” park has been that relating to Subsurface Hydrology, i.e., the hydrological components concerning the subsurface. The quantities relating to this output depend directly on Vegetation Hydrology and, in particular, on the quantity of Throughfall from vegetation: the two hydrological components considered have been Infiltration into subsurface zones and Evapotranspiration from root zone.
Figure 8 shows the comparison between PS, FS.1, and FS.2 for the two aforementioned components, directly grouped in total annual cumulative values.
In general, as already obtained for the Vegetation Hydrology components, FS.1 has been characterized by a slight incremental trend (about 4%) for both components) compared to PS, while the decrease in FS.2 has been more substantial: both hydrological components underwent a reduction of 13% for infiltration and 10% for evapotranspiration. In this regard, the determining factors have been annual cumulative precipitation and land cover distribution, both of which vary among PS, FS.1, and FS.2, as it has already been highlighted above. In particular, the greatest influence on FS.2 Subsurface Hydrology trend can be attributed to the estimated annual amount of precipitation, characterized by a 15% reduction compared to PS; for FS.1, both factors have been important, as the small increase undergone by Infiltration into subsurface zones and Evapotranspiration from root zone were affected by both the almost imperceptible reduction in annual precipitation expected for FS.1 (about 1.5%) and the increase in tree cover on land cover distribution (by about 30%).

5. Discussion and Conclusions

This work is part of a project of ES quantification of the urban area of Turin, one of the most relevant Italian cities, and particularly it is focused on a green area of about 340,000 square meters: “Le Vallere” park is able to generate important environmental benefits, some of which pertain to the park’s hydraulic and soil hydrological fields and which have been explored in this article.
The discussion has been developed from the analysis of the results provided by 
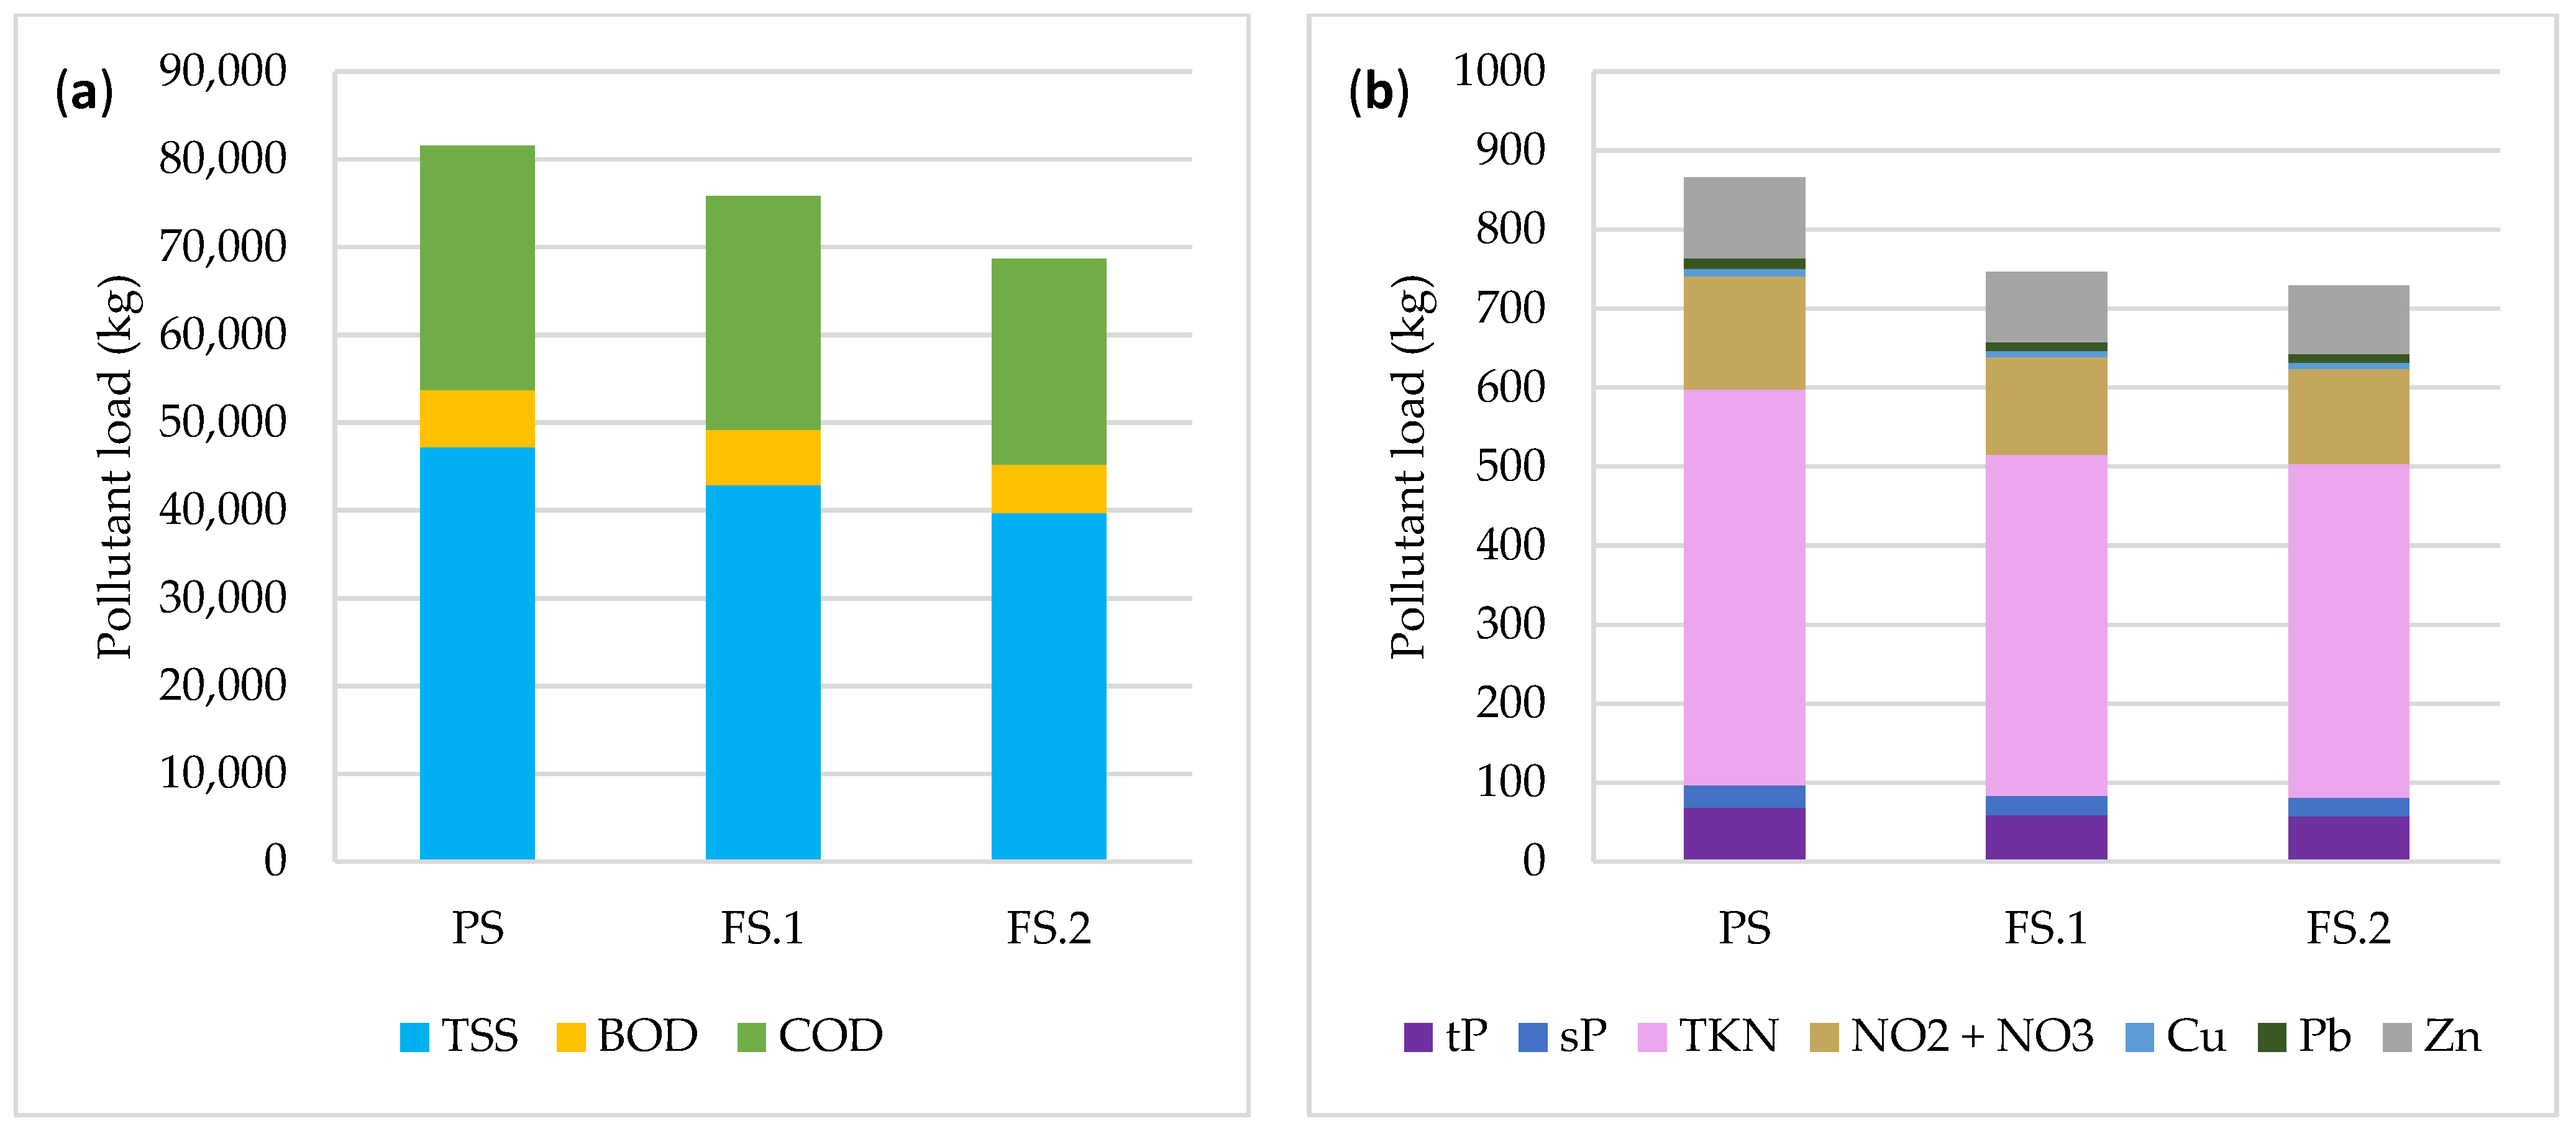
i-Tree Hydro in relation to the Present Scenario (PS), characterizing the green area with reference to 2019, a year prior to that of the study. The outputs described the quantitative and qualitative characteristics of the water runoff generated by the green area as a function of the distribution of annual rainfall, highlighting a predominant contribution of the surface runoff generated by the permeable surfaces due to soil saturation or by exceeding the filtration rate, on the total flow (about 220,000 cubic meters), with a polluting load mainly dominated by TSS, BOD, and COD, underlining the strong organic composition of the soil. More specifically, the advanced outputs about hydrology of vegetation have shown the volumes and distribution of the hydrological components within the year considered, with a trend not always consistent with the rainfall distribution over the year, revealing the complexity of the vegetation interception/absorption/evaporation phenomena as a function of climatic conditions. In general, the PS results revealed a hydrological situation significantly influenced by vegetation, as confirmed by Vegetation Hydrology outputs, contributing to the “avoided surface runoff”, a crucial ES in a floodable urban area, adjacent to the confluence of two watercourses. These results are consistent with the findings of those of previous studies, such as [47], where the reduction capacity of green infrastructure on storm water runoff was investigated with a focus on urban hydrological processes. Furthermore, refer to [48] for any comparisons with other case studies, where different examples implementing i-Tree Hydro are reported and grouped in terms of country and type of application.
Subsequently, with a view to sustainable development of the area, aimed at including the delicate issue of climate change, PS has been compared with Future Scenarios 1 and 2 (FS.1 and FS.2), outlined in coherence with COSMO-CLM regional climate model in relation to the RCP4.5 and RCP8.5 emission scenarios, respectively, in order to evaluate their impact on the management of water-related ES. The choice of two very different scenarios in terms of climate change mitigation has been made to compare them to the current quantification at the time of the study and to obtain a range of possible future results within which the park will presumably be in the 2071–2100 period, as similarly shown is the results pointed out in [49]. In general, it can be highlighted a general improvement trend associated with FS.1, which took into account mitigating actions (such as the planting program drawn up in collaboration with the relevant park management institution): the increase in tree cover and, consequently, the increase in the total leaf area associated with a variation of the meteorological conditions, according to RCP4.5 emission scenario produced by the CMCC, caused a significant increase in the hydrological components of vegetation and soil, contributing to the reduction of the surface water outflows generating by the park on the surrounding environment. In FS.2, at Water Quantity level, the reduction in water flow has also been evident, but this was due to the reduction in annual precipitation expected for the associated emission scenario, while the contribution given by the vegetation (interception, storage, and evaporation) has been particularly low, considering the absence of mitigating actions and a significant expected increase in temperature.
The results produced by this study should be considered in future territorial planning, firstly by the management institution of the green area, part of the Piedmont Po Protected Areas, with which the project has been developed; outputs and considerations derived from this study could be also useful to the environment and greenery section of the Municipality of Moncalieri and Turin within future plans adopted for urban adaptation to climate change. The use of a single climate model as a reference for considering climatic variations in the selected future period represents a limiting factor: greater completeness could be achieved if different climate models were considered, in order to obtain a more robust range of results within which to place the future hydrological situation of the park, as a provider of Urban Ecosystem Services. Finally, being that the project is strongly based on meteorological data, the next step is to investigate the UHI issue, through the usage of software capable of quantifying the ability of the aforementioned green area to reduce this effect in the urban context in which it is located.

Author Contributions

F.B.: conceptualization, data curation, investigation, methodology, software, writing—original draft preparation; R.R.: formal analysis, resources, project administration, supervision, validation, visualization, writing—review and editing. All authors have read and agreed to the published version of the manuscript.

Funding

This research received no external funding.

Institutional Review Board Statement

Not applicable.

Informed Consent Statement

Not applicable.

Data Availability Statement

Publicly available datasets were analyzed in this study. This data can be found here: [http://www.comune.torino.it/ambiente/cambiamenti_climatici/cosa-puoi-fare-tu-5.shtml (accessed on 15 March 2022)].

Acknowledgments

The study was carried out in collaboration with the Ente di gestione delle aree protette del Po torinese, now part of the Ente di gestione delle aree protette del Po piemontese, in particular with Manuela Genesio and Roberto Damilano. The authors also thank Arpa Piemonte for essential data sharing and Ilaria Tinivella for her fundamental contribution.

Conflicts of Interest

The authors declare no conflict of interest.

Abbreviation

ARPARegional Environmental Protection Agency
CICESCommon International Classification of Ecosystem Services
CMCCEuro-Mediterranean Center for Climate Change
DCIADirectly Connected Impervious Area
DEMDigital Elevation Model
EEAEuropean Environment Agency
ESEcosystem Services
FS.1Future Scenario 1
FS.2Future Scenario 2
GIGreen Infrastructure
IPBESIntergovernmental Science-Policy Platform on Biodiversity and Ecosystem Services
IPCCIntergovernmental Panel on Climate Change
LAILeaf Area Index
MAMillennium Ecosystem Assessment
NCPNature Contributions to People
OBJTOPObject-oriented, Topographic
PPPlanting Program
PSPresent Scenario
RCPRepresentative Concentration Pathways
UFOREUrban Forest Effects
UHIUrban Heat Island
USDAUnited States Department of Agriculture
USEPAUnited States Environmental Protection Agency

Appendix A

Table A1. Monthly average temperatures (°C) for PS and those estimated for a hypothetical year in 2071–2100 period for FS.1 and FS.2.
MonthPSFS.1FS.2
January1.744.677.13
February5.047.9710.43
March10.7713.5715.89
April12.6015.4017.72
May15.4518.2520.57
June23.2627.3930.81
July25.1728.5032.72
August23.7527.0531.30
September19.0222.3524.95
October14.7918.1220.72
November8.0911.4314.03
December5.468.3910.85

References

  1. Mexia, T.; Vieira, J.; Príncipe, A.; Anjos, A.; Silva, P.; Lopes, N.; Freitas, C.; Santo-Reis, M.; Correia, O.; Branquinho, C.; et al. Ecosystem Services: Urban parks under a magnifying glass. Environ. Res. 2018, 160, 469–478. [Google Scholar] [CrossRef] [PubMed]
  2. United Nations. Yearbook of the United Nations, 2014; United Nations Department of Global Communications: New York, NY, USA, 2019; p. 68. [Google Scholar]
  3. Millennium Ecosystem Assessment. Ecosystems and Human Well-Being: Synthesis; Island Press: Washington, DC, USA, 2005. [Google Scholar]
  4. Urrutia-Pereira, M.; Guidos-Fogelbach, G.; Solé, D. Climate changes, air pollution and allergic diseases in childhood and adolescence. J. Pediatr. 2021, 98, S47–S54. [Google Scholar] [CrossRef] [PubMed]
  5. Siddik, M.; Islam, M.; Zaman, A.; Hasan, M. Current Status and Correlation of Fossil Fuels Consumption and Greenhouse Gas Emissions. Int. J. Energy Environ. Econ. 2021, 28, 103–119. [Google Scholar]
  6. United Nations Environment Programme. Making Peace with Nature: A Scientific Blueprint to Tackle the Climate, Biodiversity and Pollution Emergencies. Nairobi. 2021. Available online: https://www.unep.org/resources/making-peace-nature (accessed on 10 January 2022).
  7. Reynolds, J.; Peres, C. Overexploitation. In Principles of Conservation Biology, 3rd ed.; Sinauer: Sunderland, MA, USA, 2006; pp. 253–291. [Google Scholar]
  8. Chiabai, A.; Quiroga, S.; Martinez-Juarez, P.; Higgins, S.; Taylor, T. The nexus between climate change, ecosystem services and human health: Towards a conceptual framework. Sci. Total Environ. 2018, 635, 1191–1204. [Google Scholar] [CrossRef]
  9. Butler, C. Chapter 3—Ecosystems and human well-being. In Ecosystems and Human Well-Being: A Framework for Assessment; Island Press: Washington, DC, USA, 2003. [Google Scholar]
  10. Littlefield, C.; Nelson, E.; Dittbrenner, B.; Withey, J.; Arkema, K.; Lawler, J. Ecosystem-based adaptation. In Biodiversity and Climate Change: Transforming the Biosphere; Lovejoy, T.E., Hannah, L., Eds.; Yale University Press: New Haven, CT, USA, 2019; Chapter 23; pp. 305–317. [Google Scholar]
  11. Haines-Young, R.; Potschin, M.B. Common International Classification of Ecosystem Services (CICES) V5.1 and Guidance on the Application of the Revised Structure; 2018. Available online: https://cices.eu/ (accessed on 22 February 2022).
  12. Diaz, S.; Pascual, U.; Stenseke, M.; Martín-López, B.; Watson, R.; Molnár, Z.; Hill, R.; Chan, K.; Baste, I.; Bruman, K.; et al. Assessing nature’s contributions to people. Science 2018, 359, 270–272. [Google Scholar] [CrossRef] [Green Version]
  13. European Commission. Directorate-General for Environment. Building a Green Infrastructure for Europe. Publications Office. 2014. Available online: https://data.europa.eu/doi/10.2779/54125 (accessed on 15 February 2022).
  14. Gómez-Villarino, M.T.; Gómez-Villarino, M.; Ruiz-Garcia, L. Implementation of Urban Green Infrastructures in Peri-Urban Areas: A Case Study of Climate Change Mitigation in Madrid. Agronomy 2021, 11, 31. [Google Scholar] [CrossRef]
  15. Taylor, L.; Hochuli, D.F. Defining greenspace: Multiple uses across multiple disciplines. Landsc. Urban Plan. 2017, 158, 25–38. [Google Scholar] [CrossRef] [Green Version]
  16. Locatelli, B. Ecosystem services and climate change. In Routledge Handbook of Ecosystem Services; Potschin, M., Haines-Young, R., Fish, R., Turner, R.K., Eds.; Routledge: London, UK; New York, NY, USA, 2016; pp. 481–490. [Google Scholar]
  17. Hinge, G.; Surampalli, R.; Goyal, M. Sustainability of Carbon Storage and Sequestration. In Sustainability: Fundamentals and Application; Wiley: New York, NY, USA, 2020; Volume 22, pp. 465–482. [Google Scholar]
  18. Kim, H.; Gu, D.; Kim, H. Effects of Urban Heat Island Mitigation in Various Climate Zones in the United States. Sustain. Cities Soc. 2018, 41, 841–852. [Google Scholar] [CrossRef]
  19. Rospi, G.; Negro, E.; Cardinale, T.; Cardinale, N. Microclimate of territory of Matera and the heat island effect. In Proceedings of the Climamed 2017—Mediterranean Conference of HVAC. Historical Buildings Retrofit in the Mediterranean Area, Matera, Italy, 12–13 May 2017. [Google Scholar]
  20. NCC (Natural Capital Committee). Third Report on the State of Natural Capital in Italy. Rome, Italy. 2019. Available online: https://www.mite.gov.it/pagina/terzo-rapporto-sullo-stato-del-capitale-naturale-italia-2019 (accessed on 20 December 2021).
  21. Yao, L.; Chen, L.; Wei, Z.; Sun, R. Potential reduction in urban runoff by green spaces in Beijing: A scenario analysis. Urban For. Urban Green. 2015, 14, 300–308. [Google Scholar] [CrossRef]
  22. Busca, F.; Revelli, R. Avoided Surface Runoff as an Ecosystem Service: The Case Study of a Green Area in Turin (IT). In Proceedings of the 39th IAHR World Congress, Malaga, Spain, 19–24 June 2022. [Google Scholar]
  23. Booth, D.B. Urbanization and the natural drainage system—Impacts, solutions, and prognoses. Northwest Environ. J. 1991, 7, 93–118. [Google Scholar]
  24. Zhao, D.; Lei, Q.; Shi, Y.; Wang, M.; Chen, S.; Shah, K.; Ji, W. Role of Species and Planting Configuration on Transpiration and Microclimate for Urban Trees. Forests 2020, 11, 825. [Google Scholar] [CrossRef]
  25. Turner, J.; Overland, J. Contrasting climate change in the two polar regions. Polar Res. 2009, 28, 146–164. [Google Scholar] [CrossRef]
  26. United Nations. Transforming our World: The 2030 Agenda for Sustainable Development; United Nations: New York, NY, USA, 2015; Available online: https://sdgs.un.org/publications/transforming-our-world-2030-agenda-sustainable-development-17981 (accessed on 5 February 2022).
  27. i-Tree Tools. Available online: https://www.itreetools.org/tools (accessed on 14 March 2022).
  28. Groot, J.W.; Rogers, K.; Maco, S.; Buckland, A.; Sheridan, R.; Garden, J.; Klobucar, B.; Lopez, F.; Sjöman, J.D.; Harrison, C. Second European i-Tree Conference; Treeconomics and Trädkonsult: Malmö, Sweden, 2019. [Google Scholar]
  29. i-Tree Tools: I-Tree Canopy. Available online: https://canopy.itreetools.org/ (accessed on 8 February 2022).
  30. i-Tree Tools: I-Tree Hydro. Available online: https://www.itreetools.org/tools/hydro (accessed on 14 March 2022).
  31. Wang, J.; Endreny, T.A.; Nowak, D.J. Mechanistic Simulation of Tree Effects in an Urban Water Balance Model. J. Am. Water Resour. Assoc. (JAWRA) 2008, 44, 75–85. [Google Scholar] [CrossRef]
  32. United States Environmental Protection Agency (EPA). Available online: https://www.epa.gov/npdes-permits/stormwater-tools-new-england (accessed on 27 September 2021).
  33. Sutherland, R.C. Methods for Estimating Effective Impervious Cover. In Article 32 in the “The Practice of Watershed Protection”; Center for Watershed Protection: Ellicott City, MD, USA, 2000. [Google Scholar]
  34. US Environmental Protection Agency (USEPA). Estimating Change in Impervious Area (IA) and Directly Connected Impervious Areas (DCIA) for Massachusetts Small MS4 Permit; USEPA Small MS4 Permit Technical Support Document. Available online: https://www3.epa.gov/region1/npdes/stormwater/ma/MADCIA.pdf (accessed on 20 March 2022).
  35. Nowak, D.J.; Crane, D.E.; Stevens, J.C.; Hoehn, R.E.; Walton, J.T.; Bond, J. A Ground-Based Method of Assessing Urban Forest Structure and Ecosystem Services. Arboric. Urban For. 2008, 34, 347–358. [Google Scholar] [CrossRef]
  36. Busca, F.; Tinivella, I.; Revelli, R. Urban sustainability: The role of ecosystem services provided by an Italian green infrastructure. Geam. Geoing. Ambient. Min. 2021, 163–164, 46–55. [Google Scholar]
  37. Wang, J.; Endreny, T.; Hassett, J. Power Function Decay of Hydraulic Conductivity for a TOPMODEL-Based Infiltration Routine. Hydrol. Processes 2006, 20, 3825–3834. [Google Scholar]
  38. Smullen, J.T.; Shallcross, A.L.; Cave, K.A. Updating the U.S. nationwide urban runoff quality database. Water Sci. Technol. 1999, 39, 9–16. [Google Scholar] [CrossRef]
  39. Ciaponi, C.; Mutti, M.; Papiri, S. Storm Water Quality in the Cascina Scala (Pavia Italy) Experimental Catchment. In Proceedings of the New Trends in Water and Environmental Engineering, Capri, Italy, 24–28 June 2002. [Google Scholar]
  40. Milano, V.; Pagliara, S.; Dellacasa, F. Urban stormwater quantity and quality in the experimental urban catchment of Picchianti. In Proceedings of the New Trends in Water and Environmental Engineering, Capri, Italy, 24–28 June 2002. [Google Scholar]
  41. Ellis, J.B. Pollutional Aspects of Urban Runoff. In Urban Runoff Pollution; Torno, H.C., Marsalek, J., Desbordes, M., Eds.; NATO ASI Series (Series G: Ecological Sciences); Springer: Berlin/Heidelberg, Germany, 1986; Volume 10. [Google Scholar]
  42. Domini, C.; Vidal, L.; Cravotto, G.; Canals, A. A Simultaneous, Direct Microwave/Ultrasound-assisted Digestion Procedure for the Determination of Total Kjeldahl Nitrogen. Ultrason. Sonochem. 2009, 16, 564–569. [Google Scholar] [CrossRef]
  43. Arpa Piemonte. City of Turin, Climate Assessment and Future Scenarios. Natural and Environmental Risks Department, 2018 (Italian). Available online: http://www.comune.torino.it/ambiente/cambiamenti_climatici/cosa-puoi-fare-tu-5.shtml (accessed on 15 March 2022).
  44. ISPRA. The Future Climate in Italy: Analysis of the Projections of the Regional Models; ISPRA: Rome, Italy, 2015; Volume 58, pp. 1–64, (In Italian). Available online: https://www.isprambiente.gov.it/it/pubblicazioni/stato-dellambiente/il-clima-futuro-in-italia-analisi-delle-proiezioni-dei-modelli-regionali (accessed on 10 March 2022).
  45. Bucchignani, E.; Montesarchio, M.; Zollo, A.L.; Mercogliano, P. High-resolution climate simulations with COSMO-CLM over Italy: Performance evaluation and climate projections for the 21st century. Int. J. Climatol. 2016, 36, 735–756. [Google Scholar] [CrossRef]
  46. Dobbertin, M.; Hug, C.; Pannatier, E.; Kräuchi, N.; Schaub, M.; Schmitt, M.; Schwyzer, A.; Thimonier, A.; Waldner, P. 25 Jahre Sanasilva: Vom Waldsterben zur Waldökosystemforschung. Infoblatt. Wald. 2009, 25, 1–4. [Google Scholar]
  47. Liu, W.; Chen, W.; Chi, P. Modelling the effects of Green Infrastructure on Storm Water Runoff Reduction on Community Scale. Acta Ecol. Sin. 2016, 36, 1686–1697. [Google Scholar] [CrossRef]
  48. Bautista, D.; Peña-Guzmán, C. Simulating the Hydrological Impact of Green Roof Use and an Increase in Green Areas in an Urban Catchment with i-Tree: A Case Study with the Town of Fontibón in Bogotá, Colombia. Resources 2019, 8, 68. [Google Scholar] [CrossRef] [Green Version]
  49. Schwalm, C.; Glendon, S.; Duffy, P. RCP8.5 tracks cumulative CO2 emissions. Proc. Natl. Acad. Sci. USA 2020, 117, 19656–19657. [Google Scholar] [CrossRef] [PubMed]
Figure 1. i-Tree Hydro: input data, water balance, output data [30].
Sustainability 14 08091 g001
Figure 2. Geographical framework of case study “Le Vallere” Park (45°00′40′′ N, 07°40′21′′ E). At the top left, the red pointer indicates the position of the park on the map of Italy [36].
Sustainability 14 08091 g002
Figure 3. Land Cover distribution of “Le Vallere” Park from i-Tree Canopy with relative standard error (black bars).
Sustainability 14 08091 g003
Figure 4. Trend of Vegetation Hydrology components (bar charts) and cumulative rainfall on monthly basis (line chart) relating to Present Scenario (2019): (a) Interception by vegetation; (b) Evaporation from vegetation; (c) Storage on vegetation surface; (d) Throughfall from vegetation.
Sustainability 14 08091 g004
Figure 5. Trend of the average temperature recorded in 2019 (PS) and those estimated for 2071–2100 (FS.1 and FS.2).
Sustainability 14 08091 g005
Figure 6. Comparison of Water Quality outputs for PS, FS.1, and FS.2: (a) main pollutants; (b) secondary pollutants.
Sustainability 14 08091 g006
Figure 7. Comparison of Vegetation Hydrology outputs for PS, FS.1 and FS.2.
Sustainability 14 08091 g007
Figure 8. Comparison of Subsurface Hydrology outputs for PS, FS.1 and FS.2.
Sustainability 14 08091 g008
Table 1. i-Tree Canopy land cover classes.
Cover ClassAbbreviation
Tree—Pervious (T)T
Tree—Impervious (NT)NT
Grass—Herbaceous (G)G
Impervious Ground (IG)IG
Water (W)W
Soil—Bare Ground (S)S
Table 2. i-Tree Hydro—additional land cover inputs.
Input DataValue
Directly Connected Impervious Area (DCIA)10.13%
Leaf Area Index (LAI)1.74
Evergreen Tree Canopy10%
Evergreen Shrub Canopy0%
Table 3. i-Tree Hydro—hydrological parameters.
Hydrological ParameterUMValue
Annual Average Flow of Project Aream3/s9.986 × 10−3
Soil Type-Sandy Loam
Wetting Front Suctionm0.11
Effective Porosity-0.412
Surface Hydraulic Conductivitycm/h1.090
Max Depth of Water in Upper Soil Zonem0.05
Initial Soil Saturation%50
Leaf Transition Perioddays28
Leaf On Day1–365127
Leaf Off Day1–365280
Tree Bark Area Index-1.7
Shrub Bark Area Index-0.5
Leaf Storagemm0.2
Pervious Depression Storagemm1.0
Impervious Depression Storagemm2.5
Scale Parameter of Power Function-2
Scale Parameter of Soil Transmissivity-0.023
Transmissivity at Saturationm2/h0.13
Unsaturated Zone Time Delayh10
Time Constant for Pervious Area and DCIA flowh40.0
Time Constant for Subsurface Flowh120.0
Soil Macropore Percentage%0.000001
Watershed area where rainfall rate can exceed infiltration rate%100
Table 4. i-Tree Hydro—pollutant coefficients.
PollutantCoefficient (mg/L)
Total Suspended Solids (TSS)216.64
Biochemical Oxygen Demand (BOD)30.00
Chemical Oxygen Demand (COD)127.93
Total Phosphorus (tP)0.315
Soluble Phosphorus (sP)0.129
Total Kjeldhal Nitrogen (TKN)2.30
Nitrite and Nitrate (NO2, NO3)0.658
Copper (Cu)0.045
Lead (Pb)0.058
Zinc (Zn)0.472
Table 5. Water Quantity outputs for Present Scenario (PS), Future Scenario 1 (FS.1) and Future Scenario 2 (FS.2), where Δx terms, for each FS.x, highlight differences compared with PS.
PSFS.1FS.2
UMYearly AmountYearly AmountΔ1Yearly AmountΔ2
RainfallMm914.50900.0014.50774.00140.50
Total flowm3/year217,763.21208,457.219306.00183,280.9134,482.30
Base flowm3/year852.46852.460.00852.460.00
Pervious runoffm3/year215,393.35206,630.098763.26181,145.9834,241.84
Impervious runoffm3/year1517.40974.65542.751282.47234.93
Table 6. Water Quality outputs (kg/year).
ScenarioTSSBODCODtPsPTKNNO2 + NO3CuPbZn
PS47,176.226532.9027,858.4568.6028.09500.86143.299.8012.63102.78
FS.142,902.166253.7226,667.9359.0924.20431.51123.458.4410.8888.55
FS.239,705.985498.4323,447.1357.7423.64421.55120.608.2510.6386.51
Table 7. Expected temperature increases for the 2071–2100 period (referring to the 1971–2000 period) relating to the national and Turin context.
SeasonSeasonal Average Expected Increase (°C)—RCP4.5Seasonal Average Expected Increase (°C)—RCP8.5
ItalyTurinItalyTurin
Winter+2.20+2.93+4.00+5.39
Spring+2.10+2.80+3.80+5.12
Summer+3.10+4.13+5.60+7.55
Autumn+2.50+3.33+4.40+5.93
Average+2.47+3.30+4.45+6.00
Table 8. Precipitation and rainy days for PS (“Torino-Vallere” weather station) and estimates for FS.1 and FS.2 according to the RCP4.5 and RCP8.5 emission scenarios.
ScenarioAnnual Precipitation (mm)Rainy Days
PS914.5079
FS.1900.0067
FS.2774.0053
Table 9. Monthly precipitation values for PS (“Torino-Vallere” weather station) and estimates for FS.1 and FS.2 according to the RCP4.5 and RCP8.5 emission scenarios.
MonthPSFS.1FS.2
January5.444.058.0
February26.046.045.0
March6.084.077.0
April89.4108.093.0
May63.6134.0109.0
June20.063.043.0
July156.434.013.0
August77.054.026.0
September53.388.056.0
October100.0101.0106.0
November254.8101.087.0
December62.643.061.0
Table 10. Comparison of the main land cover input data for FS.1 (with PP) and FS.1b (without PP).
Input DataFS.1FS.1b
Tree—Pervious (%)64.3033.92
Tree—Impervious (%)1.621.62
Grass—Herbaceous (%)29.8057.15
Impervious Ground (%)2.773.77
Water (%)0.000.00
Soil—Bare Ground (%)1.543.54
DCIA (%)8.1610.13
LAI1.791.74
Publisher’s Note: MDPI stays neutral with regard to jurisdictional claims in published maps and institutional affiliations.

