Article

Implication of Mutual Assistance Evacuation Model to Reduce the Volcanic Risk for Vulnerable Society: Insight from Mount Merapi, Indonesia

by
Faizul Chasanah
1,2,* and
Hiroyuki Sakakibara
1
1
Graduate School of Sciences and Technology for Innovation, Yamaguchi University, Ube City 755-8611, Japan
2
Department of Civil Engineering, Faculty of Civil Engineering and Planning, Islamic University of Indonesia, Sleman, Yogyakarta 55584, Indonesia
*
Author to whom correspondence should be addressed.
Sustainability 2022, 14(13), 8110; https://doi.org/10.3390/su14138110
Submission received: 23 May 2022 / Revised: 25 June 2022 / Accepted: 30 June 2022 / Published: 2 July 2022
(This article belongs to the Special Issue Risk Assessment and Sustainable Disaster Management)

Abstract

:
The successful evacuation of vulnerable people during emergencies is a significant challenge. In the case of a Mount Merapi eruption, limited private vehicles in the community and a lack of evacuation transport and government volunteers led some people to walk to the meeting area. Consequently, low walking speeds by vulnerable persons may increase the risk and delay. Therefore, the mutual assistance strategy is proposed to support vulnerable people by evacuating them with young people. This grouping was simulated using an AnyLogic software with the agent-based model concept. Pedestrians and vehicles played the roles of significant agents in this experiment. Evacuation departure rate, actual walking speed, group size, route, and coordination were crucial agent parameters. Human behavior and agent distribution were investigated using stakeholders and local community interviews. We measured the walking speed directly to find the independent and group speed. Afterward, we developed three scenarios and models for the evacuation process. A traffic approach was used in the simulation. The results revealed that this mutual assistance model is effective for the rapid evacuation and risk reduction of vulnerable communities where successful evacuation rates have improved. The highest arrival rating was obtained by the Model 3, which was assembled and well-coordinated from home. These findings are a novelty in the volcano context and reflect all categories of vulnerable behavior involving the elderly, disabled, children, and pregnant mothers. The model will benefit disaster management studies and authorities’ policies for sustainable evacuation planning and aging population mitigation.

1. Introduction

Volcanic eruptions are among the most catastrophic natural disasters: Their effect is not only casualties during an eruption, but the material risk of a large explosion might have an impact on the sustainable hazard [1]. Indonesia has more than 500 volcanoes, 127 of which are active [2]. Mount Merapi is the country’s most active volcano and is famous worldwide. It ranked third in terms of eruption impact in 2010 [3], when a paroxysmal eruption occurred with an ash column reaching an altitude of 17 km and a pyroclastic density spread 16 km from the volcano’s peak in the Gendol River [4]. The Center for Volcanology and Geological Hazard Mitigation enlarged the danger zone to 20 km around the summit and urged residents to evacuate [5]. However, the large-scale evacuation was uncontrolled, and many casualties occurred due to this management crisis. The national disaster management agency (Badan Nasional Penanggulangan Bencana, or BNPB) assists in relocating residents to a safe place as a mitigation strategy [2]. In addition, each regional disaster management agency (Badan Penanggulangan Bencana Daerah, or BPBD) is developing its cooperation with sister villages. This strategy was implemented through an agreement between the affected area and these sister villages; the agreement covers responsibilities such as providing shelter, logistics, and other disaster-related services. Another eruption response technique is establishing a staged and simultaneous evacuation system, with priority given to vulnerable populations. Vulnerable communities are first made to evacuate independently, and the local government picks them up when they have difficulties. The government focuses on supporting the evacuation process from the meeting point to the shelter, and the movement is carried out at Level 3, which is expected to reduce risk [6,7]. However, self-evacuation from the house to the meeting point is difficult to control because of human behavior factors. As a result, the efficacy of this evacuation stage must be evaluated, particularly in terms of the risk to vulnerable persons.
In this case, there are various critical evacuation issues that must be addressed for mitigation management. The first is the indefinite eruptive evacuation period [8]. Umbulharjo village officials stated that the 2006 eruption was sluggish, whereas the 2010 eruption was quick. Around 50–70 percent of internally displaced persons returned to the hazard zone during the crisis despite evacuation orders [5]. During the 2020 evacuation period, the secretary of the Boyolali District Disaster Management Agency stated that several inhabitants also returned to farm the land during the day and went to shelters at night. The uncertainty of a volcano’s hazardous period may cause inevitable difficulties for authorities. Second, Indonesia will be ranked 5th in the world for aging populations in 2025, according to a World Health Organization (WHO) report [9]. Consequently, the evacuation of vulnerable people is a topic of concern. Third, the community’s behavior has not been fully considered yet in the government’s contingency plan. Even if the meeting points and shelters have been coordinated appropriately, the physical constraints of vulnerable people and misperceptions of risk during an emergency can result in casualties. Fourth, there is a lack of an opportunity for cross-sector communication. Consequently, the inhabitant rescue may be delayed. Fifth, evacuation transport provided by the local government and vehicle ownership in the community was limited. This condition leads some people to walk and makes them vulnerable due to their low speeds, which can cause hazards and delays. Issues 3 to 5 were highlighted by key informants at the BPBD and the village office.
Consequently, there are still significant challenges for evacuation management, and research and development are necessary. We propose a mutual assistance approach or assembly model to improve successful evacuation procedures and protect vulnerable people. The ideal solution is to enlist the help of young people in assisting the vulnerable. Alalouf-Hall [10] confirmed that an assembled evacuation model was successfully implemented in the earthquake and tsunami in Japan. However, this strategy has only been carried out to save the children. Grouping for the elderly and other vulnerable people has not been examined. Ma et al. [11] also examined the influence of group behaviors and crowd dynamics during pedestrian evacuation. The result revealed that increased group sizes and numbers can promote crowd cooperation but prolongs the duration of the evacuation. Specific impacts on pedestrian interactions have not been considered and variations in people’s walking speed have not been included. In the current study, we focused on the small group model and represent walking speed for all categories of vulnerable people. There are limited previous studies and implementations regarding the grouping interaction and vulnerable people concerns in disaster mitigation plans. Our original idea is a concept of mutual assistance that is well controlled and registered by the government to reduce risk. Our novelty is a simulation model that reflects the actual walking speed data in the field representing all categories of people such as young people, the elderly, the disabled, children, and pregnant mothers [12]. Actual emergency data is hard to measure. However, the survey has been conducted using an emergency approach in the affected areas by considering people’s perceptions, carrying baggage, using the actual evacuation route, representing rainy and summer weather, and other environmental factors. After that, the concept of interaction and grouping is developed in software to confirm the purpose. We also simulated the model with the actual evacuation distance approach. We generated and tested numerous scenarios using an agent-based evacuation model in a volcano context. The results are presented in Section 4, Section 5 discusses the results, and Section 6 presents our conclusions.

2. Related Studies

2.1. Mount Merapi Evacuation

Several lessons were learned during the 2010 Merapi eruption that could be used in future Merapi mass evacuations. The evacuation experience during this eruption revealed that evacuation proceeded smoothly during the first few days. However, when the eruption became much larger, the evacuation process encountered difficulties owing to the lack of preparation by the government and residents. In the future, it is critical to developing a comprehensive new contingency plan and public education [5]. Hardiansyah et al. [13] developed an evacuation model using SATURN version 11.3.12 W to minimize casualties. The findings of the study confirmed an increase in the flow and travel times of the road network in the Sleman Regency in both Ring 2 and Ring 3 and the road network beyond the rings. However, an evacuation simulation in Rings 2 and 3 is required to broaden the coverage of the impacted region and the extent of the influence of performance changes in the existing road networks.
Jumadi et al. [14] also developed a model for individual evacuation decision-making during a disaster. This agent-based model was concerned with the emergence of hesitancy during times of crisis. The evacuation choice of an agent to stay or depart is based on an assessment of the intensity of the driving factors using threshold-based criteria. AnyLogic was used to compare the evacuation scenario between a simultaneous and staged Merapi volcano eruption scenario in Sleman Regency. The results revealed that a staged scenario is more capable of reducing potential traffic congestion during peak hours. However, several limitations were noted, such as the variability of population behavior, which was not fully examined in this initial simulation development [15]. Maharani et al. [16] used the self-organizing map method to determine the vulnerable cluster and the most significant related variable. Their findings demonstrated that the factors of migrate-in population number and number of women had the greatest influence on social vulnerability. Meanwhile, Nugraha et al. [17] conducted a risk assessment of Mount Merapi in the Sleman Regency habitation area, focusing on mapping eruption risk. The results showed that there is still a significant danger to this regency. The Spatio-Temporal Dynamics Model of Risk (STDMR) method was also applied in this volcano risk analysis. The STDMR incorporates the Multi-Criteria Evaluation (MCE) based on an individual risk model into an Agent-Based Model simulation and may demonstrate the influence of the evacuation process on the risk reduction outcome. The possibility of success or ignoring of this model depends on the actual interaction of agents, which requires validation improvement of the destination choice rule [18]. Therefore, an appropriate strategy for mitigation planning is needed. However, no previous studies have considered the government contingency that was revised in 2019. In the new regulation, the government developed a sister-village scenario and a combination of staged and simultaneous evacuations. In the present study, we develop a model based on this latest policy approach and directly involve the community to determine its perceptions, aiming to strengthen the resilience and reduce the risk for vulnerable people.

2.2. Existing Evacuation Simulation Model

In recent decades, several methodologies for evacuation dynamics simulations have been proposed. The Miracle of Kamaishi was a successful evacuation model employed during the 2011 earthquake and tsunami in Japan. Junior high school students supported elementary school students, which was highly effective and allowed them to miraculously survive the earthquake and tsunami evacuation [10]. The computational social science of disasters (CSSD) was introduced as the systematic study of disasters’ social behavioral dynamics using computer methodologies. The CSSD provides new theoretical grounds to investigate the complexities and the interacting processes involving traditional social sciences of disasters, computational social science, and crisis informatics. However, there is still a challenge in the collection and handling of human subject data [19]. Hawe et al. revealed that Agent-based simulations (ABS) have become the de-facto technique for determining the best way to respond to a large-scale emergency. The ABS can be employed for either preparedness or real-time response. This simulation reflects four perspectives: usage, environment implementation, agent implementation, and scalability [20]. An experimental model has also been developed using the AnyLogic simulation tool, which offers a novel approach for simulating the evacuation of complex environments [7]. Avdeeva et al. [21] conducted a simulation of the evacuation process at various economic facilities. The study computed the average evacuation time for each individual and the overall exit time, as well as the intensity of people’s flow at the buildings’ entry and exit points. Previous research has also adopted modeling with AnyLogic in a variety of cases, including the evaluation and optimization of pedestrian evacuation in high-density urban areas [22] and microscopic simulation-based pedestrian decision-making models in urban rail stations [23].

3. Materials and Methods
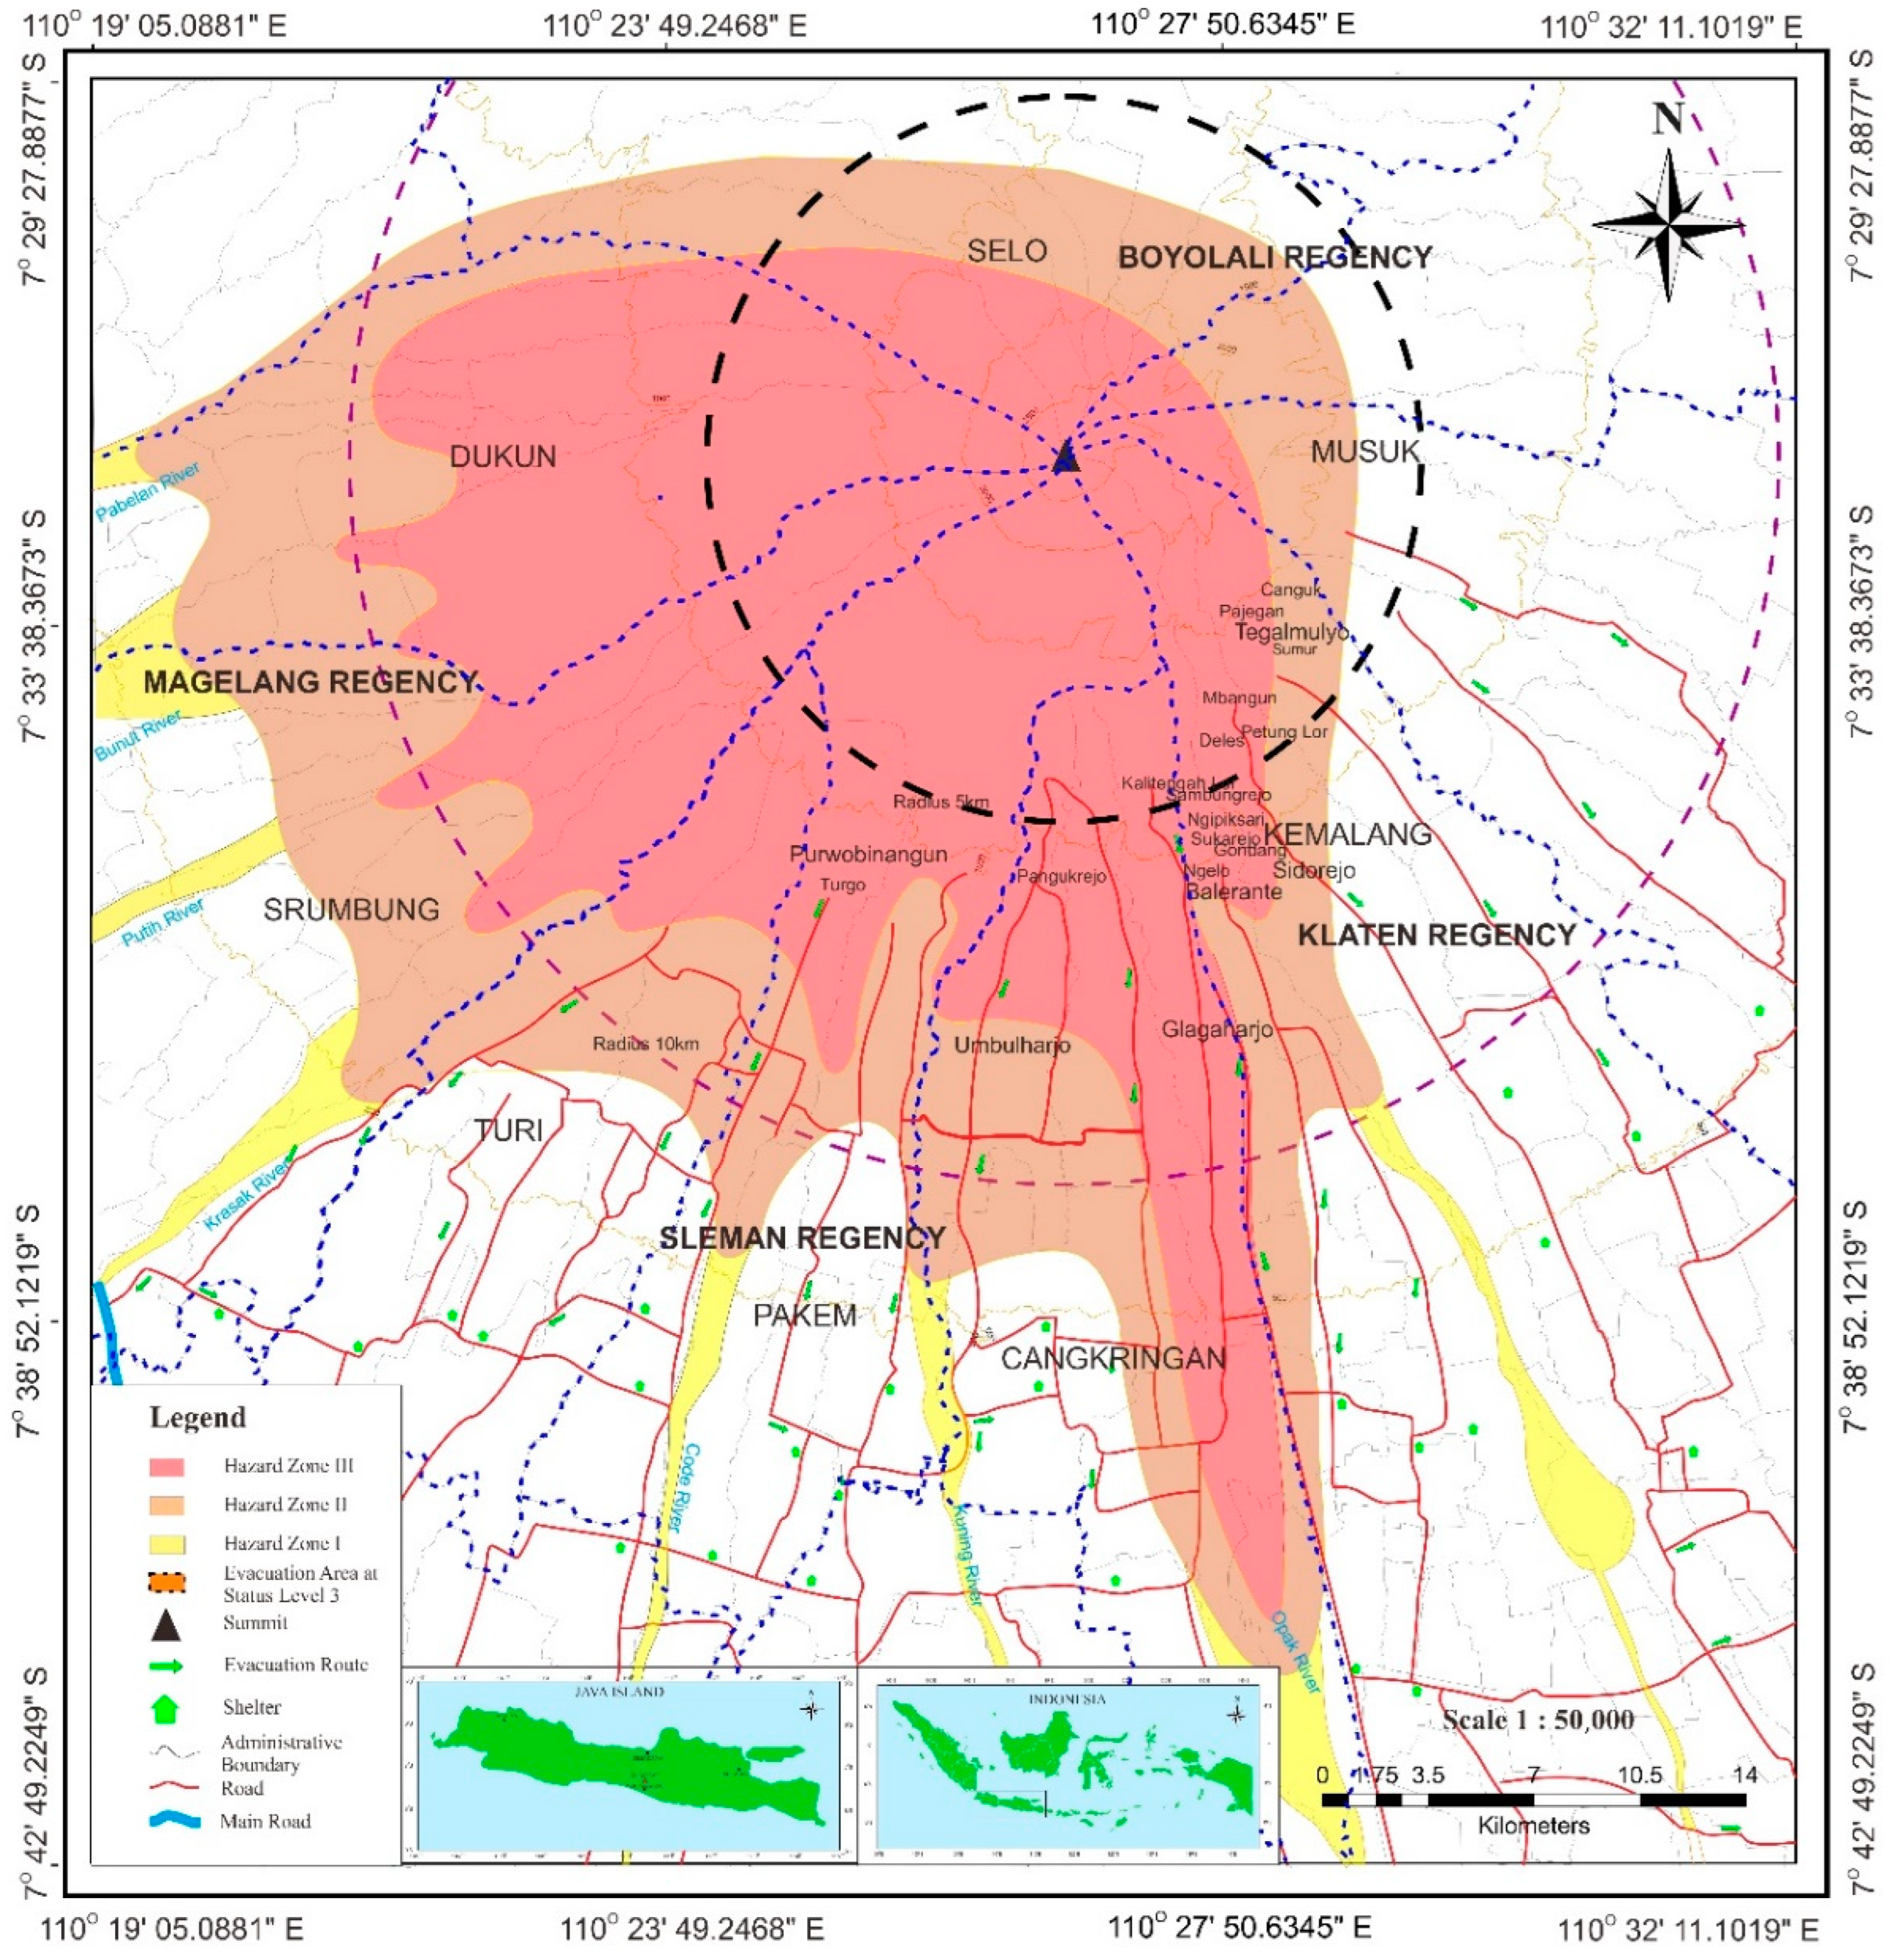
3.1. Study Area

Mount Merapi is on the Indonesian island of Java. This volcano serves as the administrative border between the Central Java Province (Boyolali, Klaten, and Magelang Regencies) and Yogyakarta Special Province (Sleman Regency). In the event of a Merapi eruption, four regencies would be affected. The government divides the danger zones (Kawasan Rawan Bencana, or KRB) into three levels: KRB III is high-risk, and KRB I is low-risk. Hazard zone III is close to the danger source and is regularly impacted by pyroclastic flows (maximum range of 8 km with a Volcanic Explosivity Index/VEI of 1–3), lava flows, rock falls, ejected rock fragments, and severe ashfall. Hazard zone II is potentially affected by pyroclastic flows (a range of over 17 km with a VEI of 3–4), lava flows, ejected material, ash falls, and volcanic bombs. Hazard zone I may be affected by lava/floods, as well as the expansion of pyroclastic and lava flows [24,25].
In the 1994 eruption, a lava dome grew on the south bank, and pyroclastic flows entered the Boyong and Bedog Rivers [26,27]. Another explosive eruption occurred in 2010, and pyroclastic flows were dominant in the south and southeast [24]. In 2021, the Geological Disaster Technology Research and Development Center reported that the potential hazards in the south-southwest sector reached a maximum of 3 km to the Woro River and 5 km to the Gendol, Kuning, Boyong, Bedog, Krasak, Bebeng, and Putih Rivers [28]. The government also determined 12 villages within a radius of 5 km in four affected regencies to evacuate as the situation reached Level 3 status in 2020 [29]. Therefore, the current study focuses only on hazard zone III, within a radius of 5–6 km from the peak of Merapi, and the evacuation process for alert Level 3 in rural areas in the Sleman and Klaten Regencies. The simulation covers 6 villages and 14 hamlets in both regencies. The detail of the hamlets is shown in Table 1, and the hazard zone map is depicted in Figure 1.

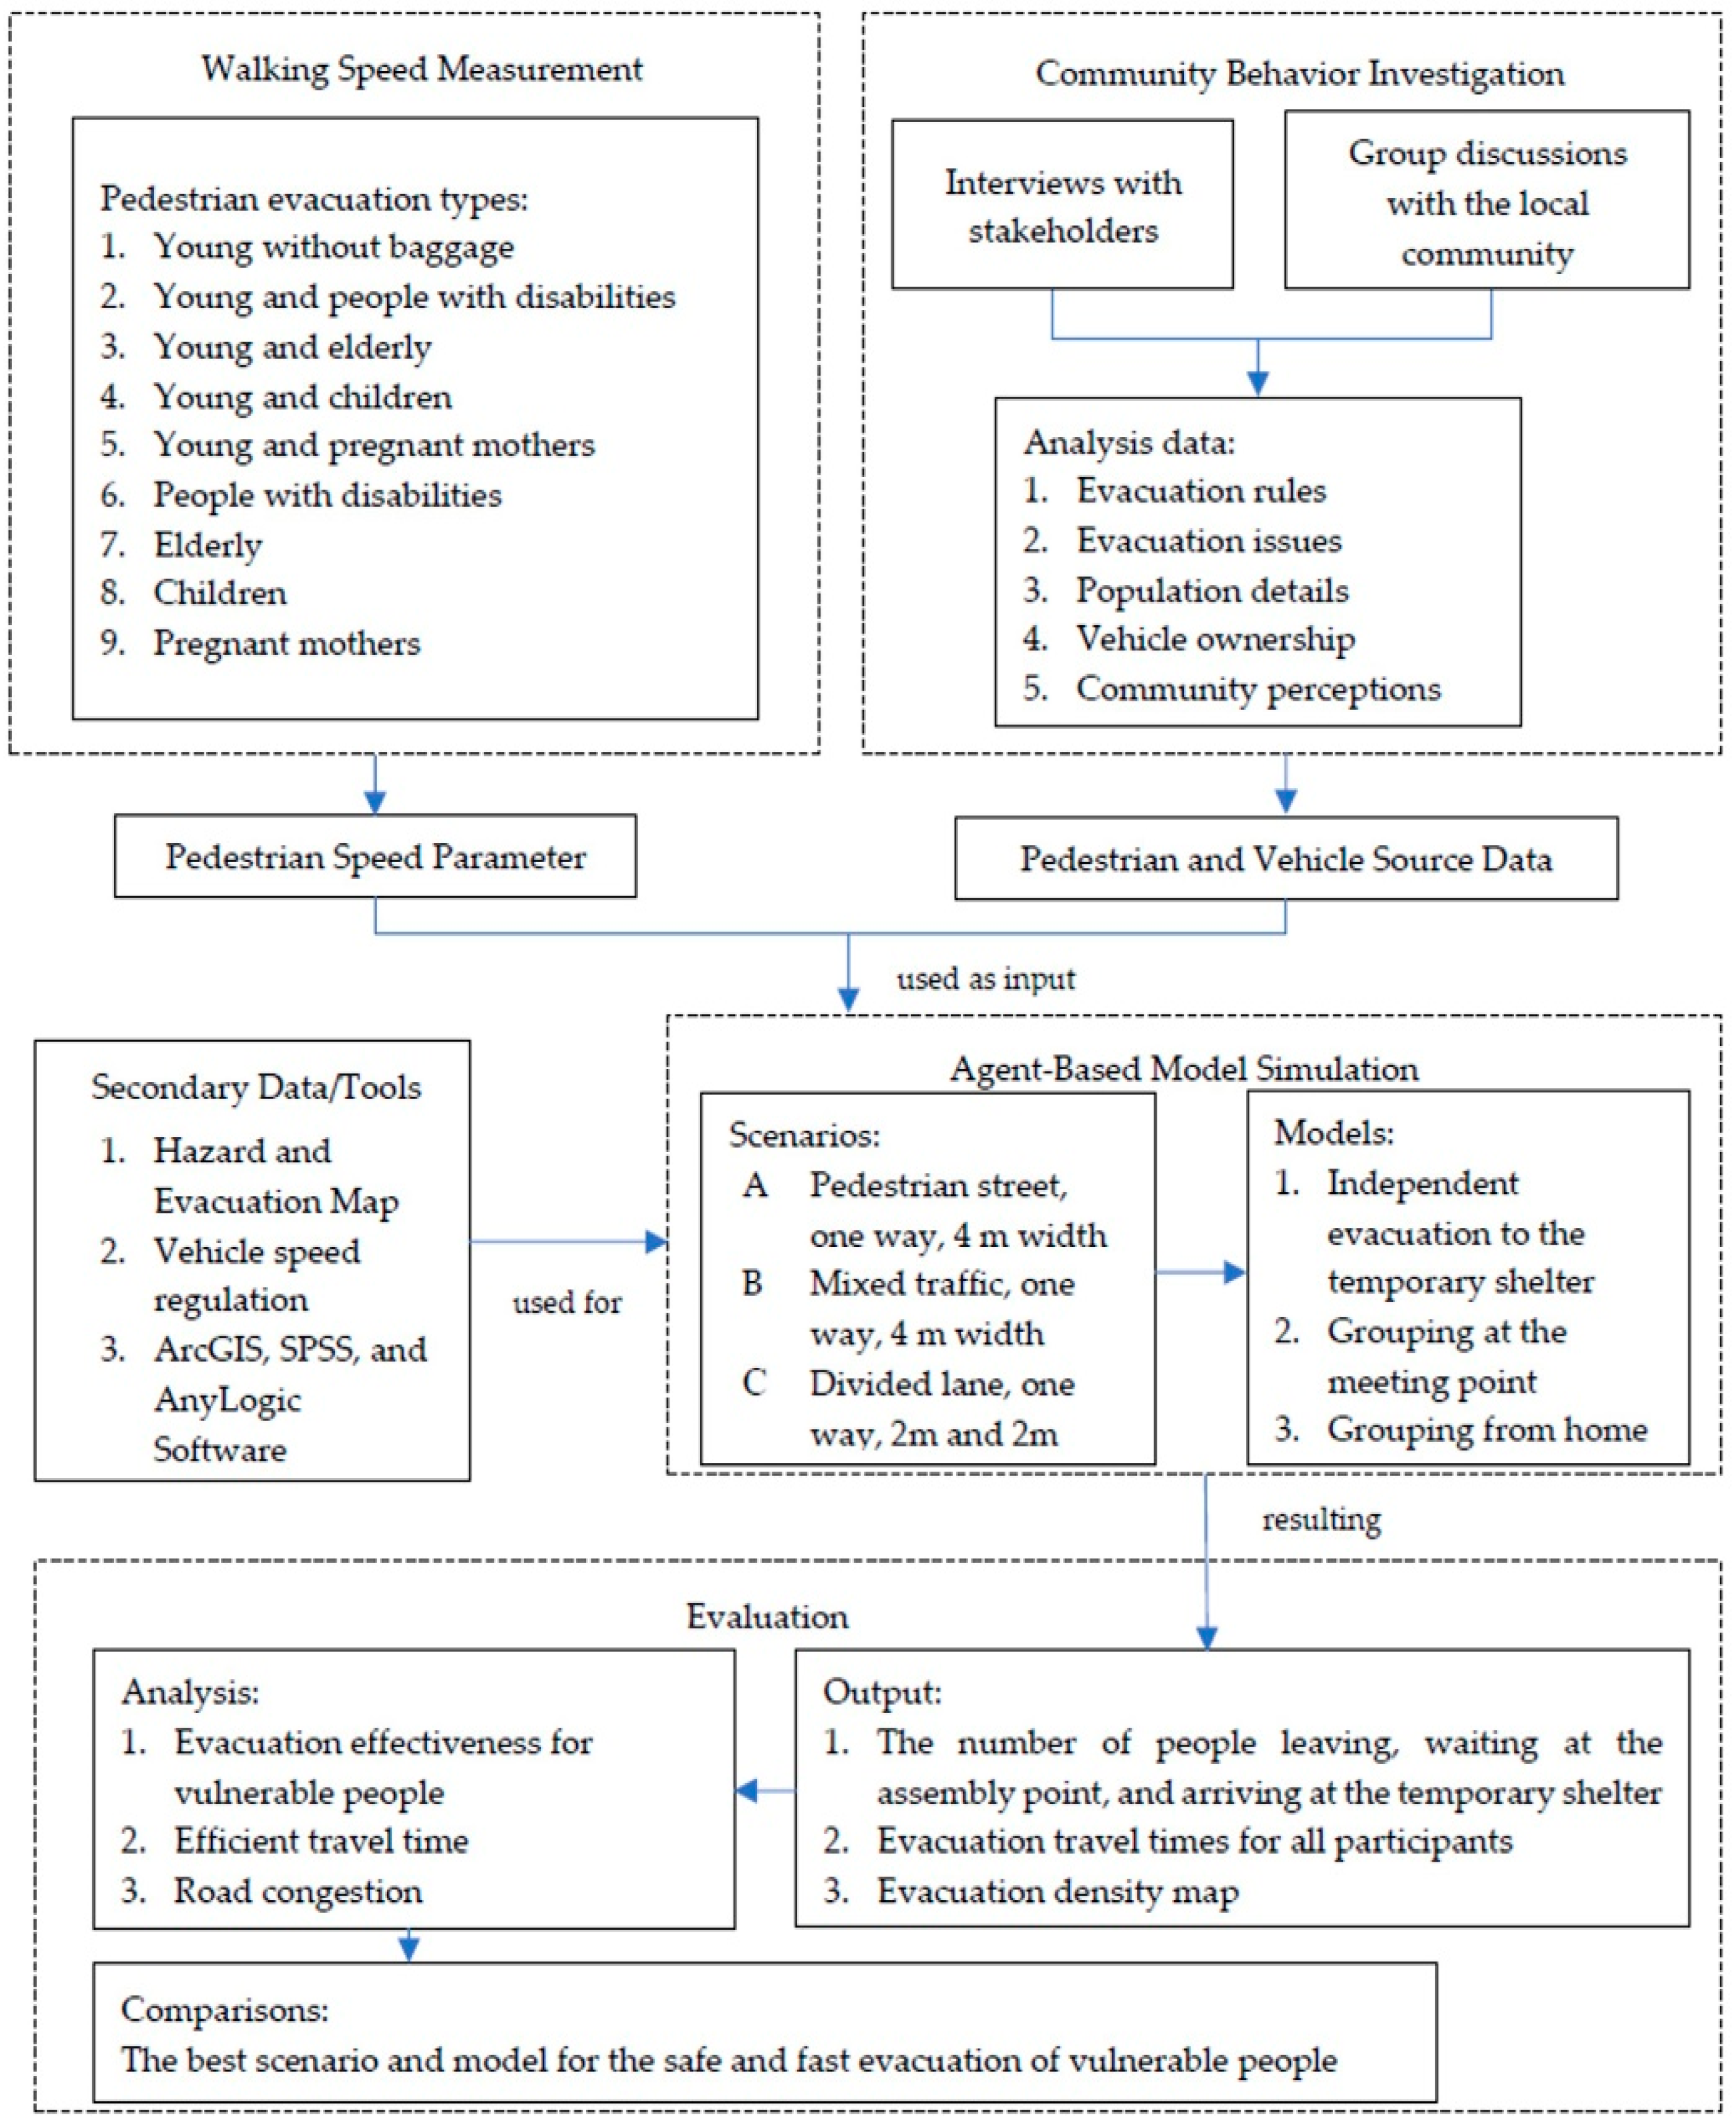
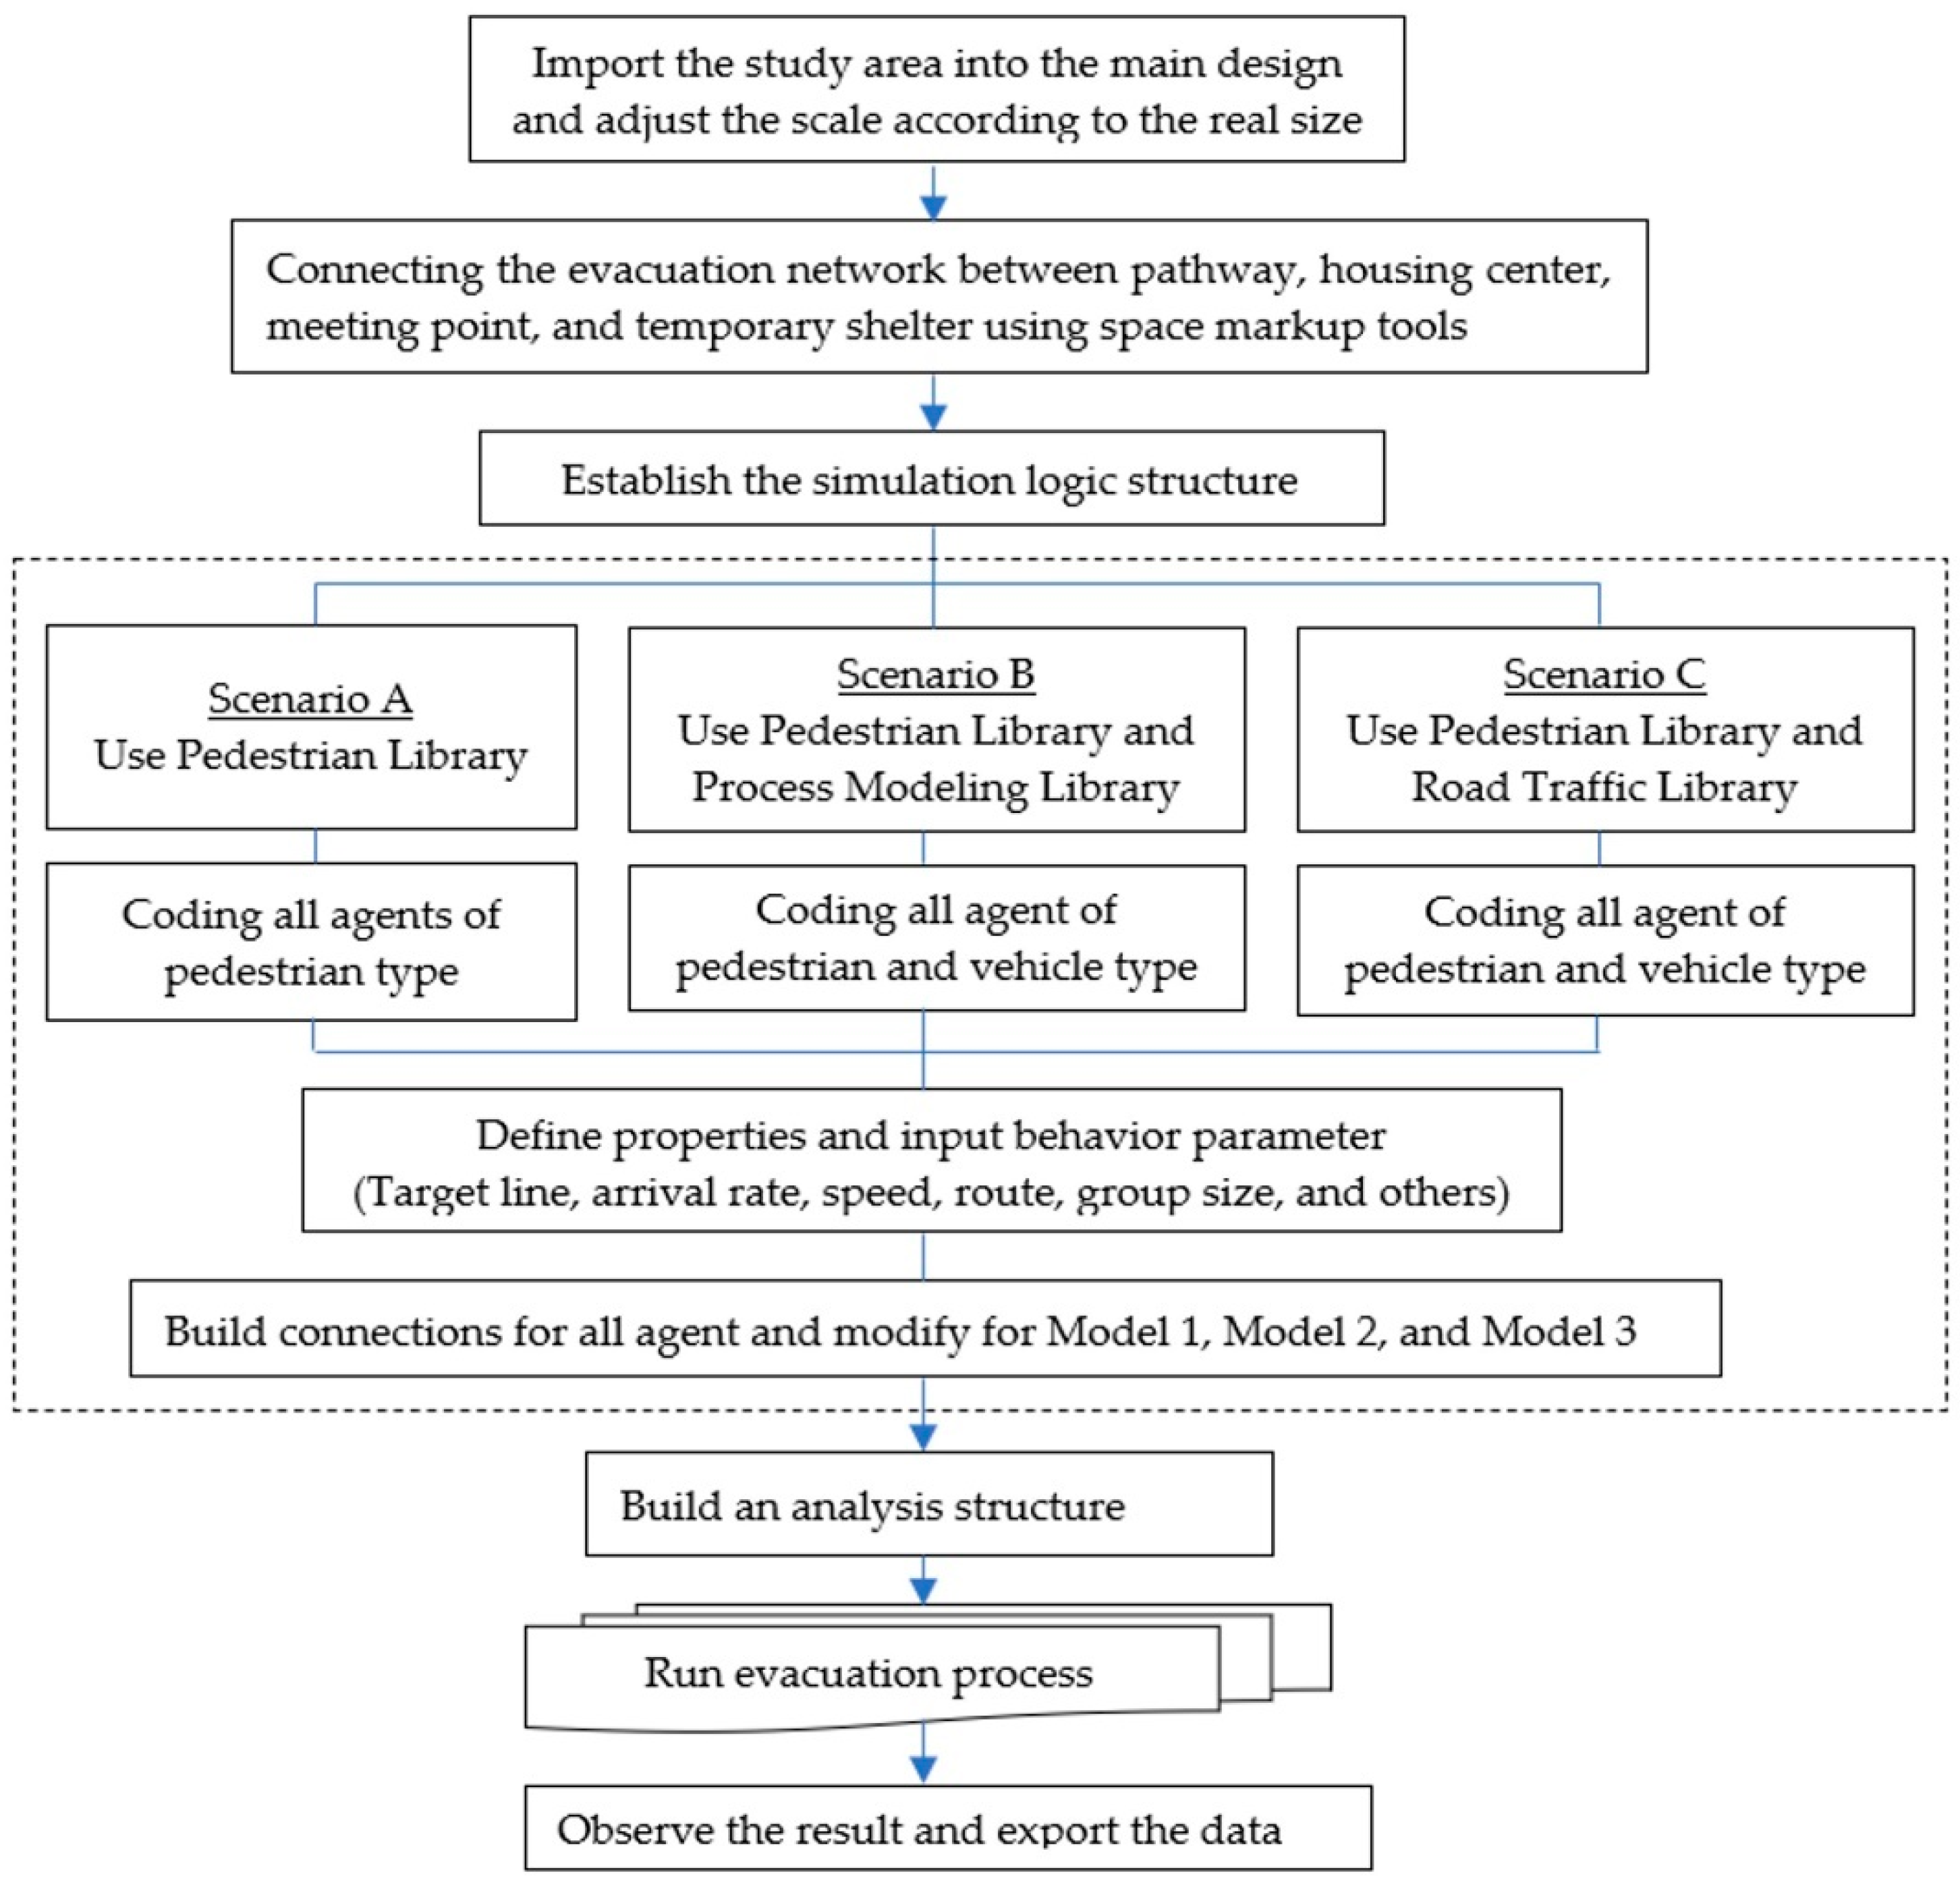
3.2. Methodological Approaches

We used an agent-based technique to model volcano evacuation flows. An actual walking speed was assessed in the first stage to determine people’s behavior regarding various emergency speeds. Second, interviews and group discussions were conducted to explore the most recent regulations, crucial issues, and community characteristics. The implementation details of both research stages can be found in [12]. The final step was an agent-based evacuation model simulation, which is a testing approach for the people interaction of mutual assistance strategy. Several scenarios and models were developed to find the best evacuation for vulnerable people. Figure 2 presents an overview of the study’s framework.

3.3. Walking Speed Measurement

Speed is a fundamental measure of traffic performance, and mean travel speed is used as a measure of effectiveness for arterials, rural highways, and more extensive facility assessments [30]. In this study, walking speed was measured manually. Travel time and speed studies have used the methods described in [31,32]. Collaboration with the affected village office was arranged to organize pedestrian volunteers. The pedestrians were asked to walk the evacuation route, which was recorded by the observer. Measurements were taken individually and in groups of young and vulnerable individuals.
The model involved nine types of agents or pedestrians, and the pedestrian evacuation included groups of young people, children, the elderly, individuals with disabilities, pregnant mothers, and mutual assistance groups. The children were aged 5 to 11 years, the young were aged 12 to 59 years, and the elderly were those aged 60 years or older [33]. The results showed a significant difference in walking speed between the vulnerable and mutual assistance groups. The speed values are fully explained in [12]. Subsequently, the actual walking speed was entered into the simulation model as a pedestrian agent parameter. Vehicle speed was not directly measured; instead, we set a vehicle speed of 30 km/h as a behavioral parameter and applied it to all vehicle types. This decision was based on the speed limit in rural areas of Indonesia [34].

3.4. Investigating Community Behavior

Data were collected using a purposive sampling approach. This method is commonly used in qualitative research to identify and select information-rich instances connected to the phenomena of interest [35]. The method can also be applied using both qualitative and quantitative research techniques [36]. Interviews with stakeholders and focus group discussions with local communities were conducted in the study area, and the contingency plans of the BPBD and village offices for both regencies were examined. Information about the affected population, evacuation map and shelter, evacuation transport scenarios, and other details are comprehensively described in [29,37,38,39,40,41]. Policymakers also confirmed the latest regulations on disaster management, issues and obstacles, and future challenges. These key informants included the secretary and staff of the Klaten District Disaster Management Agency, the head of the Search and Rescue Sector in Klaten Regency, the head of the Quick Reaction Team, the head of the Early Warning System of the Sleman District Disaster Management Agency, the head of the Search and Rescue for Community Protection in Kaliurang, and all the village or department heads in the affected area.
The results of the group discussions confirmed that 83% of residents would evacuate directly to the meeting point when working, 100% would evacuate soon when raining, 100% of people would evacuate even if it were at night, 100% would evacuate immediately in an alert status scenario, and 100% already knew the shelter destination. These results indicate that the possibility of a long evacuation delay is low. The community’s perspective was that it would not refuse to evacuate or adhere to the rules of the government’s contingency plan. Therefore, the assumption that everyone would evacuate within one hour of the Level 3 alert status was used in this simulation. The total population and vehicle ownership data are available in [39,40,41,42,43,44]. In this simulation, only one young person drove a vehicle; therefore, the pedestrian population distribution could be estimated. Table 1 presents the quantity comparison between young individuals driving, young pedestrians, and vulnerable pedestrians. Overall, these data comprised the sources for pedestrian and vehicle agents.

3.5. Agent-Based Evacuation Model

3.5.1. AnyLogic Simulation Principle

Agent-based modeling is a computational method for modeling complex system dynamics [45] that enables researchers to create, analyze, and test models composed of agents that interact within an environment [46]. In this study, we used the AnyLogic simulation to build a model because it allows the observation of system behavior over time at any level of detail, provides for increased accuracy and more precise forecasting, and can be animated in 2D/3D so that it can be more easily verified. The AnyLogic software package is a powerful platform that has a developed pedestrian library and many methods to collect the statistical results of a simulation so that it is easy to implement the agent approach completely [21]. The process modeling and pedestrian and road traffic libraries were used in this study’s experiment. Further, a traffic simulation interaction between vehicles and pedestrians was developed using this model [47]. The process design of the AnyLogic simulation is shown in Figure 3.

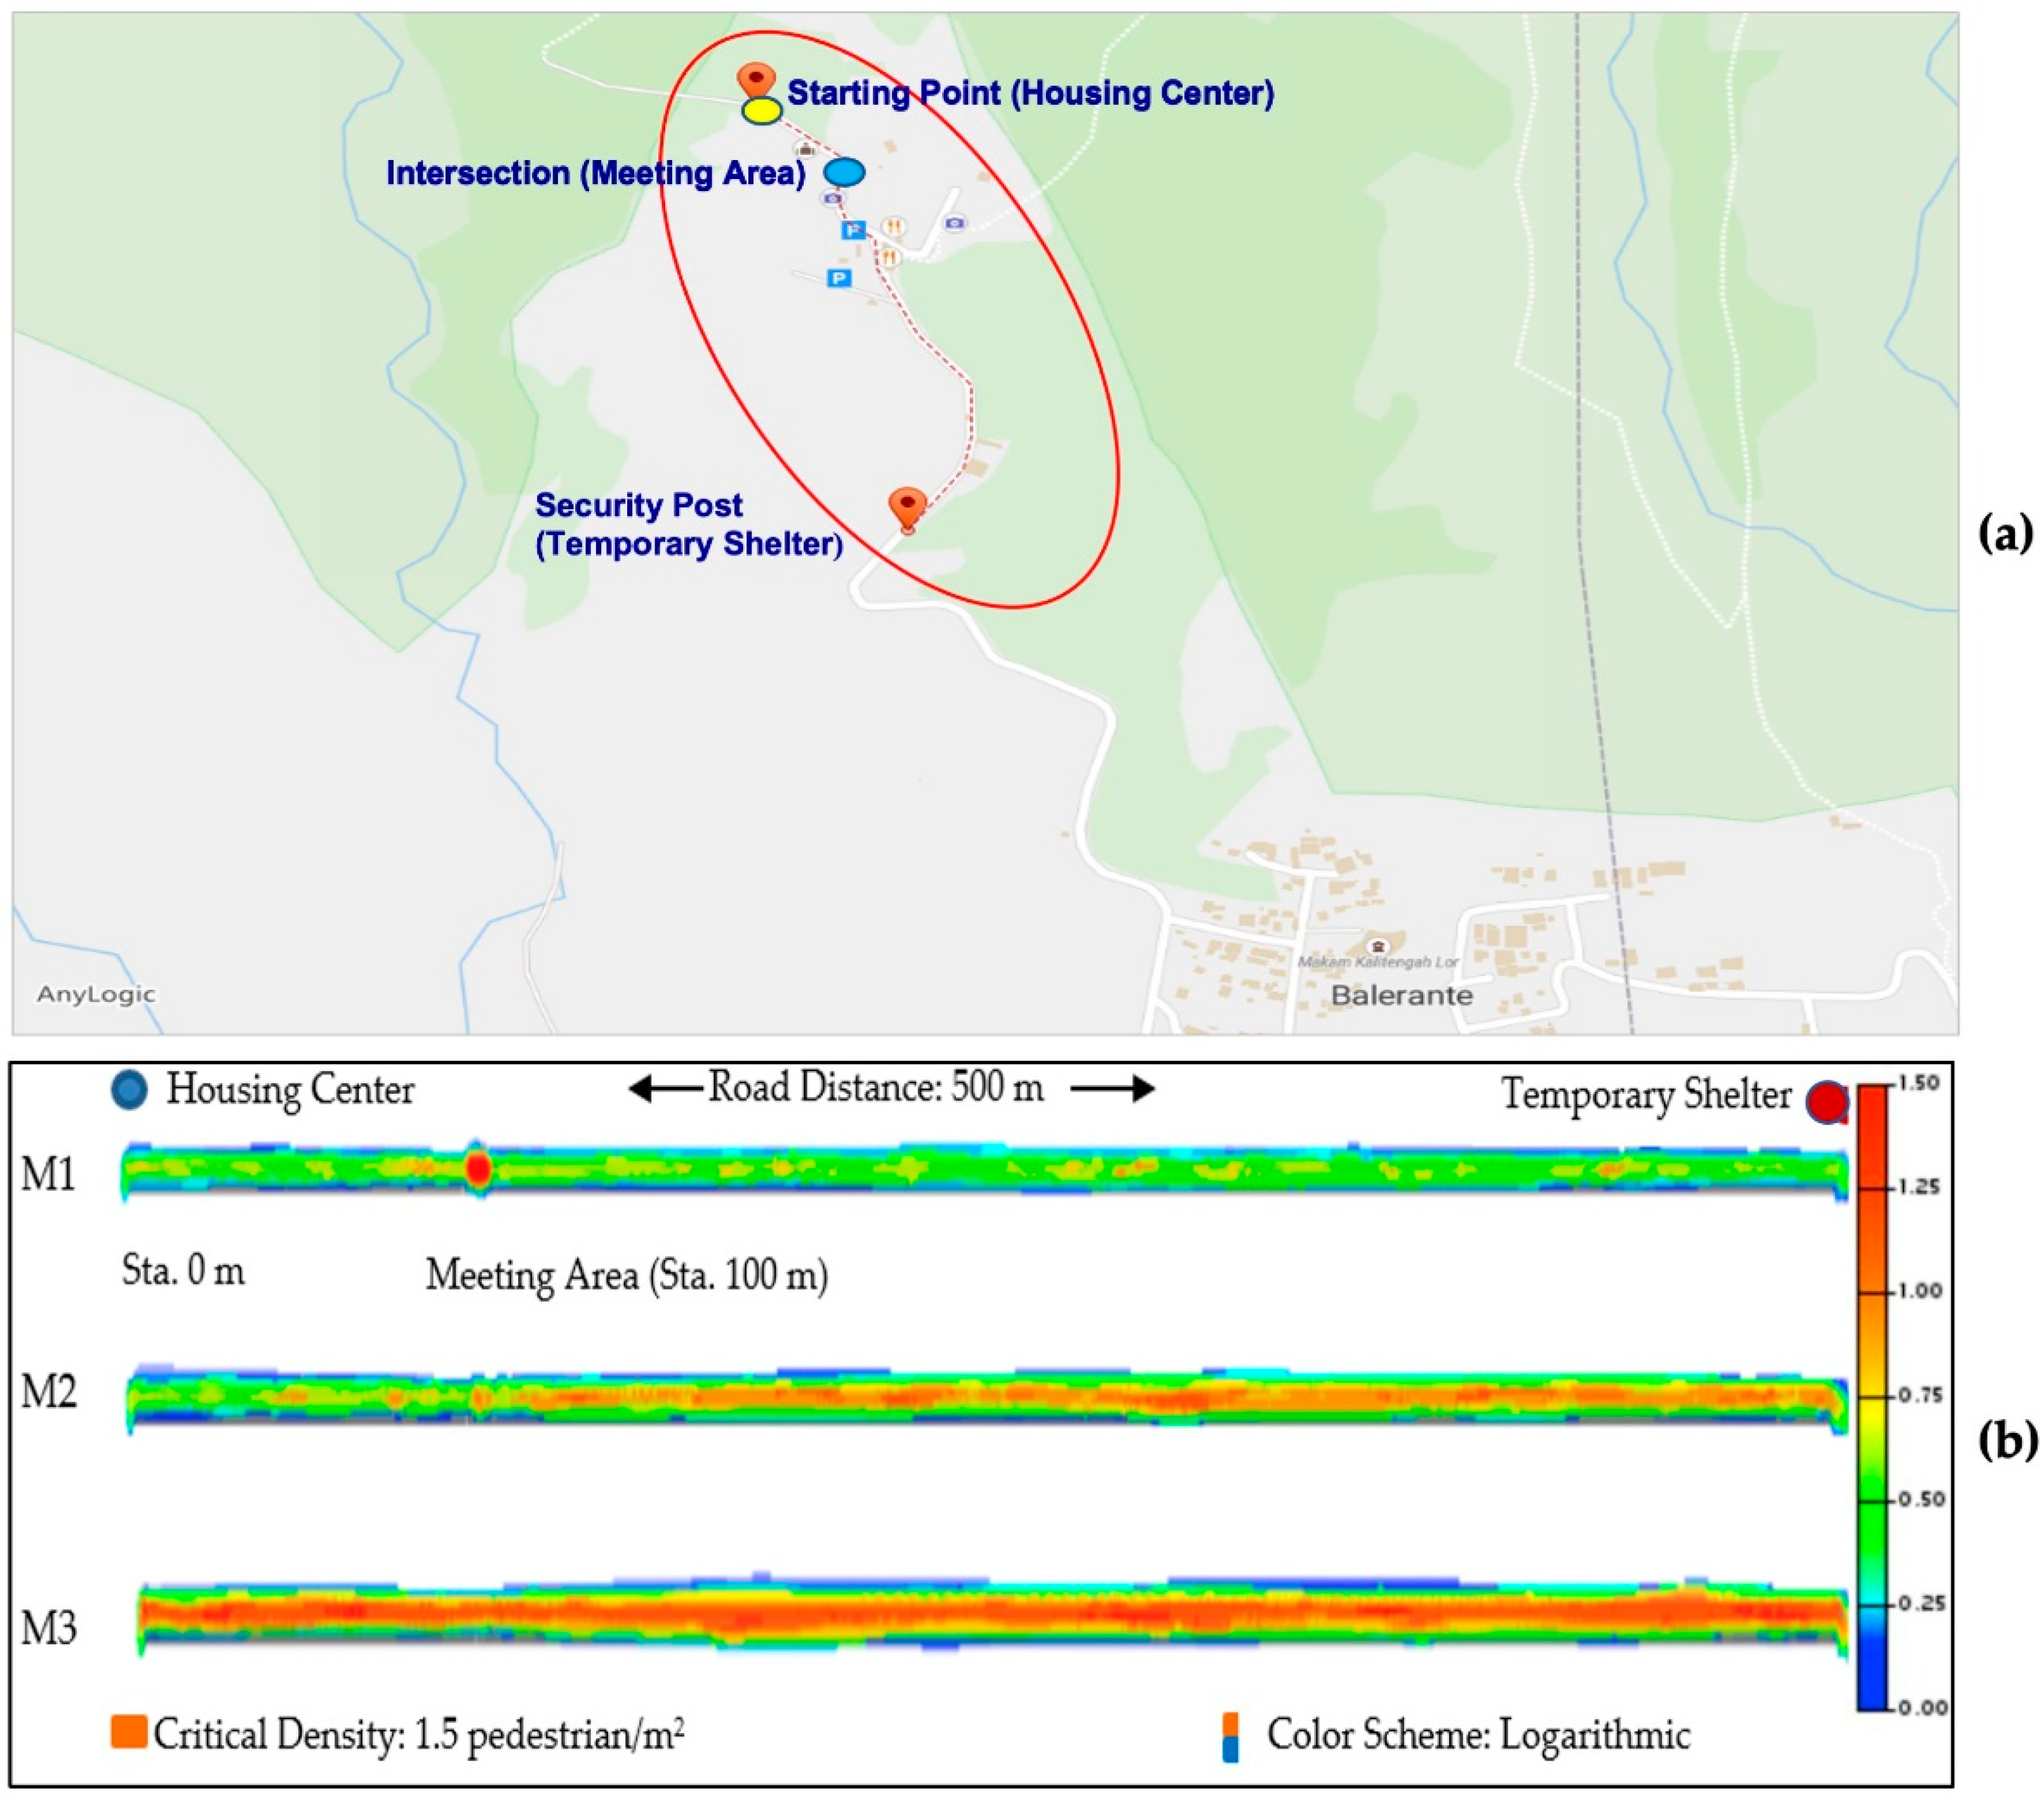
3.5.2. Evacuation Route Model

In this study, we focus on microscopic simulations in which the details of group interactions and behavior of agents can be observed clearly, and the number of people successfully evacuated can be obtained. Therefore, macroscopic simulations using the road network zone were not applied. The simulation uses a scalable pathway animation with actual distance addressed to create an evacuation route. The visualization results do not display location details graphically, but the location and distance of the route segment observed can be known by using the movable camera tools on the software.
The evacuation route distance was created by importing a GIS map to AnyLogic software and converting them into pathway designs based on the real condition of each of the village evacuation maps. The scale was defined graphically with a ruler length corresponding to 5 m (1 m = 10 pixels). A space markup was selected and connected to create a comprehensive route. The target line and rectangular node were used to draw the housing center, assembly point, and temporary shelter. All points were coordinated according to the actual conditions. In this case, the intersection was set as an assembly point before evacuees moved to a temporary shelter. To calculate the evacuation distance shown in Table 1, we also used the Google Maps distance matrix application programming interface to confirm the distance.

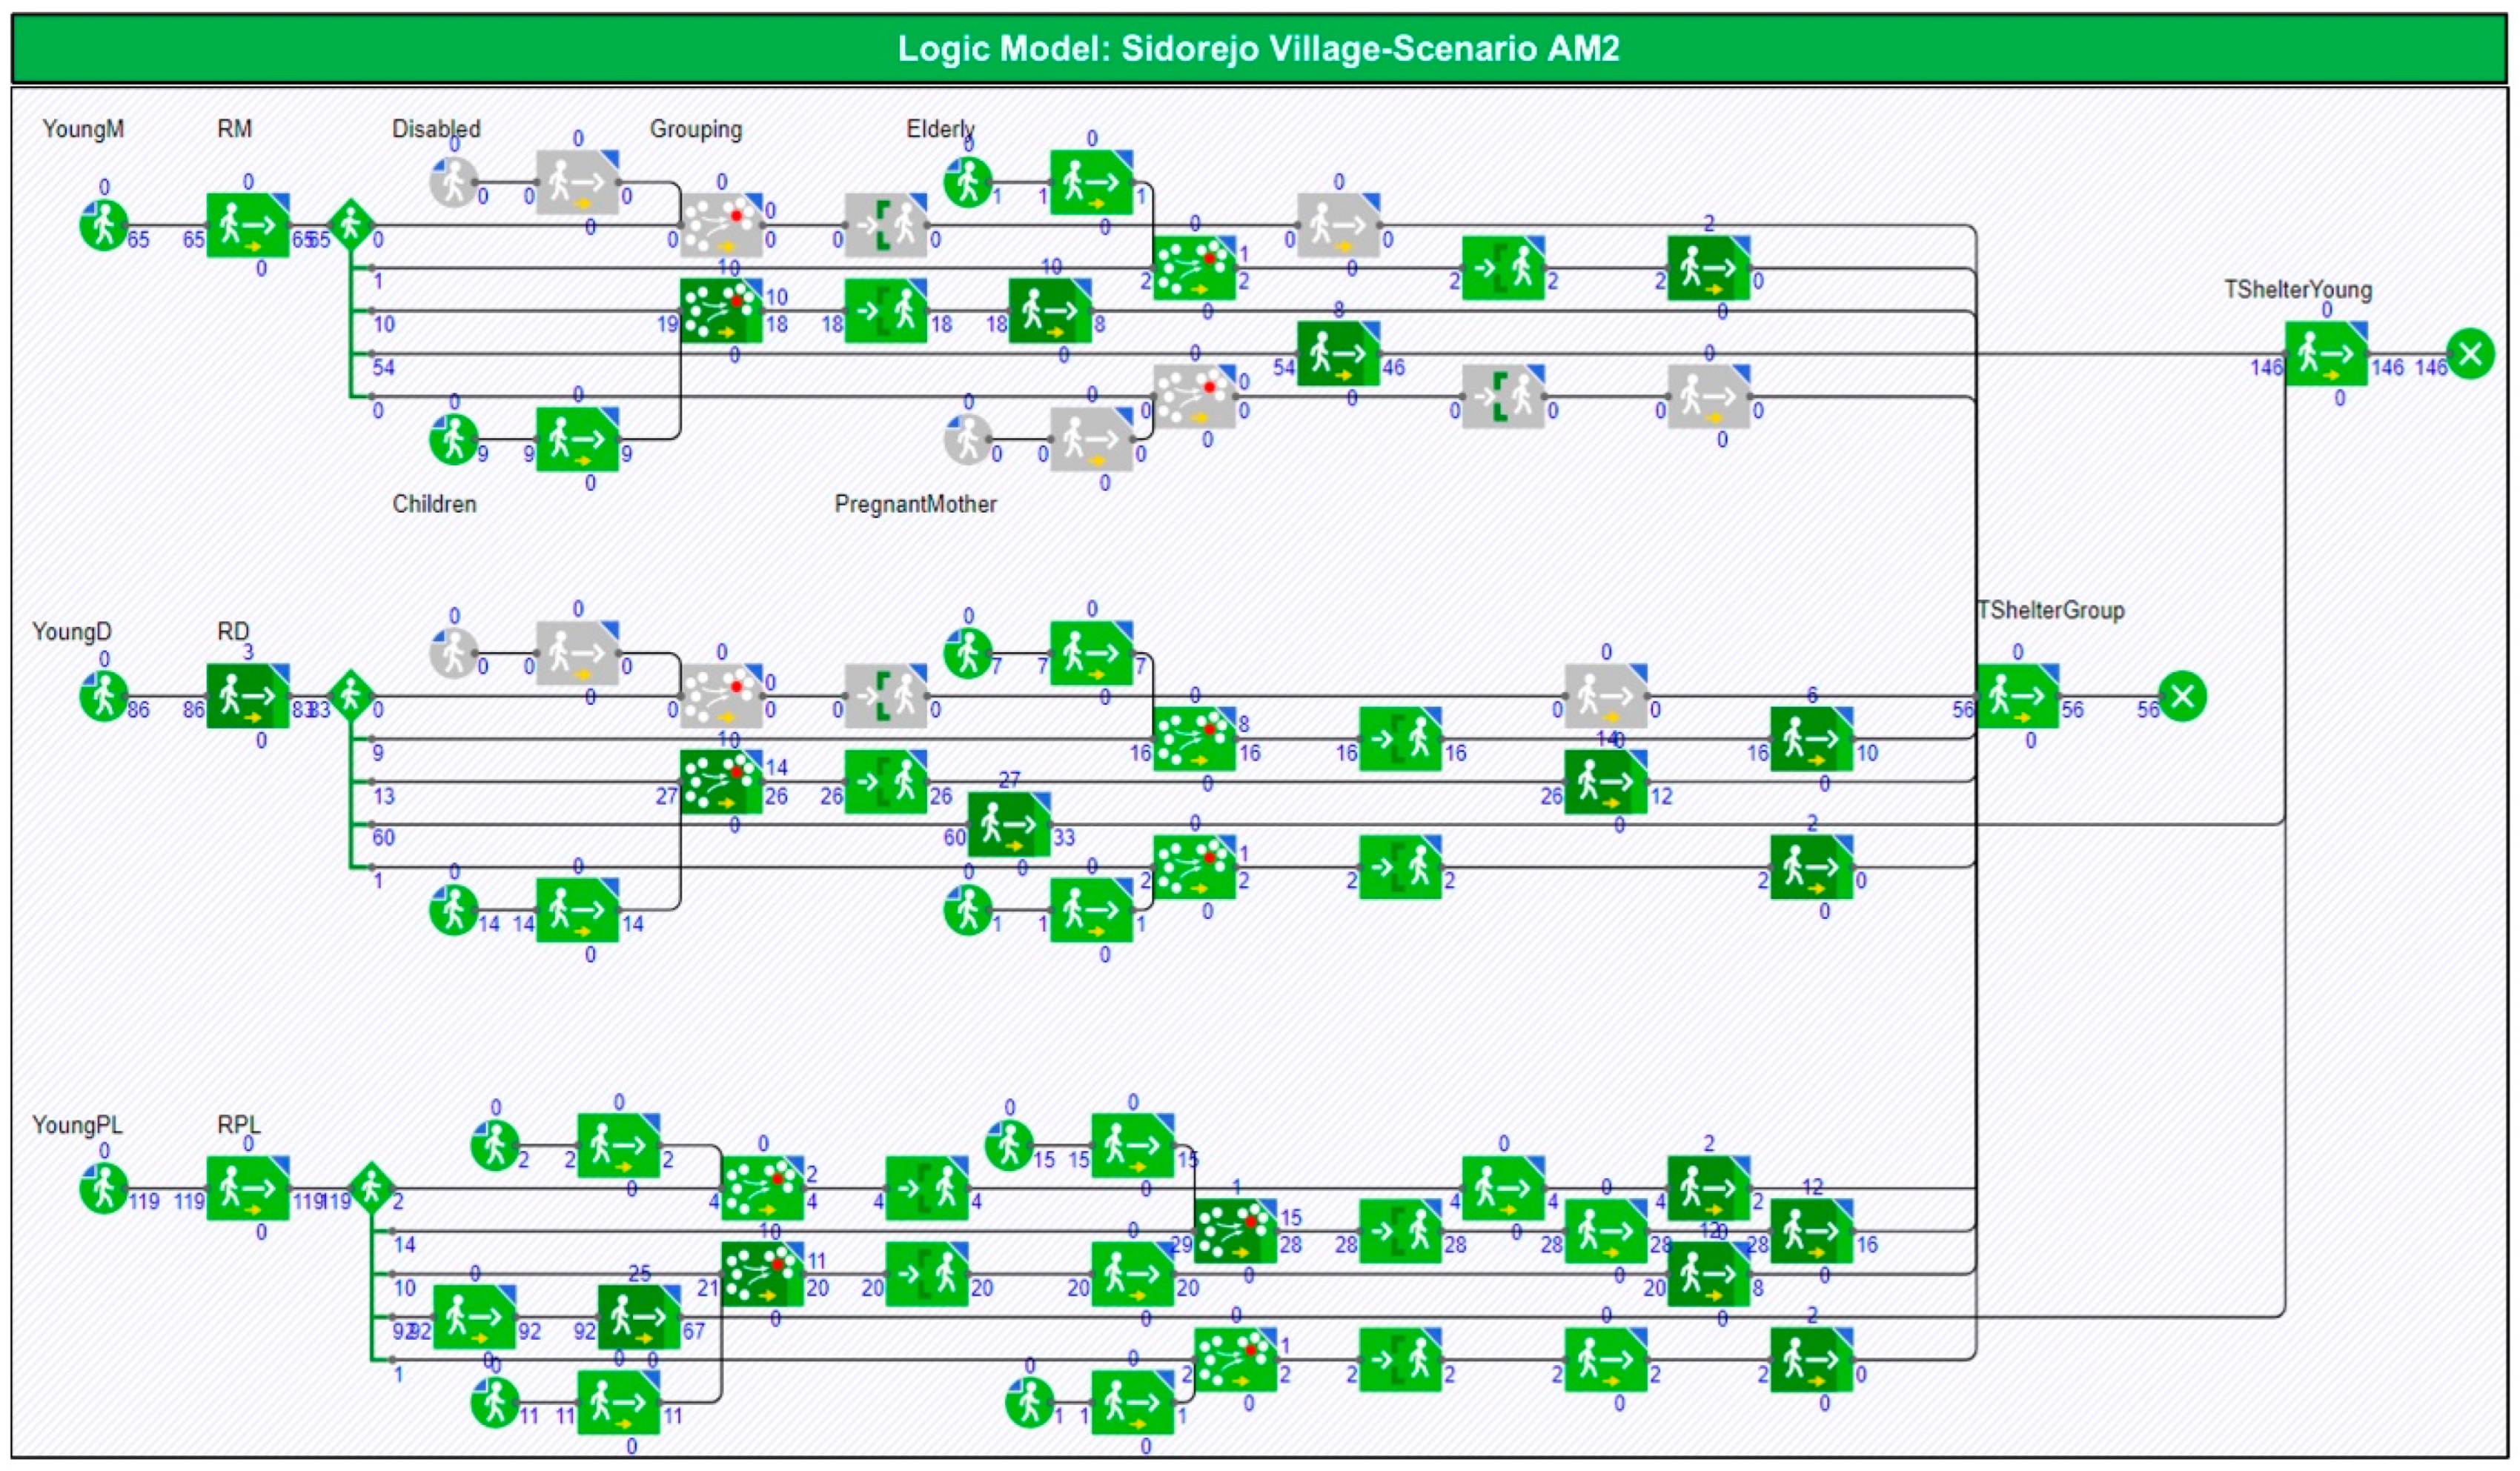
3.5.3. Logic Structure Model

Blocks elected and connected in a certain sequence create an algorithm or scheme for people’s behavior when various events occur [15]. We developed three scenarios using the three models applied in each scenario. Scenario A involved the population walking in the pedestrian evacuation lane. Scenario B involved pedestrians and vehicles moving in the same lane. Scenario C involved pedestrians and vehicles moving in different lanes. In the design of software, the difference in scenarios A, B, and C lies in the road design and logic structure. First, the road design is different because each scenario has a variant agent distribution and lane width. Scenario A only involves pedestrians, so it uses a Pedestrian Library to select a Pathway in Space Markup with 4 m of width. Scenario B involves pedestrians and vehicles with mixed traffic at a width of 4 m, which uses a Pathway in the Pedestrian Library and a Path in the Process Modeling Library. Scenario C chooses a Pathway in the Pedestrian Library and a Road in the Road Traffic Library with a width of 2 m each. Second, there are differences in the logic structure in Blocks selection. Scenario A uses Ped Source, scenario B uses Ped Source and Source, and scenario C uses Ped Source and Car Source. The input data in this logic structure must be connected to the road design tools.
In Model 1 (M1), all participants evacuate independently while walking. In Model 2 (M2), all participants evacuate independently from their homes and assemble at the meeting point. In Model 3 (M3), several young and vulnerable people are grouped from their homes. Nine models were tested in this experiment: AM1, AM2, AM3, BM1, BM2, BM3, CM1, CM2, and CM3. All three models were developed for all affected villages. Figure 4 shows a general illustration of the model comparison, and Table 2 lists detailed locations for the temporary shelters and sister villages.
Currently, M1 is the approach to the latest evacuation scenario adopted by the local government. M2 and M3 were model developments. In M1, a two-minute delay was designed to allow for possible discussion with other people using Ped Wait agent of Blocks. The specific M2 behavior involved coordination and grouping events at the meeting points. Ped Group Assemble and Ped Enter were used to arrange a group size of two people and the mutual assistance group speed. M3 involved a group formation of two to three people to assist children and the elderly and two people per group to assist individuals with disabilities and pregnant mothers. The important parameters in Ped Source and Car Source are arrival rate, speed, and group size. We defined the arrival rate of the agent as the average number of people or vehicles leaving their homes to evacuate. The departure rate distribution of people and vehicles is very complex and differs for each model. A matrix should be created for all models and scenarios in all villages. The type of agent must be made according to the categories of young, the elderly, disabled, children, pregnant mothers, cars, trucks, and motorcycles with their respective speeds as agent parameters. Overall, the difference in the model is only in the logic structure. M1 and M3 have simple structures. M3 does not use the assembled group tool, but the number of people in a group is defined in the group size on Ped Source. The total input arrival rate is listed in Table 1. An example logic chart for scenario CM2 is shown in Figure 5.

3.5.4. Analysis Structure Model

Data sets and time plots were applied to compute the evacuation travel time for successfully evacuated people. The code was executed when a pedestrian or vehicle entered a block in a temporary shelter. This function was crucial for connecting the total agent to the dataset. The dataset, scale, and time axis were also arranged on a time plot. AnyLogic enables the collection of statistics on the density of moving units in the simulated space and displays this information in animated form as a density map. The density map on the space markup is commonly used to detect critical density areas. At the model runtime, if the density values of the area are equal to or greater than the critical density, then the red color appears: The color changes logarithmically from the “minimum” (blue) color to the “maximum” (red) color. The critical density value was 1.5 units/m2; the units were either pedestrians or transporters.

4. Results

4.1. Simulation Performance

Running AnyLogic provided details of the number of people in each block, along with the evacuation flow. People’s movements of leaving home, staying on the road, and arriving at the temporary shelter were displayed. There were 54 simulated models, covering six villages in both regencies. Each village tested nine models, from AM1 to CM3. A visualization of the assembly model is shown in Figure 6. The “in and out” value at the temporary shelter represents the number of successfully evacuated people. The animation at a random point in time for the 2D and 3D images is shown in Figure 7 and confirmed that grouping was formed after the matching process at the meeting point in M2. The movement of mutual assistance is also shown from the start of departure in the M3 animation. Overall, the basic performance results for this simulation are the number of people reaching the temporary shelter so that the effectiveness of a model can be interpreted. The position and number of people moved and delayed on the road can also be identified with this logical structure. Detailed results of scenarios A, B, and C are shown in Section 4.2 and Appendix A.

4.2. Effectiveness of the Mutual Assistance Model and the Traffic Phenomenon

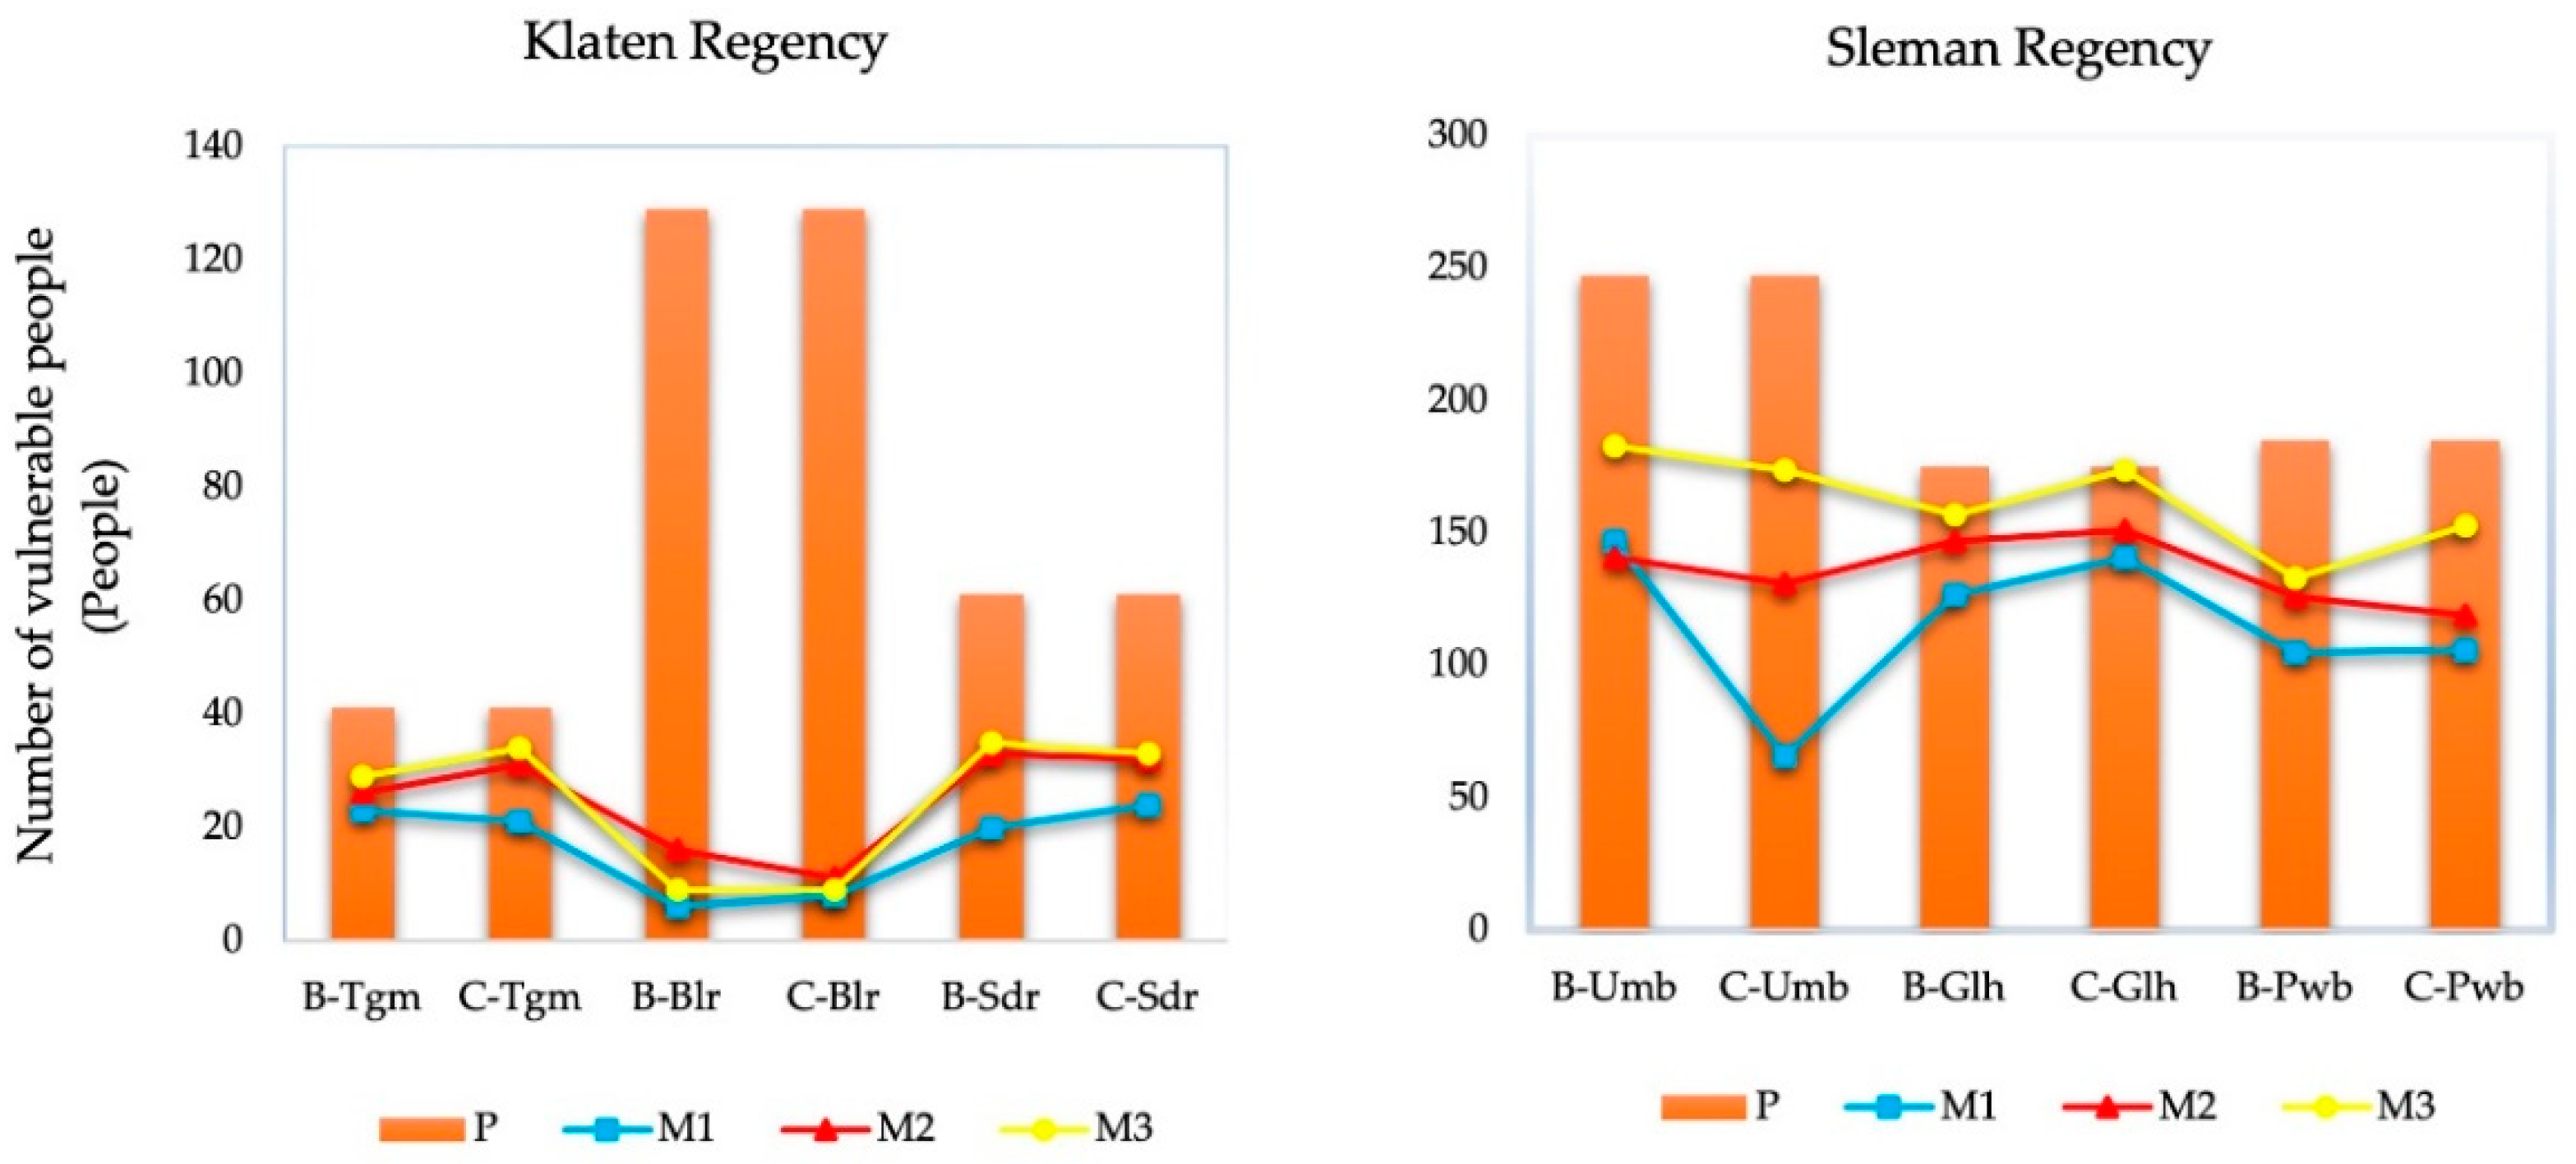
4.2.1. Effect of Mutual Assistance on Pedestrian Evacuation

We found that the assembly model is an effective strategy to support the evacuation of vulnerable people. Scenario A was adopted to identify the differences in the results of the three models and evaluate their impact on evacuation. The recapitulation of the experiment output is presented in Table 3. The results showed that the mutual assistance approach in M2 and M3 was more effective than in M1, which represents the real condition. The percentage increase of successfully evacuated vulnerable people in M3 was the highest for all areas except Balerante village, where M2 has an improvement of 13.95% while M3 is only 1.55%. This result is possibly due to differences in regional characteristics such as achievable walking speed, population distribution between young and vulnerable evacuees, and evacuation distances since Balerante has the farthest evacuation distance compared to the other villages. Overall, a mutual assistance model is advantageous to vulnerable people during volcano evacuation. However, this idea potentially reduces the number of young people arriving at temporary shelters. Despite the decline in young people, the total of individuals arriving increased, which this model can be categorized as a good evacuation. For example, in the Purwobinangun village, the number of young people successfully evacuated in M1 (229 people) was higher than in M2 (214 people) and M3 (195 people). On the other hand, the total of the community reached the destination was greater in M2 (334 people) and M3 (344 people) than in M1 (329 people).

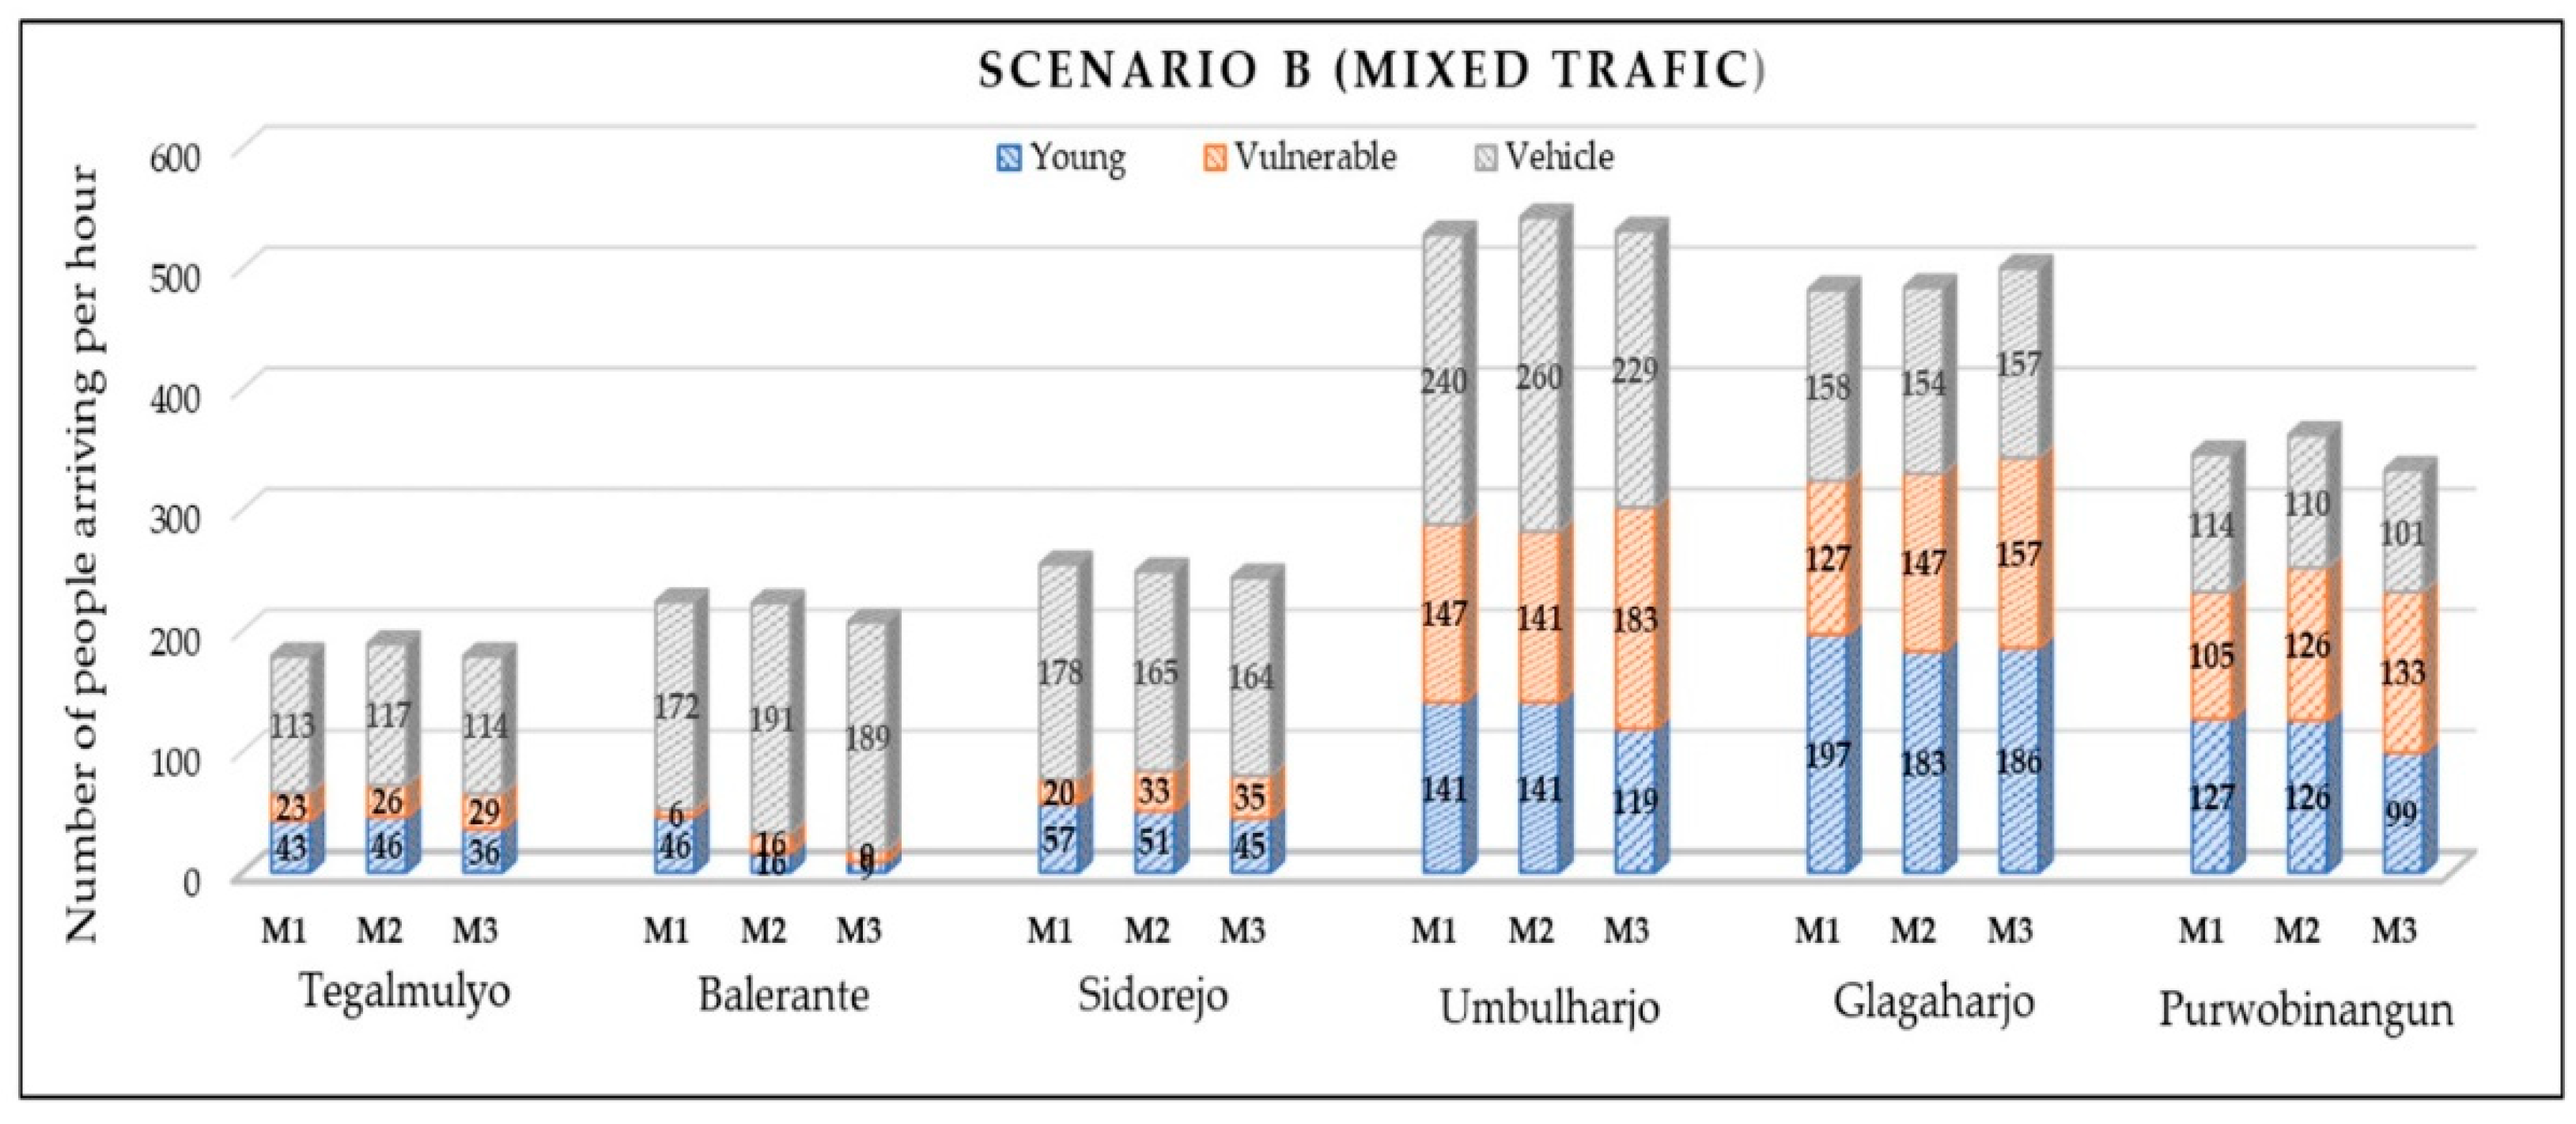
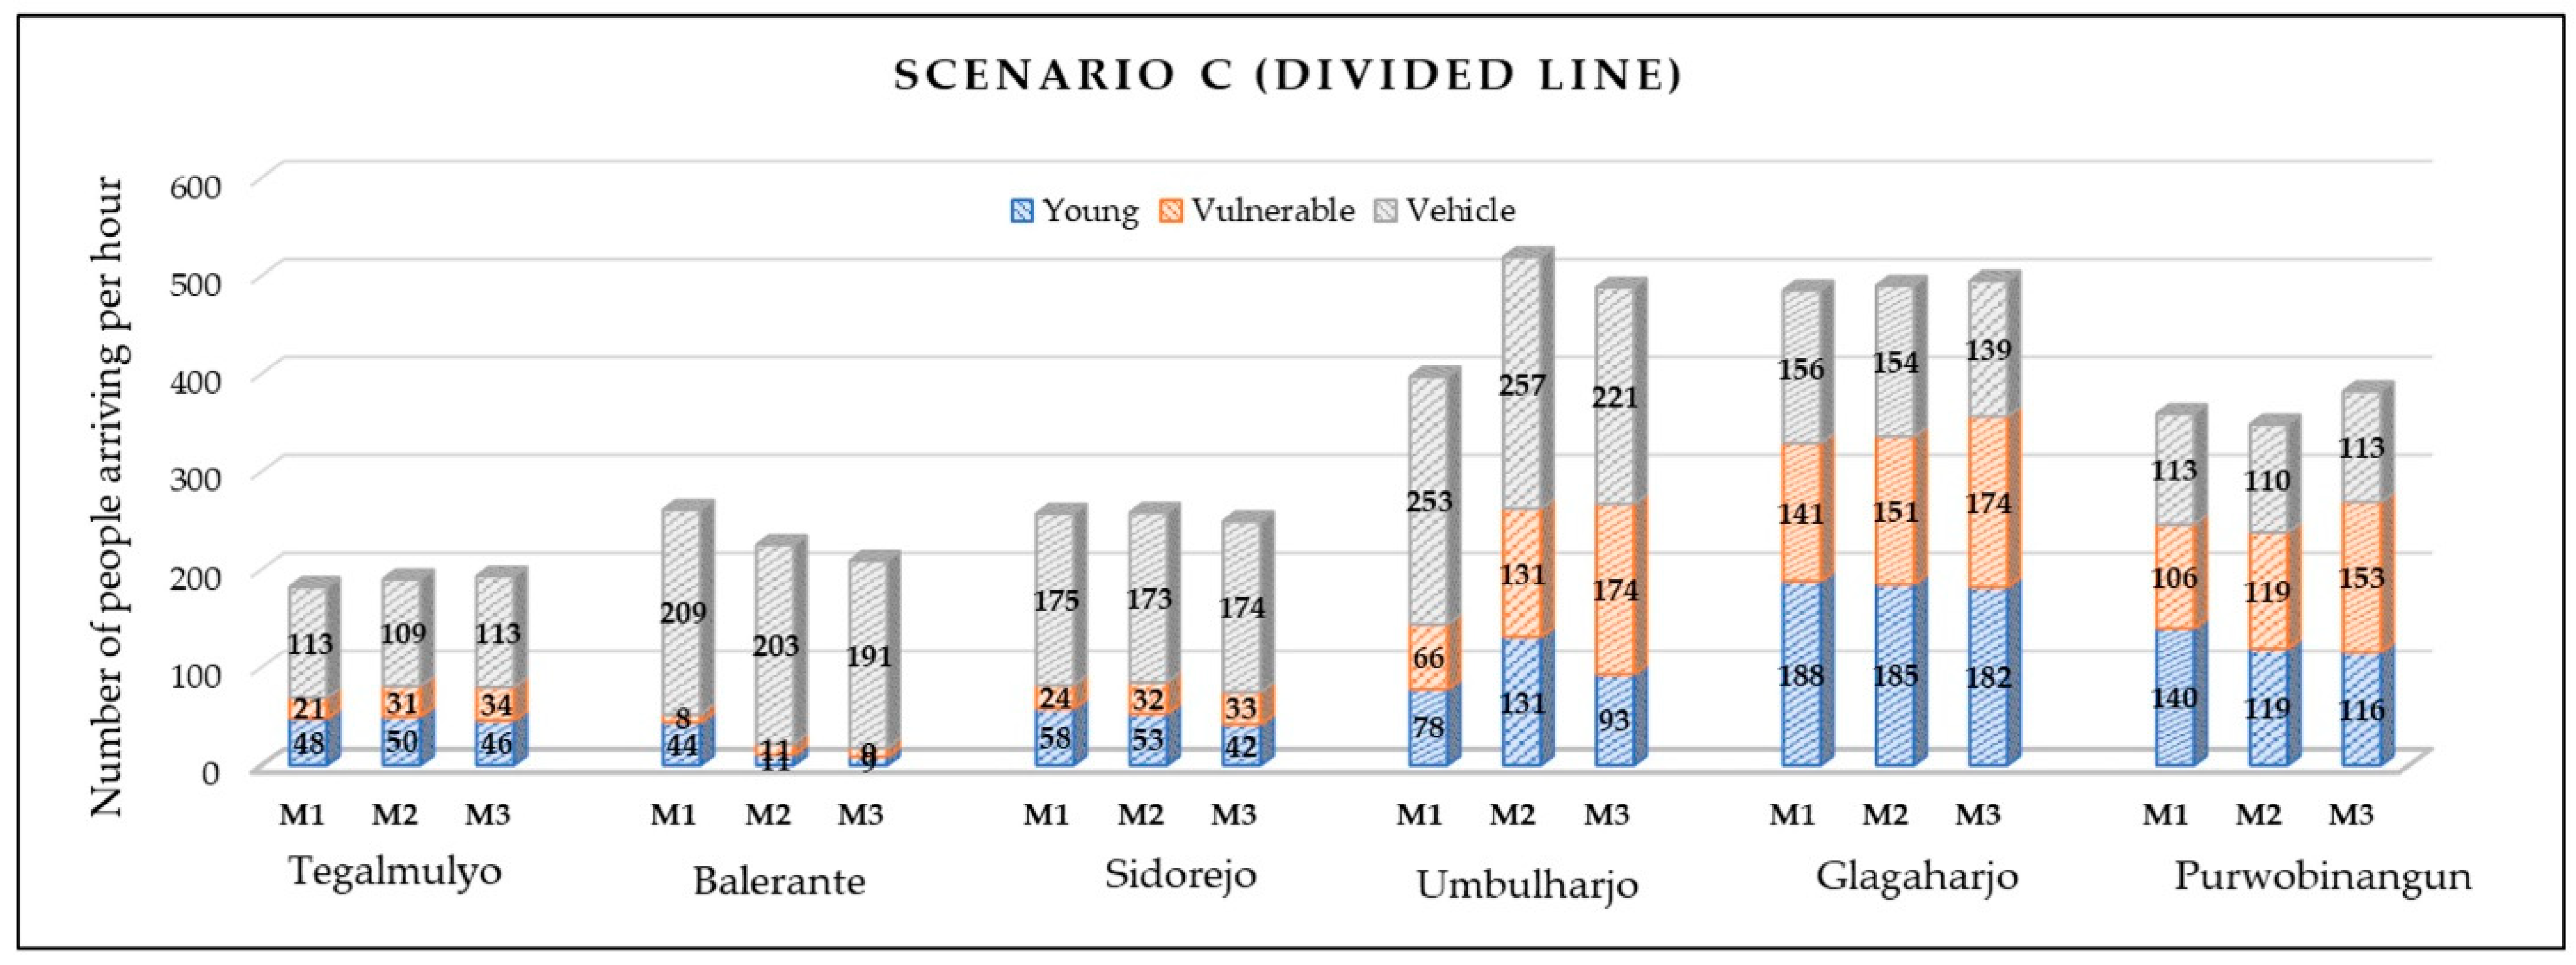
4.2.2. Effect of Traffic Phenomenon

Traffic on rural roads consists of a mix of vehicles and pedestrians. Scenarios B and C included more accurate representations of the actual scenario on a roadway. Simulation results of Scenario B and Scenario C are shown in Appendix A. Figure 8 illustrates the comparison results for the two regencies. The bar chart (P) shows a population of vulnerable people evacuation. The line chart (M1, M2, M3) indicates the number of vulnerable people successfully evacuated. In the case of Sidorejo village (B-sdr and C-Sdr) with a total of 61 vulnerable people, M3 has the greatest score for vulnerable persons’ success, with 35 people in scenario B and 33 in scenario C. Overall, M3 ranked highest in the Klaten Regency for the arrival of vulnerable communities. The exception was in Balerante village, where M2 was most successful, with a score of 16 people in Scenario B and 11 people in Scenario C. The small number of young people in this village may lead to delays in departure for vulnerable people if assembled from home. Because the evacuation distance is also long, the duration of interarrival time for everyone at the temporary shelter is affected, making M3 ineffective. In Sleman Regency, M3 was effective in all areas. This phenomenon is indicated by the M3 line having the highest position among the others.

4.3. Evacuation Time Analysis

Figure 9 shows the distributions of arrivals of agents in scenario C at Tegalmulyo village. The arrival time of each person during the one-hour experiment was obtained. The green, blue, and red lines represent the arrivals of the young people using vehicles, walking young people, and vulnerable people/groups of young and vulnerable people, respectively. In all Models, the young people using vehicles arrive first. The best evacuation time is interpreted by the short interarrival time and a large number of successfully evacuated people. Interarrival time is the interval between arrivals of each person according to the type of agent. The intervals of arrivals tend to be shorter in M3 than that in M1 and M2, which means that the group of vulnerable and young people tend to arrive at a similar time. M3 has the possibility of securing the equality of evacuation of vulnerable people. The graph in Figure 9 illustrates the case of Scenario C in Tegalmulyo. The arrival time sequence of four vulnerable people randomly at the last time of the simulation for M1, M2, and M3 was 52–58 min (3 min of gap), 54–57 min (1 min of gap), and 56–58 min (seconds of gap), respectively, indicating that the pedestrian interarrival time in M3 was relatively short. In this AnyLogic simulation properties, there is an exponential function for the interarrival time of group members, affecting a few seconds gap between vulnerable and young people in group arrivals. This condition leads the arrival time for everyone to be different, and the graph is relatively flat. Overall, the assembly models were more efficient in terms of the interarrival time and numbers of people arriving.

4.4. Density Map Evaluation

Next, the density of the evacuation process was examined. Most impacted regions do not experience road congestion because the number of vehicles in rural areas is limited to local inhabitants. Traffic delays only appeared around the intersection and assembly point. Glagaharjo village had the highest density map. This congestion was caused by the short evacuation distance of 500 m and the large population of 549 people. Figure 10 depicts the density map of this village and illustrates that M3 was verified to be more crowded than M1 and M2. All segments from the housing center, to the meeting point, to the temporary shelter, were red, indicating that there was a critical density of more than 1.5 pedestrians per m2 of road area.

4.5. Validation of the Result

Replicative validity was used to verify this model [20], which requires that the simulation output match the actual data. The retrodiction approach was used as a validation tool [48]; thus, the model was tested using historical data. The current data were loaded into evacuation maps and hazard zones [24,38,39,40,41,42,43,44,49]. The average walking speed parameter was directly assessed (Section 3.3), and the maximum and minimum walking speed ranges were calibrated in the model at a comfortable speed. Meanwhile, the average speed and size of the vehicles were provided by the rules [34,50]. The model was designed in real-time with a scale of 1 and a 60-min stop time. A trial was conducted on the variation of the time model, and the results showed a linear correlation. In replicative validation, we use three analyses to ensure a match between model output and real data. First, in the model, the number of agents leaving for evacuation must be equal to the actual population. The model’s population function was departure (in) = on (the way) + out (arrival). The departure input was the average of the real population; therefore, it has an impact on the simulation outcomes, which may be lower or higher. SPSS software was used to confirm the data comparison for all regions. The one-way ANOVA test results showed a p-value (sig) > 0.05, indicating that the real and simulated evacuation data had no significant difference at the 5% level. Table 4 shows all the scenario results of population validation in reality and in the model. For example, in Scenario AM2 Sidorejo village (Figure 6), the difference between the real data and the model departure was 338 versus 331 people, respectively, with a validation percentage of 2% and a p-value (sig) of 0.934 in all regencies analysis. Second, the group sizes in M2 and M3 were consistent with the group design. The animated display demonstrated that there was a grouping of two people between young and vulnerable people at the meeting point and a grouping of two to three people from the agent source. All the scenarios of the model visualization output have been checked and confirmed well-coordinated, Figure 7 is one example. Third, the evacuation time was calculated manually [51]. The real evacuation time approach is obtained by dividing the evacuation distance (m) by the actual walking speed (v m/s). Comparison between real-time and model results showed no significant difference. The one-way ANOVA test results showed a p-value (sig) > 0.05.

5. Discussion

5.1. Mutual Assistance Model for Merapi Eruption: A Successful Evacuation?

The ratio of saved people to fatalities dictates whether an evacuation has succeeded or failed. However, determining evacuation effectiveness is dependent not only on the number of lives saved but also on how individuals act and their vulnerability throughout the evacuation time [5]. In the existing evacuation contingency for Mount Merapi eruptions, the local government has developed a combination of stages and simultaneous evacuation. However, the government still needs to make a significant effort for the early evacuation step at Level 3 status. Volcano features that must be considered include unpredictable eruption durations since long evacuation periods may lead some people to return home. Moreover, the limited ownership of vehicles and the difficulty of government control present potential risks for vulnerable groups. If a large eruption occurs quickly, inhabitants will be caught off guard, resulting in numerous casualties. A lack of information and hoaxes are also frequent occurrences during emergencies; therefore, a mutual assistance strategy is critical because young people generally receive up-to-date information more quickly and can transfer it to vulnerable people.
This study is the first to consider the government contingency revised in 2019 and focuses on the evacuation of vulnerable groups. The results in all scenarios showed an increase in the number of successfully evacuated vulnerable people when the assembly was modeled. Figure 11 compares Scenarios A, B, and C for both regencies. When several young individuals use vehicles in Scenarios B and C, the number of successfully evacuated young and vulnerable people increases. However, the assembly models in M2 and M3 were only effective for the vulnerable group. On the other hand, a comparison scenario results in Figure 8 can be identified that M3 is the best model according to the line chart. In Except, the Balerante village had the most successful evacuation in M2. Population distribution and distance may have a strong effect on this result. In Table 1, detailed information can be checked. The extremely gap distance between Balerante and other villages concluded M3 is effective for the short evacuation route, and M2 is effective for the long evacuation route. The model presented in this research has significant implications as an effective evacuation strategy for vulnerable people during a volcanic event. The density map in Section 4.4 also identifies the congestion propensity of the evacuation network. These data can be applied to improve rural road infrastructure and estimate the impact of traffic on major highways.

5.2. Effective Mitigation for an Aging Population

Both developed and developing countries have a significant aging population [33]. According to the WHO, Indonesia will have the fifth-highest percentage of older people in the world by 2025 [9]. Evacuating an aging population is very challenging. The results in Section 4.2 confirmed that the Sleman Regency can undertake a more successful evacuation of vulnerable people than the Klaten Regency. This phenomenon occurs because the size of the vulnerable groups in Sleman is larger, and the evacuation distance is short. This assembly model has the potential to become a trend in the future.
In Table 3, the percentage increase in successful evacuees can be calculated and becomes a parameter of evacuation effectiveness. The total population of vulnerable people was evaluated to determine the correlation between the proportion of vulnerable people and the percentage increase in arrivals. The relationship between these two variables is shown in Figure 12, which illustrates that the percentage increase in arrivals will be large if the population of vulnerable people grows. This novel model provides the possibility of future effective and low-cost preparedness and mitigation plans for an aging population. However, if the number of vulnerable people exceeds the number of young people, further studies will be required. Collaboration between the assembly model and the use of vehicles may be more effective. Rahman et al. [52] evaluated transportation alternatives for the aging population, which include owning a self-driving vehicle, using prepaid taxi services, and obtaining rides through community services. The best ratings were given to prepaid taxi services. However, research of this type has not yet been undertaken in a disaster emergency context.

5.3. Applicability for Various Volcanoes and Other Natural Disasters

Vulnerable people are a priority in the evacuation process; however, evacuation times may vary depending on the disaster type and local authority policies. The U.S. Administration on Aging states that there are plans in place for practically every type of disaster [53] and suggests that older people and their families must develop family communication by appointing a key person to coordinate it. Moreover, identifying a meeting area away from the home is crucial. In the volcano context, the local community’s perception has a strong influence on the evacuation decision to stay or leave. Lechner and Rouleau [54] showed that warning messages all had a strong impact on willingness to evacuate in the future eruption at Pacaya volcano, Guatemala. Consequently, the communication factor of evacuation needed to be improved. Niroa and Nakamura [55] confirmed that the local people in Mount Yasur in Vanuatu still believed in a traditional culture and spiritual connection, thus they are difficult to evacuate. In the Mount Semeru volcano eruption in Indonesia, the fatalities found were vulnerable people such as an elderly woman together with her daughter, and a mother carrying her child. Therefore, it is crucial to construct the evacuation model to support the quick evacuation of vulnerable people by young people’s assistance. Updated information and educated young people can also persuade vulnerable people who refuse to evacuate. Mutual assistance was the first study modeled for the actual situation in a volcano and proved to be effective for Mount Merapi. This model may be effective for other volcanoes as well. In fact, volcanoes have a similar problem in terms of community risk perception, weak physical conditions of vulnerable people, limited transportation capacity, limited volunteers by the government, and an increasing elderly population.
As above mentioned, the assembly group approach has previously been successful in the evacuation process during the 2011 tsunami in Japan [10]. A successful evacuation of vulnerable groups was also completed during the 2018 Japan flood: There were no fatalities since all residents escaped safely in time. The local community disaster prevention organization’s registration of vulnerable people in the area is comprehensive: They visited all households and used a multilayered method to monitor all families [56]. In the context of hurricanes, Bian and Wilmot examined transit pick-up points for vulnerable individuals during storm evacuation, revealing the optimal meeting points and undertaking an efficiency analysis [57]. Neighbors and group partners have a direct and strong interconnection in the landslide evacuation process in Mumbai, and the characteristics of social network partners, including their religions, castes, and languages, have a significant influence on evacuation decisions [58]. Based on previous studies, the grouping evacuation strategy, regular monitoring, and pick-up of vulnerable people by government volunteers have been partially reported in several disasters. However, the success of evacuation covering all categories of vulnerable people has not been fully achieved. Differences in characteristics between natural disasters can be evident from the early warning system, duration of the disaster, size, damage, affected area, and others. There is one significant difference between volcanic eruptions and other crises: in volcano eruptions, the disaster duration and evacuation period tend to be longer. This characteristic may be the factor that the mutual assistance model in this study has shown effectiveness and can be applied to other volcanoes. However, for the earthquakes and other disasters having characteristics of shorter duration and warning systems, further studies are needed. The assembly model could potentially be applied to various types of disasters and in various countries having the similarity with Mt Merapi and implement an early evacuation system before the most dangerous status level is declared.

5.4. Limitation and Future Research

The model has several limitations. First, the simulation time should be improved to find the average evacuation time for all populations. Second, the agent category should be expanded since the evacuation of people traveling with livestock was not investigated. Additionally, a combination of mutual assistance with a vehicle can be attempted. Third, in Scenario B, traffic collisions were not considered. Fourth, it remains necessary to determine the extent to which the evacuation distance impacts the effectiveness of this assembly model since we hold that the fatigue factor affects the speed fluctuation.
In the future, integration and cooperation with the government will be critical for the realization of the proposed model, and research and development are still required to define a low-cost and applicable model for risk reduction. Overall, the government may utilize this methodology to ensure the safety of vulnerable populations and shorten evacuation times. Group mapping data are crucial in the early stages, and community participation is necessary for this formation. A registry can aid at-risk populations with emergency planning and response: this database must be updated regularly to account for changes in information among the listed individuals [59]. Additionally, rigorous educational activities should be implemented.

6. Conclusions

This article presents a risk reduction approach for the evacuation of vulnerable people. In our simulation, when residents escaped in groups with mutual assistance model, an increase in the number of vulnerable people reaching the temporary shelters in all scenarios was confirmed. M3 ranked the highest in terms of the amount of successfully evacuated vulnerable people. Further, the results showed that the community will achieve evacuation quickly if it is coordinated from their homes. The proportion of vulnerable people and the evacuation distance were the essential factors that determined the effectiveness of the evacuation. Since the Balerante village had the most successful evacuation in M2, the very long distance is a concern. The phenomenon in Sleman Regency also proves that the trend of M3 is higher than in Klaten Regency due to having a large population and shortest distance. This finding also offers insights for mitigation plans for an aging population and may apply to other disasters with the same issue in the community; however, the mutual assistance model must be re-evaluated when the number of vulnerable people exceeds that of young people. Overall, this technique can be selected as a low-risk and rapid evacuation alternative, while cooperation between the local government and community associations is essential for implementing a mutual assistance strategy.

Author Contributions

Conceptualization, F.C. and H.S.; methodology, F.C.; software, F.C.; validation, F.C. and H.S.; formal analysis, F.C.; investigation, F.C.; data curation, F.C.; writing—original draft preparation, F.C.; writing—review and editing, H.S.; supervision, H.S. All authors have read and agreed to the published version of the manuscript.

Funding

The Next Generation Researcher Challenging Research Program of the Japan Science and Technology Agency (JST) with Grant Number JPMJSP2111 provided funding for English language editing and paper publication.

Institutional Review Board Statement

Not applicable.

Informed Consent Statement

Not applicable.

Data Availability Statement

The data presented in this study are available from the corresponding author upon reasonable request.

Acknowledgments

We gratefully acknowledge the support of the Faculty of Engineering, Yamaguchi University, and the Faculty of Civil Engineering and Planning, Islamic University of Indonesia in conducting this doctoral project.

Conflicts of Interest

The authors declare no conflict of interest.

Appendix A

Figure A1. Simulation result in Scenario B.
Sustainability 14 08110 g0a1
Figure A2. Simulation result in Scenario C.
Sustainability 14 08110 g0a2

References

  1. Ostad-Ali-Askari, K. Management of Risks Substances and Sustainable Development. Appl. Water Sci. 2022, 12, 65. [Google Scholar] [CrossRef]
  2. National Disaster Management Agency. Rencana Nasional Penanggulangan Bencana 2015–2019; National Disaster Management Agency: Jakarta, Indonesia, 2014.
  3. Guha-Sapir, D.; Hoyois, P.; Below, R. Annual Disaster Statistical Review 2015: The Numbers and Trends Centre for Research on the Epidemiology of Disasters (CRED); CRED: Brussels, Belgium, 2016. [Google Scholar]
  4. Jousset, P.; Pallister, J.; Boichu, M.; Buongiorno, M.F.; Budisantoso, A.; Costa, F.; Andreastuti, S.; Prata, F.; Schneider, D.; Clarisse, L.; et al. The 2010 Explosive Eruption of Java’s Merapi Volcano-A “100-Year” Event. J. Volcanol. Geotherm. Res. 2012, 241–242, 121–135. [Google Scholar] [CrossRef] [Green Version]
  5. Mei, E.T.W.; Lavigne, F.; Picquout, A.; De Bélizal, E.; Brunstein, D.; Grancher, D.; Sartohadi, J.; Cholik, N.; Vidal, C. Lessons Learned from the 2010 Evacuations at Merapi Volcano. J. Volcanol. Geotherm. Res. 2013, 261, 348–365. [Google Scholar] [CrossRef]
  6. Klaten Regional Disaster Management Agency. Rencana Kontingensi Menghadapi Ancaman Erupsi Gunung Merapi Di Kabupaten Klaten; Klaten Regency: Central Java, Indonesia, 2018; Volume 1, ISBN 9781119130536.
  7. Liu, Q.; Lu, L.; Zhang, Y.; Hu, M. Modeling the Dynamics of Pedestrian Evacuation in a Complex Environment. Phys. A Stat. Mech. Its Appl. 2022, 585, 126426. [Google Scholar] [CrossRef]
  8. Gaudru, H. Overview of Potential Impact of Eruptions on Volcanic Islands: Global Approaches for Volcanic Risk Mitigation; European Volcanological Society: Geneva, Switzerland, 2004; pp. 1–5. [Google Scholar]
  9. Hakim, L.N. The Urgency of the Elderly Welfare Law Revision. Aspir. J. Masal. Sos. 2020, 11, 43–55. [Google Scholar] [CrossRef]
  10. Alalouf-Hall, D. “The Kamaishi Miracle”: Lessons Learned from the 2011 Tsunami in Japan. Altern. Humanit. Altern. 2019, 10, 148–161. [Google Scholar]
  11. Ma, Y.; Liu, X.; Huo, F. Analysis of Cooperation Behaviors and Crowd Dynamics during Pedestrian Evacuation with Group Existence. Sustainability 2022, 14, 5278. [Google Scholar] [CrossRef]
  12. Chasanah, F.; Sakakibara, H. Assessment of Social Vulnerability in the Evacuation Process from Mount Merapi: Focusing on People’s Behavior and Mutual Assistance. IDRiM J. 2021, 10, 46–65. [Google Scholar] [CrossRef]
  13. Hardiansyah, H.; Priyanto, S.; Muthohar, I.; Suparma, L.B. Effect of Merapi Disaster Evacuation on Road Network Performance in Yogyakarta Special Region. Int. J. Sci. Appl. Technol. 2018, 3, 1. [Google Scholar]
  14. Heppenstall, A.J.; Malleson, N.S.; Carver, S.J.; Quincey, D.J.; Manville, V.R. Modelling Individual Evacuation Decisions during Natural Disasters: A Case Study of Volcanic Crisis in Merapi, Indonesia. Geosciences 2018, 8, 196. [Google Scholar] [CrossRef] [Green Version]
  15. Jumadi, J.; Carver, S.J.; Quincey, D.J. An Agent-Based Evaluation of Varying Evacuation Scenarios in Merapi: Simultaneous and Staged. Geosciences 2019, 9, 317. [Google Scholar] [CrossRef] [Green Version]
  16. Maharani, Y.N.; Lee, S.; Ki, S.J. Social Vulnerability at a Local Level around the Merapi Volcano. Int. J. Disaster Risk Reduct. 2016, 20, 63–77. [Google Scholar] [CrossRef] [Green Version]
  17. Nugraha, A.L.; Firdaus, H.S.; Haeriah, S. Analysis of Risk Assessment of Mount Merapi Eruption in Settlement Area of Sleman Regency. IOP Conf. Ser. Earth Environ. Sci. 2019, 313, 012003. [Google Scholar] [CrossRef] [Green Version]
  18. Jumadi, J.; Malleson, N.; Carver, S.; Quincey, D. Estimating Spatio-Temporal Risks from Volcanic Eruptions Using an Agent-Based Model. Jasss 2020, 23, 2. [Google Scholar] [CrossRef] [Green Version]
  19. Burger, A.; Oz, T.; Kennedy, W.G.; Crooks, A.T. Computational Social Science of Disasters: Opportunities and Challenges. Future Internet 2019, 11, 103. [Google Scholar] [CrossRef] [Green Version]
  20. Hawe, G.I.; Coates, G.; Wilson, D.T.; Crouch, R.S. Agent-Based Simulation for Large-Scale Emergency Response: A Survey of Usage and Implementation. ACM Comput. Surv. 2012, 45, 1–51. [Google Scholar] [CrossRef] [Green Version]
  21. Avdeeva, M.; Uzun, O.; Borodkina, Y. Simulation of the Evacuation Process at Various Economic Facilities Using the Anylogic Software Product. E3S Web Conf. 2020, 175, 11031. [Google Scholar] [CrossRef]
  22. Zuo, J.; Shi, J.; Li, C.; Mu, T.; Zeng, Y.; Dong, J. Simulation and Optimization of Pedestrian Evacuation in High-Density Urban Areas for Effectiveness Improvement. Environ. Impact Assess. Rev. 2021, 87, 106521. [Google Scholar] [CrossRef]
  23. Liu, L.; Chen, H. Microscopic Simulation-Based Pedestrian Distribution Service Network in Urban Rail Station. Transp. Res. Interdiscip. Perspect. 2021, 9, 100313. [Google Scholar] [CrossRef]
  24. Sayudi, D.S.; Nurnaning, A.; Juliani, D.J.; Muzani, M. Peta Kawasan Rawan Bencana Gunung Api Merapi Jawa Tengah Dan Daerah Istimewa Yogyakarta 2010 (Merapi Hazard Map, Central Java and Yogyakarta Special Region Provinces). Available online: https://bpptkg.esdm.go.id/pub/page.php?idx=358 (accessed on 9 December 2019).
  25. Purnomo, S. Sunartono Peraturan Bupati Sleman Nomor 20 Tahun 2011 Tentang Kawasan Rawan Bencana Gunungapi Merapi; Sleman Regency Government: Yogyakarta, Indonesia, 2011; pp. 1–13.
  26. Abdurrachman, E. Geologic Des Produits de I’ Activite Historique et Contribution a I’Evaluation Des Risques Au Merapi (Java), Indonesia. Ph.D. Thesis, Universite d’Orleans, Orleans, France, 1998. [Google Scholar]
  27. Abdurachman, E.K.; Bourdier, J.L.; Voight, B. Nuées Ardentes of 22 November 1994 at Merapi Volcano, Java, Indonesia. J. Volcanol. Geotherm. Res. 2000, 100, 345–361. [Google Scholar] [CrossRef] [Green Version]
  28. Ministry of Energy and Mineral Resources; Geological Disaster Technology Research and Development Center. Laporan Aktivitas Gunung Merapi Tanggal 2–8 July 2021; Geological Disaster Technology Research and Development Center: Yogyakarta, Indoneisa, 2021.
  29. Ministry of Energy and Mineral Resources; Center for Volcanology and Geological Hazard Mitigation. Peningkatan Status Aktivitas Gunung Merapi Dari Level II Ke Level III; Geological Disaster Technology Research and Development Center: Yogyakarta, Indonesia, 2020.
  30. Transportation Research Board. Highway Capacity Manual; Transportation Research Board: Washington, DC, USA, 2000; ISBN1 0309066816. ISBN2 0309067464. [Google Scholar]
  31. Roess, R.P.; Prassas, E.S.; McShane, W. Traffic Engineering, 4th ed.; Peason: London, UK, 2011; ISBN 9780136135739. [Google Scholar]
  32. Wiley, J.S. Traffic Engineering Handbook, 7th ed.; Wiley: Hoboken, NJ, USA, 2016; ISBN 9780760768587. [Google Scholar]
  33. World Health Organization. Active Ageing: A Policy Framework; WHO: Madrid, Spain, 2002. [Google Scholar]
  34. Ministry of Transportation Republic of Indonesia. Peraturan Menteri Perhubungan Republik Indonesia Nomor PM 111 Tahun 2015, Tentang Tata Cara Penetapan Batas Kecepatan; Ministry of Transportation: Jakarta, Indonesia, 2015.
  35. Palinkas, L.A.; Horwitz, S.M.; Green, C.A.; Wisdom, J.P.; Duan, N.; Hoagwood, K. Purposeful Sampling for Qualitative Data Collection and Analysis in Mixed Method Implementation Research. HHS Public Access 2015, 42, 533–544. [Google Scholar] [CrossRef] [PubMed] [Green Version]
  36. Tongco, M.D.C. Purposive Sampling as a Tool for Informant Selection. Ethnobot. Res. Appl. 2007, 5, 147–158. [Google Scholar] [CrossRef] [Green Version]
  37. Regional Disaster Management Agency (BPBD Sleman). Rencana Kontijensi Erupsi Gunungapi Merapi; Sleman Regional Disaster Management Agency: Yogyakarta, Indonesia, 2019.
  38. Tegalmulyo Village Authority. Dokumen Rencana Kontijensi Bencana Erupsi Merapi Desa Tegalmulyo 2019; Tegalmulyo Village Authority: Klaten, Indonesia, 2019.
  39. Umbulharjo Village Authority. Dokumen Rencana Kontinjensi Bencana Erupsi Merapi Desa Umbulharjo 2019; Umbulharjo Village Authority: Yogyakarta, Indonesia, 2019.
  40. Glagaharjo Village Authority. Dokumen Rencana Kontijensi Bencana Erupsi Merapi Desa Glagaharjo 2019; Glagaharjo Village Authority: Yogyakarta, Indonesia, 2019.
  41. Purwobinangun Village Authority. Dokumen Rencana Kontijensi Bencana Erupsi Merapi Desa Purwobinangun 2019; Purwobinangun Village Authority: Yogyakarta, Indonesia, 2019.
  42. Tegalmulyo Village Authority. Hasil Assessment Desa Tegalmulyo 2020; Tegalmulyo Village Authority: Klaten, Indonesia, 2020.
  43. Balerante Village Authority. Data Analisis PRB Desa Balerante 2020; Balerante Village Authority: Klaten, Indonesia, 2020.
  44. Sidorejo Village Authority. Data KK dan Aset Keluarga Desa Sidorejo 2019; Sidorejo Village Authority: Klaten, Indonesia, 2019.
  45. Taylor, S.J. Agent-Based Modeling and Simulation; Palgrave Macmillan: Jakarta, Indonesia, 2014. [Google Scholar]
  46. Gilbert, N. Agent-Based Models; SAGE Publications: London, UK, 2008; ISBN 978-1-4129-4964-4. [Google Scholar]
  47. Karaaslan, E.; Noori, M.; Lee, J.Y.; Wang, L.; Tatari, O.; Abdel-Aty, M. Modeling the Effect of Electric Vehicle Adoption on Pedestrian Traffic Safety: An Agent-Based Approach. Transp. Res. Part C Emerg. Technol. 2018, 93, 198–210. [Google Scholar] [CrossRef]
  48. Troitzsch, K.G. Validating Simulation Models. In Proceedings of the Proceeding’s 18th European Simulation Multiconference Graham Horton, Erlangen, Germany, 13 June 2004. [Google Scholar]
  49. Republic of Indonesia. Geospatial Untuk Negeri. Available online: https://tanahair.indonesia.go.id/portal-web (accessed on 12 October 2021).
  50. Ministry of Public Works and Housing; Direktorat Jenderal Bina Marga (DJBM). Pedoman Desain Geometrik Jalan 2020; Kementrian Pekerjaan Umum dan Perumahan Rakyat-Direktorat Jenderal Bina Marga: Jakarta, Indonesia, 2020.
  51. Transportation Research Board. HCM 2010-Highway Capacity Manual, Volume 1: Concepts; Transportation Research Board: Washington, DC, USA, 2010; ISBN 9780309160773. [Google Scholar]
  52. Rahman, M.M.; Deb, S.; Strawderman, L.; Smith, B.; Burch, R. Evaluation of Transportation Alternatives for Aging Population in the Era of Self-Driving Vehicles. IATSS Res. 2020, 44, 30–35. [Google Scholar] [CrossRef]
  53. Benson, W.F. Disaster Planning Tips for Older Adults and Their Families. 2013. Available online: https://www.cdc.gov/aging/pdf/disaster_planning_tips.pdf (accessed on 22 May 2022).
  54. Lechner, H.N.; Rouleau, M.D. Should We Stay or Should We Go Now? Factors Affecting Evacuation Decisions at Pacaya Volcano, Guatemala. Int. J. Disaster Risk Reduct. 2019, 40, 101160. [Google Scholar] [CrossRef]
  55. Niroa, J.J.; Nakamura, N. Volcanic Disaster Risk Reduction in Indigenous Communities on Tanna Island, Vanuatu. Int. J. Disaster Risk Reduct. 2022, 74, 102937. [Google Scholar] [CrossRef]
  56. Ohtsu, N.; Hokugo, A.; Cruz, A.M.; Sato, Y.; Araki, Y.; Park, H. Evacuation of Vulnerable People during a Natech: A Case Study of a Flood and Factory Explosion in Japan. Int. J. Disaster Resil. Built Environ. 2021, 1759–5908. [Google Scholar] [CrossRef]
  57. Bian, R.; Wilmot, C.G. An Analysis on Transit Pick-up Points for Vulnerable People during Hurricane Evacuation: A Case Study of New Orleans. Int. J. Disaster Risk Reduct. 2018, 31, 1143–1151. [Google Scholar] [CrossRef]
  58. Subhajyoti, S.; Hirokazu, T. Where Do Individuals Seek Opinions for Evacuation? A Case Study from Landslide-Prone Slum Communities in Mumbai. J. Nat. Disaster Sci. 2015, 36, 13–24. [Google Scholar] [CrossRef] [Green Version]
  59. Center for Disease Control and Prevention (CDC). Planning for an Emergency: Strategies for Identifying and Engaging At-Risk Groups; Center for Disease Control and Prevention (CDC): Chamblee, GA, USA, 2015; ISBN 7704883410.
Figure 1. Map of Merapi volcano hazard zone (KRB I, II, III) and evacuation area at Level 3 within a radius of 5–6 km in Klaten and Sleman Regencies. The inset maps show the location of Mount Merapi on Java Island and in Indonesia.
Sustainability 14 08110 g001
Figure 2. Research framework, including four methods that involve measuring walking speed, surveying stakeholders and the local community, the simulation model, and an evaluation.
Sustainability 14 08110 g002
Figure 3. AnyLogic software simulation design of Merapi evacuation.
Sustainability 14 08110 g003
Figure 4. Three evacuation models: In M1, all residents evacuate independently; in M2, some young and vulnerable evacuees assemble at the meeting point; in M3, evacuees group at their homes.
Sustainability 14 08110 g004
Figure 5. A logic scheme for M2 in Kalitengah Lor. The green chart indicates pedestrian flow, and the black chart indicates vehicle flow. Group D, Group E, Group C, and Group PM are assembled between young people and vulnerable people.
Sustainability 14 08110 g005
Figure 6. Assembly model visualization of Scenario A in Sidorejo village with code AM2. The result shows the young and vulnerable people form a pedestrian group at the meeting point. A total of 56 people arrived at the temporary shelter, comprising 28 young and 28 vulnerable individuals.
Sustainability 14 08110 g006
Figure 7. Animated model of Scenario C in Umbulharjo (Pangukrejo). CM1 illustrates self-evacuation in Model 1. CM2 shows Model 2 in 3D, with the young and vulnerable coordinating at the intersection and traveling in pairs. CM3 shows Model 3 in 2D, with the group that forms at homes.
Sustainability 14 08110 g007
Figure 8. Simulation results in Scenario B and C for Klaten and Sleman regencies. P is the number of vulnerable people, and M1, M2, and M3 represent the number of vulnerable people arriving at the temporary shelters within one hour. The results show that not all of them were successful in evacuating for one hour. M3 ranks highest for the number of vulnerable people arriving in all locations except for Balerante, where the highest score was observed with M2.
Sustainability 14 08110 g008
Figure 9. The people’s arrival time distribution in the temporary shelter at the last minute of the simulation in the case of Scenario C in Tegalmulyo village. All population left to evacuate with a distribution of 119 young people using vehicles, 24 young people self evacuate, and 82 young and vulnerable evacuate together. The vertical axis shows the arrivals number and the horizontal axis represent the interarrival time of each person in seconds. The green line is the vehicle arrival time flow, the blue line shows the arrival time of young people, and the red line describes vulnerable people’s arrival in independently or grouping. Panel (a) presents the results of M1 with approximately 3 min of interarrival time and 58.81 min for the last vulnerable person to arrive. Panel (b) displays the results of M2 with an interarrival time of 1 min (57.83 min of the last person). Panel (c) presents the results of M3 with an interarrival time in sec (58.33 min of the last person). Overall, M3 had the best evacuation time for vulnerable people based on the interval between arrivals and total arrivals.
Sustainability 14 08110 g009
Figure 10. Density map of Scenario C in Glagaharjo. Panel (a) present the evacuation route according to the GIS map in AnyLogic. Panel (b) shows that M3 leads to more congestion than the other models. Evacuees walking in pairs from their homes to the temporary shelter increases road density.
Sustainability 14 08110 g010
Figure 11. Comparison between Scenarios A (all evacuees walk) and B and C (vehicles are used). Scenarios B and C are effective for increasing the successful evacuation rates of young and vulnerable people. M2 and M3 are effective for improving the successful evacuation rates of vulnerable people.
Sustainability 14 08110 g011
Figure 12. Correlation between percentage of vulnerable people and number of arrivals. Increased distribution of vulnerable people leads to more effective mutual assistance models.
Sustainability 14 08110 g012
Table 1. Evacuation distance and distribution of evacuees.
VillagesHamletsWidth (m)Distance (km)Young People with Vehicle Young Pedestrians Vulnerable Pedestrians Total Population
Klaten Regency
TegalmulyoCanguk4244221884
Pajegan4220141549
Sumur41.55529892
Total 1196541225
BaleranteSambungrejo44.7423838118
Ngipiksari44453434113
Sukarejo43.723222267
Gondang43.4903030150
Ngelo43.6165526
Total 216129129474
SiderejoMbangan42.544211075
Deles42.4633022115
Petung Lor42.7734629148
Total 1809761338
Sleman Regency
UmbulharjoPangukrejo41.5268247247762
GlagaharjoKalitengah Lor40.5158216175549
PurwobinangunTurgo41.2122185185492
Table 2. Detailed shelter locations.
VillageHamletsMeeting PointTemporary ShelterShelter/Sister Village
Klaten Regency
TegalmulyoCangukIntersectionTegalmulyo Village OfficeDemak Ijo Village
PajeganIntersectionTegalmulyo Village OfficeDemak Ijo Village
SumurIntersectionTegalmulyo Village OfficeDemak Ijo Village
BaleranteSambungrejoIntersectionBalerante Village OfficeKebondalem Lor Village
NgipiksariIntersectionBalerante Village OfficeKebondalem Lor Village
SukarejoIntersectionBalerante Village OfficeKebondalem Lor Village
GondangIntersectionBalerante Village OfficeKebondalem Lor Village
NgeloIntersectionBalerante Village OfficeKebondalem Lor Village
SiderejoMbanganIntersectionSidorejo Village OfficeMenden Village
DelesIntersectionSidorejo Village OfficeMenden Village
Petung LorIntersectionSidorejo Village OfficeMenden Village
Sleman Regency
UmbulharjoPangukrejoIntersectionMerapi Garden CangkringanPlosokerep Barrack, Umbulharjo
GlagaharjoKalitengah LorIntersectionSecurity Post, Kalitengah LorGayam Barrack, Argomulyo
PurwobinangunTurgoIntersectionTritis Field, TurgoPurwobinangun Barrack, Watuadeg
Table 3. Simulation results in Scenario A.
AreaModelPopulation Numbers Arriving at Temporary Shelter (People/h)Percentage Increase in Arrivals of Vulnerable People (%)
YoungVulnerableTotal
Klaten Regency
Tegalmulyo
(Canguk, Pajekan, Sumur)
M113222154
M2154241784.88
M31442917317.07
Balerante
(Sambungrejo, Ngipiksari, Ngelo, Gondang, Sukarejo)
M1988106
M2842611013.95
M38010901.55
Sidorejo
(Mbangan, Ndeles, Petung Lor)
M115926185
M2174282023.28
M31623319511.48
Sleman Regency
Umbulharjo
(Pangukrejo)
M117853231
M229911941826.72
M326612238827.94
Glagaharjo
(Kalitengah Lor)
M1332133465
M234316050315.43
M331416848220.00
Purwobinangun
(Turgo)
M1229100329
M221412033410.81
M319514934426.49
Table 4. Data comparison between real and model output using a One-Way ANOVA test. The results show that p value (sig) > 0.05 in all scenarios. It indicates that the populations of real and model outputs match.
ScenariosSum of SquaresdfMean SquareFSig.
AM1Between Groups494.0831494.0830.0150.904
Within Groups323,302.8331032,330.283
Total323,796.91711
AM2Between Groups234.0831234.0830.0070.934
Within Groups328,746.8331032,874.683
Total328,980.91711
AM3Between Groups10.083110.0830.0000.987
Within Groups343,120.1671034,312.017
Total343,130.25011
BM1Between Groups1121.33311121.3330.0340.857
Within Groups325,729.3331032,572.933
Total326,850.66711
BM2Between Groups720.7501720.7500.0210.887
Within Groups341,238.1671034,123.817
Total341,958.91711
BM3Between Groups456.3331456.3330.0120.915
Within Groups378,832.6671037,883.267
Total379,289.00011
CM1Between Groups588.0001588.0000.0170.898
Within Groups338,922.6671033,892.267
Total339,510.66711
CM2Between Groups330.7501330.7500.0100.923
Within Groups333,582.1671033,358.217
Total333,912.91711
CM3Between Groups126.7501126.7500.0040.953
Within Groups339,792.1671033,979.217
Total339,918.91711
Publisher’s Note: MDPI stays neutral with regard to jurisdictional claims in published maps and institutional affiliations.

