Abstract
At present, the collection and analysis of large amounts of key data for the visual quality assessment of streets are performed manually. The assessment efficiency is not high, and the effective information is not fully explored. This study aims to establish an intelligent method for assessing the visual quality of streets. Taking the Hexi District of Tianjin as an example and using street view images as the assessment medium, an assessment model of objective physical indicators is established based on PaddleSeg, an assessment model of subjective perceptual indicators is established based on neural image assessment, and a visual quality assessment model of streets is established based on a random forest. The above models can intelligently evaluate the visual quality of streets and key indicators affecting visual quality. The influence of each key indicator on the visual quality of streets and the relationship between objective physical indicators and subjective perceptual indicators are analyzed. Through a combination of subjective and objective as well as qualitative and quantitative methods, the results show satisfactory assessment accuracy. In short, this study uses machine-learning techniques to improve the scientific rigor and efficiency of visual quality assessment and expand the scale of visual quality assessment data.
Keywords:
visual quality; assessment method; machine learning; street; landscape; street view images 1. Introduction
1.1. Importance and Significance of the Visual Quality Assessment of Streets
Streets with high visual quality not only meet people’s physiological and psychological needs, but such streets also provide a beautiful landscape, which means it encourages pedestrian use, increases street life, and provides visual pleasure and more contact with greenery and trees to increase the comprehensive attractiveness and influence of the city. Hence, effective visual quality assessment of the landscape can provide objective and efficient research methods as well as a theoretical basis for urban planning, landscape architecture, and streetscape. The US began the study of the assessment of the visual quality of streets in the 1960s, enacting the Wilderness Act [1], the National Environmental Policy Act [2], etc. From the 1970s to the 1980s, the US launched the Visual Management [3], Visual Resource Management [4], and Landscape Resource Management systems [5]. With the construction of a human settlement environment moving from “quantity” to “quality”, the visual quality of streets has become gradually emphasized. Thus far, many countries have proposed various street design initiatives and urban renewal policies, such as the Streetscape Guidance [6], Street Design Manual [7], Sydney Streets Code [8], Shanghai Street Design Guidelines [9], and Beijing Urban Design Guidelines for Street Renewal Governance [10]. The effective visual quality assessment of streets can improve the architectural quality and spatial environment quality of cities, enhance the living environment, and shape a characteristic urban image, and hence, it is an important research field in urban spatial form research and landscape design. Moreover, it is an important topic in landscape and urban planning.
1.2. Assessment Potential of Artificial Intelligence Techniques
The emergence of new techniques and methods provides a rare opportunity for the accurate, automated, and scientific assessment of the visual quality of streets. In particular, artificial intelligence techniques and the processing and analysis capabilities of big data provide a rare opportunity for the construction of digital assessment methods for street visual quality. Machine learning has the following advantages over traditional manual feature recognition. First, it can automatically learn from image data and better extract features. Second, machine training is simpler and easier, and the weight-sharing feature of the convolutional layer makes the network model simpler. Third, it has strong robustness and generalization ability. In addition, the expansion of the model structure is strong; it can cope with more complex classification problems and expression ability is improved [11]. Specifically, the progress in accuracy, efficiency, and intelligence is obvious, and it even surpasses human performance in some fields.
Recently, machine learning has made excellent progress in the fields of feature extraction, image recognition and generation, and video analysis, providing scientific, efficient, and intelligent methods for the large-scale, high-precision, and high-efficiency measurement of key indicators in visual quality evaluation, as well as the relationship between key indicators and visual quality as well as the inference of the relationship between each key indicator [12]. For instance, Li et al. used convolutional neural network (CNN) model to segment the images and identify different urban features in the study of the openness of urban street canyons [13]. Naik et al. evaluated the security of urban spaces using the Street Score algorithm based on the features contained in Google Street View images for five cities in the US [14,15]. Al-Sayed and Penn noted that the artificial neural network (ANN) model was trained to outline that street accessibility may be determined by street width, building height, neighborhood density, and retail land use [16]. Using Baidu Street View images, Tang and Long combined Street View Pictures (SVPs) and CNN tools (SegNet) to evaluate the visual quality of street spaces, proposing a method to assess the visual quality of large street spaces and to be able to identify changes, using the Hutong area in Beijing as an example [17]. Moreover, a study by Ye et al. proposed a method for quantitatively measuring the visual quality of streets in Shanghai using machine learning algorithm [18]. Zhang et al. applied a deep learning model in the field of computer vision-scene understanding to analyze the evolution of preferences and behaviors of inbound tourists in Beijing [19].
In this paper, a new concept of the visual quality assessment of streets is proposed. The research is based on machine learning techniques to measure the visual quality of streets and determine the key indicators affecting visual quality. The relationships among objective physical indicators, subjective perceptual indicators, and visual quality of streets are analyzed. The relationship between each key indicator is discussed. The study establishes a set of scientific and effective methods for the intelligent assessment of street visual quality. First, the established model assesses street visual quality quickly and accurately, and the results are more convincing when large-scale streetscape data are used to obtain additional training samples. Second, the assessment model not only outputs scores for the objective physical indicators of streets, but also outputs scores for subjective perceptual indicators and visual quality. Again, large-scale data analysis can help researchers more objectively analyze the impact of objective indicators and subjective indicators for the visual quality of streets, as well as investigating the relationship between objective and subjective indicators to identify problem areas and propose updating measures to strengthen the constituent indicators of the street system. This study is conducive to establishing a comfortable street environment for residents, meeting the needs of urban design practice, and improving the quality of street space. In addition, this approach further realizes the intelligence and digitalization of visual quality assessment and optimizes the quality of street construction.
2. Literature Review
2.1. Theories and Methods of Visual Quality Assessment
In the 1960s, a series of international discussions on the quality of urban streets emerged, followed by many classical studies. For example, Lynch proposed that roads are the leading indicator of the five indicators of urban imagery and distinctive street spaces can add charm to cities [20]. Ashihara pioneered the use of the height-to-width ratio of the street to measure the sense of street space [21]. Jacobs argued that streets are the vital expression of urban vitality and that a vibrant street is necessarily a blend of diversity [22]. Through direct observations on streets, Whyte objectively showed the use of public space and explored the development of a benign construction of urban street space from the perspective of everyone [23].
In terms of visual quality assessment, assessment methods focus on two approaches: expert/design approaches and public perception-based approaches [24]. The former is an objectivist approach that translates the physical characteristics of the landscape into the key indicators affecting visual quality [25]. In this approach, experts evaluate the quality according to the corresponding regulations and standards and draw up recommendations for landscape planning and design or resource management. The shortcoming of this approach is its insufficient precision [26]. The assessment is carried out by a few experts, who have insufficient reliability [27]. They are restricted to objective reference standards, and therefore, rely too heavily on assessment parameters with insufficient validity [28]. The latter is a subjectivist approach, in which the observer ranks and grades the quality of the landscape and other factors, emphasizing people’s subjective perceptions. Its assessment reliability and accuracy are higher [29]. The shortcomings are that it requires a large amount of complex information processing and key information collection. Moreover, assessment mainly relies on manual tasks, it gradually lags behind in processing accuracy and efficiency, and lacks large-scale data support. In recent years, to balance the relationship between the indicators of physical characteristics of the landscape and human subjective perceptions, practical research mostly adopts a comprehensive assessment method combining subjective and objective approaches, as represented by the psychophysical approach. The scenic beauty evaluation (SBE) method proposed by Daniel and Bost is a typical example [30].
2.2. Indicators and Criteria of Visual Quality Assessment
The current assessment of the visual quality of streets focuses on two aspects: the composition of objective indicators based on the street environment and the subjective perception of people [31]. Therefore, key indicators affecting visual quality are mainly divided into objective physical indicators based on expert/design approaches and subjective perceptual indicators based on public perception-based approaches. In this paper, these indicators are referred to as objective and subjective indicators, respectively.
The selection of key indicators is the basis and key of visual quality assessment. In the existing studies, researchers often choose different key indicators to evaluate the quality of the landscape according to the different topics of the study and their professional knowledge [32]. In their study of environmental quality and landscape preferences, Kaltenborn et al. noted that watered woodlands, cultural landscapes, and traditional agricultural environments provide a better aesthetic experience [33]. Pflüger et al. consider river flow as an important factor in evaluating the aesthetic value of a river [34]. In the study of visual evaluation of streetscape, Han et al. proposed six quantitative indicators to measure the objective attributes of streetscape: visual entropy, color richness index, skyline change index, street width, building height along the street, and sky openness index [35]. Tieskens et al. related landscape elements to preferences, arguing that physical elements, management intensity, and cultural value and meaning determine how a cultural landscape is perceived and valued [36]. Han et al. used several indicators of walls, buildings, sky, trees, and roads to study perceived psychological stress in the urban built environment [37].
Although there are abundant research results on the selection of landscape quality key indicators, there is no consensus among researchers on the influence effects of some indicators in the visual quality of landscape. In terms of the research object, it mainly focuses on studying the indicators of a certain landscape type. In terms of the research method, it mainly adopts a one-to-one approach to solve the analysis of the relationship between key indicators and aesthetic quality, and the use of mathematical models to analyze the relationship between multiple landscape features and aesthetic quality. The collection and measurement of key indicators mainly rely on manual collection and processing of complex information, and a large amount of data resources are not effectively used. At the same time, it is difficult to refine the measured data, and the assessment efficiency and accuracy are low. Moreover, it is difficult to obtain the basic data of some streets.
2.3. Needs and Difficulties
In summary, the current problems and challenges in the assessment of the visual quality of urban streets include the following: First, because of the high cost of evaluating objective and subjective indicators, the scale of collected assessment data is not large. The detail and accuracy of the visual quality assessment is limited, and it is difficult to analyze these data in depth quantitatively. Second, although there is a comprehensive use of multiple techniques, the studies that introduce artificial intelligence assistance mostly focus on the segmentation and identification of images of the objective indicators of the street, and fewer studies focus directly on the assessment of subjective indicators as well as the assessment of the visual quality of the street. Third, compared with the research on other theories of the street, there is limited research on the interrelationship between objective and subjective indicators or the relationship between each indicator and visual quality. Moreover, there is a shortage of effective analysis approaches that integrate the above information. Therefore, an automated intelligent assessment method that integrates expert approaches and public perception-based approaches is needed to realize the efficient and accurate assessment of large-scale data, with the ultimate goal of promoting the research on the visual quality of streets and providing effective information for urban design practice.
3. Materials and Methods
3.1. Study Area
This study takes a human-centered perspective and was conducted in the Hexi District of Tianjin, China. Hexi District is located in the central city of Tianjin and is the seat of Tianjin’s municipal government. With a district area of 48.17 square kilometers, 14 neighborhoods, 149 communities, and a resident population of 820,000, it is an ideal research object in terms of street types and groups of interest. In 2022, Hexi District was carrying out a plan to strengthen the construction of landscaping and improve the quality of urban streets. An intelligent assessment of the visual quality of streets in Hexi District could improve the quality and speed of urban landscape renewal in Tianjin and provide an important research method and scientific basis for addressing the development of other street spaces.
Tianjin streets are divided into traffic roads (transportation-oriented roads) and non-traffic roads (other urban streets) according to their functional class. Specifically, traffic roads mainly consist of expressways, trunks, bridges, tunnels, and transportation-oriented primary roads. In the visual quality assessment of urban streets, non-traffic roads receive more attention and are more likely to obtain positive assessments. Therefore, this study does not consider transportation-oriented roads at this time. In our future study, we plan to make a specific assessment of these transportation-oriented roads.
3.2. Analytical Framework
This study contains five main phases (Figure 1):
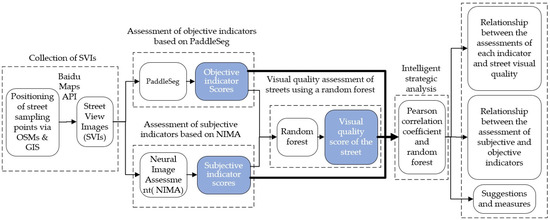
Figure 1.
Analytical framework.
- (1)
- The collection of SVIs. These images were obtained using Open Street Maps (OSMs), Geographic System Information System (GIS), and Baidu Street View Map application programming interface (API).
- (2)
- The assessment of objective indicators based on PaddleSeg. The PaddleSeg machine learning method, which is based on expert approaches, was used to identify the objective indicators, measure the percentage of objective indicators of the street in each image, and score the objective indicators using SVIs.
- (3)
- The assessment of subjective indicators based on neural image assessment (NIMA). Based on the public perception-based approaches, the deep-learning NIMA model was used to score the subjective indicators using SVIs.
- (4)
- The visual quality assessment of streets using a random forest. A random forest model was established to obtain the visual quality score of the street to be evaluated using the objective indicator assessment of a small number of samples, subjective indicator assessment of the samples, and manual assessment of the visual quality of the streets in the samples.
- (5)
- Intelligent strategic analysis of street visual quality, which includes an analysis of the relationship between the assessments of each indicator and street visual quality, the relationship between the assessments of subjective and objective indicators (especially the interpretability of objective indicator scores with respect to subjective indicator scores), and providing suggestions and measures for optimizing street landscape quality.
3.2.1. Collection of SVIs
To assess the spatial characteristics of streets in Tianjin more comprehensively, we used a mature approach to evaluate street images: first, we performed street positioning and screening using OSMs with GIS; second, the images of each street were collected through the Baidu Street Map API.
This study analyzes the Hexi District of Tianjin using a location map from March 2022 (Figure 2). First, 5470 roads in the study area were filtered from the OSM roads based on the maximum and minimum values of longitude and latitude in Hexi District. Second, the administrative area attribution API of Baidu Street Map was queried to extract 3572 roads belonging to Hexi District. Then, roads classed as highway, trunk, and similar classes were discarded, and living street, secondary, residential, and similar class roads were retained, resulting in a total of 1544 roads.
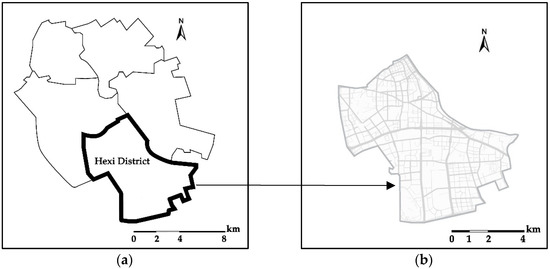
Figure 2.
Study area: (a) location of Hexi District in Tianjin, China; (b) map of Hexi District.
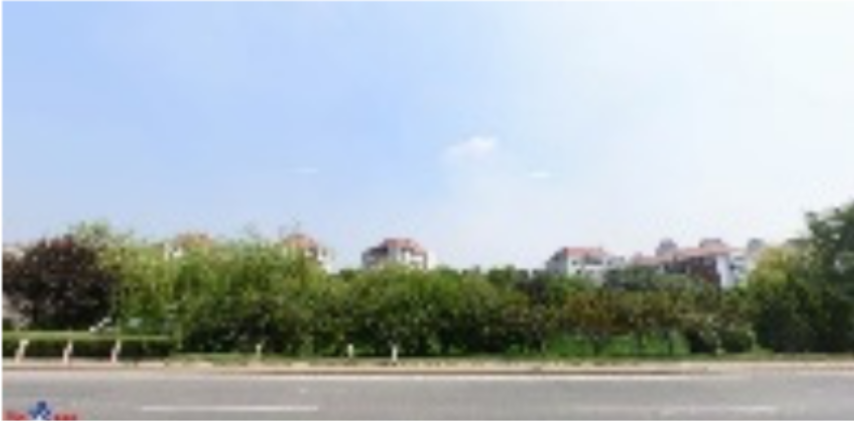
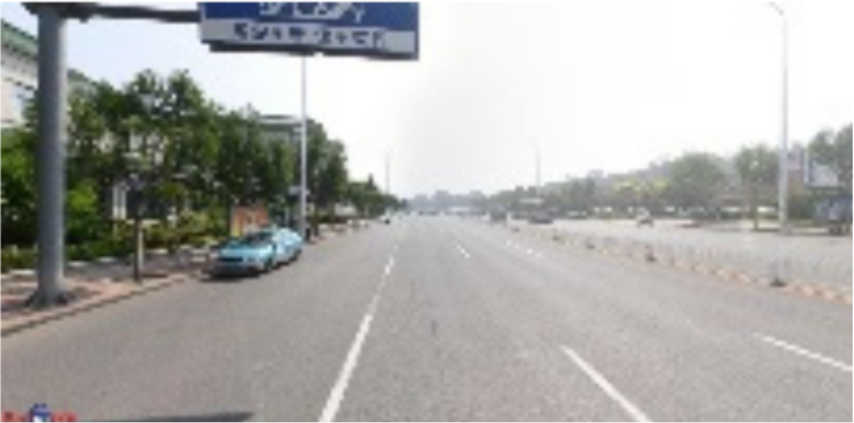
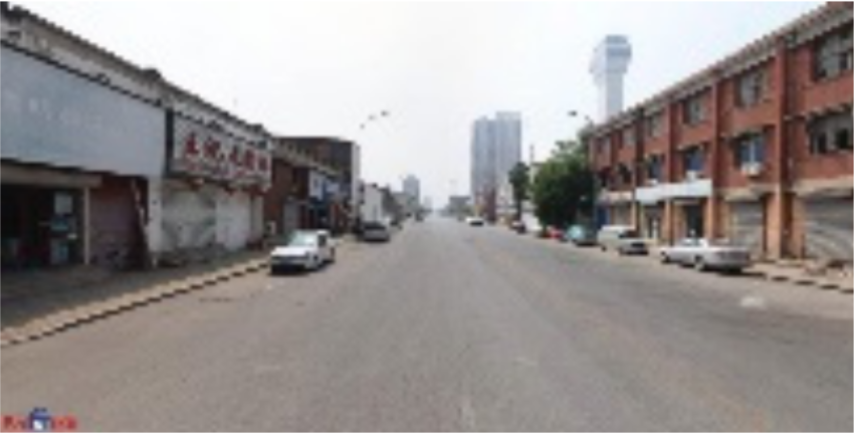
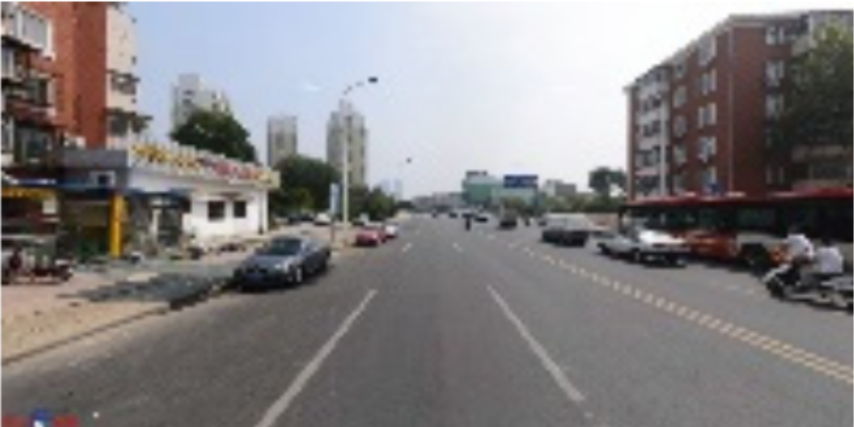
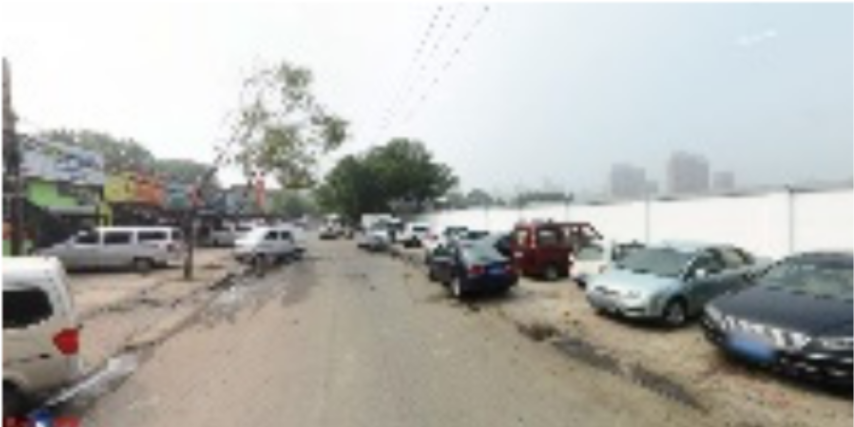
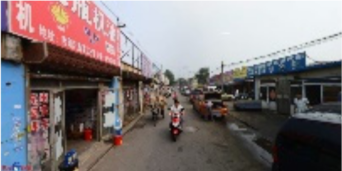
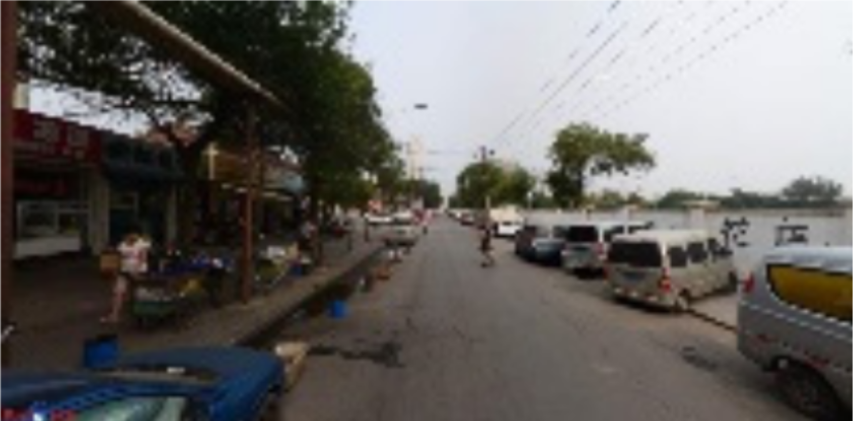
To evaluate the visual quality of the streets comprehensively and accurately, we selected a sampling point every 40 m for each street. Each sampling point was selected in four directions using a flat view, and the four directions were front, back, left, and right along the road angle. The SVIs from June to August during 2020–2022 were obtained through the Baidu Time Machine function, and some images with undesirable artifacts due to seasonal factors were replaced by images from 2015 and 2017. Some invalid images were eliminated, such as winter images to avoid the influence of seasonal factors, street scenes with under- and over-exposed images to avoid errors in image clarity, and images with incidental factors such as miscellaneous obstructions and maintenance construction. The eliminated images were replaced by SVIs from other years. The result is a multi-year and multi-faceted SVI dataset that consists of a total of 21,832 SVIs.
3.2.2. Assessment of Objective Indicators Based on PaddleSeg
- (1)
- Selection of objective indicators and their assessment criteria
In terms of selecting key indicators, many researchers have offered different perspectives. This study focuses on considering objective indicators from both relevant research literatures and machine learning perspectives. Specifically, the objective indicators were selected mainly considering the following aspects. First, these indicators are mentioned frequently by the relevant streetscape theories. Next, these indicators can be measured by existing algorithms. Furthermore, they are consistent with the specific conditions of the streets in the assessment cities, i.e., these indicators are included in the main assessment elements of Tianjin Urban Road Interface Landscape Design Guidelines [38]. Based on the above factors, this study finally determined five objective physical elements: greenery, sky view, vertical element, motorization, and pedestrian space.
A review of classic and recent studies related to street quality reveals the high frequency of the five objective indicators selected for this study. For instance, Pendola et al. discussed the indicators of main streets or main streets in towns, such as street scale, width of streets, building height, and traffic [39]. Garré et al. employed view area, shape, and sky as three quantitative factors to study the visual quality of the landscape [40]. Ewing et al. used an expert panel rating method to measure key qualities of urban design based on the physical environment characteristics of the street and its edges, including imageability, enclosure, human scale, transparency, and complexity [41,42]. Deng et al. declared that street environment indicators such as tree shade coverage, street interface enclosure, vehicular space, and pedestrian space have a significant impact on pedestrian walking experience [43]. In measuring the spatial quality of streets, Ye et al. selected indicators such as street greenness, sky visibility, building interface, pedestrian space, and road motorization degree [44]. Guo et al. used greenery and pedestrian space as living service streetscape features [45].
Meanwhile, the above study shows the importance and operability of the five objective indicators in this paper in the evaluation of street quality. Among them, greenery reflects the imaginability and human scale of street visual quality, sky view reflects the imaginability and sense of enclosure, and motorization and pedestrian space reflects the imaginability and human scale. It is important to note that Ewing has suggested that enclosure means the degree to which streets and surrounding environment are visually defined by buildings, walls, trees, and other vertical elements [42]. The vertical element in this study is used to represent the enclosure.
- (2)
- Intelligent image segmentation of physical street elements and the establishment of objective indicator assessment model
In this study, physical elements were identified using image segmentation techniques, SVIs, and the PaddleSeg model. Image segmentation was used to identify elements such as sky, buildings, roads, trees, fences, cars, and pedestrians. Then, the pixels of the SVIs were used to calculate the percentage and distribution of each physical element. Next, the objective indicators were scored.
For physical element recognition, this study used the semantic segmentation algorithm proposed by Tao et al. [46], which is implemented by Baidu AI, to propose the PaddleSeg model [47]. The PaddleSeg model is similar to and outperforms the Segnet model previously applied in the landscape domain. It achieves a score of mIoU of 87% in the opensource dataset Cityscapes and is the current state-of-the-art model.
PaddleSeg analyzes visual scenes using CNN architecture for pixel-level semantic segmentation. That is, the input image data are used to synthesize the environment, surrounding elements, and the features of the graphics themselves using a decoder to intelligently segment the objective elements of the scene. After testing on several urban spatial image datasets such as Cityscapes, this method was found to be the most reliable method evaluated (Figure 3).
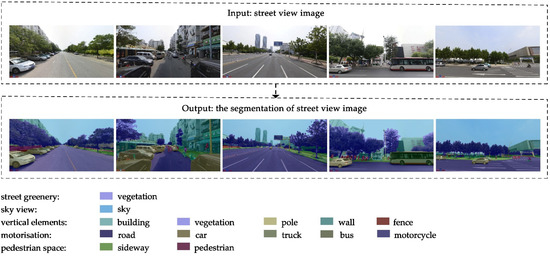
Figure 3.
Identification of objective elements using image segmentation techniques.
The specific scores were calculated as follows: The percentage of vegetation in each SVI was used to assess the greenery. The percentage of the sky in each SVI was used to assess the sky view. The percentage of the sum of buildings, vegetation, poles, walls, and fences in each SVI was used to assess the vertical element. The percentage of roads, cars, trucks, buses, and motorcycles in each SVI was used to assess the motorization. The percentage of sidewalks and pedestrians in each SVI was used to assess the pedestrian space.
3.2.3. Assessment of Subjective Indicators Based on NIMA
- (1)
- Selection of subjective indicators and their assessment criteria
In the subjective perception assessment of the visual quality of the street, there are various subjective indicators and rich evaluation perspectives because the visual perception assessment of the street is more subjective. At the same time, subjective indicators should be set according to the specific conditions of the research object in the evaluation process. This study evaluated the subjective indicators affecting the visual quality of streets using SVIs as the assessment medium. In determining the subjective indicators, the following aspects were considered: First, they are mentioned frequently in the relevant academic literature. Second, they focus on the subjective perception of users to measure street quality. Third, they are measurable. Specifically, these subjective indicators can be obtained by SVIs and machine learning algorithms. In this study, five subjective indicators were set based on the above factors to measure urban quality (imageability, enclosure, human scale, transparency, and complexity).
The above five subjective indicators basically covered the key qualities proposed by Ewing for measuring street quality [42]. The complexity of the streetscape had been pointed out as an important indicator in the analysis of studies that influence people’s behavior in architectural spaces [48]. Cheng et al. used the visual entropy (visual complexity of the landscape) to measure the visual perception of streets [49]. Tang et al. studied the spatial quality of streets in Beijing and Shanghai, and used enclosure, human scale, permeability, neatness, and imagery as street indicators in the subjective assessment of users [50]. In evaluating the perceived quality of street space, Di et al. used imageability, enclosure, human scale, transparency, and complexity as key indicators [51]. The above study illustrates the important value of the five subjective indicators in this study in the assessment of visual quality of streets.
It is important to note that in this study, preference was used as a measure of subjective indicator assessment, and a 5-point scale (scores are divided into five levels) was used for the assessment of each subjective indicator, with a rating interval of [1,5].
- (2)
- Machine learning principles and the construction of the subjective indicator assessment model
To evaluate 21,832 SVIs, it would be costly to evaluate each subjective indicator using manual scoring. This project employed machine learning techniques to build an assessment model to evaluate all the subjective indicators. In the assessment method, a small-scale sample was first scored, and then a model was built to evaluate all the subjective indicators of the SVIs. From 21,832 SVIs, a small sample of images with typical streetscape elements and significant differences were selected and manually scored, and the results were used to train the subjective indicators assessment model. The trained model scored all subjective indicators.
To ensure the accuracy of the model scoring, more than 2000 scoring samples were required, where more samples lead to better results. The study first manually selected 2200 sample images with typical streetscape elements from the collected SVIs, and then 10 researchers and designers with landscape and planning education backgrounds rated them. The ratings included the assessment of street visual quality and the five subjective indicators.
To avoid the influence of subjective bias, increase inter-rater reliability, and ensure the professionalism of the assessment quality, some images were first randomly selected from a sample of 2200 assessments before the formal scoring. They were given to the evaluators to rate together and reach a consensus on the scoring criteria. Then, the evaluators rated the 2200 sample images according to the rating criteria. This resulted in a database that was based on subjective human visual perception while being more specialized and with more focused and stable views.
In 2018, Talebi et al. proposed the NIMA model for image aesthetics scoring [52]. It was experimentally verified that the NIMA model can be adapted to the assessment task of SVI qualities. In addition, the model scoring results are highly correlated with human perception.
The NIMA model is a deep learning model based on the deep object recognition network VGGNet and pre-trained parameters. It uses SVIs as the assessment medium to output each subjective indicator score. The pre-training technique is a key technique of this model, which enables a deeper network to be trained using a smaller amount of data. One key strategy is to use the appropriate original network. VGGNet is a network originally created for computer vision, mainly for tasks such as object classification and recognition, with more than 15 million parameters. If the original VGGNet is trained directly for the visual quality assessment task, 2 million or more image data are needed to complete the training; otherwise, too many parameters will make the network overfit the data. In this project, we use the pre-training technique to migrate the pre-trained parameters of the VGGNet in the NIMA model and change the final fully connected layer to the required structure for this project. In this way, only a small number of SVIs are needed to train a model suitable for street visual quality assessment. In this study, we found through experiments that only approximately 2000 images and subjective indicator scores are needed as samples to obtain acceptable prediction results.
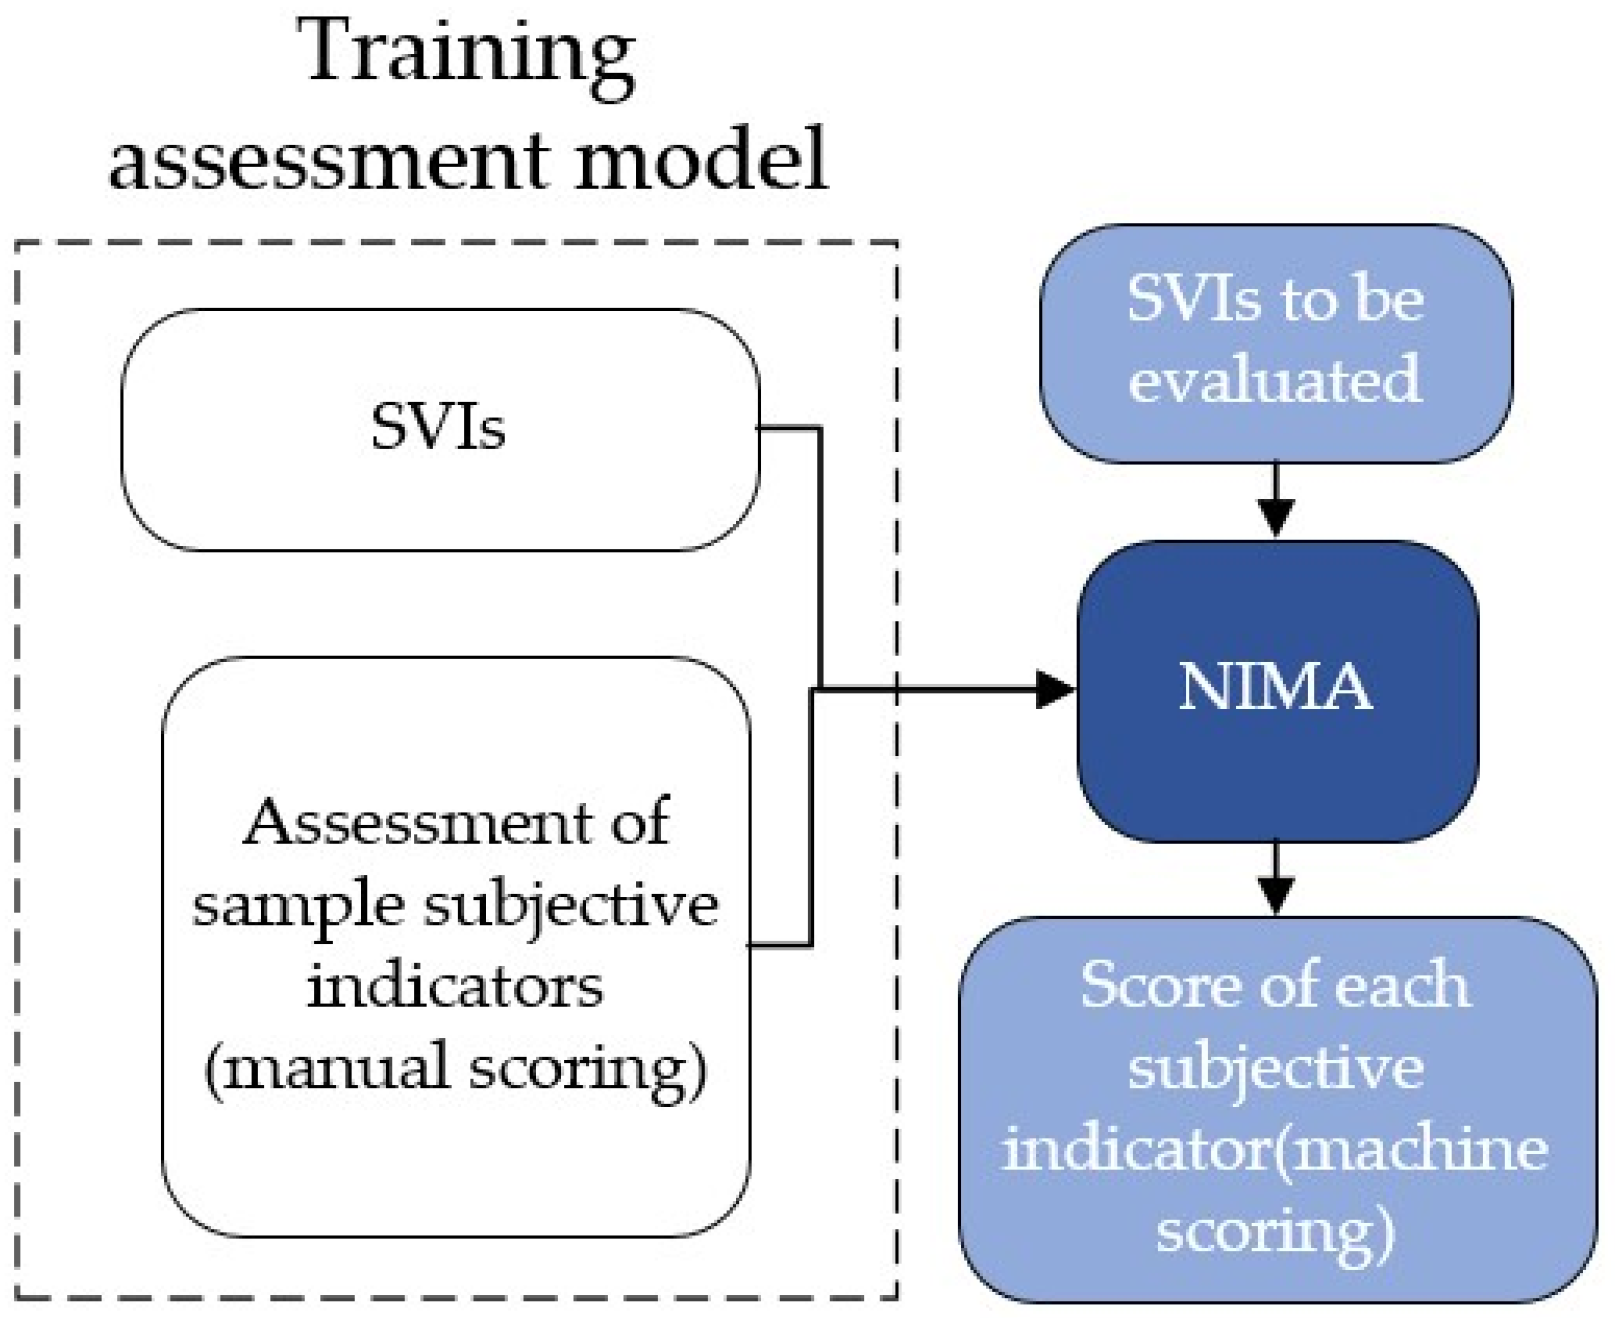
In this study, the subjective indicator assessment model was based on the NIMA model. The input was the SVIs to be evaluated, and the output was the score of each subjective indicator (Figure 4).
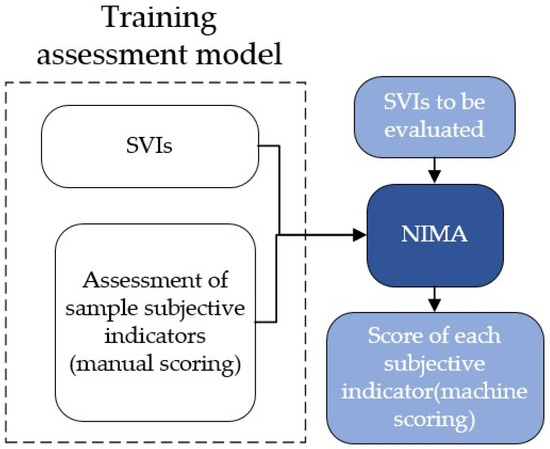
Figure 4.
NIMA-based machine learning process.
To ensure the validity of the subjective indicator assessment model, it was validated. The dataset of 2200 labeled SVIs described above manually scored using the five subjective indicators were used (imageability, enclosure, human scale, transparency, and complexity). We used the tenfold cross-validation method to randomly divide the 2200 images into 10 groups of 220 images each. One group was selected as the validation set without repetition, and the other nine groups of images were considered as the training set. The accuracy on each validation set was recorded. The final 10 accuracies were averaged. Taking the human scale as an example, we randomly divided 2200 street images into 10 groups and labeled them as [0:219], [220:439], [440:659], …, [1980:2199]. For the first time, the accuracy of the first set [0:219] as the test set and the remaining 9 sets [220:2199] as the training set was 57.843%, and the accuracy of the error within 1 was 97.990%. For the second time, the accuracy of the second set [220:439] as the test set and the remaining 9 sets [0:219] + [440:2199] as the training set and the accuracy and error within 1 accuracy were (57.107%, 98.528%). Similarly, the above operation was repeated 10 times, and the average of the 10 times accuracy was taken as 55.5%, and the accuracy of the error within 1 was 98.1%.
The tenfold cross-validation of i imageability, enclosure, human scale, transparency, and complexity were all performed, and the results are shown in Table 1.

Table 1.
Validation of the assessment models.
The above results show that the subjective indicator assessment model is close to human perception in performance. It can replace manual scoring more effectively. This approach can reduce scoring cost and improve assessment efficiency by processing all streetscapes quickly and efficiently.
3.2.4. Visual Quality Assessment of Streets Based on a Random Forest
To assess street visual quality, this study used SVIs as the assessment medium. Preference was used as the measure of visual quality assessment, and a 5-point assessment scale was used. A sample of 2200 assessments was given to the evaluators to rate together.
In particular, in this study, we directly used the NIMA model for training and testing to assess street visual quality, but the results were found to be unsatisfactory, with only 43.5% of the predicted values the same as the true values, and only 85.6% of the predicted values differing from the true values by less than 1. We found that this was because the human assessment of street visual quality had more factors to consider and was more complex. Moreover, the NIMA model could not simulate this subjective feeling well.
We believe that the key factors of visual quality scores are the objective and subjective indicators that affect visual quality; thus, we built a random forest model to predict visual quality scores from objective and subjective indicators. The random forest consists of multiple decision trees, which are more accurate and stable than a single decision tree. When a prediction problem is encountered, each decision tree gives its own prediction and then these predictions are fused by voting. A random forest is a type of tree model with strong interpretability and is widely used in feature analysis and score prediction problems in the landscape field.
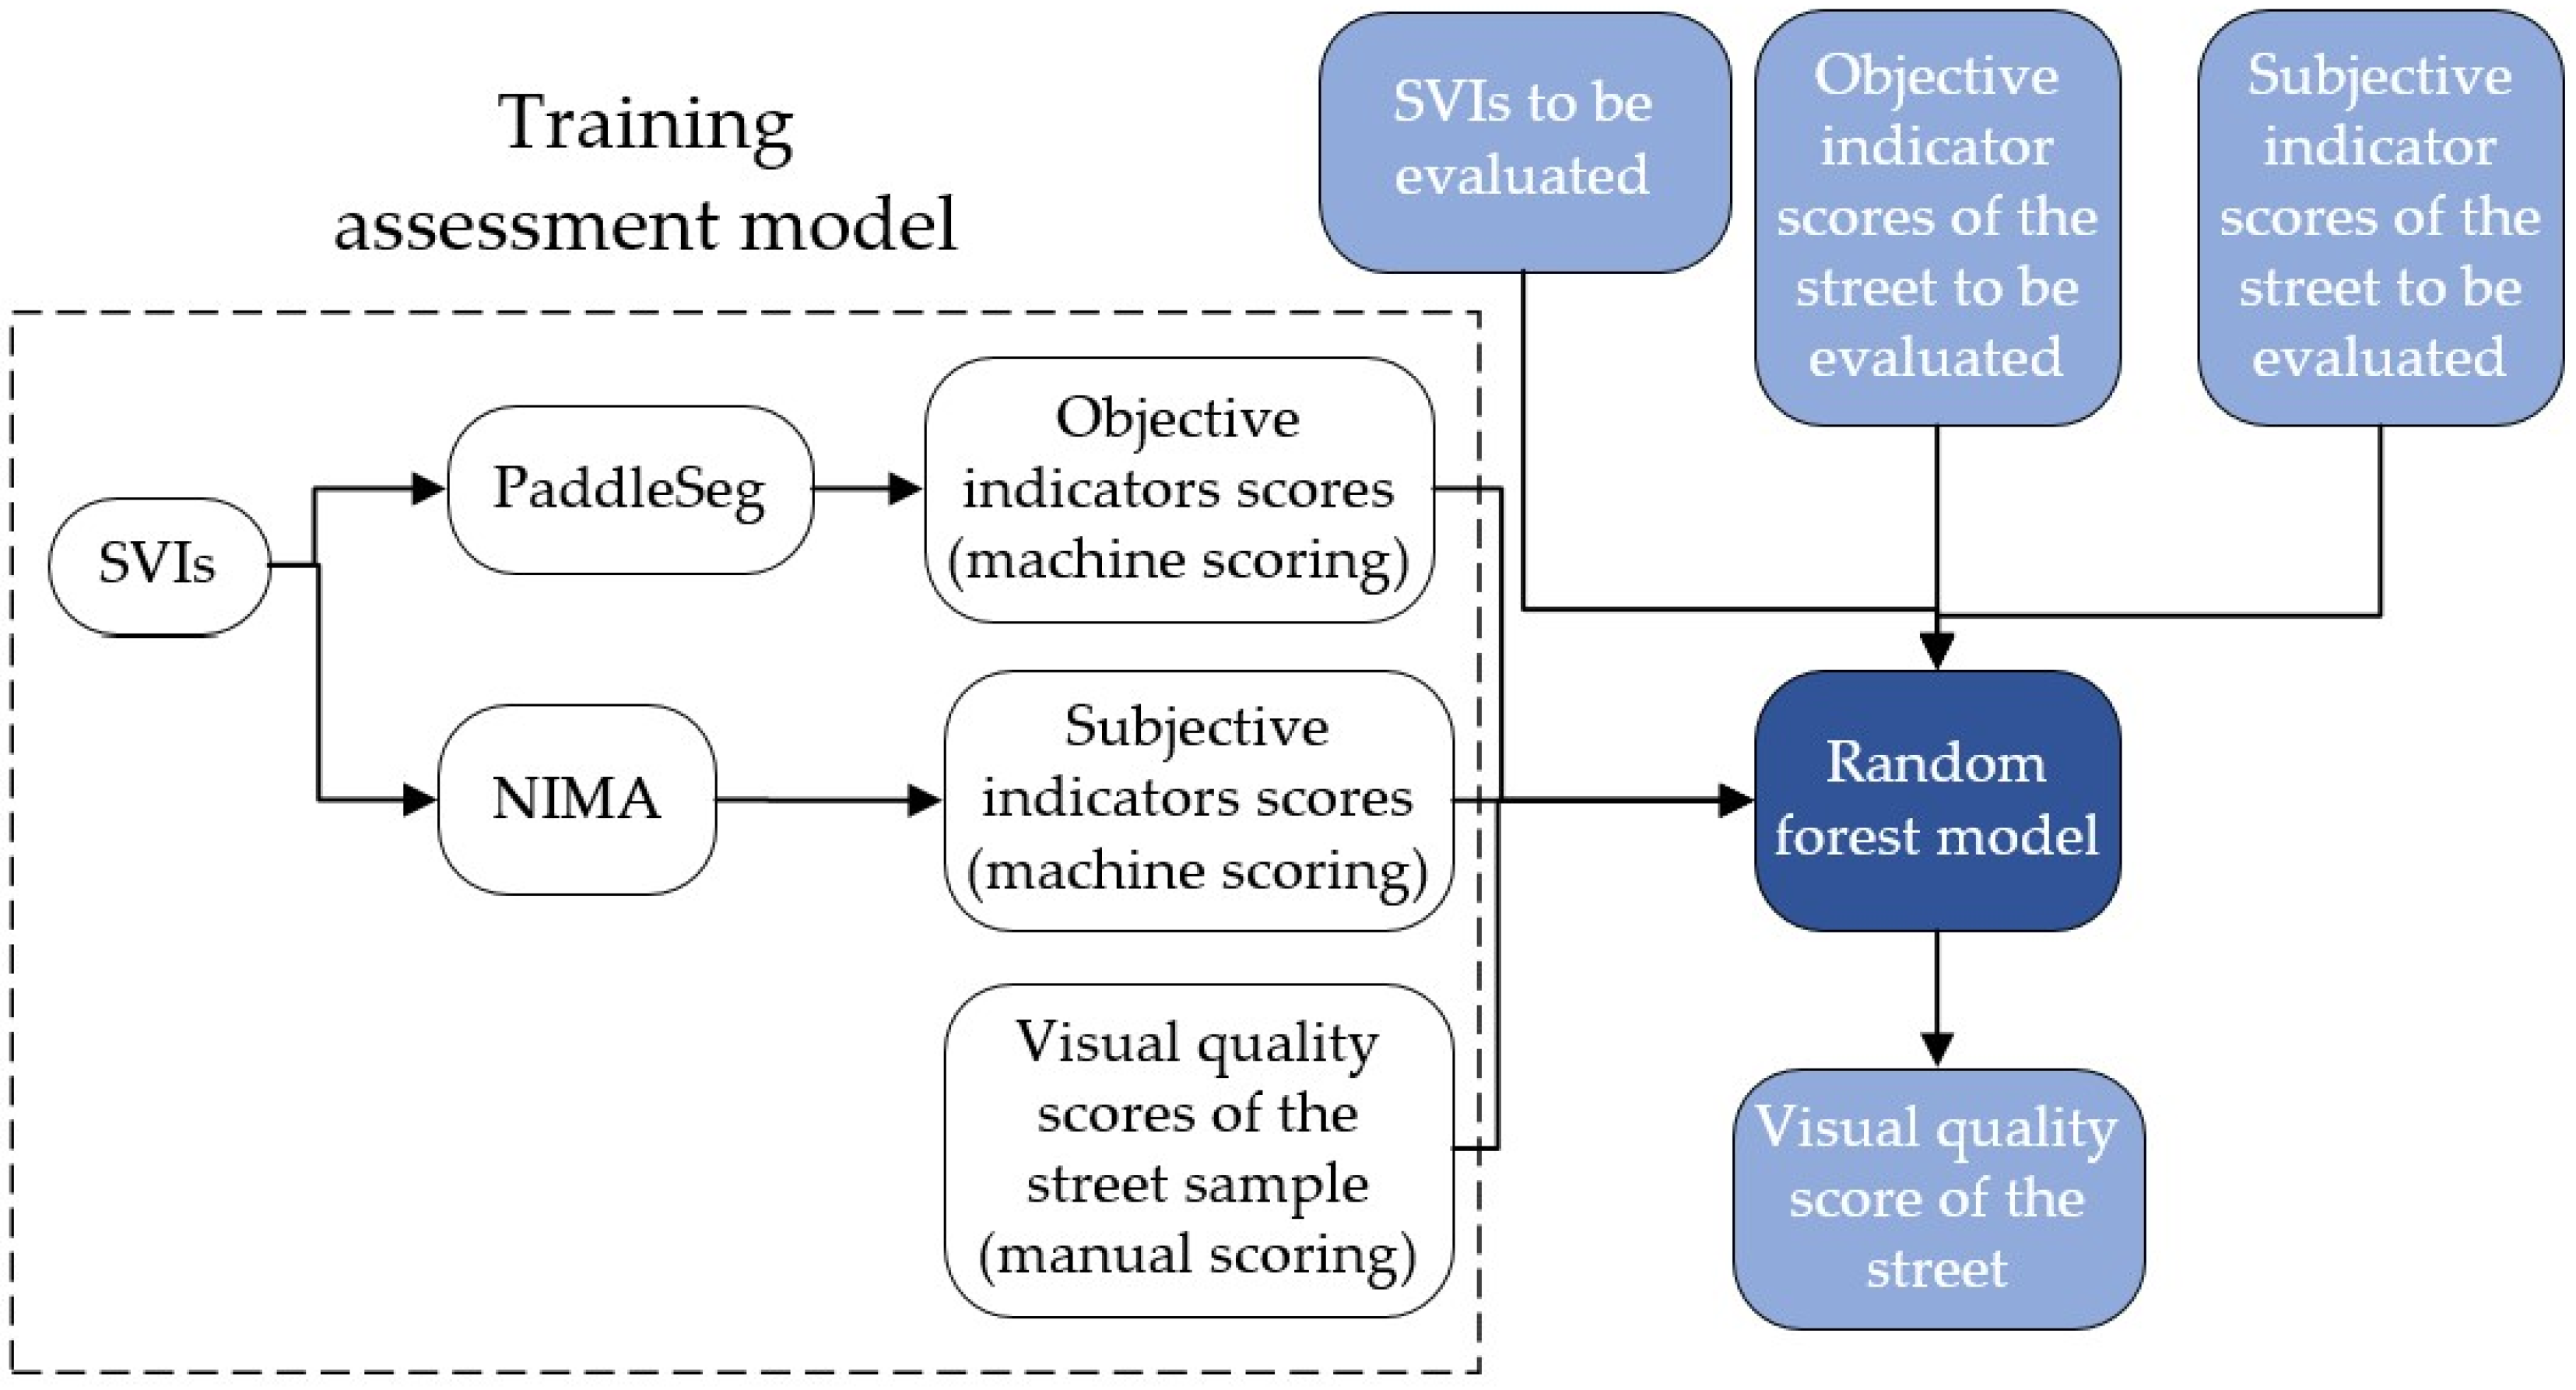
First, we used the PaddleSeg model to obtain the five objective indicator scores of greenery, sky view, vertical element, motorization, and pedestrian space of the SVIs to be evaluated. Then, we used the NIMA model to obtain the five subjective indicators scores of imageability, enclosure, human scale, transparency, and complexity. These 10 scores were used as features and the visual quality scores were used as labels to build a random forest model.
The input of the trained random forest model consisted of the SVIs to be evaluated, the objective indicator scores of the street to be evaluated, the subjective indicator scores of the street to be evaluated, and the output was the visual quality score of the street (Figure 5).

Figure 5.
Random forest-based machine learning process.
Similarly, using ten-fold cross-validation, a prediction accuracy of 53.5% was obtained. The probability that the predicted value differs from the true value by less than 1 was 97.2%. This result basically meets the assessment requirements, was closer to the manual scoring, and could replace the manual scoring more effectively.
4. Results
4.1. Analysis for the Assessment Results of Objective Indicators
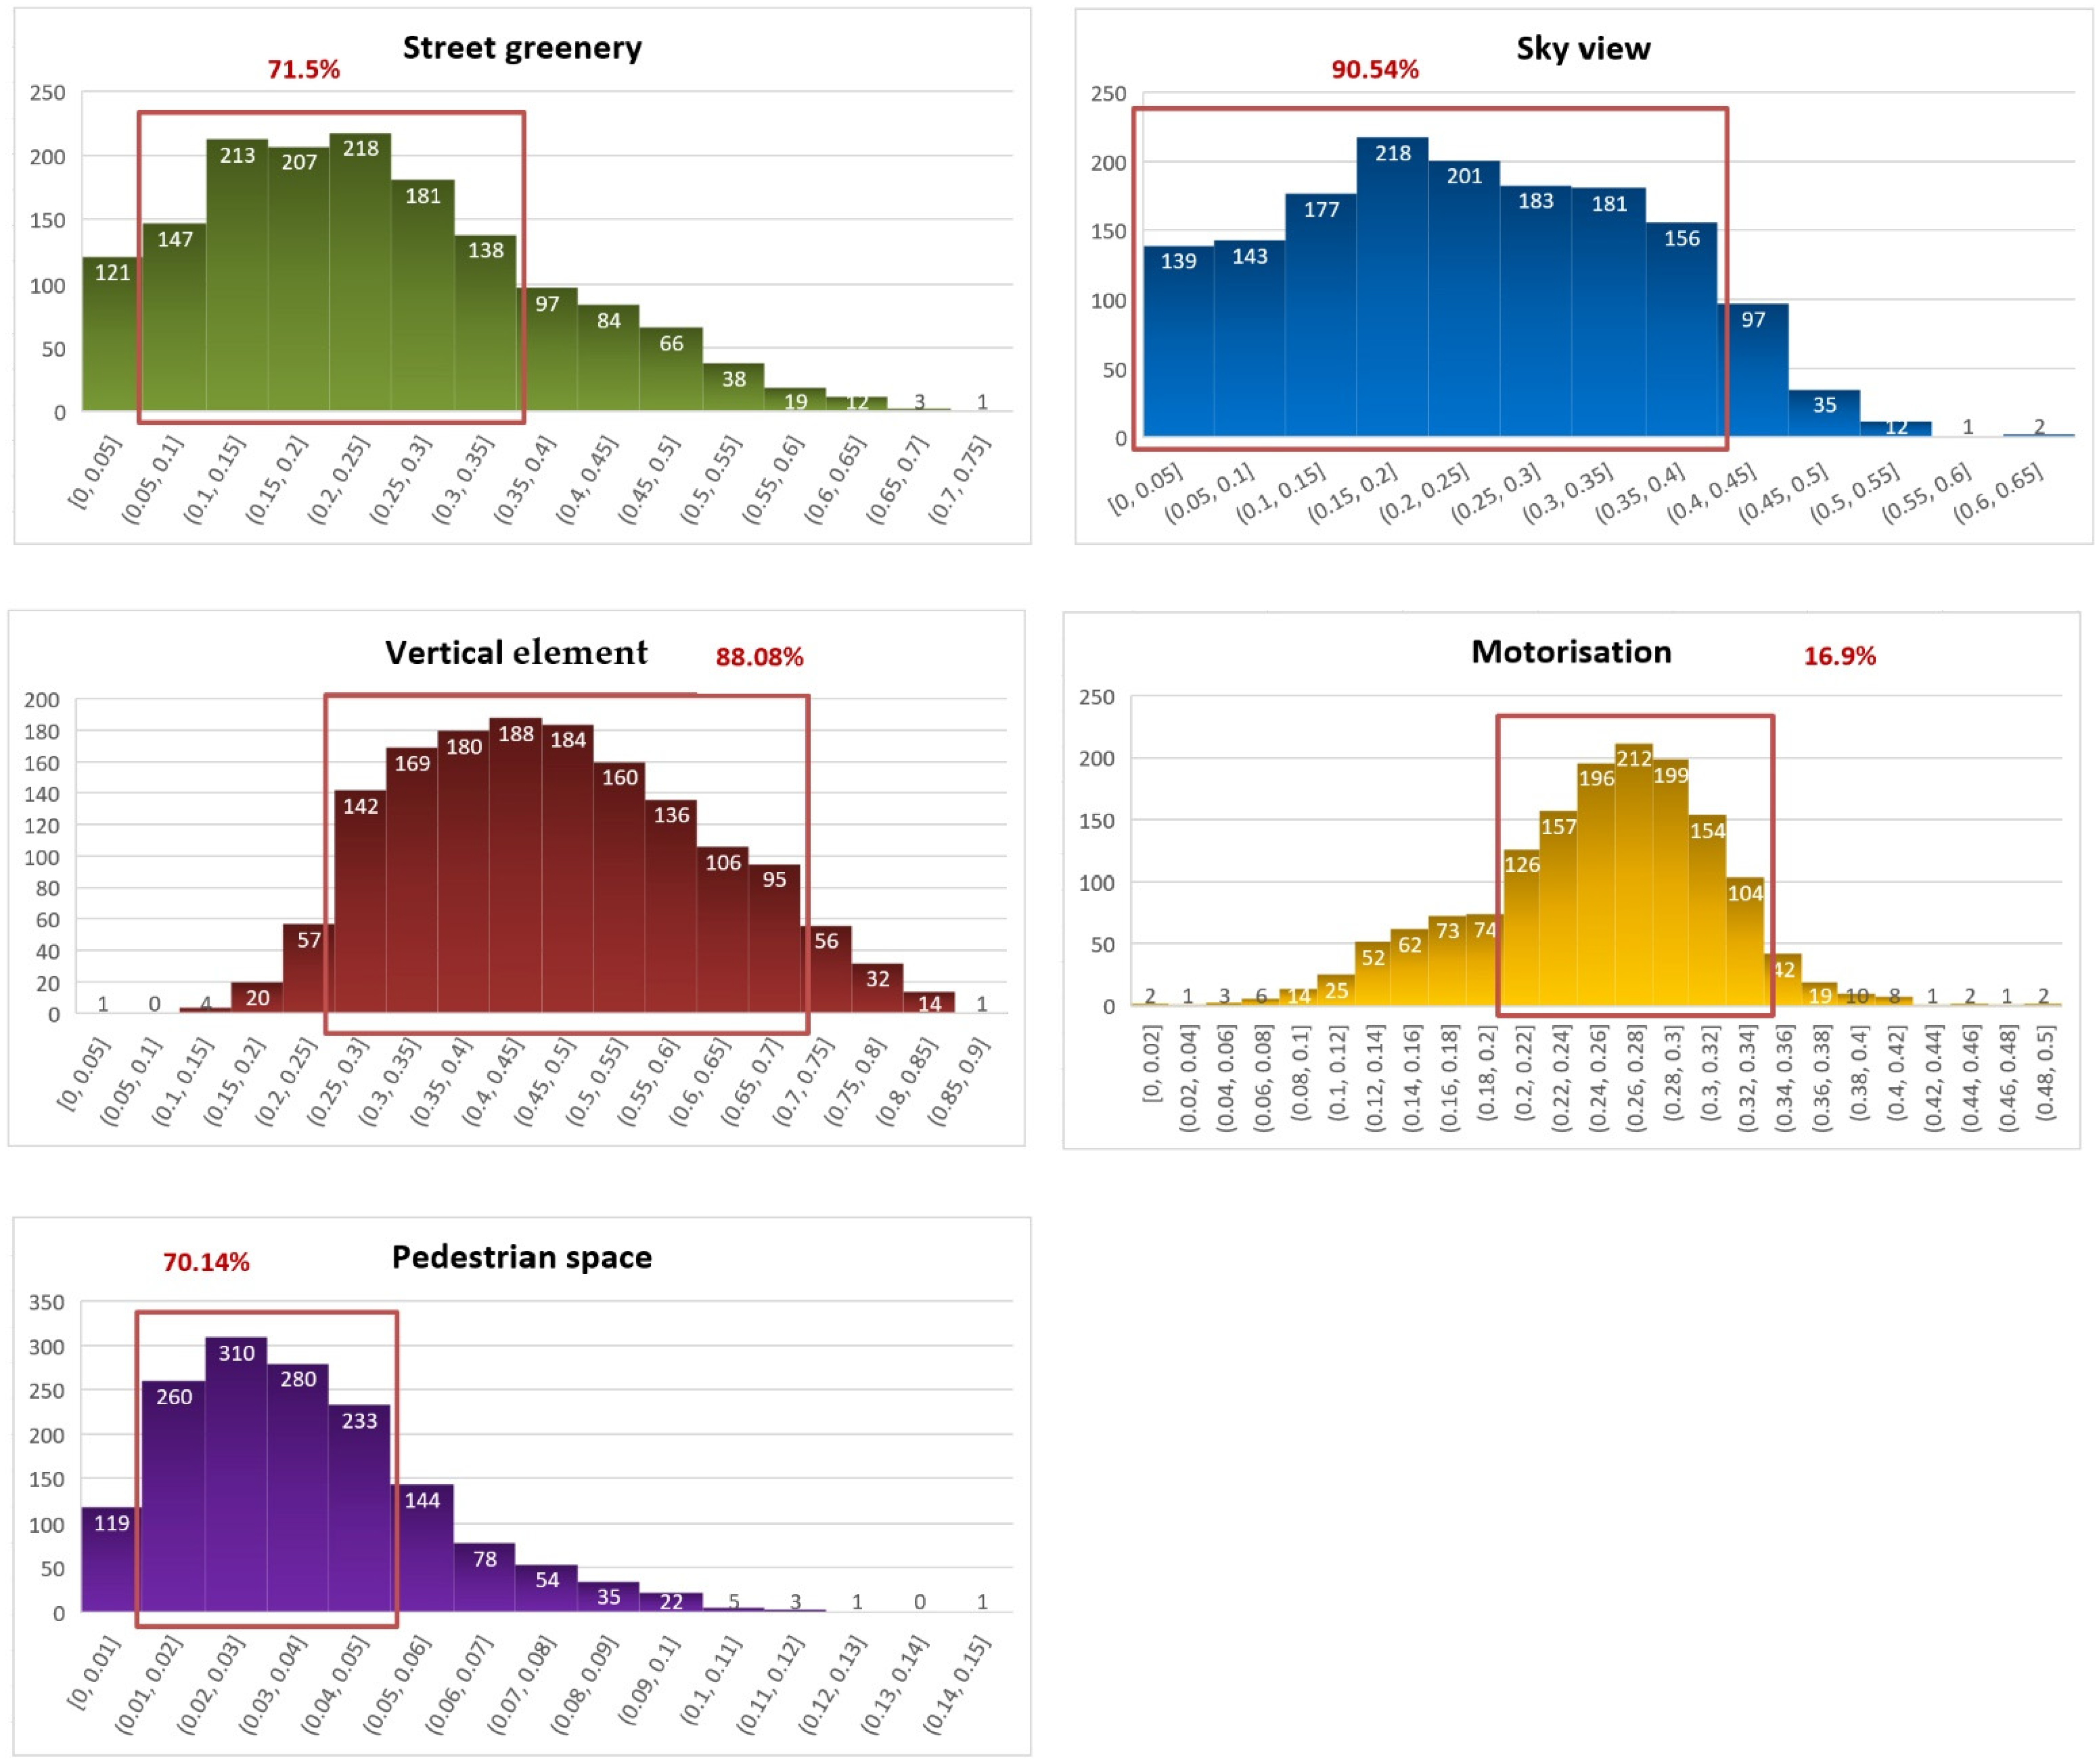
This study performed image segmentation using the PaddleSeg model to identify physical design elements in an SVI and measure their proportion of the images. Unlike the previous use of Segnet to extract key indicators from SVIs, PaddleSeg in this study works better. The results are shown in Figure 6. Overall, the objective indicator scores (greenery, sky view, vertical element, motorization, and pedestrian space) all conform to a normal distribution. Specifically, the greenery scores of 71.5% of the streets in Hexi District are in the range 0.05–0.35, and the highest greenery score is 0.75. The level of sky view is relatively average, with 90.54% of the streets having scores in the range of 0–0.4, and the highest sky view score is 0.65. The overall level of vertical element is high, with 88.08% of streets having a vertical element score in the range of 0.25–0.7, with the highest score being 0.9. The degree of motorization is mainly concentrated in the range 0.2–0.34, accounting for 16.9% of the total number of streets, with a few streets having a score of 0.5. The pedestrian space scores are in the range of 0.01–0.05 in 70.14% of the total number of streets, with a maximum score of 0.15.

Figure 6.
Results of the objective indicator assessment.
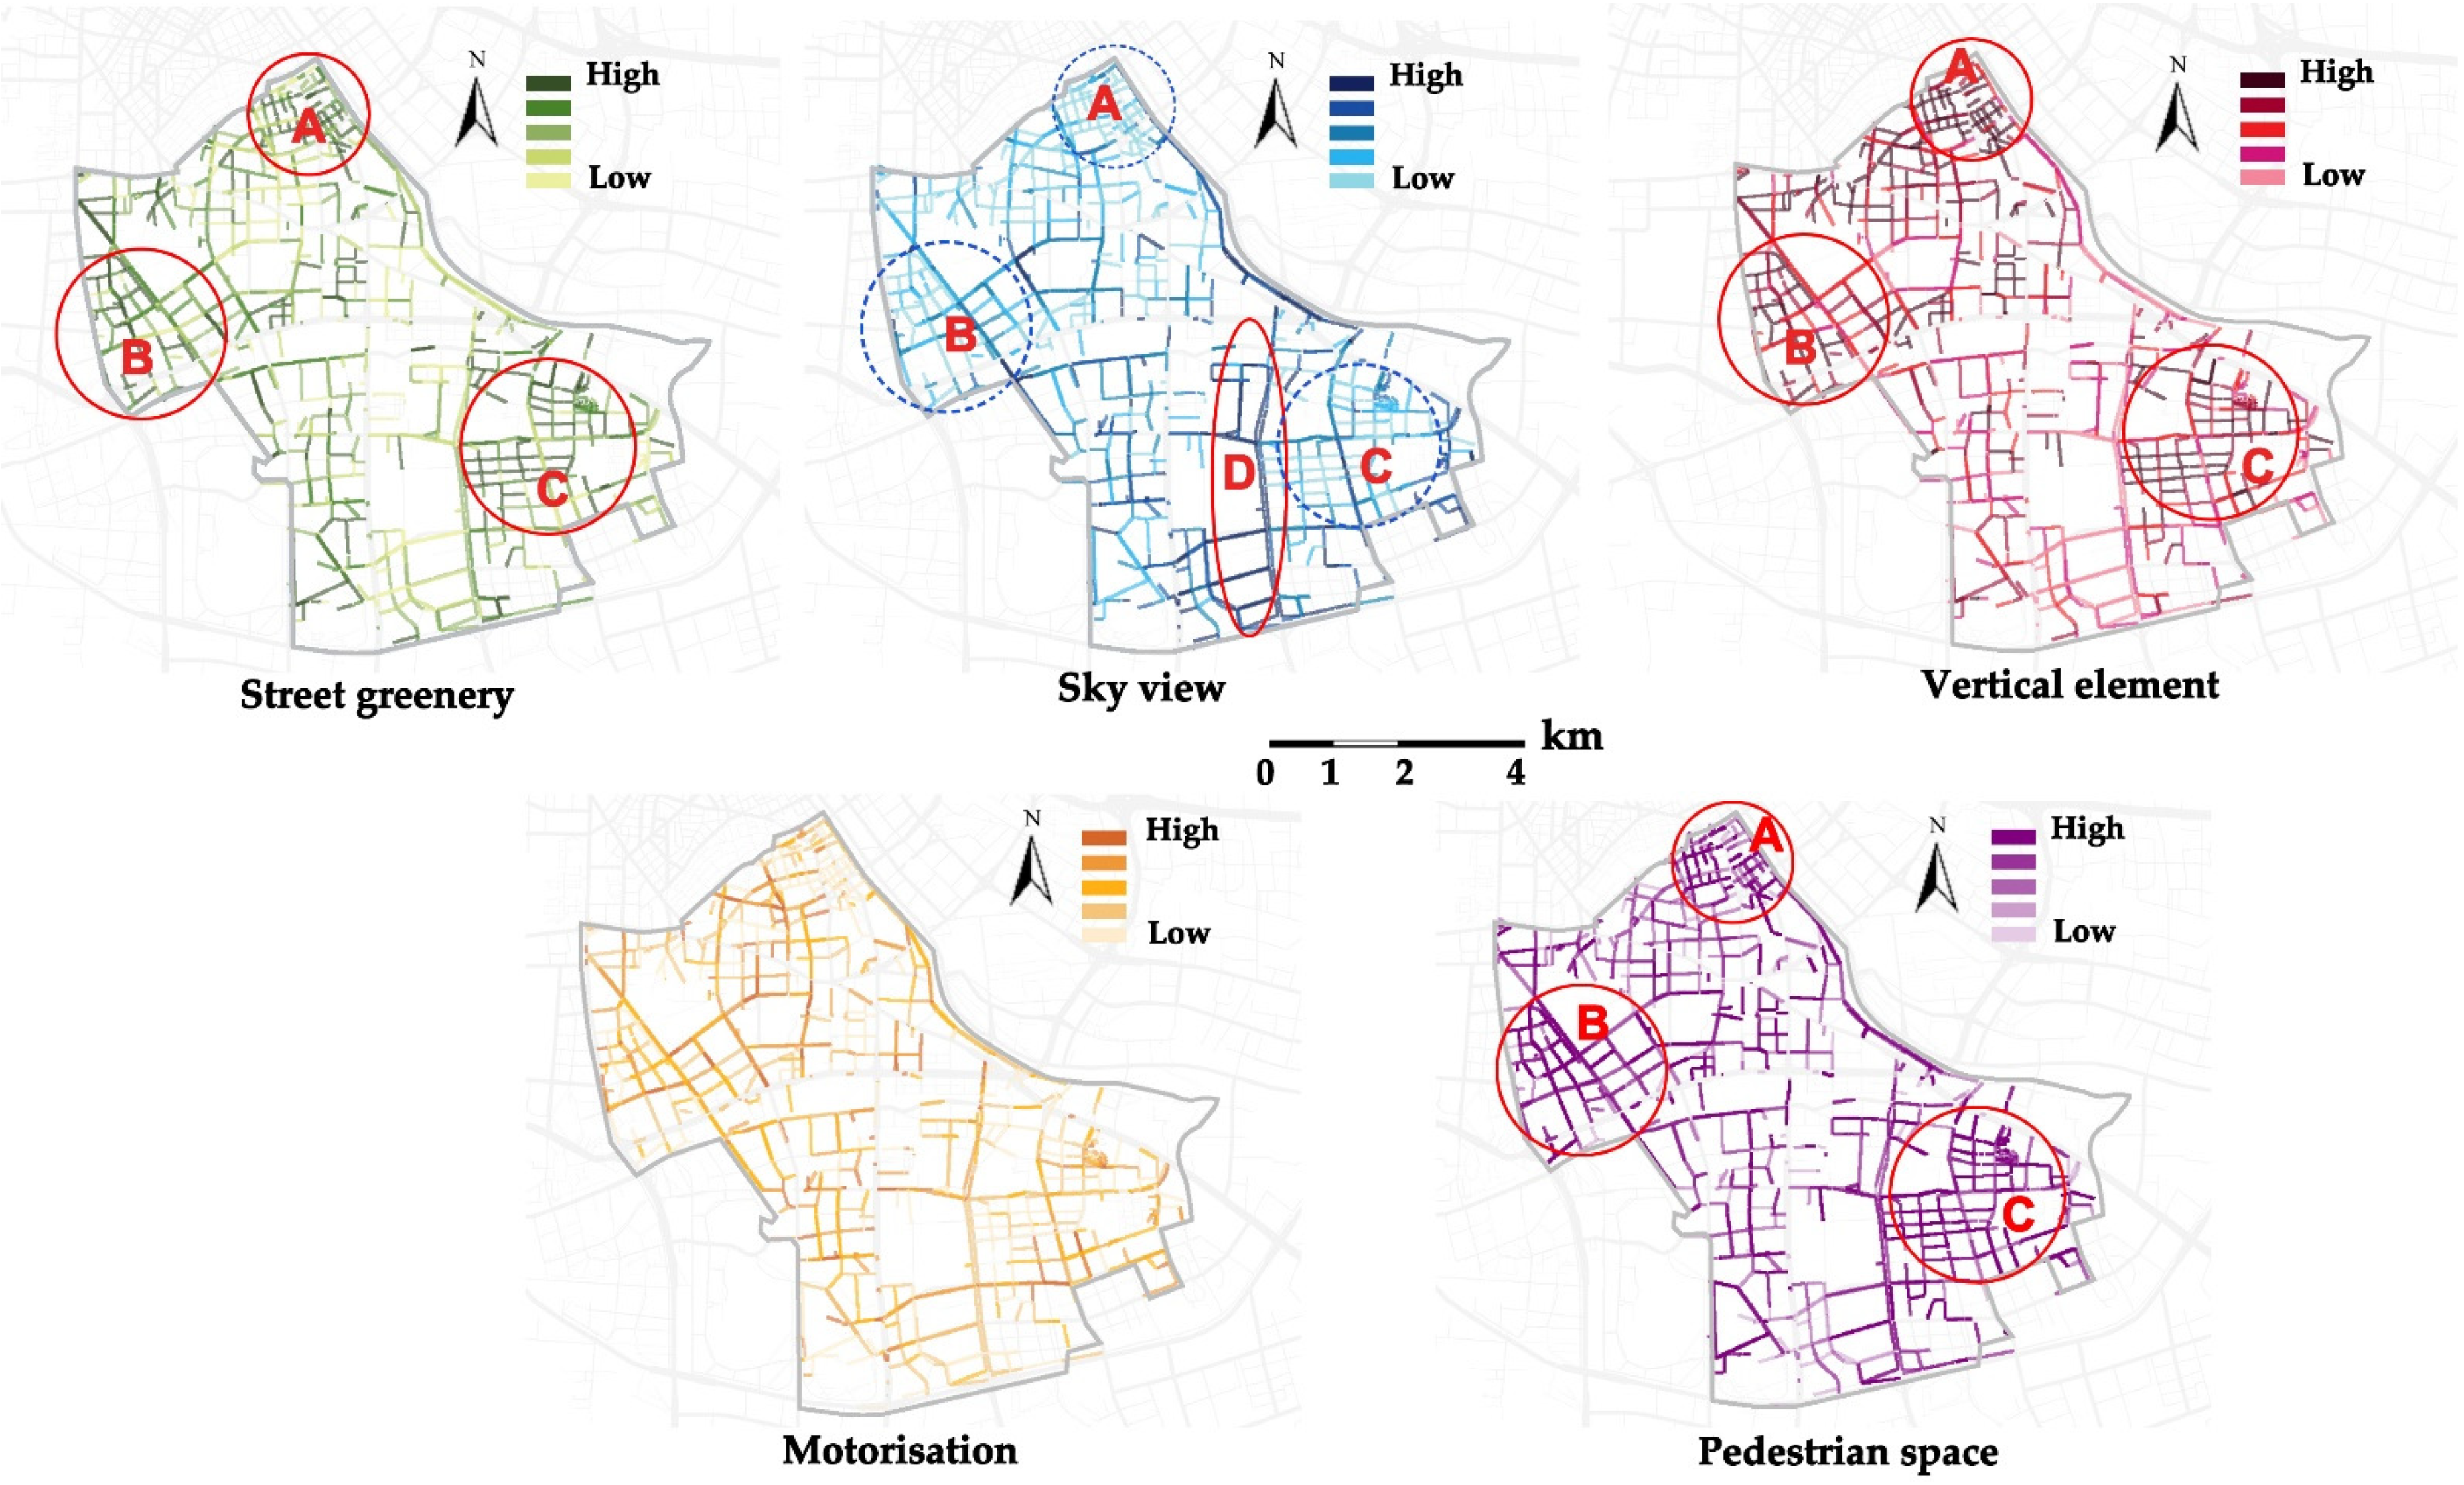
The ratings of the objective indicators are divided into five levels from high to low, and visual analysis further reveals that, first, in terms of greenery, Zones A, B, and C show higher greenery. There is one park distributed in each of these three districts. Meanwhile, Zone A is adjacent to the city sightseeing area, and Zone B is the Tianta Lake Tourist Scenic Area. Zone C belongs to the university area and includes two universities with plenty of green landscape on campus. In terms of sky view, Zone D shows higher openness and contains many wide traffic roads, whereas Zones A, B, and C have lower openness. In terms of vertical element, Zones A, B, and C have higher scores, with more buildings and trees built along both sides of the street, which also reduces the sky visibility. In terms of motorization, there is a higher degree of motorization near transportation-oriented roads, and the areas with concentrated motorization are not significant. In terms of pedestrian space, Zones A, B, and C have higher proportions of pedestrian space, and they have more pedestrian streets in common. From this, it can be preliminarily seen that areas with higher street greenery have a higher sense of street shading, a higher degree of enclosure, and lower sky visibility (Figure 7).

Figure 7.
Objective indicators of streetscapes.
4.2. Analysis of the Assessment Results of Subjective Indicators
The subjective indicator assessment model was used to evaluate all SVIs, and the subjective indicator scores of all streets in Hexi District are shown in Figure 8. Few streets receive the highest score of 5 or the lowest score of 1; the subjective indicator of most streets is 2 or 3. Specifically, 64.25% of streets (992 streets) have an imageability score of 2, and one street has an imageability score of 5. For enclosure, 56.35% of streets (870 streets) are rated 3, and 33 streets are rated 5. For human scale, 62.5% of streets (965) are rated 3, and eight streets are rated 5. The transparency score is 3 for 1288 streets (83.42% of the total number of streets), with one street having a score of 5. The total number of streets with complexity scores rated as 3 is 1287, accounting for 83.35% of the total number of streets. One street had a complexity score of 5.
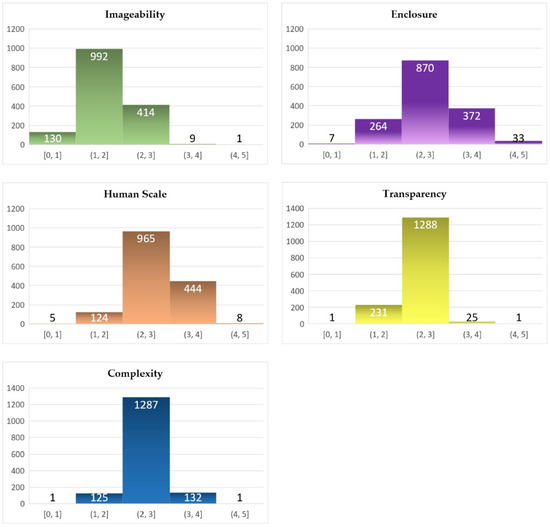
Figure 8.
Results of subjective indicator assessment.
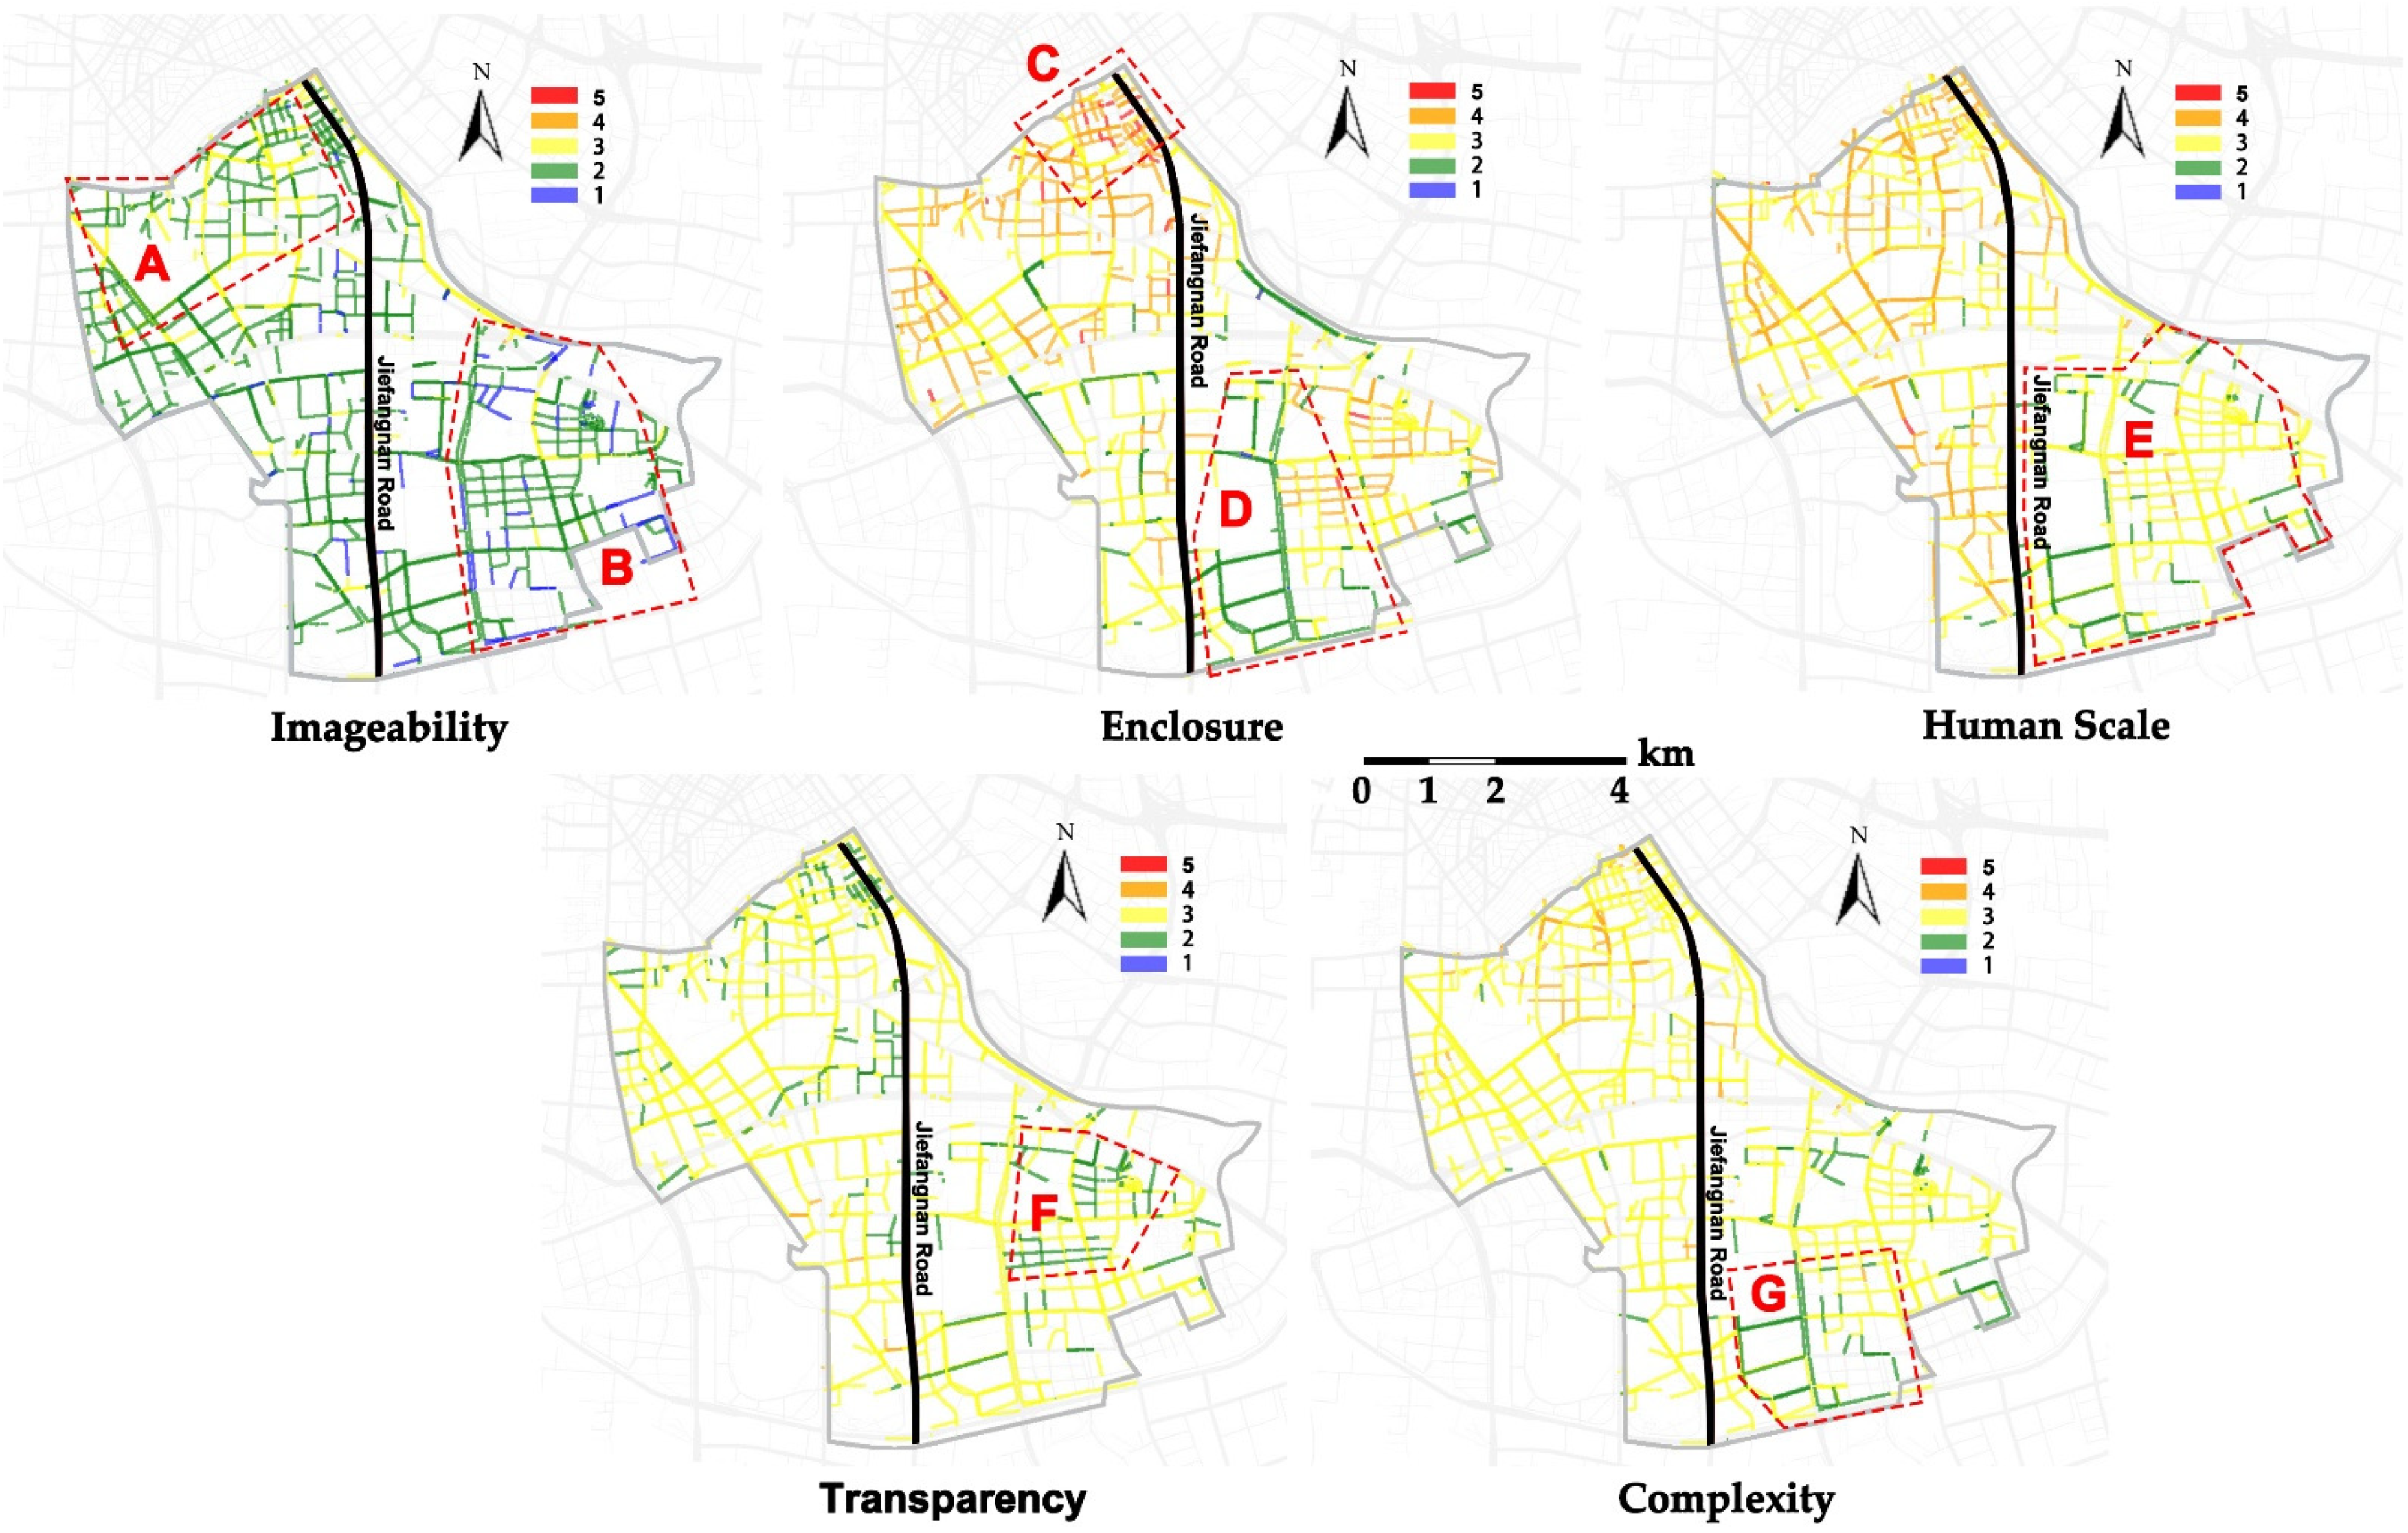
Previously, the assessment of subjective indicators mainly relied on manual scoring, but this study uses the NIMA model to achieve automatic machine scoring with higher assessment efficiency. At the same time, a large number of subjective indicator scores can be obtained, and the scoring results are more accurate. The scores of each street’s subjective indicators (Figure 9) reveal that the streets rated 3 or higher in terms of imageability are mainly located in Zone A, west of Jiefangnan Road. This area includes several famous tourist scenic spots and city parks and has more public art installations and street furniture. The streets with a score of 1 are mainly located in Zone B, east of Jiefangnan Road, which is mainly a new residential area. This area has fewer landmark buildings and more uniform architectural decoration. In terms of enclosure, Zone C is an area with a high concentration of historical and cultural buildings, showing a good degree of enclosure. The areas with a score of 1–2 for enclosure are mainly in Zone D, where new residential buildings are located nearby, and there are fewer street walls in this area, showing poor enclosure. In terms of human scale, streets rated 2 and below are concentrated to the east of Jiefangnan Road (Zone E). This area is a large residential area, part of which is a new residential area with taller buildings. In another part of the residential area, buildings were built in 1970, and the community building environment is poor. Fewer streets meet human scale and proportions, and hence, the human scale score is low. The overall score of transparency in Hexi District is relatively average, and the areas with lower scores are concentrated in Zone F, which is the area with the highest concentration of communities in the old residential area. This area has more enclosed fences in the traditional Chinese residential areas, which are a strong obstruction to sight lines. Most of the streets in Hexi District have a moderate degree of complexity, and Zone G is a newly built residential area in which the architectural style tends to be relatively austere. The surrounding facilities are not yet complete, and there are fewer trees and street furniture, which leads to less complexity.
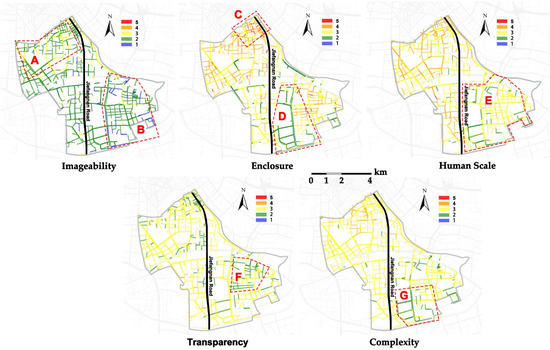
Figure 9.
Subjective indicators of streetscapes.
4.3. Analysis of Street Visual Quality Assessment Results
Figure 10 shows the assessment results of the visual quality of the streets in Hexi District, which are colored from red to blue according to the street quality from high (5) to low (1). As mentioned above, the scope of this study is urban streets, and transportation-oriented roads (including all bridges, tunnels, and highways) were excluded. Overall, there are few high-quality streets with a rating of 5 and few low-quality streets with a rating of 1. Streets with high visual quality are mainly the city welcoming roads (Zone A) and the city tourist and sightseeing areas along the Weijin River and Haihe River (Zones B and C). These areas are the tourism, administrative, and cultural centers of Tianjin City, attracting visits from local residents and foreign tourists. Meanwhile, these streets have undergone street renewal and upgrades in the past few years of urban renewal. The scoring results are in line with the design positioning of Tianjin’s street planning and the general perception of Tianjin citizens.
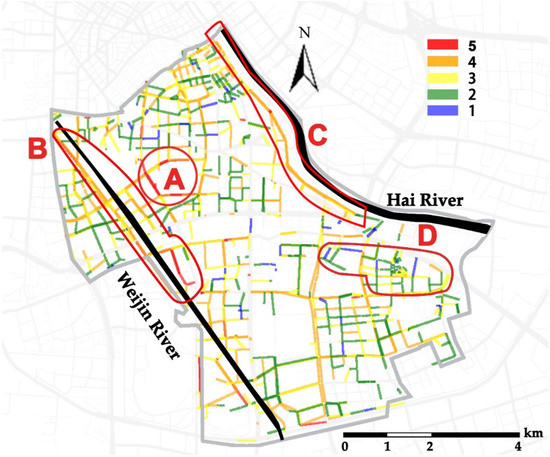
Figure 10.
Assessment results of the visual quality of the streets.
The assessment results are also more favorable in terms of classical street design theory. Streets with higher visual quality are characterized by higher greenery, more pedestrian space, and obvious imageability. Streets with lower quality perform poorly in these key elements or lack some key design elements, with poor imageability, human scale, transparency, and other factors. For example, Zone D includes some traditional industrial areas and old neighborhoods, and the visual quality of these streets is rated low. The architectural greenery on both sides of the road is low, and the buildings are low and dilapidated (Table 2).
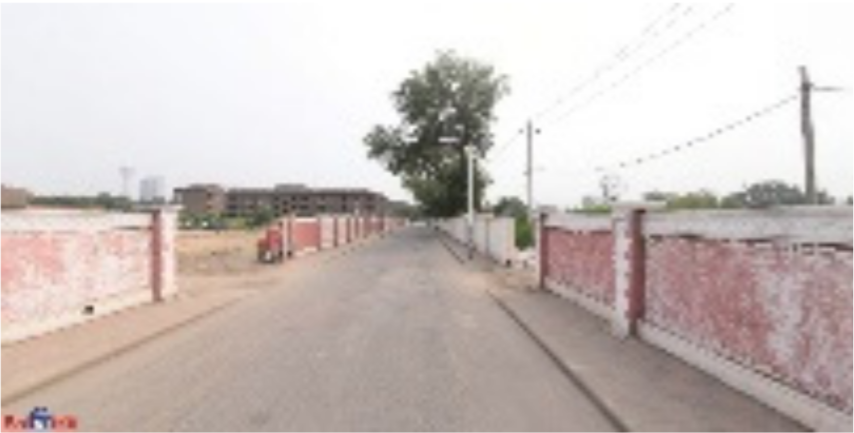
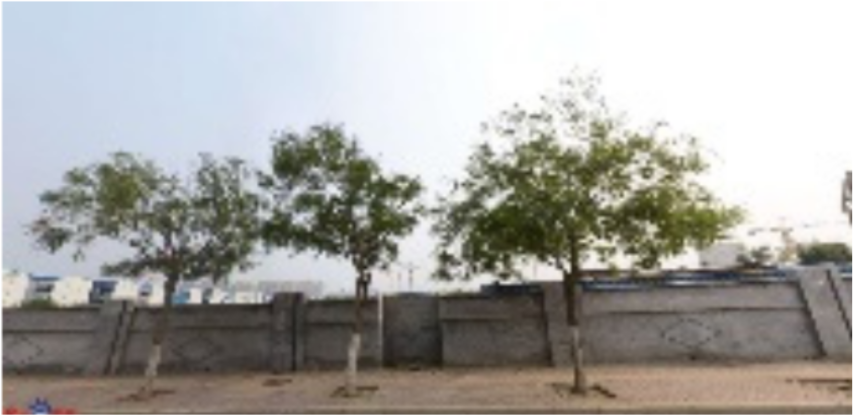
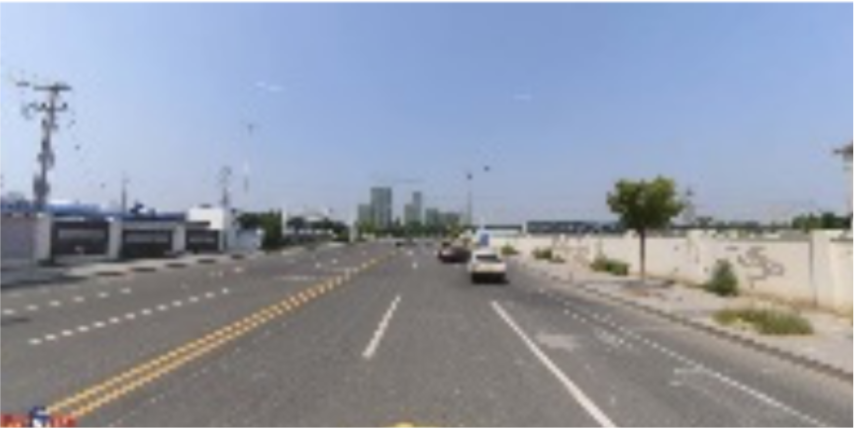
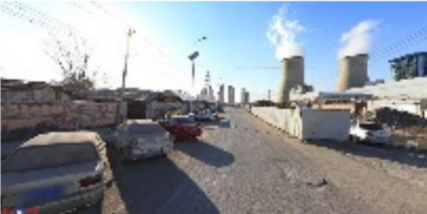
Table 2.
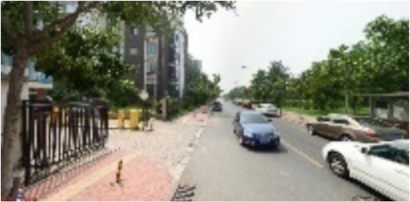
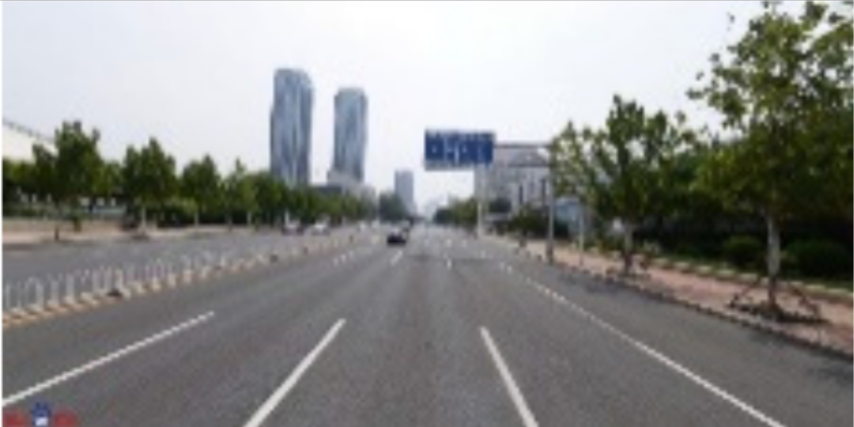
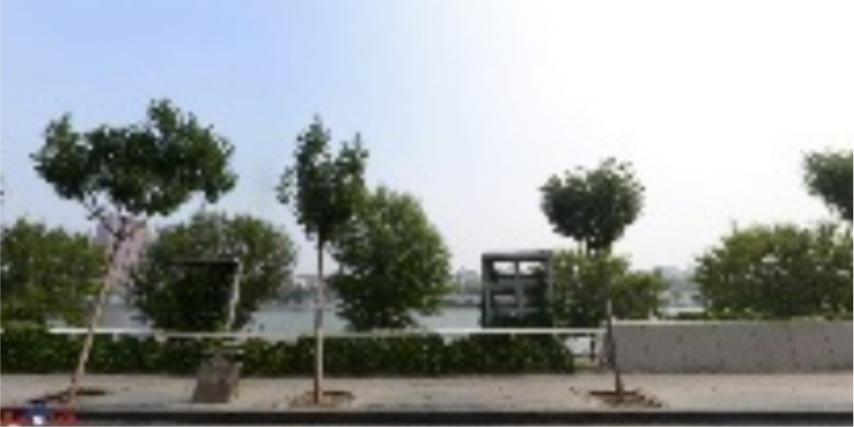
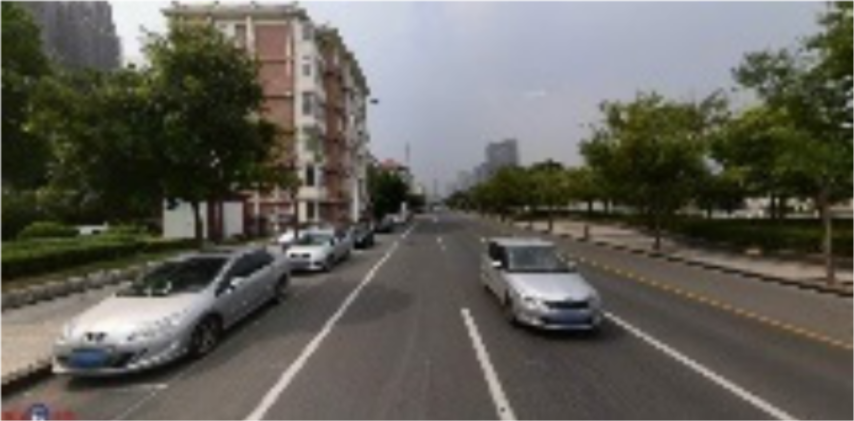
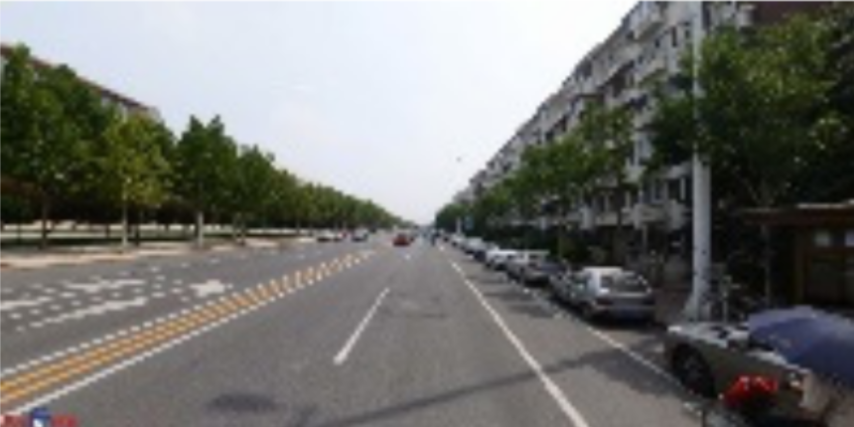
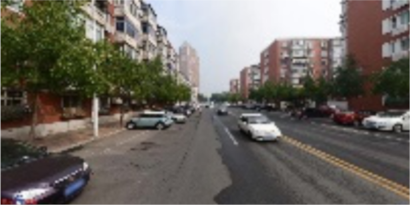
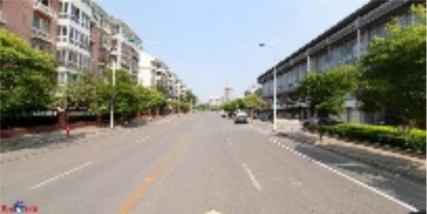
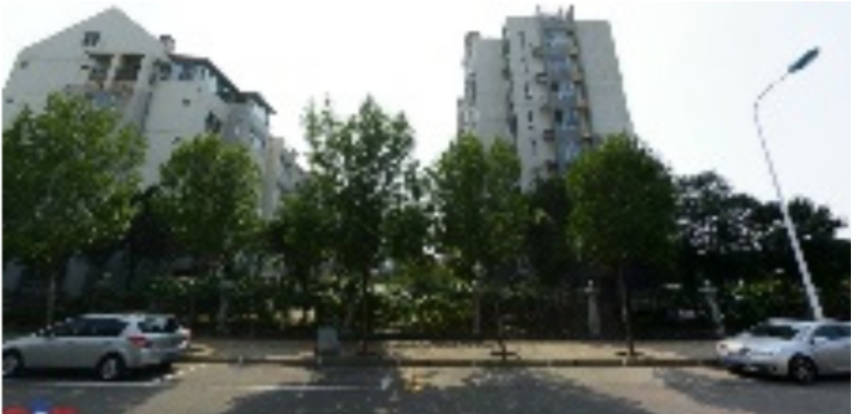
Scoring results of the assessment model and corresponding sample streetscape photos.
4.4. Impact and Importance Ranking of the Key Indicators of Visual Quality Assessment
According to the results of the previous study, this paper further analyzes the importance of subjective and objective assessment elements with respect to the quality of streetscapes using two analytical methods.
- a.
- Pearson correlation coefficient analysis
This study first uses Pearson correlation coefficients to analyze the correlation between the key objective and subjective indicators and the visual quality assessment results of the streets in Hexi District.
The Pearson correlation coefficient is given by:
This equation expresses the amount of linear correlation between the variables. , and has the following properties:
- (1)
- When is closer to 1 or −1, it means the variables are more relevant. When , there exists coefficients a and b such that Y= aX + b.
- (2)
- When equals 0, X is completely uncorrelated with Y.
- (3)
- A value of is greater than 0 means that as X increases, Y increases. A value of less than 0 means that as X increases, Y decreases.
The specific degree of relevance is as follows: When || = 0, there is no correlation between X and Y. When || is [0, 0.1], X and Y are weakly correlated. When || is [0.1, 0.3], X is moderately weakly correlated with Y. When || is [0.3, 0.5], X is moderately correlated with Y. When || is [0.5, 0.8], X is highly correlated with Y. When || is [0.8, 1], X is very highly correlated with Y. When ||= 1, X is perfectly linearly correlated with Y.
The calculated correlation result between each key indicator and the visual quality of the street is shown in the following Table 3.
Table 3.
The correlation between each key indicator and the visual quality of the street.
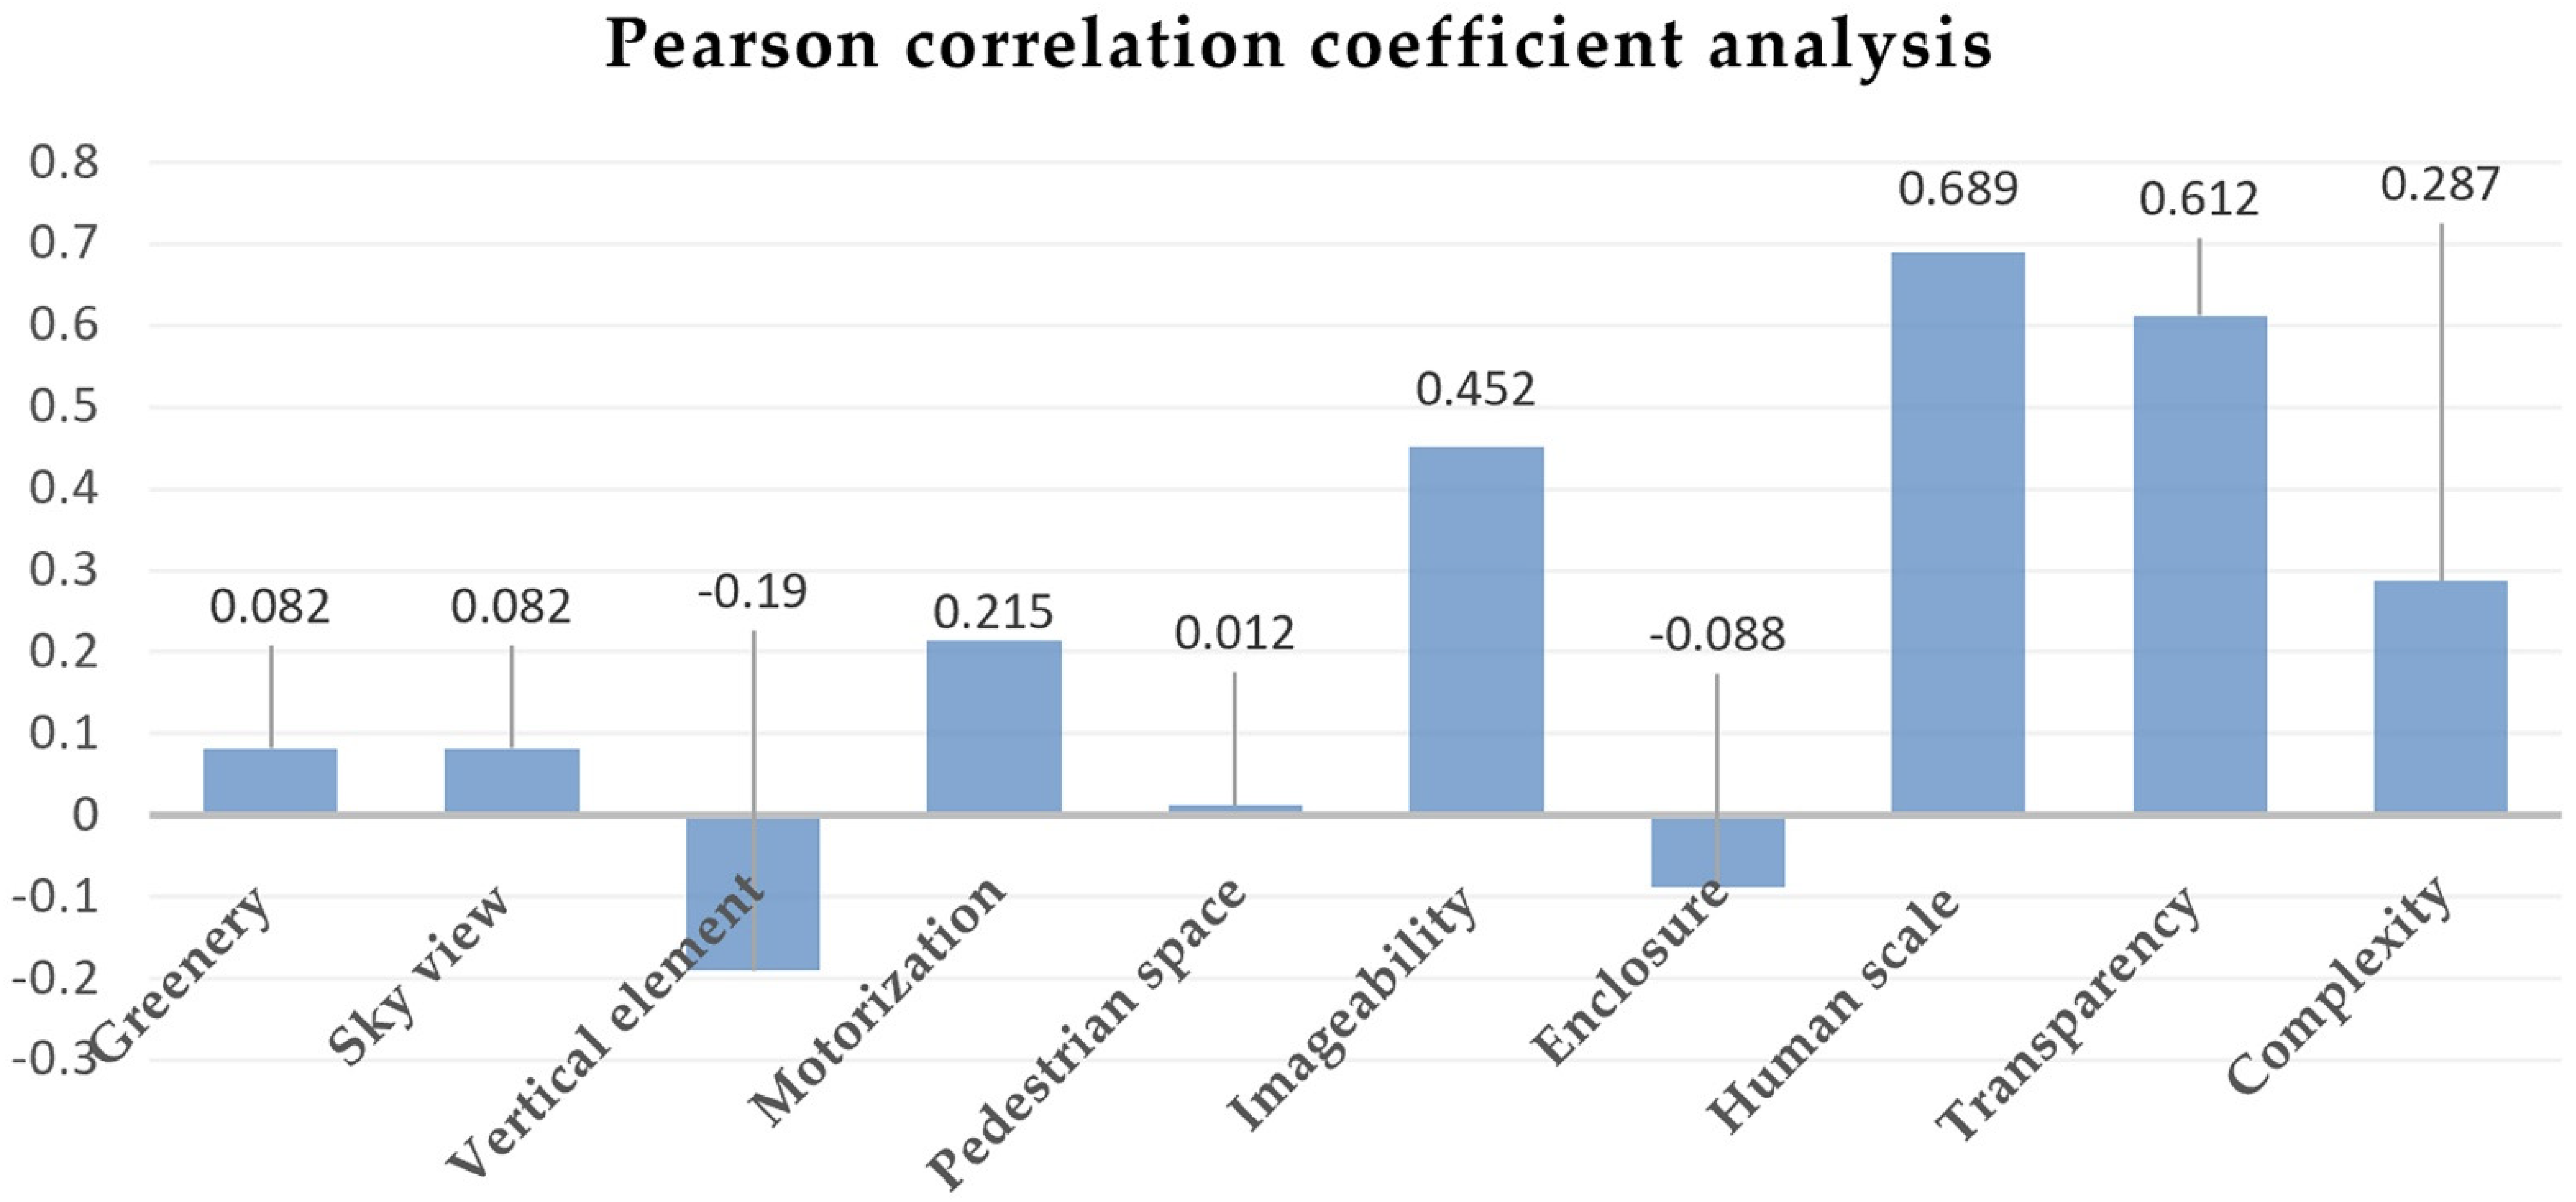
Figure 11 shows that human scale and transparency are highly correlated with the visual quality of the street; imageability is moderately correlated with the visual quality of the street; and vertical element, motorization, and complexity are moderately weakly correlated with the visual quality of the street. The vertical element can negatively affect the visual quality, and the greenery, sky view, pedestrian space, and enclosure are weakly correlated with the visual quality of the street. Streets with high visual quality tend to have higher human scale, transparency, and imageability. Therefore, in the street renovation of this study case, improving the degree of street imageability, strengthening the human scale of the space, and increasing the transparency of the street should be the main strategy for improving the visual quality of the street.

Figure 11.
Impact of key indicators in visual quality assessment by Pearson correlation coefficient.
- b.
- Random forest approach
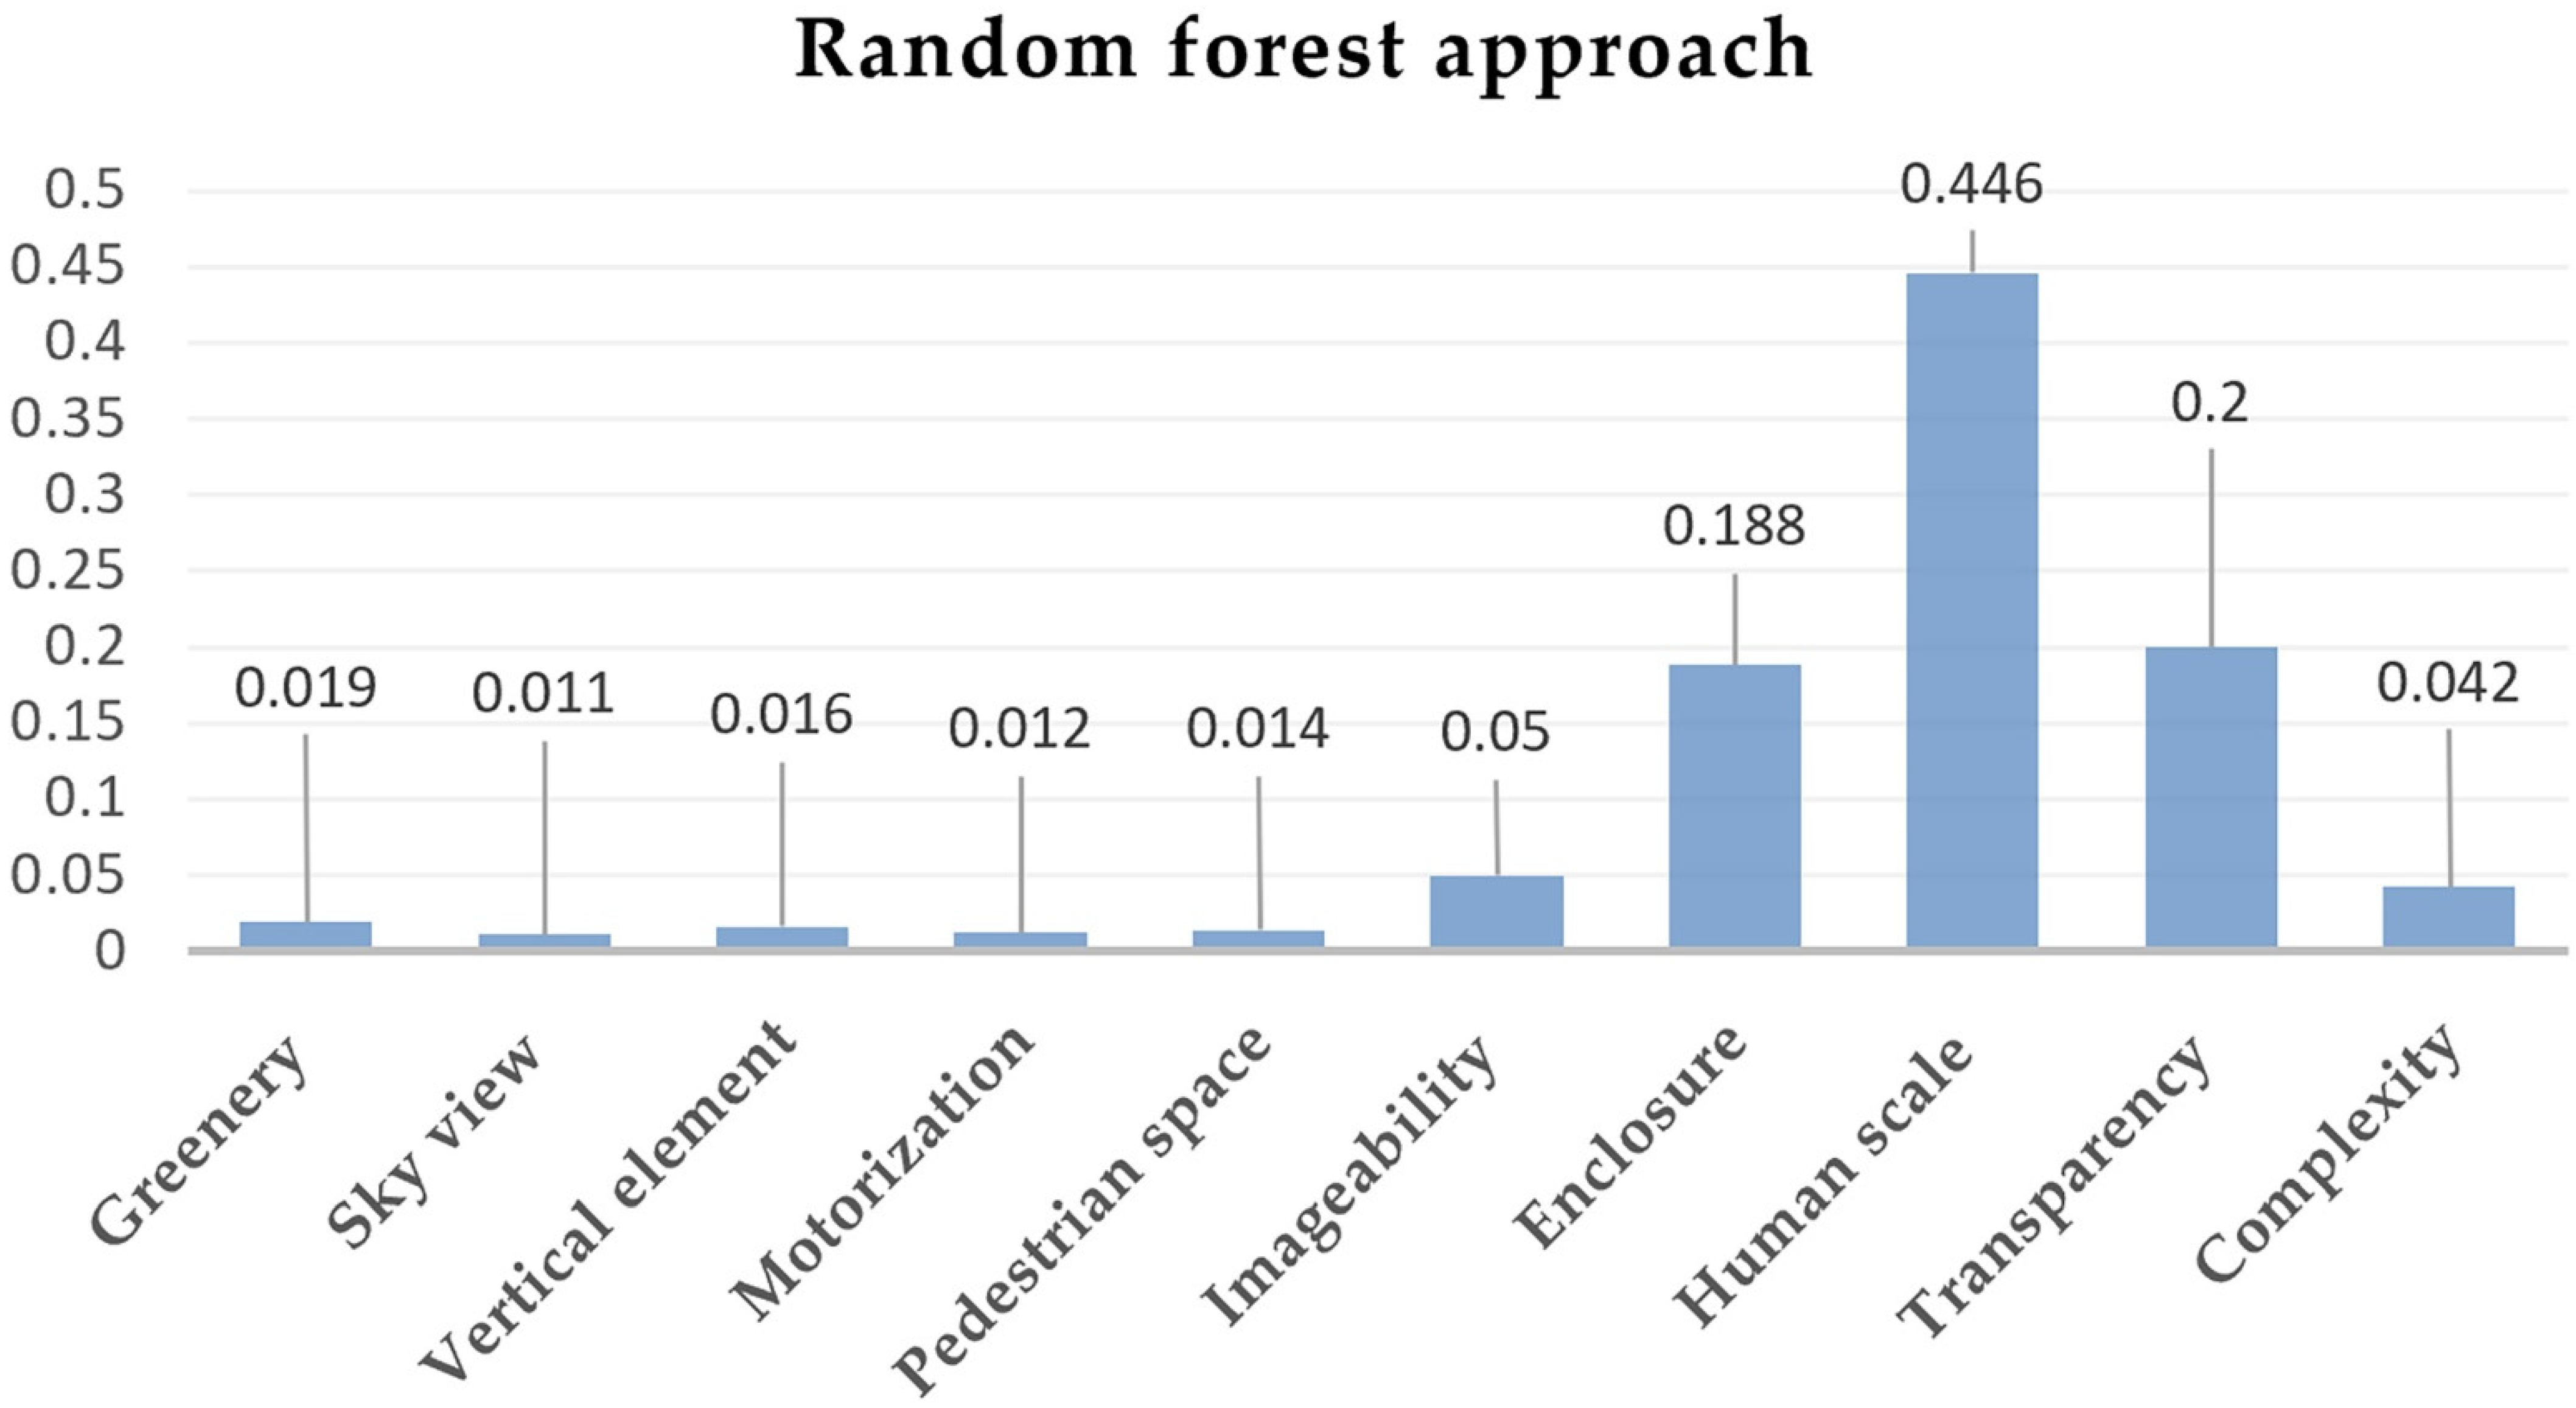
Unlike previous studies that used only one way to analyze the importance ranking of each key indicator for visual quality, this study also analyzed the relationship between each key indicator and the visual quality of the street using the random forest approach to further verify the validity of the results. Random forests are highly interpretable, and the Gini index, or information entropy, can be calculated for each node. The larger this value is, the more effective and important the trait represented by that node is in this split. The importance of each trait can be obtained by aggregating the Gini index statistics of all the nodes. Figure 12 shows that the importance of human scale and transparency with respect the visual quality of the street is high (0.446 and 0.2, respectively). The imageability and enclosure are of average importance to the visual quality of the street, and the greenery, sky view, vertical element, motorization, pedestrian space, and complexity are less important to the visual quality of the street. This result is highly compatible with the results of the previous Pearson analysis and proves the validity of this study.
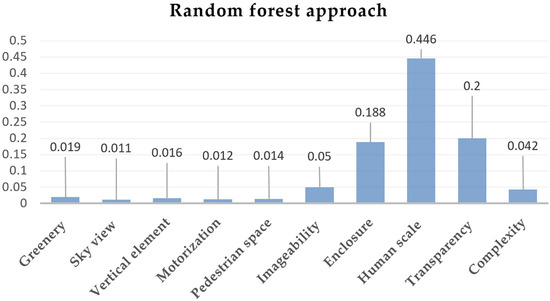
Figure 12.
Impact of key indicators in visual quality assessment by random forest.
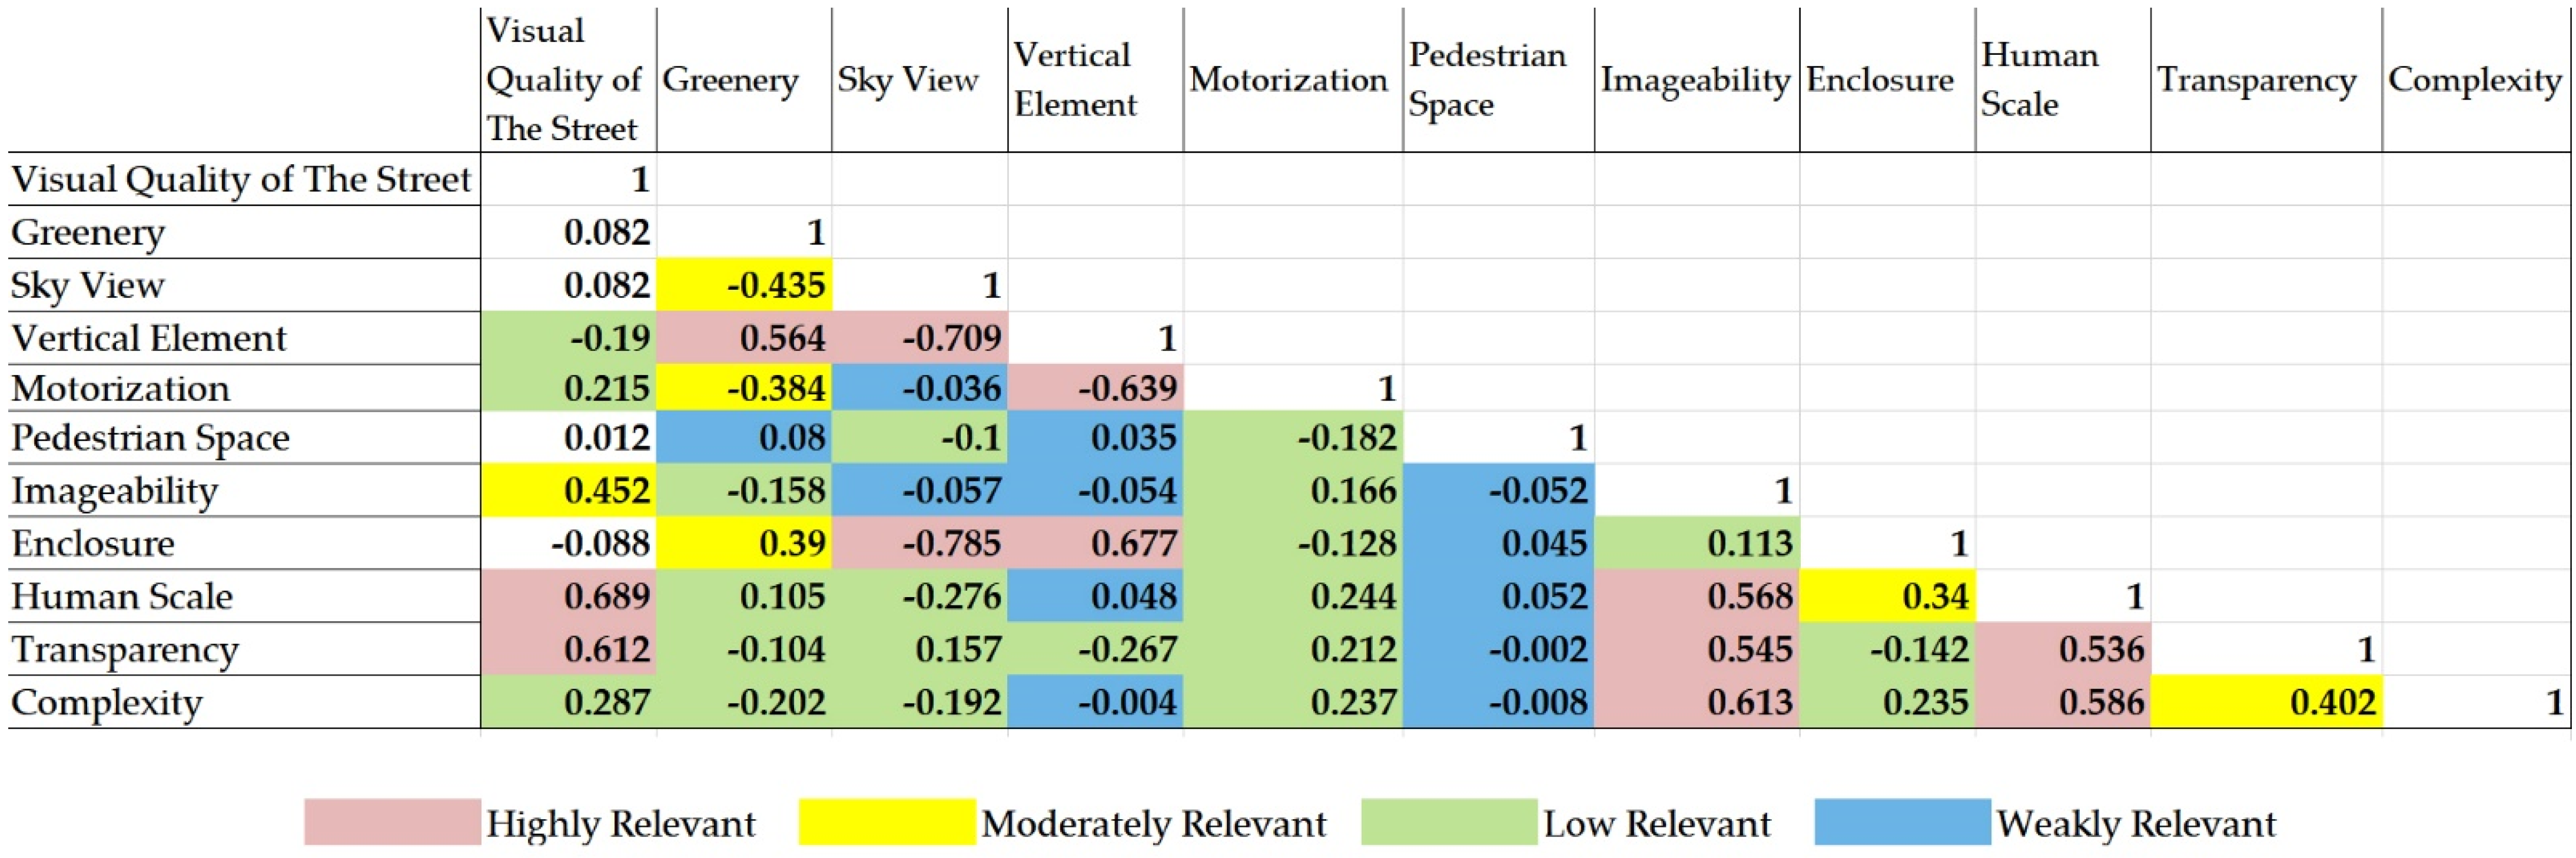
4.5. Relationship between Objective and Subjective Indicators
To analyze the relationship between the objective and subjective indicators, the Pearson correlation coefficient was used to calculate the degree of correlation between the key indicators affecting visual quality. As shown in Figure 13, the highly relevant ones are the following groups: vertical element interface and greenery, vertical element and sky view, motorization and vertical element, enclosure and sky view, enclosure and vertical element, human scale and imageability, transparency and imageability, transparency and human scale, complexity and imageability, and complexity and human scale.
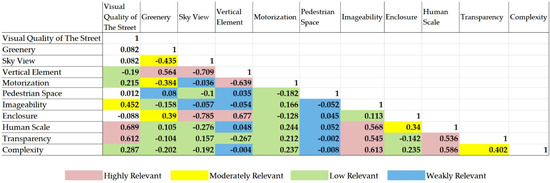
Figure 13.
Relationship between objective and subjective indicators.
Moderately related are the following groups: sky view and greenery, motorization and greenery, enclosure and greenery, human scale and enclosure, and complexity and transparency. Among them, the higher the greenery, the lower the degree of sky view and motorization. The correlation between other key indicators is low. Increasing street greenery can strengthen the sense of shade and enhance the enclosure of the street space while also reducing the visibility of the sky and the openness of the street space. Unlike previous studies that focused only on the impact of every key indicator on the visual quality of streets, this study investigates the relationship between objective indicators and subjective indicators, in addition to analyzing the former. And the results of this analysis are consistent with classical street design theory.
4.6. Validation of the Assessment Results
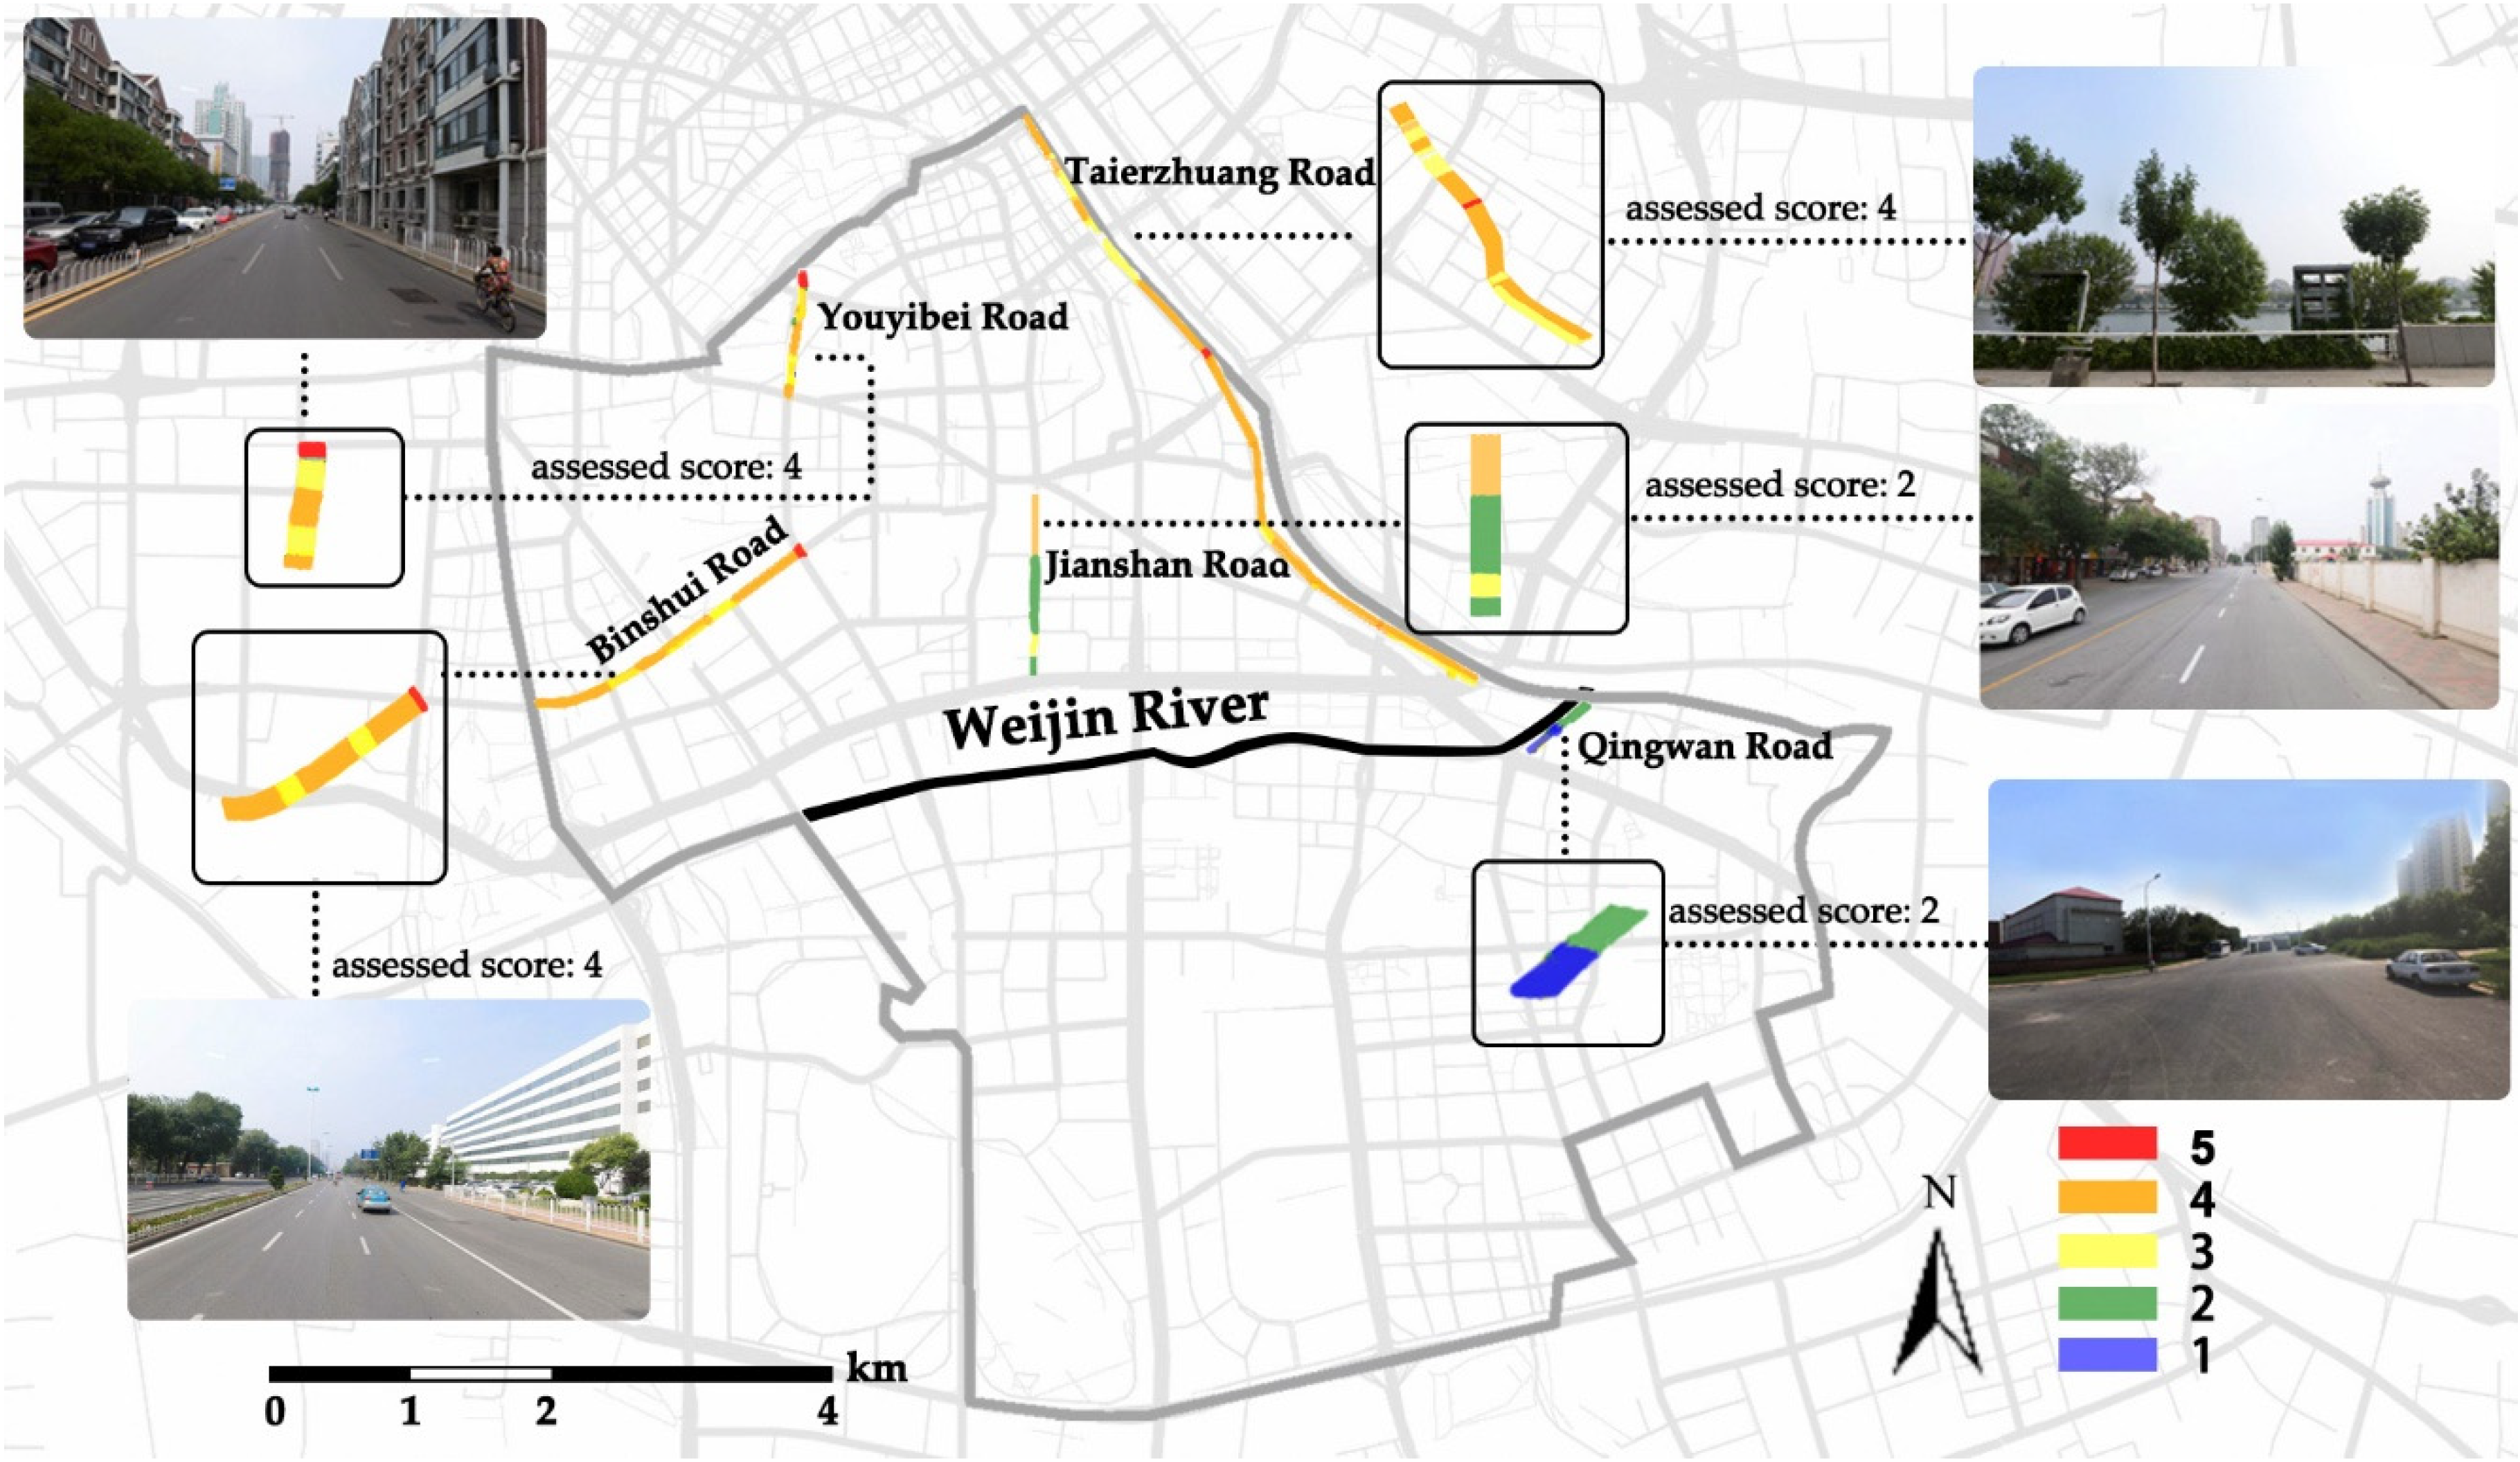
To further verify the accuracy of the machine learning assessment results, we compared the results of the intelligent assessment model’s assessment of the visual quality of the street with the landscape improvement part of the 2022 Key Work Deployment Report by Hexi District’s government [53]. It shows that streets that received lower scores from the intelligent assessment model (1–2) were assessed by the government report as needing priority improvements. Streets that received higher scores (4–5) from the intelligent assessment model were assessed in the government report as needing maintenance to maintain the current status to beautify the cityscape (Table 4). For example, Qingwan Road was rated 2 by the intelligent assessment model, with a low greenery rate (0.3395). It was assessed in the report as a street in need of improvement, specifically needing a “greenery upgrade”. Jianshan Road was rated 2 by the intelligent assessment model, with a greenery rate of only 0.0864. It is assessed in the report as needing a greenery enhancement. Youyibei Road, Bindhui Road, and Taierzhuang Road were rated 4 by the intelligent assessment model, and the report recommended “maintenance and beautification of the cityscape” for these roads. This indicates that the assessment results of the intelligent assessment model are in good agreement with urban designers’ real assessments of streets (Figure 14).
Table 4.
Comparison of the assessment results of the intelligent assessment model with the assessment results of the government report.
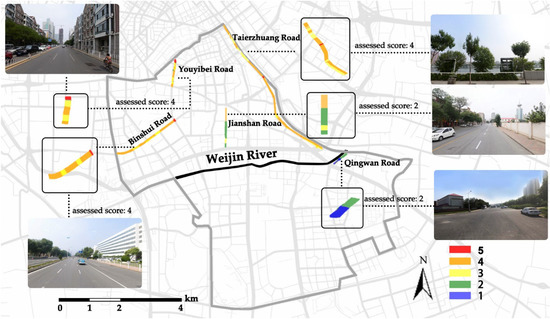
Figure 14.
Comparison of actual street status and results of the intelligent assessment model.
4.7. Potential Applications
First, in terms of academic research, the visual quality of streets is assessed mainly through a combination of objective and subjective assessment methods. However, the assessment data of objective indicators are limited, and there are differences in subjective perception assessment criteria. On the one hand, the intelligent assessment driven by a machine learning algorithm can synthesize expert approaches to assess objective indicators. On the other hand, the public perception-based approaches can be integrated to learn from and analyze a large number of samples to obtain the assessments of subjective indicators and the visual quality of streets. The assessment method proposed in this study not only measures these key indicators and the visual quality of a street objectively and consistently, but the assessment results could also assist studies related to visual quality assessment. This includes the analysis of the relationship between each key indicator and the visual quality of the street, as well as an analysis of the relationship between key indicators.
Second, in terms of design application, the assessment methodology of this research allows the visual quality of the street and the various indicators affecting visual quality to be assessed. The obtained visual quality scores can provide insights about streets with different statuses: for a completed street landscape, the assessment of the visual quality can infer the strengths and weaknesses of the street landscape quality, clarify the characteristics and positioning of the local landscape based on the assessment of key indicators, provide reference for upgrading and transforming the street quality, formulate development strategies for improving public space, and provide targeted scientific basis for landscape protection planning. For streets that are still in the planning and designing stage, the analysis of the relationship between key indicators and the visual quality of the street can reveal which key indicators have a greater influence on the visual quality of the streets. Thus, it provides auxiliary decision-making and extracts optimal design solutions. For instance, in the street upgrade of this study area, more trees can be planted for the existing streets with low greenery rate to enhance the sense of shading and strengthen the street space enclosure, while contributing to the reduction of the visibility of the sky and the openness of the street space. This improves the visual quality of the street and is user-friendly. For streets with low pedestrian space, in addition to expanding pedestrian space, increasing street greenery and improving the human scale to increase the attractiveness to pedestrians should be considered as a priority strategy to promote high visual quality of streets.
5. Discussion
5.1. Large-Scale Data Improves the Speed and Accuracy of Street Visual Quality Assessment
In contrast to recent studies using machine learning algorithms and large-scale SVIs, this study focuses on the visual quality of the street [37,54]. One of the highlights of the method in this study is that it provides large-scale data support for the intelligent assessment of street visual quality. A scientific and efficient method is provided for the scoring of the key indicators affecting visual quality. Supported by machine learning techniques such as PaddleSeg, NIMA, and random forest, this study efficiently used large-scale street image data to establish assessment models of objective and subjective indicators as well as an assessment model of visual quality. The scale of research data is expanded to improve the speed and accuracy of these assessments.
5.2. Efficient Assessment of Subjective Indicators Using Machine Learning Techniques
Some previous studies have also applied machine learning techniques to street visual quality assessment, but mainly for objective indicators assessment and overall assessment of street visual quality, which has led to the fact that some subjective indicators assessment is often neglected in studies using machine learning to evaluate visual quality [44,50]. In this study, machine learning algorithms are used to evaluate not only objective indicators and street visual quality, but also to build assessment models that can automatically score subjective indicators. In particular, some subjective indicators that were not easily measured and ignored in previous studies were measured more accurately. For example, this study provides detailed measurements of imageability and transparency. Based on the ideas in this study, more subjective indicators can be measured in the future. A large number and fine scoring of subjective indicators can reflect all aspects of street space quality more comprehensively and facilitate the development of design countermeasures.
5.3. Machine Assessment Effectively Replaces Manual Assessment and Improves Assessment Efficiency
In terms of subjective indicators and visual quality assessment, another important highlight of this study is the use of machine assessment instead of manual assessment. On the one hand, unlike previous methods that rely on manual work in the assessment of subjective indicators [42,55], the assessment model established in this study can replace manual scoring more effectively and reduce scoring costs, rapidly and efficiently processing all streetscapes to improve the efficiency of assessment. On the other hand, the assessment models of the subjective indicators and the visual quality, established based on machine learning, output results close to human subjective assessments for the visual quality of streets. In addition, it also enables an objective measurement of assessments that previously relied on subjective judgment and experience. This improvement enables researchers, urban designers, landscape architects, and urban decision makers to focus on every influencing factor related to urban design quality in public space design in a timely manner.
5.4. Improving the Interpretability of Relationships
Based on the use of machine learning to obtain the scores of key indicators and the scores of visual quality of streets, this study analyzed the relationship between landscape quality and each key indicator, and the relationship between each key indicator. Although previous studies have also used machine learning to obtain the scores of key indicators and rank the importance of key indicators, they have mainly focused on the relative importance of each key indicator to the street quality [18,56], with less analysis of the relationship between objective and subjective indicators. This study not only ranked the key indicators affecting the visual quality of streets in order of importance, but also verified the accuracy of the ranking using random forest. Moreover, the relationship between each key indicator was also analyzed and the interpretability of the relationship between objective and subjective indicators was improved in this study. The importance ranking of objective and subjective indicators can help streets that need to improve visual quality and provide micro-scale design strategies. In addition, the interpretation of the relationship between each evaluation element provides research ideas and research materials for visual quality research and urban design theory.
5.5. Limitations and Future Improvements
The assessment method in this study is still in its infancy, and there is still much room for improvements and adjustments. First, this study used urban streets as the object of study, which also allows for a more detailed assessment of street classes. It can combine the assessment of the visual quality of streets with specific street types and functions. The assessment results will, hence, be more instructive and the validity of the assessment will be higher. Second, this study used some expert assessment data as training samples to establish a subjective indicator model. In future, we will further explore the issue of landscape preference and select different types of people for large-scale public assessment. Moreover, the findings will be combined with our analysis method. Third, the key indicators involved in this study are limited, and they should be further expanded for different types of streets. In the next step of the research, it is also possible to refer to the Biophilic Urbanism framework to bring nature into the human street living environment, supplementing or improving key indicators in the street based on visual quality assessment, allowing people to benefit psychologically and physiologically from a variety of promoting the relationship between humans, nature and the city, and improving the visual quality of the street [57,58,59]. Moreover, the correlation of each key indicators could be further explored. We are developing suitable algorithms to facilitate this part of the study. Meanwhile, although this study analyzed the relationship between objective and subjective indicators, the research on how they interact with each other and the influence between objective and subjective indicators is not deep enough, and more in-depth analysis will be conducted in the future using machine learning algorithms. In addition, how to combine the results of this study with subsequent design and control to provide specific improvement plans for streetscapes that can be referred to for different street types, to classify the collected streetscapes, and to form a database are other directions of future work.
6. Conclusions
This study aimed to establish an intelligent assessment method for the visual quality of urban streets. Using SVIs as the assessment medium, an assessment model of objective indicators based on PaddleSeg, an assessment model of subjective indicators based on NIMA, and an assessment model of the visual quality of the street based on a random forest were established. Then, an intelligent analysis was carried out on the influence of each key indicators on visual quality, and the relationship between objective and subjective indicators was studied. The method of intelligent assessment of visual quality of the street were proposed and optimization suggestions were given. Different from the traditional visual quality assessment methods, the methods in this study use the advantages of machine learning techniques in image recognition, classification, and semantic understanding to combine objective and subjective, qualitative, and quantitative methods. The use of machine learning techniques has improved the scientific validity and efficiency of the visual quality assessment of streets and expanded the scale of visual quality assessment data. Moreover, it makes the shift from manual assessment to intelligent automatic assessment. Finally, it realizes the intelligence and digitalization of visual quality assessment and promotes the sustainable development of the landscape. This method can be used not only for cities in China, but also for cities in many other countries. We expect this research to promote the development of visual quality assessment to intelligent assessment and provide help for urban visual quality research and improvements of the human living environment.
Author Contributions
Conceptualization, J.Z.; methodology, J.Z.; software, Q.G.; validation, J.Z. and Q.G.; formal analysis, J.Z.; investigation, J.Z.; resources, J.Z.; data analysis, Q.G.; writing—original draft preparation, J.Z.; writing—review and editing, J.Z.; project administration, J.Z. All authors have read and agreed to the published version of the manuscript.
Funding
This research was supported by the National Natural Science Foundation of China (Grant No. 52108059).
Institutional Review Board Statement
Not applicable.
Informed Consent Statement
Not applicable.
Data Availability Statement
The data presented in this study are available on request. The data are not publicly available due to privacy.
Conflicts of Interest
The authors declare no conflict of interest.
References
- McCloskey, M. Wilderness Act of 1964: Its Background and Meaning. Or. L. Rev. 1965, 45, 288. [Google Scholar]
- Anderson, F.R. NEPA in the Courts: A Legal Analysis of the National Environmental Policy Act, 1st ed.; RFF Press: New York, NY, USA, 2013; pp. 1–324. [Google Scholar]
- Bacon, W.R. The visual management system of the Forest Service, USDA. In Proceedings of the Our National Landscape: A Conference on Applied Techniques for Analysis and Management of the Visual Resource, Incline Village, NV, USA, 23–25 April 1979. [Google Scholar]
- Ross, R.W., Jr. The bureau of land management and visual resource management—An overview. In Proceedings of the Our National Landscape: A Conference on Applied Techniques for Analysis and Management of the Visual Resource, Incline Village, NV, USA, 23–25 April 1979. [Google Scholar]
- Schauman, S.; Adams, C. Soil conservation service landscape resource management. In Proceedings of the Our National Landscape: A Conference on Applied Techniques for Analysis and Management of the Visual Resource, Incline Village, NV, USA, 23–25 April 1979. [Google Scholar]
- Streetscape Guidance. Available online: https://content.tfl.gov.uk/streetscape-guidance-.pdf (accessed on 1 March 2019).
- Street Design Manual. Available online: https://www.nycstreetdesign.info/sites/default/files/2020-03/FULL-MANUAL_SDM_v3_2020.pdf (accessed on 1 January 2020).
- Sydney Streets Code 2021. Available online: https://www.cityofsydney.nsw.gov.au/design-codes-technical-specifications/sydney-streets-code (accessed on 12 May 2021).
- Shanghai Planning and Land Resource Administration Bureau; Shanghai Municipal Transportation Commission; Shanghai Urban Planning and Design Research Institute. Shanghai Street Design Guidelines, 1st ed.; Tongji University Press: Shanghai, China, 2016; pp. 14–181. [Google Scholar]
- The Urban Design Guidelines for Beijing Street Regeneration and Governance. Available online: http://ghzrzyw.beijing.gov.cn/biaozhunguanli/bz/cxgh/202106/P020210623592985465247.pdf (accessed on 23 June 2021).
- Huang, J.T.; Li, J.; Gong, Y. An analysis of convolutional neural networks for speech recognition. In Proceedings of the 2015 IEEE International Conference on Acoustics, Speech and Signal Processing (ICASSP), South Brisbane, QLD, Australia, 19–24 April 2015. [Google Scholar]
- Zhao, J.; Cao, Y. Overview of artificial intelligence methods in landscape architecture research. Chin. Landsc. Archit. 2020, 36, 82–87. [Google Scholar]
- Li, X.; Cai, B.Y.; Ratti, C. Using street-level images and deep learning for urban landscape studies. Landsc. Archit. Front. 2018, 6, 20–30. [Google Scholar] [CrossRef] [Green Version]
- Naik, N.; Philipoom, J.; Raskar, R.; Cesar, H. Streetscore-predicting the Perceived Safety of One Million Streetscapes. In Proceedings of the IEEE Conference on Computer Vision and Pattern Recognition Workshops, Columbus, OH, USA, 23–28 June 2014. [Google Scholar]
- Naik, N.; Kominers, S.D.; Raskar, R.; Hidalgo, C.A. Computer vision uncovers predictors of physical urban change. Proc. Natl. Acad. Sci. USA 2017, 114, 7571–7576. [Google Scholar] [CrossRef] [PubMed] [Green Version]
- Al-Sayed, K.; Penn, A. Translating Analytical Descriptions of Cities into Planning and Simulation Models. In Proceedings of the Design Computing and Cognition’16, Chicago, IL, USA, 27–29 June 2016; pp. 1–20. [Google Scholar]
- Tang, J.; Long, Y. Measuring visual quality of street space and its temporal variation: Methodology and its application in the Hutong area in Beijing. Landsc. Urban Plan. 2019, 191, 103436. [Google Scholar] [CrossRef]
- Ye, Y.; Zeng, W.; Shen, Q.; Zhang, X.H.; Lu, Y. The visual quality of streets: A human-centred continuous measurement based on machine learning algorithms and street view images. Environ. Plan. B Urban Anal. City Sci. 2019, 46, 1439–1457. [Google Scholar] [CrossRef]
- Zhang, K.; Li, C.L.; Zhang, J.Y. A Study on the Spatio-temporal Evolution of Inbound Tourists’Perceptions and Behaviors Based on Big Pictorial Data: The Case of Beijing. Tourism Tribune/Lvyou Xuekan 2020, 35, 61–70. [Google Scholar]
- Lynch, K. The Image of the City; MIT Press: Cambridge, MA, USA, 1964; p. 10. [Google Scholar]
- Ashihara, Y. The Aesthetic Townscape, 1st ed.; MIT Press: Cambridge, MA, USA, 1983; pp. 3–98. [Google Scholar]
- Jacobs, J. The Death and Life of Great American Cities, 1st ed.; Random House: New York, NY, USA, 1961; pp. 5–57. [Google Scholar]
- Whyte, W.H. The Social Life of Small Urban Spaces, 1st ed.; Project for Public Spaces, Inc.: Washington, DC, USA, 1980; pp. 3–40. [Google Scholar]
- Daniel, T.C. Whither scenic beauty? Visual landscape quality assessment in the 21st century. Landsc. Urban Plan. 2001, 54, 267–281. [Google Scholar] [CrossRef]
- Tveit, M.S.; Sang, O.Å.; Hagerhall, C.M. Scenic beauty: Visual landscape assessment and human landscape perception. In Environmental Psychology: An Introduction, 1st ed.; Steg, L., de Groot, J.I.M., Eds.; John Wiley & Sons Ltd: New York, NY, USA, 2018; Volume 5, pp. 45–54. [Google Scholar]
- Daniel, T.C.; Vining, J. Methodological issues in the assessment of landscape quality. In Behavior and the Natural Environment, 1st ed.; Altman, I., Lawton, M.P., Wohlwill, J.F., Eds.; Springer: Boston, MA, USA, 1983; Volume 6, pp. 39–84. [Google Scholar]
- Palmer, J.F.; Hoffman, R.E. Rating reliability and representation validity in scenic landscape assessments. Landsc. Urban Plan. 2001, 54, 149–161. [Google Scholar] [CrossRef]
- Kaplan, R. The analysis of perception via preference: A strategy for studying how the environment is experienced. Landsc Plan. 1985, 12, 161–176. [Google Scholar] [CrossRef] [Green Version]
- Brown, T.C.; Daniel, T.C. Context effects in perceived environmental quality assessment: Scene selection and landscape quality ratings. J. Environ. Psychol. 1987, 7, 233–250. [Google Scholar] [CrossRef]
- Daniel, T.C.; Boster, R.S. Measuring Landscape Esthetics: The Scenic Beauty Estimation Method, 1st ed.; Department of Agriculture, Forest Service, Rocky Mountain Forest and Range Experiment Station: Fort Collins, CO, USA, 1976; pp. 2–61. [Google Scholar]
- Lange, E.; Legwaila, I. Visual landscape research–Overview and outlook. Chinese Landsc. Archit. 2012, 28, 5–14. [Google Scholar]
- Zhao, J.W.; Zhang, L.; Wu, H. Visual Landscape Preference Assessment Overview and Development in the Future. Chin. Landsc. Archit. 2015, 7, 48–51. [Google Scholar]
- Kaltenborn, B.P.; Bjerke, T. Associations between environmental value orientations and landscape preferences. Landsc. Urban Plan. 2002, 59, 1–11. [Google Scholar] [CrossRef]
- Pflüger, Y.; Rackham, A.; Larned, S. The aesthetic value of river flows: An assessment of flow preferences for large and small rivers. Landsc. Urban Plan. 2010, 95, 68–78. [Google Scholar] [CrossRef]
- Han, J.W.; Dong, L. A Study of Visual Evaluation of Streetscape Based on the Psychophysical Method. Chin. Landsc. Archit. 2015, 5, 116–119. [Google Scholar]
- Tieskens, K.F.; Van, Z.B.T.; Schulp, C.J.E.; Verburg, P.H. Aesthetic appreciation of the cultural landscape through social media: An analysis of revealed preference in the Dutch river landscape. Landsc. Urban Plan. 2018, 177, 128–137. [Google Scholar] [CrossRef]
- Han, X.; Wang, L.; Seong, S.H.; He, J.; Taeyeol, J. Measuring Perceived Psychological Stress in Urban Built Environments Using Google Street View and Deep Learning. Front. Public Health 2022, 10, 891736. [Google Scholar] [CrossRef]
- Chen, C.; Li, T.; Zhou, W. Research on Urban Street Landscape Guidelines Based on Constituent Elements: A Study of Tianjin Street Design Guidelines. In Proceedings of the Planning Innovation—2010 China Urban Planning Annual Conference, Chong Qing, China, 15 October 2010. [Google Scholar]
- Pendola, R.; Gen, S. Does “Main Street” promote sense of community? A comparison of San Francisco neighborhoods. Environ. Behav. 2008, 40, 545–574. [Google Scholar] [CrossRef]
- Garré, S.; Meeus, S.; Gulinck, H. The dual role of roads in the visual landscape: A case-study in the area around Mechelen (Belgium). Landsc. Urban Plan. 2009, 92, 125–135. [Google Scholar] [CrossRef]
- Ewing, R.; Handy, S. Measuring the unmeasurable: Urban design qualities related to walkability. J. Urban Plan. Dev. 2009, 14, 65–84. [Google Scholar] [CrossRef]
- Ewing, R.; Clemente, O.; Neckerman, K.M.; Purciel-Hill, M.; Quinn, J.W.; Rundle, A. Measuring Urban Design: Metrics for Livable Places, 3rd ed.; Island Press: Washington, DC, USA, 2013; p. 6. [Google Scholar]
- Deng, Y.L.; Chen, Q.H.; Guo, X.C. The impact of street environment on pedestrian walking experience. Urban Probl. 2018, 6, 43–50. [Google Scholar]
- Ye, Y.; Zhang, Z.X.; Zhang, X.H.; Zeng, W. Human-scale Quality on Streets: A Large-scale and Efficient Analytical Approach Based on Street View Images and New Urban Analytical Tools. Urban Plan. Int. 2019, 34, 18–27. [Google Scholar] [CrossRef]
- Guo, R.; Wang, H.C. Influence of Landscape Composition Characteristics on Walking Activities in Life Service Streets and Its Optimization: A Case Study of Streets in Downtown Tianjin. Landsc. Archit. 2020, 27, 99–105. [Google Scholar]
- Tao, A.; Sapra, K.; Catanzaro, B. Hierarchical multi-scale attention for semantic segmentation. arXiv 2020, arXiv:2005.10821. [Google Scholar]
- GitHub. Available online: https://github.com/PaddlePaddle/PaddleSeg/tree/release/2.3/contrib/CityscapesSOTA (accessed on 29 December 2021).
- Cavalcante, A.; Mansouri, A.; Kacha, L.; Barros, A.K.; Takeuchi, Y.; Matsumoto, N. Measuring streetscape complexity based on the statistics of local contrast and spatial frequency. PLoS ONE 2014, 9, e87097. [Google Scholar] [CrossRef] [PubMed]
- Cheng, L.; Chu, S.; Zong, W.; Li, S.Y.; Wu, J.; Li, M.C. Use of tencent street view imagery for visual perception of streets. ISPRS 2017, 6, 265. [Google Scholar] [CrossRef]
- Tang, J.X.; Long, Y. Metropolitan street space quality evaluation: Second and third ring Of Beijing, inner ring of Shanghai. Planners 2017, 33, 68–73. [Google Scholar]
- Di, D.; Jiang, Y.H.; Ye, D.; Ye, Y. Street Space Quality Evaluation Supported by New Urban Science: The Central District of Shanghai. Planners 2021, 37, 5–12. [Google Scholar]
- Talebi, H.; Milanfar, P. NIMA: Neural image assessment. IEEE Trans. Image Process. 2018, 27, 3998–4011. [Google Scholar] [CrossRef] [Green Version]
- Tianjin Hexi District Government. Available online: http://www.tjhx.gov.cn/hxxw/szyw/202202/t20220216_5805175.html (accessed on 16 February 2022).
- Hu, C.B.; Zhang, F.; Gong, F.Y.; Rattic, C.; Li, X. Classification and mapping of urban canyon geometry using Google Street View images and deep multitask learning. Build. Environ. 2020, 167, 106424. [Google Scholar] [CrossRef]
- Shao, Y.H.; Liu, B.Y. Urban Streetscape Visual Aesthetics Assessment Research. Chin. Landsc. Archit. 2017, 33, 17–22. [Google Scholar]
- Zhang, L.; Zhang, R.; Yin, B. The impact of the built-up environment of streets on pedestrian activities in the historical area. Alex. Eng. J. 2021, 60, 285–300. [Google Scholar] [CrossRef]
- Wilson, E.O. Biophilia; Harvard University Press: Cambridge, MA, USA, 1984; pp. 1–10. [Google Scholar]
- Mehaffy, M.W.; Kryasheva, Y.; Rudd, A.; Salingaros, N.A. A Pattern Language for Growing Regions: Places, Networks, Processes a Collection of 80 New Patterns for a New Generation of Urban Challenges; Sustasis Press: Portland, OR, USA, 2020; pp. 56–59. [Google Scholar]
- Lee, S.; Kim, Y. A framework of biophilic urbanism for improving climate change adaptability in urban environments. Urban For. Urban Green. 2021, 61, 127104. [Google Scholar] [CrossRef]


Publisher’s Note: MDPI stays neutral with regard to jurisdictional claims in published maps and institutional affiliations. |
© 2022 by the authors. Licensee MDPI, Basel, Switzerland. This article is an open access article distributed under the terms and conditions of the Creative Commons Attribution (CC BY) license (https://creativecommons.org/licenses/by/4.0/).