Article

Spatial-Temporal Characteristics of Ecosystem Service Values of Watershed and Ecological Compensation Scheme Considering Its Realization in Spatial Planning

1
School of Public Administration, China University of Geosciences, Wuhan 430074, China
2
School of Natural Resources and Surveying, Nanning Normal University, Nanning 530001, China
*
Author to whom correspondence should be addressed.
Sustainability 2022, 14(13), 8204; https://doi.org/10.3390/su14138204
Submission received: 10 May 2022 / Revised: 1 July 2022 / Accepted: 2 July 2022 / Published: 5 July 2022
(This article belongs to the Topic Climate Change and Environmental Sustainability)

Abstract

:
A reasonable ecological compensation scheme for watersheds is beneficial for water resource protection and ecological sustainability. The existing literature has few watershed ecological compensation (WEC) schemes based on long-term observation and large spatial scale analysis of ecosystem service value (ESV) and considering its realization in spatial planning. Therefore, in order to establish a WEC scheme and integrate it into spatial planning, we take the Middle Route of South-to-North Water Diversion Project (MRSNWDP), a water resource area protecting the water resources at a huge local economic development cost, as a case study, and calculate the change trend and change range of the watershed’s total ESV from 1990 to 2015, thus, forming the WEC scheme. The results show the total ESV in the study area shows a slight downward fluctuation trend from 1990 to 2015, decreasing by 3310.70. The total ESV in most types of ecosystem service (ES) functions is relatively reduced except for the increase in functions of water conservation, waste treatment, and entertainment and culture. In addition, the change rate of total ESV has been in a high-value agglomeration, and the ES capabilities have been increasing since 2000, while the growth trend of the ES capabilities has been weak, and the high-value agglomeration has been expanding from the core area of Danjiangkou reservoir to the upstream and surrounding areas since 2005. We formulate a WEC scheme according to the partition idea of spatial planning that the priority compensation area accounts for 25.34% of the total study area, and the second priority compensation area, the general compensation area, and the potential compensation area account for 25.34%, 47.48%, and 12.80%, respectively.

1. Introduction

The economic activities of humankind have had an irreversible impact on ecosystems, manifesting as frequent environmental pollution events [1,2,3]. Ecological compensation, also known as payment for ecosystem services (PES), has been widely regarded as one efficient solution for ecological conservation [4,5]. The basic principle of ecological compensation is “who benefits, who compensates, who pollutes, who pays”, aiming at balancing the benefits between ecosystem service (ES) supply and ES demand [6,7]. The ecological compensation fund can be used by the ES providers to protect or restore the ecosystem, thus realizing ecological sustainability [8]. Even though ecological compensation could achieve a win-win situation of ecological conservation and economic development theoretically [9,10,11], there are difficulties when taking it into practice [12], such as how to clearly identify the subject and object of ecological compensation, how to unify the compensation standard, how to distribute the compensation funds, and so on [13,14].
Scholars have investigated ecological compensation for different ecological zones, such as national scenic spots [15], grassland [16], agriculture [17], watersheds [9], and so on. Among all the above ecological compensation, watershed ecological compensation (WEC) has attracted increasingly close attention. The dislocation of spatial distribution between the supply and demand of ES makes the study on WEC more complex [18]. One of the sources of the dislocation of spatial distribution between stakeholders of WEC is the transboundary nature of water pollution [19] present downstream is affected by the water pollution flowing from upstream hence upstream obtains more economic development with less ecosystem damage costs. This phenomenon makes it difficult to identify stakeholders of WEC, further restricting the collection and distribution of ecological compensation funds [20].
Stakeholders are the most important criterion in constructing a WEC scheme, thus sparking a great deal of research. Hu et al. [21] applied a “reward-punishment” evolutionary game model to study the stakeholders of ecological compensation between upstream and downstream in Xiangjiang River Basin; Gao et al. [22] employed the same method by adding the central government into the model to explore the factors influencing WEC in the Chinese Eastern Route of South-to-North Water Diversion Project (SNWDP); Yi et al. [23] developed a Stackelberg game model to investigate WEC strategies for transboundary pollution control by considering multiple upstream and downstream regions; Liu et al. [24] constructed the WEC scheme of the Huaihe River Basin and suggested that Anhui Province (a mid-stream administrative region) should receive ecological compensation from Henan Province (an upstream administrative region). Studies concentrated on the micro stakeholders of citizens have investigated the factors influencing people’s willingness to pay for WEC by applying the questionnaire survey [25,26,27]. Conclusively, there are mainly two categories of determinants in making a WEC scheme—opportunity cost method and contingent and valuation method (CVM). The former takes the sacrifice of the ecosystem as the opportunity cost and compensates for the cost; the latter determines the cost or price that stakeholders are willing to pay for the ecosystem as the compensation basis. Gao et al. [11] pointed out that neither the opportunity cost method nor the CVM are favorable options because scholars held different opinions on the opportunity cost, and there was the subjectivity of residents’ paying willingness. Hence, they proposed that the establishment of a WEC scheme should be on the basis of ecosystem service value (ESV), and they applied the ESV method to explore the WEC scheme in Taihu Basin (Jiangsu section). Gao et al. [28] also used this method to identify WEC in the Chinese Eastern Route of SNWDP.
Even though existing studies have provided important preferences and regarded ESV as a useful method to determine a WEC scheme [11,28], there are still limitations as follows: (1) previous studies lack long-term observation and large spatial scale analysis on ESV to establish the WEC scheme of a special basin. Moreover, the impact of human economic activities on an ecosystem is a gradual process, and a reasonable WEC scheme could only be concluded from the long-term observations of ESV; (2) Although some WEC schemes have been put forward, little research considers how to determine the prioritization of compensation areas when there are limited compensation funds; (3) Previous studies primarily take the cross-administrative water pollution as the dislocation of spatial distribution between the supply and demand of ES and used it to study WEC, but they neglect water supply functions of watersheds, which also causes the same dislocation of spatial distribution among stakeholders during making a WEC scheme. Moreover, WEC in the poverty-stricken areas that are caused by trans-regional clean water supply severely lacks attention; (4) Spatial planning is an important means of territorial spatial governance at present, but the research of the ecological compensation scheme at this stage does not consider how to integrate spatial planning.
In order to fix the research gaps, the water resource area of the Middle Route of South-to-North Water Diversion Project (MRSNWDP) is regarded as a study case, where there not only exists the dual dislocation of spatial distribution between the supply and demand of ES (i.e., transboundary water pollution and water resource supply and demand) and WEC, but also contiguous poverty-stricken areas. MRSNWDP in China is a national strategic project (Data source: Middle route of China’s mega diversion project moves over 40 b cubic meters of water. http://english.www.gov.cn/news/topnews/202107/19/content_WS60f518c2c6d0df57f98dd3be.html, accessed on 19 April 2022), providing a typical case to study the issue of WEC. MRSNWDP not only guarantees water resource supply in north China, including the nation’s capital [29,30,31] but also contributes to solving the uneven distribution of water resources and promoting regional coordinated development in China [32,33]. The water source area of MRSNWDP has paid great attention to water resource protection to guarantee clean water resource supply at the expense of economic development [34], which leads to this region still being underdeveloped and even poverty-stricken. Exploring the ecological compensation scheme of the water resource area of MRSNWDP provides not only theoretical and practical reference values for WEC in a similar basin with the dual dislocation of spatial distribution in the world but also is valuable for ecological compensation issues in poor areas.
Therefore, we take the water resource area of MRSNWDP as the research area to construct the WEC scheme by considering its realization in spatial planning. By applying the geographic information system (GIS) and equivalent calculation methods to calculate the total ESV, we analyze the spatial-temporal dynamic change of the change range of total ESV and the change trend of the average annual change rate of total ESV and use the changing rule as the criterion to construct the WEC scheme, dividing areas into different priority compensation sections.

2. Analytical Framework

In order to integrate the WEC scheme into spatial planning, we construct the analytical framework as shown in Figure 1. First, we collect the land use/cover change (LUCC) of the water resource area of MRSNWDP from 1990 to 2015 (taking 5 years as a time section) to fully understand the general situation of the study area. Secondly, we classify the change of different land-use types for the preparation of calculating total ESV since different land-use types have different equivalent value coefficients. Thirdly, combined with the table of equivalent value coefficient of ESV, we calculate the total ESV (also named TESV in the following table or figure) in the whole region and different ES types. Furthermore, we measure the average annual change rate of the watershed’s total ESV and analyze the change range and change trend of it. Ultimately, the WEC scheme where different regions have different priority compensation classes is established by the combination of diverse change characteristics of the change range and change trend of the total ESV.

3. Material and Methods

3.1. Study Area

The water source area of MRSNWDP (31°31′–34°25′ N, 105°31′–112°2′ E) has a total surface area of 88,100 km2. It is located between the Qinling Mountains and Bashan mountains (Qin-Ba mountains). The main rivers involved are the Hanjiang River and the Danjiang River, and the landform in this area is mostly mountains, hills, and valleys (except for Hanzhong Basin). It belongs to the warm and semi-humid climate of the north subtropical monsoon area. This area plays an important role in alleviating the serious water resource shortages in North China and optimizing the water resource allocation (mainly in Beijing and Tianjin), benefiting 58.59 million inhabitants [35].
According to The 13th Five-Year Plan for water pollution prevention and soil and water conservation in the Danjiangkou reservoir area and upstream (http://www.gov.cn/xinwen/2018-01/05/content_5253642.htm, accessed on 5 March 2022), the water source area of MRSNWDP involves 46 counties in 14 cities of shaanxi, Hubei and Henan provinces, as well as Wanyuan City in Sichuan Province, Chengkou County in Chongqing Municipality and some odd towns and villages in Liangdang County of Gansu Province. In order to ensure the integrity of administrative units and the operability of the WEC scheme, we select the study sample at the county level and make the following processes: (1) deleting Wanyuan City, Chengkou County, and the odd areas in Liangdang County; (2) integrating the main city zone in the municipality into urban areas. Ultimately, 39 counties (districts) in three provinces are identified as our study area, as shown in Table 1 and Figure 2.
The basic development situations of the watershed in 2015 are shown in Table 1. In 2015, the total population of the study area was about 13.37 million, the area of cultivated land was about 25,000 km2, and the GDP was about 418.70 billion RMB. What should be mentioned is that the watershed is located in the concentrated and contiguous poverty-stricken areas of the Qin-Ba mountains, where there are 2.57 million poor people, 17 deeply poor counties, 26 national poverty alleviation key counties, and 8 provincial poverty alleviation key counties. In order to keep the water resource supply clean, this area cannot vigorously develop economically [36]. Generally, the economic and social development in this area is poorly developed.

3.2. Data Description

The data of land use/cover change in the water source area of MRSNWDP is processed as follows: first, we collect Landsat TM images from six time nodes in 1990/1995/2000/2005/2010/2015 (original data comes from Chinese Academy of Sciences (RESDC)) [37] with a resolution of 30 m and an imaging time of ±2a in each node; second, by using ArcGIS 10.2 software and human-computer interactive interpretation, the land use/cover change data of the above time nodes in the water source area of MRSNWDP are obtained. Following [38], we divide the land-use types into six categories (also called ecosystem classifications): forest, grassland, farmland, wetland, water, construction land, and unused land. The changes in the land use/cover from 1990 to 2015 in the water source area of MRSNWDP are shown in Figure 2. From 1990 to 2015, the most obvious change in the watershed is the increase in construction land. Compared with the rapid urbanization process in other regions in China, the change of construction land in that area is limited [39]. Meanwhile, the water resource area seems to have little change over time, indicating the water resource area undertakes important responsibilities in water protection and water supply functions, even at the cost of economic development. Hence, the WEC is vital in this area.

3.3. Methodology

3.3.1. Calculation of Total ESV

The calculation of ESV is a global scientific issue, but it also needs to incorporate regional characteristics. On the basis of the evaluation method of the global ESV proposed by Costanza et al. [40], Chinese scholars Xie et al. [41] conducted a questionnaire survey among 500 Chinese scholars in the research field of ecology and thus put forward a calculation model assessing the equivalent of ESV according to China’s natural resources [42]. The equivalent calculation methods were constantly developed and refined [42,43,44]. According to Xie et al. [41], an ecosystem provides ecological products and services (i.e., ES) for human beings through its ES function. The function of ES can be quantified as ESV, and the equivalent value coefficient of ESV per unit area is the quantified outcome. The method of calculating ESV based on its equivalent value has the advantage of comparing research units horizontally and vertically [42], better fitting our study target.
Therefore, we apply the equivalent calculation method and cite the most widely used equivalent value coefficient table of ESV in China [42] and use the concept of basic equivalent [41]. The basic equivalent is also known as the basic equivalent of ESV per unit area, referring to the average annual equivalent value of various ES functions per unit area of different types of ecosystems, which is the basis for constructing a dynamic scale representing the spatial-temporal dynamic change of ESV. In our study, the ecosystem is divided into six ecosystem classifications: forest, grassland, farmland, wetland, water, construction land, and unused land. The ES of the above ecosystem classifications is divided into nine function types: food production, materials production, gas regulation, climate regulation, water conservation, soil conservation, waste treatment, biodiversity, and entertainment and culture. The basic equivalent of different ESs is shown in Table 2.
The formula for calculating the equivalent of total ESV is as follows:
V k = j = 1 n i = 1 n S i V i j
where V k represents the total ESV, S i is the area (Ha) of the ecosystem i (i.e., forest, grassland which are mentioned above), and V i j is the equivalent value coefficient of ESV per unit area for ecosystem i with ES function type j.

3.3.2. Methods to Calculating the Change of ESV

Most WEC practices take the stakeholders’ contributions to ecosystem protection and their willingness to pay for the ecosystem as the criterion of WEC [23,25,27]. However, the change of total ESV is also an important criterion to determine the WEC scheme, which lacks concentration. First, the change of ESV considers not only the background conditions of a targeted area but also the contribution of the region to a wider range of ESs, and a long time dimension analysis could provide more valuable information. Second, the logic of establishing a WEC scheme based on the change of ESV is similar to that of stakeholders’ contributions to ecosystem protection. The improvement in the ESV indicates that the region provides ESs to a larger region and thus should be allocated more compensation. Therefore, we calculate the change trend and change range of total ESV and then on the basis of the change construct the WEC.
(1) Change trend of ESV
A regression analysis is applied to judge the change trend of the total ESV:
V k = b t i + a
where V k is the total ESV, a is the intercept term, and b is the regression coefficient representing the change trend. b > 0 indicates the total ESV of the research unit presents an increasing trend; b < 0 indicates the total ESV of the research unit shows a decreasing trend. We test the significance of the regression equation of each research unit. If the result of a unit cannot pass the 95% confidence interval test, indicating the change trend of total ESV is not obvious.
(2) Change range of ESV
A regression analysis is conducted on the average annual change rate of ESV to judge the change range:
M N C k = c t i + d
where M N C k is the adjusted average annual change rate of total ESV of the evaluation unit k, d is the intercept term, and c is the regression coefficient representing the change range. c > 0 indicates the change range of ESV of the research unit is increasing; c < 0 indicates the change range of ESV of the research unit is decreasing. The principle of the significance test is consistent with the above.
There are two steps in the calculation of M N C k :
The first step is to calculate the average annual change rate of total ESV, the formula for which is:
N C k = ( V t 2 V t 1 ) / V t 1 / ( t 2 t 1 ) × 100 %
where N C k is the average annual change rate of total ESV for evaluation unit k in a certain interval, and V t 1 and V t 2 are the initial ESV (at t1) and the final ESV (at t2), respectively.
The second is to calculate the adjusted average annual change rate of total ESV. In order to eliminate the overestimation or underestimation of the total ESV due to the differences in different regions, we adjust the average annual change rate of total ESV according to the proportion of total ESV in the whole of an evaluation unit. The data processing is as follows:
M N C k = N C k × V k k = 1 n V k × 100
where M N C k is the adjusted average annual change rate of total ESV of the evaluation unit k, and N C k and V k are the same as the definition mentioned above.

3.3.3. Construction of WEC Scheme Considering Its Realization in Spatial Planning

Based on the analysis of the change trend and change range of total ESV and the partition idea of spatial planning, we divide the WEC of different regions into five classes, as shown in Table 3. Class I is the priority compensation area; Class II is the second priority compensation area; Class III is the general compensation area; Class IV is the potential compensation area; Class V is the non-compensation area. The priority compensation area (Class I) is the regions where total ESV increases continuously, and the change range of total ESV increases or is non-significant. The second priority compensation area (Class II) is the regions where total ESV increases but the change range of the total ESV decreases gradually, or the change trend is not obvious, but the change range increases. The general compensation area (Class III) is the regions where the change trend and change range of total ESV are not significant, or the total ESV decreases but the change range of the total ESV gradually decreases as well. The potential compensation area (Class IV) is the regions where total ESV decreases but the change range of total ESV is not significant, or regions where the change trend of total ESV is not significant, and the change range decreases. Within the non-compensation area (Class V), ESV decreases, and the reduction is increasing.

4. Results

4.1. Spatial-Temporal Characteristics of ESV

The results of the total ESV in the water resource area of MRSNWDP are shown in Figure 3. From 1990 to 2015, the total ESV in this region showed a trend of first increasing, then decreasing, then increasing, and finally decreasing slowly. Specifically, the total ESV changed from the value of 2,436,914.17 in 1990 to 2,433,603.47 in 2015, a total decrease of 3310.70. In 1995, the ESV reached the highest value of 2,450,356.96 and then fell to the lowest value of 2,430,549.05 in 2000. The total ESV suffered a slight rebound in 2005 and then entered a period of gentle decline.
Since the MRSNWDP was launched, the national and local governments have attached great importance to the protection of the ecological environment in the water source area and formulated various plans and protection measures. However, the increasing human activities have inevitably led to the occupation of the natural ecosystem from the perspective of social and economic development. The substantial increase in construction land in the study area (an increase of 88.39% in 2015 compared with 1990) and the decrease in farmland, forest, grassland, and water area are the direct driving forces for the reduction of the total value of ESV. As to the change of the total ESV of different ESs functions, the most obvious change is the declined total ESV of soil conservation functions. Meanwhile, the total ESV of the entertainment and culture function and water conservation function increased during the study periods (shown in Figure 3).

4.2. Changes of Spatial-Temporal Characteristics of Total ESV

The change rate of the total ESV is shown in Figure 4. The annual change rate of the total ESV from 1990 to 2015 is consistent with the change of the total ESV, but it could reveal significant detail. In the first five years, the annual change rate of the total ESV was 0.11, an increasing change. After that, the annual change rate of the total ESV declined greatly to −0.162, suffering a large change, and then the annual change rate of the total ESV raised sharply and ultimately declined gradually. Moreover, the rate of change in the value of different types of ecosystem services showed an increase or decrease in different years. Among them, there were many years with negative growth in the ecosystem service value of food production, but there are more years with negative growth in the value of ecosystem services in water conservation.
Specific to the annual change rate of the total ESV of different ESs functions within the study area, the functions of gas regulation, climate regulation, soil conservation, biodiversity, food production, and materials production have been decreasing since 2000. It is worth noting that within the water source area, the functions of water conservation, waste treatment, and entertainment and culture have been increasing since 2000. The reason is that since the construction of the MRSNWDP fully started construction in December 2003, China has strengthened the protection of the ecological environment of the water source area, especially for the protection of water source conservation function and water quality. The water conservation function and waste treatment function of water source areas have been continuously improved. At the same time, due to the heightening of the Danjiangkou dam, the water storage capacity is improved, and the water area as a reserve of high ESV is increased. Moreover, the function of entertainment and culture is an important approach to increase income for the local citizens with little ecological destruction.
In order to further analyze the spatial and temporal changes of total ESV, we carry on the hotspot analysis, which can calculate the spatial cluster locations of the high-value or low-value clusters by computing the value of Getis-ORD G i * (Getis-ORD G i * is the statistic of hospot analysis and is widely used, and we list its formula in Appendix A). We take the county as the research unit and take the adjusted annual change rate of the total ESV as the analysis index, using ArcGIS 10.2 software to explore the spatial-temporal evolution pattern of ESV from 1990 to 2015. Based on the annual change rate of the total ESV, the study area is divided into five categories: low-value aggregation area, low-value dispersion area, general area, high-value dispersion area, and high-value aggregation area, as shown in Figure 5.
From 1990 to 1995, the high-value aggregation areas of the change rate of the total ESV were mainly concentrated in the east of the study area. Zhushan, Fangxian, Danjiangkou, Xichuan, and Xixia were the hotspots for the growth of ESV, while the Shiyan urban area and Hanzhong Basin were in the low-value aggregation areas due to the rapid economic development. From 1995 to 2000, the high0value aggregation area and low-value aggregation area of the change rate of the total ESV were completely opposite to that of the previous period. From 2000 to 2005, the high-value aggregation areas continued to move to the core area of Danjiangkou reservoir, namely Xixia, Xichuan, and Danjiangkou City. At the same time, local high-value aggregation areas developed around Shangzhou City and Pingli County of Ankang City; From 2005 to 2010, the high-value aggregation area was further transferred to Lueyang county and Ningqiang County of Hanzhong City in the upper reaches of the reservoir area, while most areas in the north and east of the study area belong to high-value dispersion areas, and the ESV of these areas have generally improved. From 2010 to 2015, the high-value aggregation areas were transferred to Ankang City, Xunyang county, and Baihe County, while the high-value dispersion areas spread to the vast area in the middle of the study area, indicating that the ecological and environmental protection has expanded from the periphery of Danjiangkou reservoir to a larger area upstream during the study period.
Through the comparative analysis of the distribution hotspot in the above periods, the following laws have been found: (i) Due to the rapid economic development and the continuous expansion of construction land, Shiyan urban area has been a low-value aggregation or dispersion area for a long time, and its total ESV is in a decreasing trend; (ii) Since 2000, affected by the expansion of the water area and the increase in ecological and environmental protection, the change rate of total ESV around Danjiangkou reservoir has been in a high-value aggregation, and the ES capacity has been increasing. Due to the decrease in wetland area around the reservoir, the growth of ES function around the reservoir is weak after 2005; (iii) The high-value aggregation area of the change rate of total ESV continues to expand from the core area of Danjiangkou reservoir to the upstream and surrounding areas, and the total ESV of the upstream and surrounding areas of Danjiangkou Reservoir continues to increase, indicating a strengthened protection effort and the work of local government’s ecological environment protection has expanded from point to area.

4.3. The WEC Scheme and Its Realization in Spatial Planning

Combined with the evolution characteristics of ESV from 1990 to 2015 and the principle for WEC in Section 3.3, we formulate the WEC (shown in Figure 6). The priority compensation area (Class I), with an area of 14.38%, is mainly located in Yunxi, Ningshan, Liuba, Lueyang, Ningqiang, and other areas in the upstream area of Danjiangkou reservoir. In recent years, the total ESV in the area has increased significantly, which has made great contributions to the protection of the ecological environment of water sources. At the same time, it is also a key area for water conservation of Danjiangkou reservoir, related to the stability of reservoir water supply. Giving priority to ecological compensation in these areas is conducive to improving the compensation efficiency, further improving the ecological environment quality of water sources and ensuring water quality safety.
The second priority compensation area (Class II), accounting for 25.34%, is mainly concentrated around Danjiangkou reservoir and along the blocking river, the largest tributary of Han River, such as Danjiangkou City, Yunyang District, Xichuan County, Xixia County, and Fang County. These areas are the core areas of the water source, and their ecological, environmental quality has the most direct impact on water quality. In recent years, these regions have further strengthened the regulation of the ecological environment. Hence the total ESV has been further improved on the original basis, especially in the functions of water conservation and waste treatment. In the future, ecological compensation should also pay attention to pollution prevention and control, combining industrial transformation to improve the ecological environment quality in these regions.
The general compensation area (Class III) accounts for 47.48%, which is distributed in the middle of the water source area, covering a wide area. In recent years, the change trend and change range of total ESV in these areas are not obvious, but as the upstream area of Danjiangkou reservoir, it is also necessary to carry out ecological compensation for these areas to further improve its ES functions, such as water conservation, waste treatment, soil formation, and protection if the compensation fund is sufficient.
The potential compensation area (Class IV) accounts for 12.80%, which is mainly located in the economically developed areas in the study area, such as Shiyan City and Shangzhou city. Due to the good economic foundation and rapid development speed, the expansion of construction land leads to the occupation of land-use types with high total ESV, such as farmland and forest, resulting in the reduction of the total value of regional total ESV. When the compensation fund is sufficient, targeted improvement of ecological compensation in such areas should also be considered.
Conclusively, the water source area of MRSNWDP is located in concentrated and contiguous poverty-stricken areas. In the WEC scheme in this paper, the proportion of poor counties belonging to the priority compensation area and secondary priority compensation area accounts for 40%, and that in general compensation area accounts for 57.89%. In the compensation scheme, all kinds of compensation cover 17 of the 18 poor counties, accounting for 94.44%. Therefore, our compensation scheme considers not only the incremental contribution of total ESV of each county and district but also the support to poor areas, which is in line with regional reality, which can significantly improve the benefits of compensation funds and achieve a better compensation effect, and zoning results can be directly incorporated into spatial planning.

5. Discussion

There are plenty of methods to determine the criterion of WEC [6,9,45,46], but we chose the long-term spatial-temporal changes of total ESV as the basis for WEC. Gao et al. [11] also established a WEC scheme that proposes the amounts of compensation founds on the basis of a long-term change of total ESV. Differently from them, we established the WEC scheme of the water resource area of MRSNWDP with consideration of its realization in spatial planning. Gao et al. [28] also applied the ESV method to identify the WEC scheme, but their study area is the Eastern Route of SNWDP, which is different from the water resource area of MRSNWDP, where not only the dual dislocation of spatial distribution between the supply and demand of ES and WEC exists but also involves the poverty-stricken area. This method of ESV has the following advantages: first, the long-term change of total ESV could directly reflect contributions of the ES, which is consistent with the stakeholder for WEC [23,25,27]; Second, based on changes of total ESV in different regions determining the prioritized areas of WEC, it is also a useful practice for the basic principle of EC “who benefits, who compensates, who pollutes, who pays”; lastly, the method of total ESV is feasible because it could avoid the uncertainty of index selection and the difficulty of data acquisition. Nevertheless, the ESV method to determine WEC also has its limitations. First, the WEC scheme only suggests where should be prior compensated, but without indicating the amounts of compensation funds nor providing information about who should undertake the compensation funds.
The calculation of the ESV is based on the equivalent value coefficient table of Xie et al. [43] and other scholars [21,47]. The coefficient is an average value on a national scale, and it does not consider regional differences in different ecosystems. This bias can be eliminated in our study because of the long-term observation and large spatial scale analysis. Taking the equivalent of ESV as the evaluation index and paying attention to the horizontal comparison of different research units in the research area, it has strong feasibility and avoids the large deviation in the value processing. Moreover, we do not carry out the value accounting of ESV and parameter amendment of ES types, making it difficult to quantitatively determine the ecological compensation standard of each region, which needs to be further improved and supplemented.
The water source area of the MRSNWDP covers wide areas, and there are great differences in natural resource conditions and socio-economic development. Additionally, the study area is located in concentrated and contiguous poverty-stricken areas. Therefore, when carrying out WEC, we should not only fully consider the regional particularity and differences but also learn from the identification mechanism of Chinese targeted poverty reduction and alleviation measures and thus determine the prioritized order of WEC based on multiple angles, multiple approaches, and multiple scales.

6. Conclusions

The WEC scheme, especially the WEC scheme in the water resource supply area, is full of theoretical concentrations and is practically necessary. This paper takes the water resource area of MRSNWDP as a case study and constructs the WEC scheme by analyzing the dynamic change of ESV from 1990 to 2015. We try to provide references for the governments to make reasonable ecological compensation in water source areas and thus make full use of limited compensation funds. The main conclusions of the study are as follows:
(1)
Since the launch of the middle route of the MRSNWDP, the national and local governments have attached great importance to the ecological environment protection of the water source area and formulated various plans and protection measures. However, due to economic and social development, the total ESV in the study area showed a slight downward fluctuation trend from 1990 to 2015.
(2)
Before 2000, the change in ESV in different ecosystems was not obvious. From 2000 to 2015, the functions of gas regulation, climate regulation, soil conservation, biodiversity, food production, and materials production in the water source area showed a decreasing trend over the years, but the functions of water conservation, waste treatment, and entertainment and culture continued to increase, indicating great effort has been made to protect the clean water resource, and the Danjiangkou dam also improved the water storage capacity.
(3)
Since 2000, the change rate of ESV around the Danjiangkou reservoir has been in a high-value aggregation, and the ES capacity has been increasing. However, the growth of the ES function around the reservoir has been weak since 2005. Due to the work of the local government, ecological, environmental protection has expanded from point to area, and the protection effort is continuously strengthened; the high-value aggregation area is continuously expanding from the core area of Danjiangkou reservoir upstream and to the surrounding areas, and the ESV upstream and of the surrounding areas of Danjiangkou reservoir is increasing.
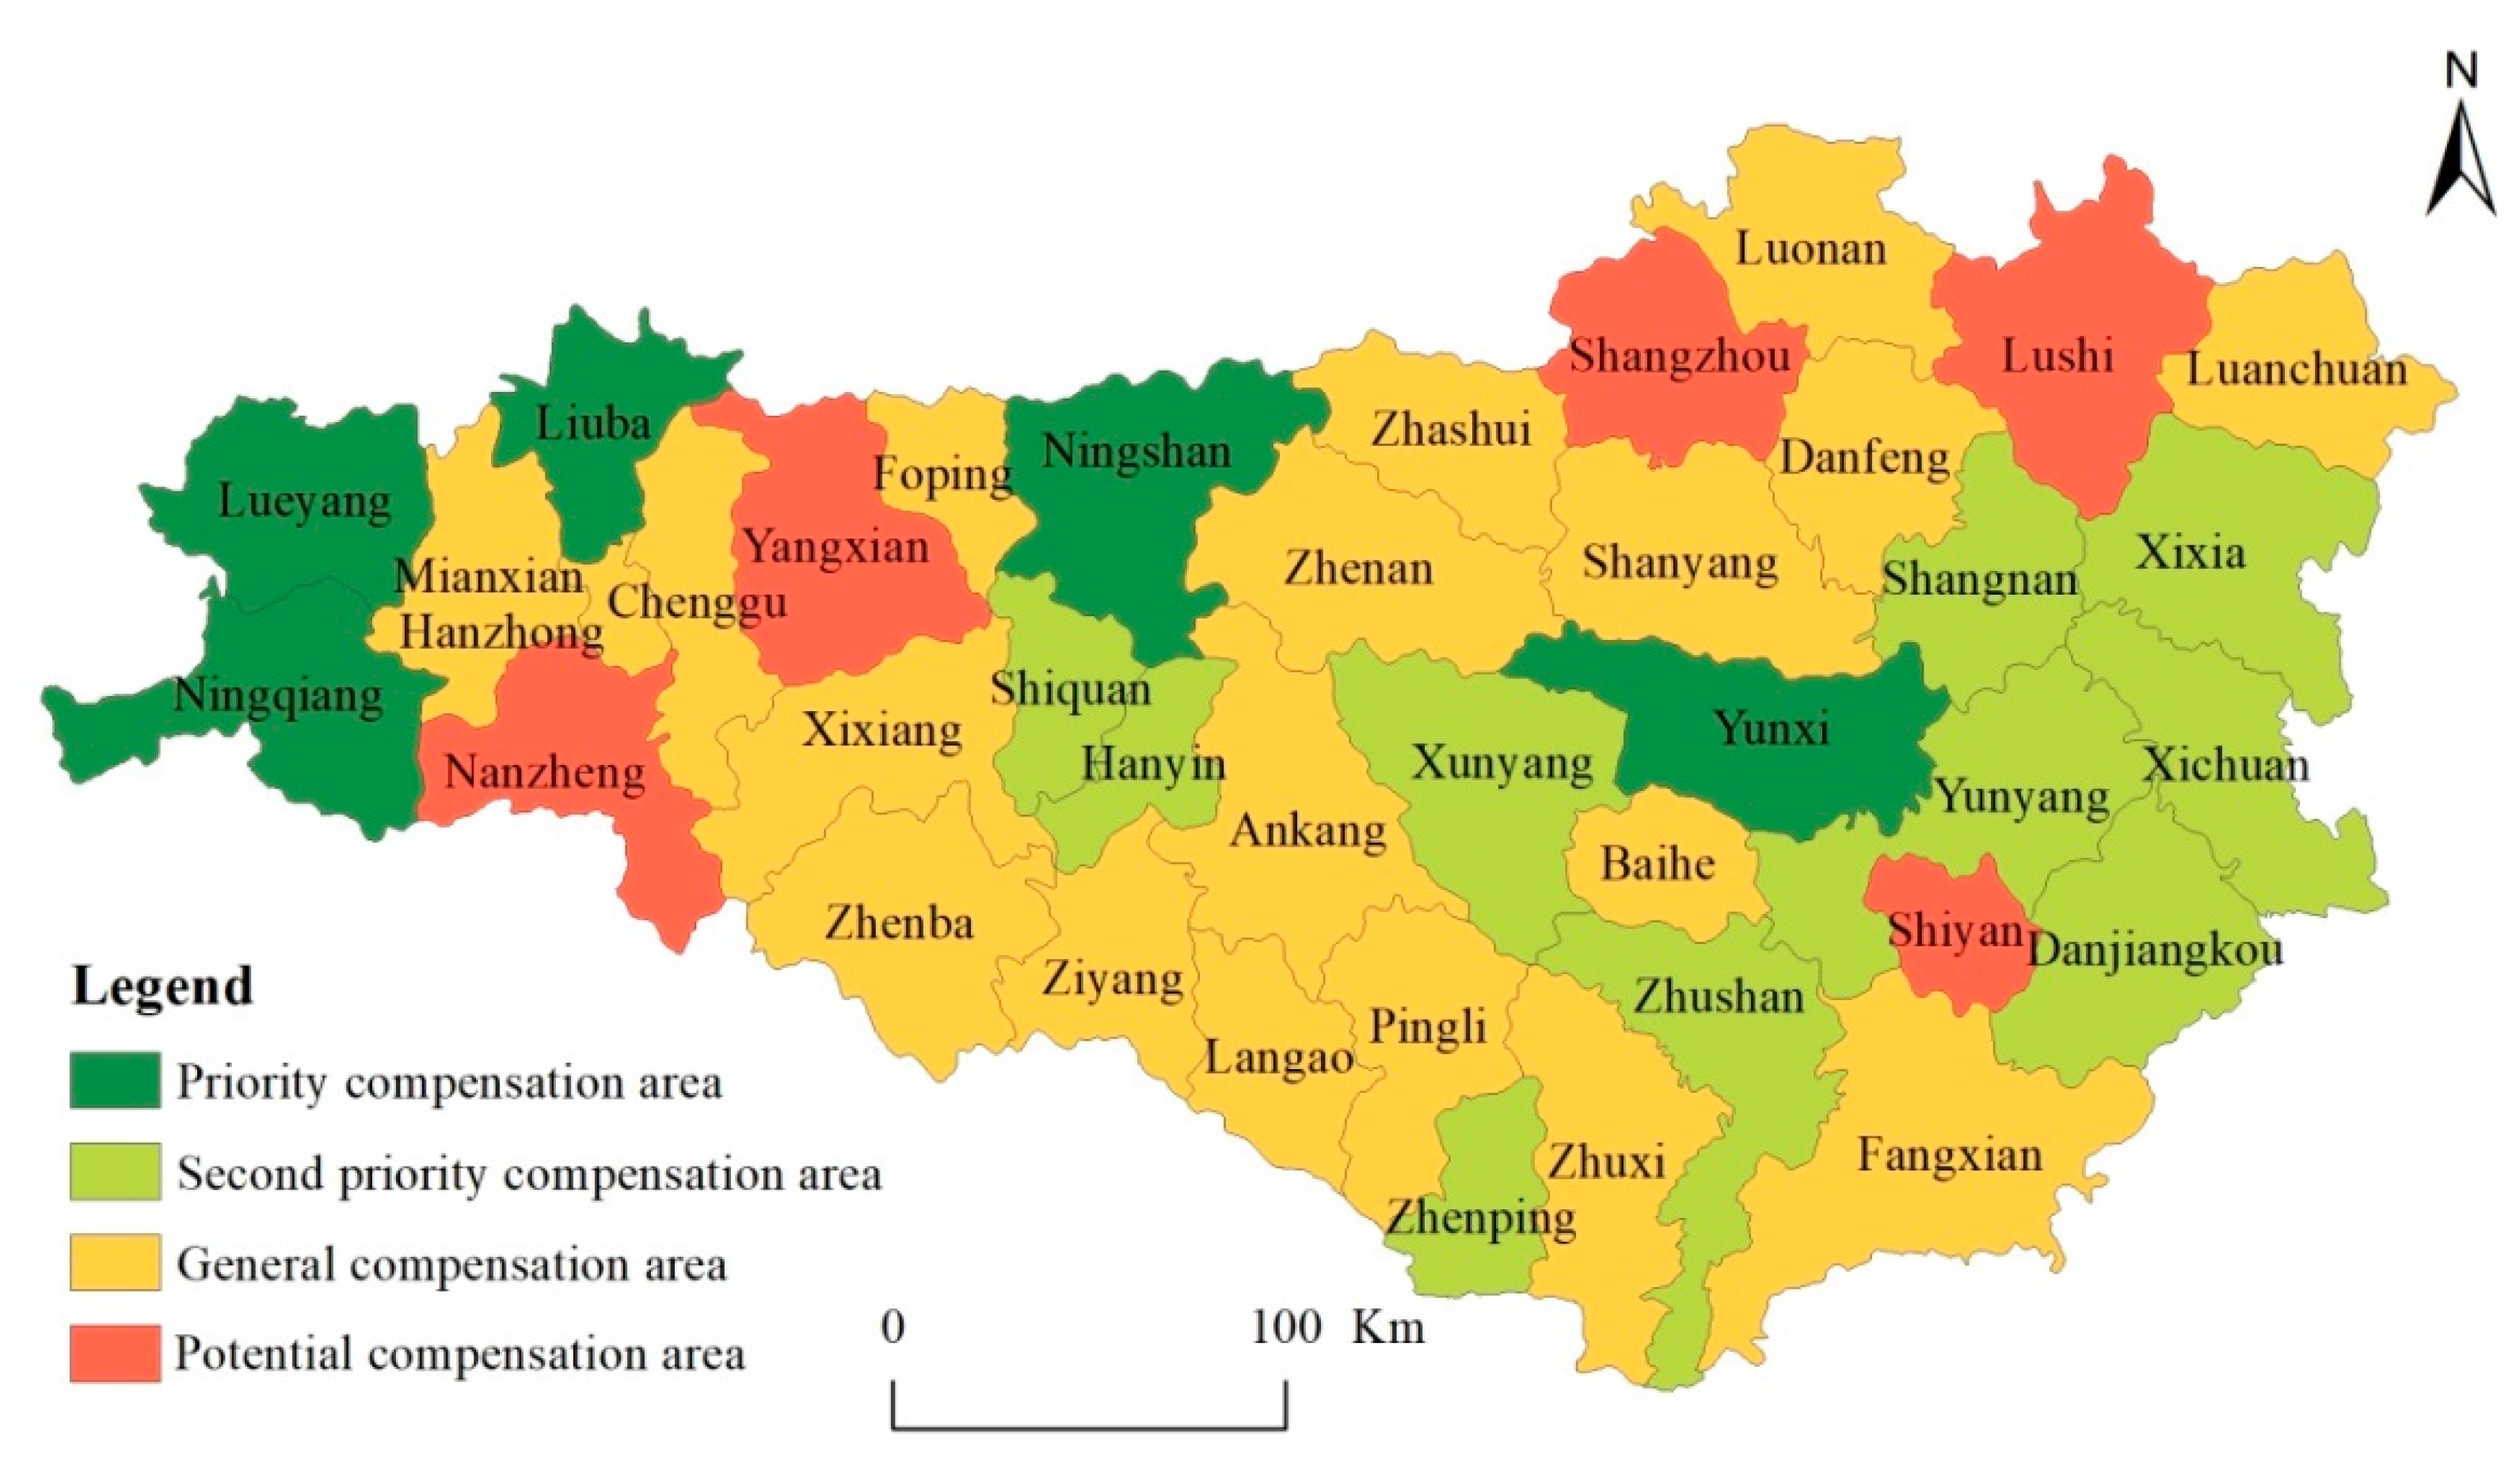
(4)
The WEC is formulated in this paper; the area of priority compensation area accounts for 25.34%, the area of secondary priority compensation area, general compensation area, and potential compensation area account for 25.34%, 47.48%, and 12.80%, respectively. There is no non-compensation area. In our WEC scheme, 17 of the 18 poor counties are involved in all kinds of compensation categories, accounting for 94.44%, and the results of zoning can be directly incorporated into spatial planning, thereby promoting the implementation of WEC.

Author Contributions

Z.S. contributed to data collection, methodology, drafting the manuscript, review and editing; Z.W. contributed to conceptualization, writing—review and editing, supervision; L.Z. contributed to methodology, visualization, writing—review and editing, supervision. All authors have read and agreed to the published version of the manuscript.

Funding

This research received no external funding.

Institutional Review Board Statement

Not applicable.

Informed Consent Statement

Not applicable.

Data Availability Statement

The study did not report any data.

Conflicts of Interest

The authors declare no conflict of interest.

Appendix A

Table A1. The changes of the total ESV in the watershed of MRSNWDP.
Different Types of ES199019952000200520102015
TESV2,436,914.172,450,356.972,430,549.062,435,736.202,435,110.412,433,603.47
The TESV of different types of ESGas regulation354,280.96357,218.22353,818.18354,359.37353,805.38353,159.28
Climate regulation346,118.06348,093.96346,283.51346,418.24344,520.52344,373.95
Water conservation355,330.98356,737.41352,733.38354,610.48356,461.59357,003.15
Soil conservation352,744.30354,730.68352,476.12352,738.34352,105.60351,343.47
Waste treatment186,423.38185,587.53185,053.24185,862.08186,707.08187,381.38
Biodiversity380,299.38382,922.80379,485.95380,212.91380,054.26379,494.80
Food production52,064.7551,821.2052,175.3351,958.0451,855.1351,686.76
Materials production238,548.80241,127.34238,117.68238,569.47238,436.37237,980.14
Entertainment and Culture171,103.57172,117.84170,405.6717,1007.27171,164.47171,180.55
Table A2. The changes rate of the total ESV in the watershed of MRSNWDP.
Different Types of ES1990–19951995–20002000–20052005–20102010–2015
The change rate of TESV0.110−0.1620.043−0.005−0.012
The change rate of TESV of different types of ESGas regulation0.166−0.1900.031−0.031−0.037
Climate regulation0.114−0.1040.008−0.110−0.009
Water conservation0.079−0.2240.1060.1040.030
Soil conservation0.113−0.1270.015−0.036−0.043
Waste treatment−0.090−0.0580.0870.0910.072
Biodiversity0.138−0.1800.038−0.008−0.029
Food production−0.0940.137−0.083−0.040−0.065
Materials production0.216−0.2500.038−0.011−0.038
Entertainment and Culture0.119−0.1990.0710.0180.002
Getis-ORD G i * is the statistic of hospot analysis. For each element in the dataset, the returned statistic of Getis-ORD G i * is the Z score. For a statistically significant positive Z score, the higher the Z score, the tighter the cluster of high values (hotspot or the high-value aggregation area). For a statistically significant negative Z score, the lower the Z score, the tighter the cluster of low values (coldspot or the low-value aggregation area).
The formula of Getis-ORD G i * is as follows:
G i * = j = 1 n w i , j x j X ¯ j = 1 n w i , j s [ n j = 1 n w i , j 2 ( j = 1 n w i , j ) 2 ] n 1  
X ¯ = j = 1 n x j n  
S = j = 1 n x j 2 n ( X ¯ ) 2  
wherein, x j is the attribute value of element j, w i , j is the spatial weight between element i and element j, and n is the total number of elements.

References

  1. Xu, X.; Xu, Z.; Chen, L.; Li, C. How does industrial waste gas emission affect health care expenditure in different regions of China: An application of Bayesian Quantile Regression. Int. J. Envrion. Res. Public Health 2019, 16, 2748. [Google Scholar] [CrossRef] [Green Version]
  2. Perez, P.; Menares, C.; Ramírez, C. PM2.5 forecasting in Coyhaique, the most polluted city in the Americas. Urban Clim. 2020, 32, 100608. [Google Scholar] [CrossRef]
  3. Omri, A.; Bel Hadj, T. Foreign investment and air pollution: Do good governance and technological innovation matter? Environ. Res. 2020, 185, 109469. [Google Scholar] [CrossRef]
  4. Rodríguez-Robayo, K.J.; Merino-Perez, L. Contextualizing context in the analysis of payment for ecosystem services. Ecosyst. Serv. 2017, 23, 259–267. [Google Scholar] [CrossRef]
  5. Farley, J.; Costanza, R. Payments for ecosystem services: From local to global. Ecol. Econ. 2010, 69, 2060–2068. [Google Scholar] [CrossRef]
  6. Wang, K.; Ou, M.; Wolde, Z. Regional differences in ecological compensation for cultivated land protection: An analysis of Chengdu, Sichuan Province, China. Int. J. Environ. Res. Public Health 2020, 17, 8242. [Google Scholar] [CrossRef]
  7. Zhai, T.; Wang, J.; Jin, Z.; Qi, Y.; Fang, Y.; Liu, J. Did improvements of ecosystem services supply-demand imbalance change environmental spatial injustices? Ecol. Indic. 2020, 111, 106068. [Google Scholar] [CrossRef]
  8. He, J.; Wan, Y.; Tang, Z.; Zhu, X.; Wen, C. A developed framework for the multi-district ecological compensation standards integrating ecosystem service zoning in an urban area in China. Sustainability 2019, 11, 4876. [Google Scholar] [CrossRef] [Green Version]
  9. Zhai, T.; Zhang, D.; Zhao, C. How to optimize ecological compensation to alleviate environmental injustice in different cities in the Yellow River Basin? A case of integrating ecosystem service supply, demand and flow. Sustain. Cities Soc. 2021, 75, 103341. [Google Scholar] [CrossRef]
  10. Fang, Z.; Chen, J.; Liu, G.; Wang, H.; Alatalo, J.M.; Yang, Z.; Mu, E.; Bai, Y. Framework of basin eco-compensation standard valuation for cross-regional water supply–A case study in northern China. J. Clean. Prod. 2021, 279, 123630. [Google Scholar] [CrossRef]
  11. Gao, X.; Shen, J.; He, W.; Zhao, X.; Li, Z.; Hu, W.; Wang, J.; Ren, Y.; Zhang, X. Spatial-temporal analysis of ecosystem services value and research on ecological compensation in Taihu Lake Basin of Jiangsu Province in China from 2005 to 2018. J. Clean. Prod. 2021, 317, 128241. [Google Scholar] [CrossRef]
  12. Zhang, Q.; Hong, J.; Wu, F.; Yang, Y.; Dong, C. Gains or losses? A quantitative estimation of environmental and economic effects of an ecological compensation policy. Ecol. Appl. 2021, 31, e02341. [Google Scholar] [CrossRef]
  13. Li, S.; Nie, X.; Zhang, A. Research progress on farmland ecological compensation mechanism based on ecosystem service evaluation. Resour. Sci. 2020, 42, 2251–2260. [Google Scholar] [CrossRef]
  14. Peng, Z.; Wu, H.; Ding, M.; Li, M.; Huang, X.; Zheng, R.; Xu, L. Ecological compensation standard of a water-receiving area in an Inter-Basin Water Diversion based on ecosystem service value and public willingness: A case study of Beijing. Sustainability 2021, 13, 5236. [Google Scholar] [CrossRef]
  15. Yang, Y.; Yao, C.; Xu, D. Ecological compensation standards of national scenic spots in western China: A case study of Taibai Mountain. Tour. Manag. 2020, 76, 103950. [Google Scholar] [CrossRef]
  16. Hu, Y.; Huang, J.; Hou, L. Impacts of the grassland ecological compensation policy on household livestock production in China: An empirical study in Inner Mongolia. Ecol. Econ. 2019, 161, 248–256. [Google Scholar] [CrossRef]
  17. He, K.; Zhang, J.; Wang, X.; Zeng, Y.; Zhang, L. A scientometric review of emerging trends and new developments in agricultural ecological compensation. Environ. Sci Pollut. Res. 2018, 25, 16522–16532. [Google Scholar] [CrossRef]
  18. Qiu, L.; Zhai, H.J. An ecological compensation mechanism of Chishui River water resources protection and research. Appl. Mech. Mater. 2014, 685, 463–467. [Google Scholar] [CrossRef]
  19. Wei, C.; Luo, C. A differential game design of watershed pollution management under ecological compensation criterion. J. Clean. Prod. 2020, 274, 122320. [Google Scholar] [CrossRef]
  20. Ze, H.; Wei, S.; Xiangzheng, D. Progress in the research on benefit-sharing and ecological compensation mechanisms for transboundary rivers. J. Resour. Ecol. 2017, 8, 129–140. [Google Scholar] [CrossRef]
  21. Hu, D.; Liu, H.; Chen, X.; Chen, Y. Research on the ecological compensation standard of the basin pollution control project based on evolutionary game theory and by taking Xiangjiang River as a case. Front. Eng. Manag. 2019, 6, 575–583. [Google Scholar] [CrossRef]
  22. Gao, X.; Shen, J.; He, W.; Sun, F.; Zhang, Z.; Guo, W.; Zhang, X.; Kong, Y. An evolutionary game analysis of governments’ decision-making behaviors and factors influencing watershed ecological compensation in China. J. Environ. Manag. 2019, 251, 109592. [Google Scholar] [CrossRef] [PubMed]
  23. Yi, Y.; Yang, M.; Fu, C. Analysis of multiple ecological compensation strategies for transboundary pollution control in a river basin. Manag. Decis. Econ. 2021, 42, 1579–1590. [Google Scholar] [CrossRef]
  24. Lu, S.; Lu, W.; Shao, W.; Xue, Y.; Taghizadeh-Hesary, F. The transboundary ecological compensation construction based on pollution rights: Ways to keep the natural resources sustained. Resour. Policy 2021, 74, 102401. [Google Scholar] [CrossRef]
  25. Aguilar, F.X.; Obeng, E.A.; Cai, Z. Water quality improvements elicit consistent willingness-to-pay for the enhancement of forested watershed ecosystem services. Ecosyst. Serv. 2018, 30, 158–171. [Google Scholar] [CrossRef]
  26. Xiong, K.; Kong, F.; Zhang, N.; Lei, N.; Sun, C. Analysis of the factors influencing willingness to pay and payout level for ecological environment improvement of the Ganjiang River Basin. Sustainability 2018, 10, 2149. [Google Scholar] [CrossRef] [Green Version]
  27. Ren, Y.; Lu, L.; Zhang, H.; Chen, H.; Zhu, D. Residents’ willingness to pay for ecosystem services and its influencing factors: A study of the Xin’an River basin. J. Clean. Prod. 2020, 268, 122301. [Google Scholar] [CrossRef]
  28. Gao, X.; Shen, J.; He, W.; Sun, F.; Zhang, Z.; Zhang, X.; Zhang, C.; Kong, Y.; An, M.; Yuan, L.; et al. Changes in ecosystem services value and establishment of watershed ecological compensation standards. Int. J. Environ. Res. Public Health 2019, 16, 2951. [Google Scholar] [CrossRef] [Green Version]
  29. Li, Y.; Xiong, W.; Zhang, W.; Wang, C.; Wang, P. Life cycle assessment of water supply alternatives in water-receiving areas of the South-to-North Water Diversion Project in China. Water Res. 2016, 89, 9–19. [Google Scholar] [CrossRef]
  30. Zhao, Z.; Zuo, J.; Zillante, G. Transformation of water resource management: A case study of the South-to-North Water Diversion project. J. Clean. Prod. 2017, 163, 136–145. [Google Scholar] [CrossRef]
  31. Wei, D. Beijing water resources and the south to north water diversion project. Can. J. Civ. Eng. 2005, 32, 159–163. [Google Scholar]
  32. Liu, Y.; Mao, D. Integrated assessment of water quality characteristics and ecological compensation in the Xiangjiang River, south-central China. Ecol. Indic. 2020, 110, 105922. [Google Scholar] [CrossRef]
  33. Yang, Y.; Yin, L.; Zhang, Q. Quantity versus quality in China’s South-to-North Water Diversion Project: A system dynamics analysis. Water 2015, 7, 2142–2160. [Google Scholar] [CrossRef] [Green Version]
  34. Guo, Y.; Zheng, H.; Wu, T.; Wu, J.; Robinson, B.E. A review of spatial targeting methods of payment for ecosystem services. Geogr. Sustain. 2020, 1, 132–140. [Google Scholar] [CrossRef]
  35. Nong, X.; Shao, D.; Zhong, H.; Liang, J. Evaluation of water quality in the South-to-North Water Diversion Project of China using the water quality index (WQI) method. Water Res. 2020, 178, 115781. [Google Scholar] [CrossRef]
  36. Zhen, N.; Zhao, Y.; Jiang, H.; Webber, M.; Wang, M.; Lamb, V.; Jiang, M. How coalitions of multiple actors advance policy in China: Ecological agriculture at Danjiangkou. J. Environ. Pol. Plan. 2022, 1–13. [Google Scholar] [CrossRef]
  37. Ye, Y.; Zhang, J.; Wang, T.; Bai, H.; Wang, X.; Zhao, W. Changes in Land-Use and Ecosystem Service Value in Guangdong Province, Southern China, from 1990 to 2018. Land 2021, 10, 426. [Google Scholar]
  38. Xie, G.; Zhang, C.; Zhen, L.; Zhang, L. Dynamic changes in the value of China’s ecosystem services. Ecosyst. Serv. 2017, 26, 146–154. [Google Scholar]
  39. Yu, B. Ecological effects of new-type urbanization in China. Renew. Sustain. Energy Rev. 2021, 135, 110239. [Google Scholar] [CrossRef]
  40. Costanza, R.; de Groot, R.; Farberk, S.; Belt, M. The value of the world’s ecosystem services and natural capital. Nature 1997, 387, 253–260. [Google Scholar]
  41. Xie, G.; Zhang, C.; Zhang, C.; Xiao, Y.; Lu, C. The value of ecosystem services in China. Resour. Sci. 2015, 37, 1740–1746. [Google Scholar]
  42. Dai, Z.; Puyang, X.; Han, L. Using assessment of net ecosystem services to promote sustainability of golf course in China. Ecol. Indic. 2016, 63, 165–171. [Google Scholar] [CrossRef]
  43. Xie, G.; Zhen, L.; Lu, C.; Xiao, Y.; Chen, C. Expert knowledge based valuation method of ecosystem services in China. J. Nat. Resour. 2008, 23, 911–919. [Google Scholar]
  44. Jiang, W.; Wu, T.; Fu, B. The value of ecosystem services in China: A systematic review for twenty years. Ecosyst. Serv. 2021, 52, 101365. [Google Scholar] [CrossRef]
  45. Dai, Q.W. Study on the spatial selection of ecological compensation objects: A case study of water conservation of grasslands in Gannan Tibetan Autonomous prefecture. J. Nat. Resour. 2010, 25, 415–425. [Google Scholar]
  46. Sonter, L.J.; Simmonds, J.S.; Watson, J.E.; Jones, J.P.; Kiesecker, J.M.; Costa, H.M.; Bennun, L.; Edwards, S.; Grantham, H.S.; Griffiths, V.F. Local conditions and policy design determine whether ecological compensation can achieve No Net Loss goals. Nat. Commun. 2020, 11, 2072. [Google Scholar] [CrossRef]
  47. Zhang, Z.; Xia, F.; Yang, D.; Huo, J.; Wang, G.; Chen, H. Spatiotemporal characteristics in ecosystem service value and its interaction with human activities in Xinjiang, China. Ecol. Indic. 2020, 110, 105826. [Google Scholar] [CrossRef]
Figure 1. The analytical framework of the study.
Sustainability 14 08204 g001
Figure 2. The study area and the land use/cover change in the study area from 1990 to 2015.
Sustainability 14 08204 g002
Figure 3. The changes of the total ESV in the watershed of MRSNWDP.
Sustainability 14 08204 g003
Figure 4. The change rates of the total ESV in the watershed of MRSNWDP.
Sustainability 14 08204 g004
Figure 5. Hotspot map of the annual change rate of ESV.
Sustainability 14 08204 g005
Figure 6. Spatial selection scheme for ecological compensation.
Sustainability 14 08204 g006
Table 1. Basic information about the study area.
ProvinceCityCountyAverage Annual Rainfall/mmGDP/100 Million YuanPermanent Resident Population/10,000Cultivated Land Area/1000 haPer Capita Cultivated Land/mu
Hubei provinceShiyan CityDanjiangkou, Yunyang District, Yunxi, Zhushan, Zhuxi, Fangxian, Shiyan urban areas769.601200.82337.27174.920.78
The whole province-1177.0029,550.195851.503436.241.20
Henan ProvinceNanyang CityXixia, Xichuan800.00414.40109.80134.470.78
Luoyang CityLuanchuan804.30152.1935.1032.700.88
Sanmenxia CityLushi692.9079.0337.9226.531.05
The whole province-784.80337,002.169480.009124.201.84
Shaanxi ProvinceHanzhong CityHantai District, Nanzheng, Chenggu, Yangxian, Xixiang, Mianxian, Lueyang, Ningqiang, Zhenba, Liuba, Foping908.00986.63318.96204.050.96
Ankang CityHanbin District, Hanyin, Shiquan, Ningshan, Ziyang, Langao, Zhenping, Pingli, Xunyang, and Baihe926.20771.44265.00196.361.11
Shangluo CityShangzhou District, Zhen’an, Danfeng, Shangnan, Luonan, Shanyang, Zhashui786.70624.06235.74133.590.85
The whole province-800.0018,021.003792.872904.112.84
Notes: Data are collected from Statistical Yearbook 2016 of different provinces (data in the year 2015).
Table 2. Equivalent value coefficient of ESV per unit area for China’s ecosystem.
First Class TypesSecond Class TypesForestGrasslandFarmlandWetlandWater AreaUnused Land
Provision servicesFood production0.330.431.000.360.530.02
Materials production2.980.360.390.240.350.04
Regulation servicesGas regulation4.321.500.722.410.510.06
Climate regulation4.071.560.9713.552.060.13
Water conservation4.091.520.7713.4418.770.07
Waste treatment1.721.321.3914.414.850.26
Support servicesSoil conservation4.022.241.471.990.410.17
Biodiversity4.511.871.023.693.430.40
Cultural servicesEntertainment and culture2.080.870.174.694.440.24
Subtotal28.1211.677.954.7745.351.39
Table 3. The principle for WEC.
Change RangeChange Trend
IncreasingNon-SignificantDecreasing
increasingIIIV
non-significantIIIIIV
decreasingIIIVIII
Publisher’s Note: MDPI stays neutral with regard to jurisdictional claims in published maps and institutional affiliations.

