Article

Study on the Characteristics of Soil Erosion in the Black Soil Area of Northeast China under Natural Rainfall Conditions: The Case of Sunjiagou Small Watershed

1
College of Water Conservancy and Electric Power, Heilongjiang University, Harbin 150000, China
2
Heilongjiang Province Hydraulic Research Institute, Harbin 150000, China
*
Authors to whom correspondence should be addressed.
Sustainability 2022, 14(14), 8284; https://doi.org/10.3390/su14148284
Submission received: 26 May 2022 / Revised: 26 June 2022 / Accepted: 5 July 2022 / Published: 6 July 2022
(This article belongs to the Section Soil Conservation and Sustainability)

Abstract

:
In the black soil area, where soil erosion is severe and the soil is in urgent need of ecological restoration, providing reasonable and practical measures to prevent soil erosion and restore the soil is an urgent issue at present. In this study, nine runoff plots were deployed in Bin County, the core area of soil erosion control, to monitor runoff and soil loss long-term, simulated by the erosion potential method (EPM) for comparison. Studies have shown that soil erosion is strongly influenced by soil conservation measures, land use, and vegetation cover. In contrast, slope, pre-soil moisture content, and soil crusting due to rainfall can affect erosion in a single rainfall event. The most severe soil erosion was in bare land, up to 1093.58 t km−2 a−1, followed by longitudinal ridge tillage land (751.88 t km−2 a−1) and cross ridge tillage land (31.58 t km−2 a−1). The shrublands and mixed forests planted for ecological restoration experienced almost no erosion. The soil loss rate of the cross ridge tillage and ecological restoration plots was much lower than the allowable soil loss rate (200 t km−2 a−1). Under erosive storms, longitudinal ridge tillage can produce soil loss rates that far exceed those of bare ground. The change from longitudinal ridge tillage to cross ridge tillage on gentle slopes can effectively prevent soil erosion in the study area. The vegetation restoration measures of planting shrubs such as Amorpha fruticosa Linn. are incredibly effective in the ecological restoration of wastelands in black soil areas. For the black soil area after the retreat, the vertical structure of vegetation can be improved by planting shrubs at the bottom, thus achieving a good restoration effect.

1. Introduction

As a highly complex natural process, soil erosion is one of the most important ecological problems worldwide. It is an essential cause of agricultural productivity decline, land degradation, water pollution, and ecological degradation [1,2,3,4,5], and mainly threatens the ecosystem’s biodiversity [6]. Rainfall leads to the dislodging of soil particles and their migration and deposition through surface runoff, which are the two main soil erosion processes [7,8,9,10].
In China, the development of agricultural land and the destruction of forests have led to an increase in soil erosion. As a critical agricultural base in the country, the northeast black soil area is also one of the most severe areas of soil erosion [11]. Under the interaction of natural and human factors, the increasing severity of soil erosion has led to the thinning of the black soil layer and a decrease in soil fertility [12], which also poses a threat to the water quality of downstream water bodies [13]. The thickness of the black soil has been reduced by 40~50 cm, and in some places, the black soil layer has been eroded [14,15,16]. In 2003, the country launched a pilot project for the comprehensive prevention and control of soil erosion in the northeast black soil area. In 2005, we began a systematic investigation, analysis, and summary of soil erosion and ecological security. In the past decade, the Ministry of Science and Technology of the People’s Republic of China, the National Natural Science Foundation of China, and the Ministry of Water Resources of the People’s Republic of China have attached great importance to the prevention and control of soil erosion in black soil areas and the ecological restoration of black land.
Soil erosion is influenced by various factors, such as rainfall, slope, soil conservation measures, vegetation cover, and land use type [17,18,19]. Rainfall–runoff is the primary driver of soil erosion, and even isolated heavy rainfall events can lead to more severe erosion [20,21]. The relationship between rainfall and soil erosion becomes more complex due to the effect of vegetation cover. On the one hand, soil erosion is positively correlated with rainfall [22]. On the other hand, abundant rainfall contributes to the growth of plants, vegetation improves the physical and chemical properties of the soil and increases the water-holding capacity [23], and its canopy avoids the direct splashing of raindrops on the soil [24], thus reducing soil erosion. Numerous scholars have studied the effects of rainfall characteristics or single rainfall events on soil erosion under various vegetation covers [25,26,27], and such studies have primarily focused on the Loess Plateau [20,28]. Little has been done on the black soil area. However, such studies in the past have mainly been conducted at the watershed scale, and long-term monitoring of soil erosion at the plot scale has rarely been conducted.
As a crucial topographic factor, soil loss is positively correlated with slope under certain ranges and conditions [29,30]. As the research progressed, some scholars found the existence of a critical slope, and soil erosion was negatively correlated with the slope when the slope was more significant than the critical slope [31]. However, the critical slope of each area is not the same due to the different soil properties; influenced by rainfall, vegetation cover, and other factors, the critical slope of the same area is also not constant. Zhao et al. [32] found that red soils produce the most significant runoff at 15° by simulating rainfall indoors, i.e., 15° is the critical slope for red soils. Xu et al. [33] found that the critical slope of purple soils in China lies between 17.6° and 36.4° by simulating rainfall experiments on runoff plots. Zhang et al. [34] found that the critical slope of the Loess Plateau is between 26° and 30° after extracting and analyzing by collating a large amount of past literature. In contrast, there is a lack of such studies in black soil areas. Simulated rainfall can pinpoint the range of critical slopes, but it lacks practical significance. The rainfall intensity of natural rainfall is much less than that of simulated rainfall, and different periods in a single rainfall event also exhibit different rainfall characteristics.
Soil and water conservation measures are widely used for erosion control, thus achieving sustainable development [35]. Runoff plots are the most common way to study soil and water conservation measures on runoff and soil loss and have yielded plenty of results. Fang et al. [36] studied the effects of different soil and water conservation measures on soil erosion in Northern China through runoff plots, thus making suggestions for water shortage in the downstream Miyun Reservoir. Maeten et al. [37] evaluated the effectiveness of soil conservation measures on soil erosion control in the European and Mediterranean regions. Wolka et al. [38] studied the effect of soil conservation measures on soil erosion as well as food production in Africa, which is more practically relevant in relation to local conditions. Soil and water conservation measures in black soil areas can effectively prevent soil erosion, restore black soil, and manage non-point source pollution at its root. Therefore, the impact of different soil and water conservation measures on soil erosion under climate change is the key to ecological restoration in black soil areas.
Soil erosion modeling and estimation are essential to combat erosion [39]. In general, the models are categorized as empirical, conceptual, and physical-based depending on the physical processes simulated by the model. Current widely used models include the Universal Soil Loss Equation (USLE) [39], Revised Universal Soil Loss Equation (RUSLE) [40], and Erosion Potential Method (EPM) [41], etc. EPM models are more precise in quantification, mostly applied in Europe [42], and are less involved in China. Stefanidis et al. [43] integrated EPM models into a GIS environment for estimating and predicting soil erosion in watersheds.
Consequently, the long-term monitoring and systematic analysis of runoff plots in Bin County, a black soil area in Northeastern China, were conducted. Moreover, the EPM model was used for simulation and comparison. The aims were (i) to study the effects of slope, vegetation cover, rainfall characteristics, soil and water conservation measures, and land use types on runoff and soil loss; (ii) to compare the reduction efficiency of different soil and water conservation measures on runoff and soil loss; and, finally, (iii) to make recommendations on the prevention and control of soil erosion in black soil areas and the ecological restoration of black land.

2. Materials and Methods
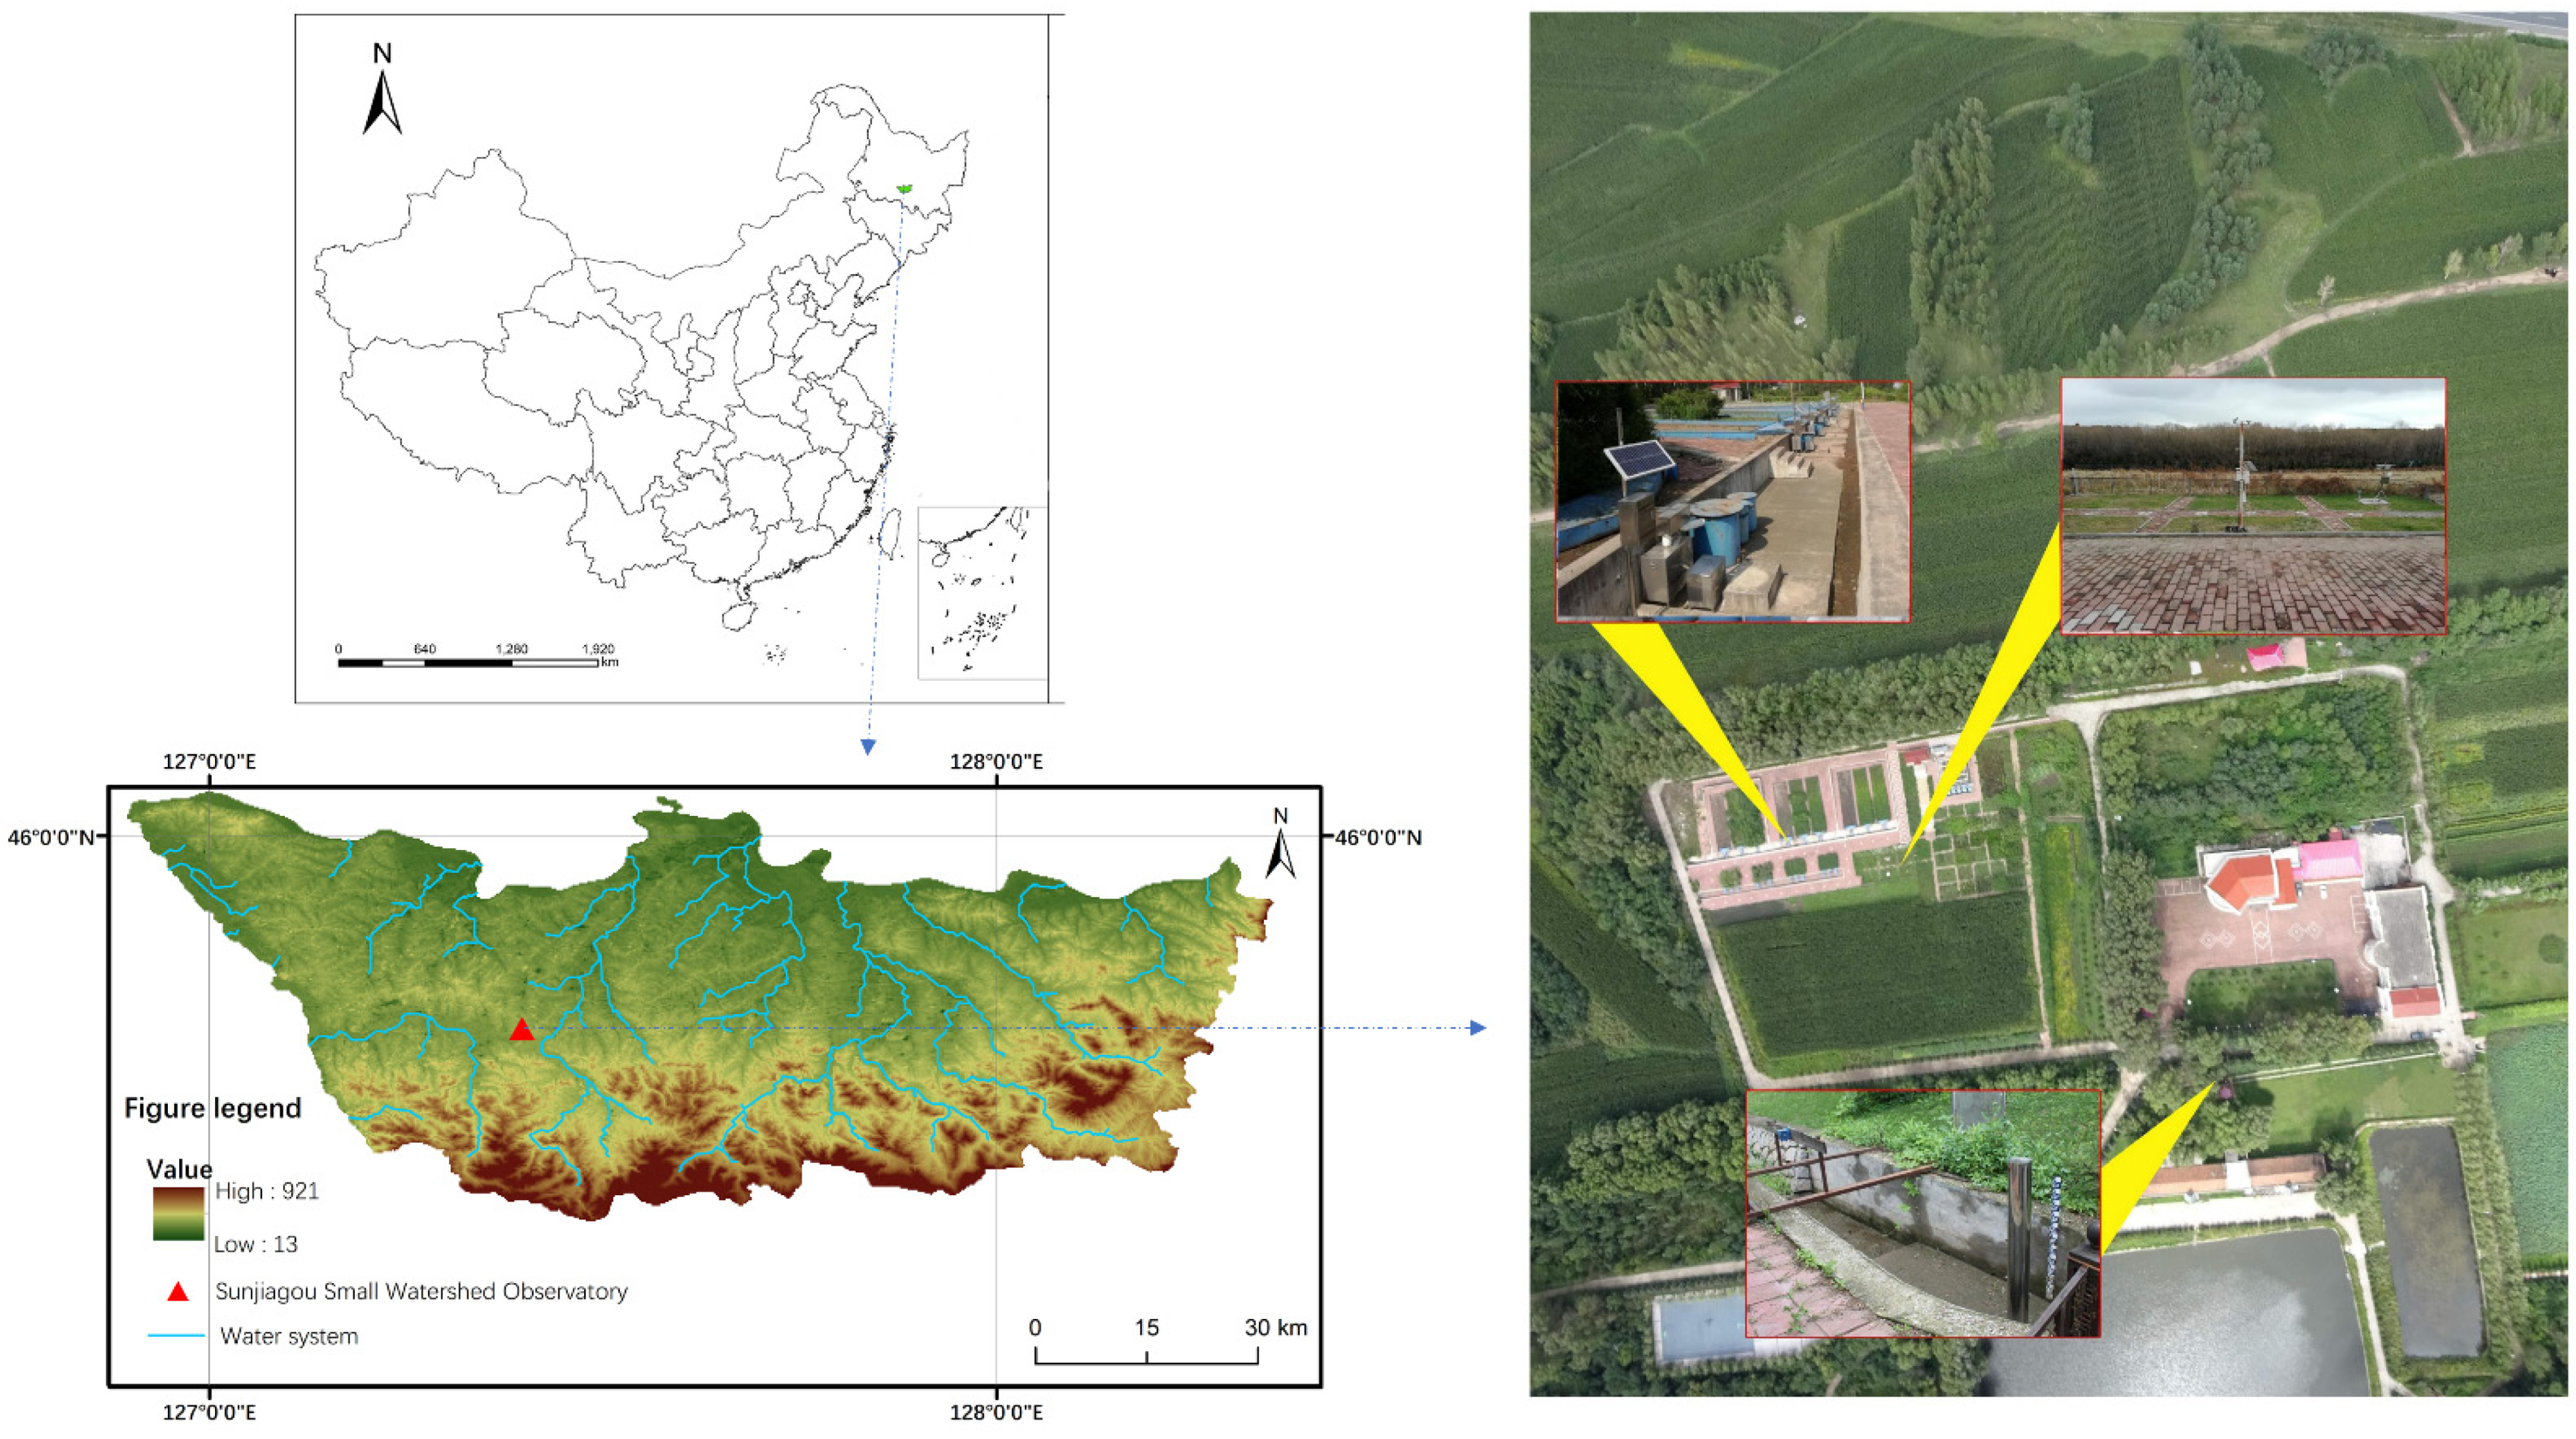
2.1. Study Area

The present study area (127°24′47″ E, 45°44′57″ N) is located within the Sunjiagou sub-basin, which is located in Bin County, Harbin City, Heilongjiang Province, China (Figure 1). The watershed is a transition zone from low hills to plains, with a gully density of 0.54 km km−2. Located in the mid-temperate continental monsoon climate zone, the average annual rainfall is 681 mm, the average annual runoff depth is 90 mm, and the average annual temperature is 4.1 °C Rainfall is unevenly distributed during the year, mainly concentrated in June to September, with summer precipitation in July and August accounting for approximately 60% of the year. Soil type is mainly black soil, vegetation type is coniferous broad-leaved forest, and maize (Zea mays L.), rice (Oryza sativa L.), and soybean (Glycine max (Linn.) Merr.) are the main crops.

2.2. Runoff Plot Descriptions

Nine runoff plots in the runoff field were selected for the study, and the specific layouts are shown in Table 1. The layout requires its slope, soil, and water conservation measures (Figure 2), vegetation type, and other factors to be representative of the local area, and to carry out various farming activities in accordance with the farming habits of local farmers. The selected runoff plots had slopes from 3° to 8° and a soil thickness of 20 cm. To exclude the effect of slope length on erosion, the length was 20 m and the plot area was 100 m2.

2.3. Data Collection

The precipitation observation equipment used fully automatic weather stations (JDQX01 type) to monitor rainfall (P; ±0.2 mm) and rainfall duration (RD), and calculate maximum 30 min rainfall intensity (I30) and average rainfall intensity (Im). Rainfall erosion forces were calculated according to Wischmeier [39]. After each rainfall, the sediment in the catchment tank was flushed into the diversion bucket with the clear water after settling in the diversion bucket. A meter ruler was placed vertically at the bottom of the bucket, and the water level height was measured at different points four times to calculate the runoff volume. The depth of runoff (H; mm) after each rainfall was calculated based on the runoff volume and area of the plot. The muddy water was stirred with a wooden stick, and the sediment was mixed well with the water, collected in a 500 mL sampling bottle, and repeated three times. It was sent back to the laboratory to be filtered and then dried at 95 °C for 8 h. From this, the sediment concentration as well as the soil loss rate (SLR; t km−2 event−1) were determined. Photographs were taken at the same location above each runoff plot. Image analysis was performed using Photoshop to visually classify the surface as soil versus vegetation [44]. The time interval was half a month, and three photos were taken each time to calculate the vegetation cover and take the average value. A portable soil moisture meter was used to measure the soil water content at half-month intervals.

2.4. Data Treatment and Statistical Analysis

The EPM model equation is as follows:
W = T × H × π × Z 1 / 3
W is the erosion rate (t km−2 year−1); H is the average annual precipitation; and T is the temperature coefficient, as shown in the following equation:
( t 0 / 10 + 0.1 ) 1 / 2
where t0 is the average annual temperature (°C); the erosion coefficient Z is given by the following equation:
Z = x y φ + J 1 / 2
where x denotes the land cover factor; y denotes the soil resistance to erosion; φ denotes the extent of the observed erosion process; and J denotes the average slope.
The experimental data of this study were counted and calculated using Excel 2016. IBM SPSS Statistics 25 was used to perform a k-means clustering analysis of annual rainfall, and rainfall erosion force was used as the cluster center to classify rainfall. Pearson correlation analysis was performed for H, SLR, and each influence factor. Regression analysis of SLR and H with multiple models was performed. Multiple comparisons between H and SLR were performed for each plot using the least significant difference test (LSD) and Duncan’s method. Finally, plotting was performed with OriginPro 2021.

3. Results

3.1. Rainfall Characteristics

There were 57 rainfall events in 2021 and 17 erosive rainfall events, accounting for 29.8% of the total rainfall. The total erosive rainfall was 336.2 mm, and the range of rainfall was 7.60 mm to 48.3 mm, with an average rainfall of 19.78 mm (Table 2). The range of rainfall ephemeris was 10 min~1459 min, and the average rainfall ephemeris was 580.35 min. The difference in rainfall erosion force was more significant, and it ranged from 6.16 MJ mm hm−2 h−1 to 728.37 MJ mm hm−2 h−1. The ranges of average rain intensity and maximum 30 min rainfall intensity were 0.50 mm~45.60 mm and 4.40 mm~54.00 mm, respectively. The rainfall types of annual rainfall were divided into seven categories (Table 3). The erosive rainfall was primarily concentrated in rain types II to VII. Rain type VII was the largest rainstorm of the year, and the rainfall erosive force was as high as 728.37 MJ mm hm−2 h−1.

3.2. Runoff Loss

As shown in Figure 2, H differed significantly under different soil and water conservation measures, land use types, and slope gradients. There was a significant difference between different land use types at the 0.05 level (Figure 3). The maximum average H was 6.24 mm in the longitudinal ridge tillage land (plots A1 and B1) and 5.84 mm in the bare land (plots A3, B3, and C3), while the shrubland (plot C1) and mixed forest (plot C2) did not produce runoff. The different soil and water conservation measures were also significantly different at the 0.05 level. The H of cross ridge tillage plots (plots A2 and B2) was much lower than that of longitudinal ridge tillage plots (plots A1 and B1), only 0.50 mm. The average H of 5° bare land (plot B3) was 5.25 mm, which was lower than that of 3° bare land (plot A3) and 8° bare land (plot C3). Due to the presence of the critical slope, the depth of runoff from 5° bare land was lower or higher than that from 3° bare land and 8° bare land several times during the rainfall year (Figure 4). The loss of runoff from plot B2 was lower than that from plot A2 due to the vegetation hedge.
Heavy rainfall caused extremely severe runoff losses to the bare ground, resulting in a high number of anomalies in the bare ground (Figure 3). Several rainstorms caused significant runoff losses, and the contribution of the maximum rainfall event to runoff losses ranged from 8.02% to 31.54% (Figure 5). The most considerable contribution was made by the cross ridge tillage land (plots A2 and B2), with 29.09% and 31.54%, respectively. The higher contribution occurred in plots with low annual runoff. The reduction efficiency of runoff under the maximum rainfall event was 91.80% and 87.94% for the cross ridge tillage plots (A2 and B2 plots), and the annual runoff reduction rate was 96.15% and 96.93% (Figure 6). In contrast, the longitudinal ridge tillage plots increased runoff by 14.05% and 107.93% under the maximum rainfall event and reduced annual runoff by 22.61% and 20.00%. The reduction efficiency of shrublands, as well as mixed forests, was up to 100%.

3.3. Soil Loss

Different soil and water conservation measures and land use types have a more significant impact on SLR. In terms of the SLR of the average rainfall event, the largest was the average SLR of 68.35 t km−2 for the longitudinal ridge tillage land (plots A1, B1), followed by the bare land (plots A3, B3, C3) with an evaluated SLR of 66.29 t km−2, and the shrubland and the mixed forest did not cause soil loss. The SLR of the cross ridge tillage plots (A2 and B2 plots) was much lower than that of the longitudinal ridge tillage plots (A1 and B1 plots), which was only 5.27 t km−2. There was no significant presence of a critical slope from the average SLR. The average SLR was 49.35 t km−2 for 3° bare land (plot A3), 66.23 t km−2 for 5° bare land (plot B3), and 83.29 t km−2 for 8° bare land (plot C3). However, in terms of rainfall throughout the year, it could be clearly seen that the SLR of multiple rainfall events in 5° bare land was higher than in 3° bare land and 8° bare land (Figure 4).
The contribution of maximum rainfall events to soil loss ranged from 6.62% to 43.23%. The contribution of soil erosion was the highest in the longitudinal ridge tillage land (plots A1 and B1), with 35.97% and 43.23%, respectively. The reduction efficiency of soil loss under the maximum rainfall event was 88.52% and 89.56% for the cross ridge tillage plots (A2 and B2), and the annual soil loss reduction rate was 95.55% and 97.31%. In contrast, soil loss increased by 197.48% and 422.27%, and annual soil loss was reduced by 18.57% and 19.98% under the maximum rainfall event in the longitudinal ridge plot (Figure 6). The reduction efficiency of shrublands, as well as mixed forests, was up to 100%.
The actual monitoring and the annual soil loss rate simulated by the EPM model are shown in Figure 7. Plot C3 has the highest annual SLR, with an actual monitored value of 1414.54 t km−2 year−1 and a simulated EPM value of 1505.91 t km−2 year−1. The simulated values for cross ridge tillage plots (A2 and B2) far exceeded the monitored values of 1102.65 t km−2 year−1 and 1078.33 t km−2 year−1, respectively.

3.4. Relationship between Runoff Loss and Soil Loss

The H of each plot was plotted against the corresponding SLR in a scatter plot to visualize their relationship (Figure 8). A combination of factors resulted in a scattered distribution of points in the graph. The better-fitting function was selected from the power function, exponential function, and linear function to describe the relationship between H and SLR (Table 4). The R2 was around 0.7, and the fit was good. p < 0.05 for plots A2 and B2, and p < 0.01 for other plots, indicating that the equation was significant and had a strong influence.

4. Discussion

Land use type and vegetation cover play an essential role in soil erosion. According to the soil erosion classification standard (SL109-2007) issued by the Ministry of Water Resources of the People’s Republic of China, the allowable soil loss in the black soil area is 200 t km−2 a−1. Soil loss from bare land (plots A3, B3, C3) is 3.7 to 7.07 times the allowable soil loss throughout the year. Vegetation restoration can change the physical properties of the soil and is considered worldwide an essential measure for the ecological restoration of the land to combat soil erosion [45,46,47]. Compared to the bare land C3 plots, the ecological restoration of the C1 and C2 plots as wasteland has been extremely effective (Figure 6). Soil loss caused by the shallow flow on gentle slopes is primarily due to rainfall energy acting on the surface soil. Black soil areas are dominated mainly by gentle slopes, and revegetation on wasteland can eliminate or reduce rainfall energy. Shrub stems and leaves have an interception effect on raindrops and avoid the direct splashing of raindrops on the soil [48]. Surface apoplastic material can be incorporated into the topsoil layer [49], leading to an increase in runoff resistance and an effective reduction in soil stripping capacity as well as rill erodibility [50]. This allows the bushes to be more resistant to soil erosion. Chen et al. [51] argued that more attention needs to be paid to restoring the lower and contact layers for structures with only tree layers. Their study concluded that the forest shrubland structure effectively prevents soil erosion in the red soil region of China. Optimizing the vertical structure of the vegetation can reduce runoff and thus mitigate soil erosion [52]. The multi-layered vegetation structure of mixed forests is more conducive to water retention and sand fixation compared to a single vegetation structure [28]. Numerous scholars [23,53] have conducted studies on vegetation restoration measures in the Loess Plateau. Zhang et al. [34] concluded that shrubs from grassland and mixed forests could effectively mitigate soil erosion, and shrublands can be the preferred vegetation type on the Loess Plateau. At present, vegetation restoration measures are widely used on the Loess Plateau and have achieved good restoration results. This study concluded that measures such as the revegetation of black soil areas and improvement of the vertical structure of vegetation are incredibly effective for the ecological restoration of black soil—for instance, planting shrubs such as Amorpha fruticosa Linn. on wastelands or planting shrubs to protect the substratum in woodlands with only tree layers. When implementing reforestation or the ecological restoration of the black land, we should learn from the experience of other regions and pay attention to the density and scale of plants. Large-scale, high-density artificial forestation can lead to severe water deficits in the soil [54,55,56]. The planted trees or bushes are at risk of forming a “dry soil layer,” which disrupts natural succession and prevents vegetation growth [28,57].
Different soil and water conservation measures have essential effects on soil erosion on cultivated land. Cross ridge tillage and longitudinal ridge tillage are the more common farming practices in Northeast China. There were significant differences in erosion under different tillage types (Figure 3). The increased water flow velocity and the occurrence of fine rill erosion under longitudinal ridge tillage resulted in more severe slope erosion [58]. For the whole year, cross ridge tillage (plot A2) can reduce the amount of soil loss by 95.5%, and the addition of plant hedges (plot B2) can reduce the amount of soil loss by 97.3% (Figure 6). Longitudinal ridge tillage (plots A1, B1) then increases soil erosion. In Northeast China, most of the crops are mainly longitudinal ridge tillage; the reason is that the crops are primarily dryland crops such as wheat (Triticum aestivum L.), soybean (Glycine max (Linn.) Merr.), and corn (Zea mays L.), and longitudinal ridge tillage is beneficial to drainage. Moreover, it is more convenient to cultivate the soil with longitudinal ridge tillage than with cross ridge tillage. Cross ridge tillage can effectively reduce soil erosion and nutrient loss and retain soil fertility. The platform of cross ridge tillage intercepts the runoff and increases the contact time between the runoff and the soil, allowing the majority of the runoff to infiltrate underground [59]. Yuan et al. [60] concluded that cross ridge tillage reduced sediment loss by 43.43% to 93.9% compared to longitudinal ridge tillage. Since the rainfall in this study area was low and the slope was relatively gentle, cross ridge tillage’s water retention and sand fixation capacity were more prominent. Jiang et al. [61] had similar results to the present study, which concluded that measures such as cross ridge tillage and ridge plant strips contribute to soybean yields while effectively controlling soil erosion compared to longitudinal ridge tillage. It has been suggested that cross ridge tillage can break the ridge platform under extreme rainfall, thus causing significant soil erosion [58]. Gai et al. [62] conducted simulated rainfall on 7° cross ridge tillage land in a black soil area. They concluded that the breakage of the ridge platform occurred at a rainfall intensity of 75 mm h−1. However, the intensity of simulated rainfall was much greater than that of natural rain, and in this study, no ridge platform breakage occurred under natural rainfall. According to the field observation, the cultivation method in the black soil area is mostly longitudinal ridge tillage. Changing from longitudinal ridge tillage to cross ridge tillage and adding plant hedges can increase crop yields while controlling soil erosion. This is an excellent soil and water conservation measure for black soil areas.
The slope is a vital topographic factor. The critical slope has been widely studied in various regions, such as the red soil zone [32], Loess Plateau [34], and purple soil zone [33]. The critical slopes obtained in this study in this study area ranged from 3° to 8°. Xu et al. [33] found two critical slopes for purple soils in the study area, and combined them with the trends in runoff volume as well as soil loss in this study; a larger critical slope may also exist for black soils in this study area. Long-term monitoring using runoff plots with larger slopes is also needed to validate the idea. An essential cause of the critical slope is soil crusting. The effect of soil crusting on erosion volume is currently controversial. A number of scholars [63] argued that the production of the crust makes the surface soil more resistant to erosion and thus reduces the amount of soil erosion. Another group of scholars [64] argued that the presence of crust increases surface runoff, and the increased surface runoff leads to increased soil erosion. In the present study, a more complex situation emerged. Rainfall is an essential factor contributing to soil crusting [65], and natural rainfall is far more complex than simulated rainfall. Slight crusting of the B3 plots was observed in multiple rainfall events throughout the year, and thus the increase in runoff led to increased soil erosion (Figure 4). Rain type VII, the largest rainfall event of the year, causes soil crusting. However, both runoff and soil loss decreased in plot B3, and both runoff and soil loss increased in plot C3, which is not consistent with the previous theory. Such results were also obtained by Gao et al. [66], who found that runoff and soil loss after crusting were lower in 5° black soils than in the uncrusted control, while runoff and soil loss after crusting were higher in 10° black soils than in the uncrusted control. The reason for this type of phenomenon is that the smoother surface layer of crusted soil allows the formation of a more uniform laminar flow at the surface. This makes the kinetic energy of runoff decrease, prolonging the contact time with the slope, increasing the infiltration rate of the surface, and reducing the slope yield [67]. There are fewer studies of this kind in the black soil area, and the exact reasons need to be explored in subsequent long-term experiments, as well as in situ observations. In terms of annual runoff volume and annual soil loss, both are proportional to the slope. This is due to the high content of water-stable aggregate in a stable black soil structure, which makes the black soil surface layer easily breakable, even in the presence of weak crusts [68].
Rainfall is the primary driver of soil erosion, and erosive storms can cause severe soil erosion [21]. Pearson correlation coefficients showed that H and SLR were significantly correlated with P, REF, and I30 for bare land as well as longitudinal ridge tillage (Table 5). H and SLR have almost no significant relationship with rainfall indicators due to the ability of A2 and B2 plots to be protected by the cross ridge tillage. Rainfall erosion forces predict the occurrence of erosion accurately (Table 3). Antecedent soil moisture content has an essential influence on soil erosion [69,70] and is an important factor leading to errors in prediction. The rainfall events where erosion occurred in Rain Type I all experienced a few days of antecedent rainfall with an antecedent soil moisture content of 40–50%. In contrast, the rainfall event in Rain Type II, where no erosion occurred, did not experience rainfall for a week or more prior to the rainfall, and the antecedent soil moisture content was only approximately 20%. Storm events cause several times more runoff and soil erosion than normal erosive rainfall and contribute significantly to annual soil erosion (Figure 5). Therefore, more attention should be paid to erosion control under heavy rainfall events [71]. Compared to longitudinal ridge tillage land and bare land, longitudinal ridge tillage land did not produce flow under some events with less rainfall intensity due to the vegetation cover. However, extremely severe erosion occurred in the longitudinal ridge tillage under the maximum rainfall event, with several times more soil loss than in the bare ground (Figure 6). The cross ridge tillage continued to have a relatively effective control effect, and no ridge platform breakage occurred. The vegetation-restored plots C1 and C2 can also effectively prevent soil erosion in black land during extreme rainfall events.
The EPM model improved by Stefanidis et al. [43] and Dominici et al. [72] more accurately simulated soil erosion on bare ground (Figure 7). However, the simulated values of the cross-monopoly cropland differed significantly from the monitored values due to the severe influence of soil conservation measures. This indicates that the EPM model is applicable to the black soil region of Northeast China and that soil erosion in the watershed can be simulated by this model in subsequent studies.

5. Conclusions

With long-term monitoring of soil erosion using the Bin County runoff field, this study found that soil erosion is mainly influenced by land use as well as soil and water conservation measures. Soil erosion is most severe in bare land, followed by longitudinal ridge tillage land. Under erosive storms, the SLR of longitudinal ridge tillage land far exceeds that of bare ground. The annual SLR of cross ridge tillage land was much lower than the allowable soil loss. Shrub and mixed forest plots restored by vegetation produced almost no soil erosion. Under the constraints of land use and soil conservation measures, the effect of slope on soil erosion is not significant. However, in a single rainfall event, attention also needs to be paid to the critical slope and the effect of soil crust on erosion. In this study, it was found that the critical slope changes slightly under different types of rainfall. The combination of antecedent soil moisture and rainfall erosion forces can better predict soil erosion. Prevention and control of erosion from erosive storm events should receive more attention.
Longitudinal ridge tillage can cause severe soil erosion. Cross ridge tillage on gentle slopes or adding plant hedges can effectively prevent erosion. The vegetation restoration measures of planting shrubs such as Amorpha fruticosa Linn. are incredibly effective in the ecological restoration of wastelands in black soil areas. For the black soil area after the retreat, the vertical structure of vegetation can be improved by planting shrubs at the bottom, thus achieving a good restoration effect.

Author Contributions

Conceptualization, T.D.; methodology, T.D.; software, T.D.; validation, T.D. and L.W.; data curation, T.D. and P.Q.; writing—original draft preparation, T.D.; writing—review and editing, T.D., L.W., T.L., P.Q. and J.W.; funding acquisition, T.L., P.Q. and J.W. All authors have read and agreed to the published version of the manuscript.

Funding

This research was funded by the Open Project of State Key Laboratory of Urban Water Resource and Environment, Harbin Institute of Technology (ES202116), Heilongjiang Province Key Research and Development Program Guidance Category Project (GZ20210061).

Data Availability Statement

Not applicable.

Acknowledgments

The authors are grateful to the editors and the anonymous reviewers for their insightful comments and suggestions.

Conflicts of Interest

The authors declare no conflict of interest.

References

  1. Marzen, M.; Iserloh, T.; de Lima, J.L.M.P.; Fister, W.; Ries, J.B. Impact of severe rain storms on soil erosion: Experimental evaluation of wind-driven rain and its implications for natural hazard management. Sci. Total Environ. 2017, 590, 502–513. [Google Scholar] [CrossRef]
  2. Li, Z.-G.; Gu, C.-M.; Zhang, R.-H.; Ibrahim, M.; Zhang, G.-S.; Wang, L.; Zhang, R.-Q.; Chen, F.; Liu, Y. The benefic effect induced by biochar on soil erosion and nutrient loss of slopping land under natural rainfall conditions in central China. Agric. Water Manag. 2017, 185, 145–150. [Google Scholar] [CrossRef]
  3. Rodrigo Comino, J.; Iserloh, T.; Lassu, T.; Cerda, A.; Keestra, S.D.; Prosdocimi, M.; Brings, C.; Marzen, M.; Ramos, M.C.; Senciales, J.M.; et al. Quantitative comparison of initial soil erosion processes and runoff generation in Spanish and German vineyards. Sci. Total Environ. 2016, 565, 1165–1174. [Google Scholar] [CrossRef] [PubMed]
  4. Garcia-Ruiz, J.M.; Begueria, S.; Nadal-Romero, E.; Gonzalez-Hidalgo, J.C.; Lana-Renault, N.; Sanjuan, Y. A meta-analysis of soil erosion rates across the world. Geomorphology 2015, 239, 160–173. [Google Scholar] [CrossRef] [Green Version]
  5. Panagos, P.; Borrelli, P.; Meusburger, K.; Yu, B.; Klik, A.; Lim, K.J.; Yang, J.E.; Ni, J.; Miao, C.; Chattopadhyay, N.; et al. Global rainfall erosivity assessment based on high-temporal resolution rainfall records. Sci. Rep. 2017, 7, 4175. [Google Scholar] [CrossRef] [PubMed] [Green Version]
  6. Stefanidis, S.; Alexandridis, V.; Ghosal, K.J.S. Assessment of Water-Induced Soil Erosion as a Threat to Natura 2000 Protected Areas in Crete Island, Greece. Sustainability 2022, 14, 2738. [Google Scholar] [CrossRef]
  7. Asadi, H.; Moussavi, A.; Ghadiri, H.; Rose, C.W. Flow-driven soil erosion processes and the size selectivity of sediment. J. Hydrol. 2011, 406, 73–81. [Google Scholar] [CrossRef] [Green Version]
  8. Martinez-Hernandez, C.; Rodrigo-Comino, J.; Romero-Diaz, A. Impact of lithology and soil properties on abandoned dryland terraces during the early stages of soil erosion by water in south-east Spain. Hydrol. Process. 2017, 31, 3095–3109. [Google Scholar] [CrossRef]
  9. Nearing, M.A.; Xie, Y.; Liu, B.; Ye, Y. Natural and anthropogenic rates of soil erosion. Int. Soil Water Conserv. Res. 2017, 5, 77–84. [Google Scholar] [CrossRef]
  10. Fernandez-Raga, M.; Palencia, C.; Keesstra, S.; Jordan, A.; Fraile, R.; Angulo-Martinez, M.; Cerda, A. Splash erosion: A review with unanswered questions. Earth-Sci. Rev. 2017, 171, 463–477. [Google Scholar] [CrossRef] [Green Version]
  11. Liu, X.; Zhang, S.; Zhang, X.; Ding, G.; Cruse, R.M. Soil erosion control practices in Northeast China: A mini-review. Soil Tillage Res. 2011, 117, 44–48. [Google Scholar] [CrossRef]
  12. Wang, Z.Q.; Liu, B.Y.; Wang, X.Y.; Gao, X. Erosion effect on the productivity of black soil in Northeast China. Sci. ChinaEarth Sci. 2009, 52, 1005–1021. [Google Scholar]
  13. Shuxia, Y.U.; Shang, J.; Zhao, J.; Guo, H. Factor Analysis and Dynamics of Water Quality of the Songhua River, Northeast China. Water Air Soil Pollut. 2003, 144, 159–169. [Google Scholar]
  14. Fang, H.; Sun, L.; Qi, D.; Cai, Q. Using Cs-137 technique to quantify soil erosion and deposition rates in an agricultural catchment in the black soil region, Northeast China. Geomorphology 2012, 169, 142–150. [Google Scholar] [CrossRef]
  15. Fan, H.M.; Cai, Q.G.; Guo, C.J.; Wang, T.L.; Su, F.L.; Cui, M. Study on criterion of soil loss tolerance and soil and water conservation in black soil region of Northeast China. J. Soil Water Conserv. 2005, 20, 84. [Google Scholar]
  16. Zhang, Y.; Wu, Y.; Lin, B.; Zheng, Q.; Yin, J. Characteristics and factors controlling the development of ephemeral gullies in cultivated catchments of black soil region, Northeast China. Soil Tillage Res. 2007, 96, 28–41. [Google Scholar] [CrossRef]
  17. Fu, B.; Liu, Y.; Lu, Y.; He, C.; Zeng, Y.; Wu, B. Assessing the soil erosion control service of ecosystems change in the Loess Plateau of China. Ecol. Complex. 2011, 8, 284–293. [Google Scholar] [CrossRef]
  18. Panagos, P.; Borrelli, P.; Poesen, J.; Ballabio, C.; Lugato, E.; Meusburger, K.; Montanarella, L.; Alewell, C. The new assessment of soil loss by water erosion in Europe. Environ. Sci. Policy 2015, 54, 438–447. [Google Scholar] [CrossRef]
  19. Wei, X.; Li, X.; Wei, N. Reducing runoff and soil loss using corn stalk juice at plot scale. Soil Tillage Res. 2017, 168, 63–70. [Google Scholar] [CrossRef] [Green Version]
  20. Wang, Z.-J.; Jiao, J.-Y.; Rayburg, S.; Wang, Q.-L.; Su, Y. Soil erosion resistance of “Grain for Green” vegetation types under extreme rainfall conditions on the Loess Plateau, China. Catena 2016, 141, 109–116. [Google Scholar] [CrossRef]
  21. Bryndal, T.; Franczak, P.; Kroczak, R.; Cabaj, W.; Kolodziej, A. The impact of extreme rainfall and flash floods on the flood risk management process and geomorphological changes in small Carpathian catchments: A case study of the Kasiniczanka river (Outer Carpathians, Poland). Nat. Hazards 2017, 88, 95–120. [Google Scholar] [CrossRef]
  22. Alavinia, M.; Saleh, F.N.; Asadi, H. Effects of rainfall patterns on runoff and rainfall-induced erosion. Int. J. Sediment Res. 2019, 34, 270–278. [Google Scholar] [CrossRef]
  23. Zhang, L.; Wang, J.; Bai, Z.; Lv, C. Effects of vegetation on runoff and soil erosion on reclaimed land in an opencast coal-mine dump in a loess area. Catena 2015, 128, 44–53. [Google Scholar] [CrossRef]
  24. De Baets, S.; Poesen, J.; Knapen, A.; Barbera, G.G.; Navarro, J.A. Root characteristics of representative Mediterranean plant species and their erosion-reducing potential during concentrated runoff. Plant Soil 2007, 294, 169–183. [Google Scholar] [CrossRef]
  25. Cerda, A.; Lucas Borja, M.E.; Ubeda, X.; Francisco Martinez-Murillo, J.; Keesstra, S. Pinus halepensis M. versus Quercus ilex subsp. Rotundifolia L. runoff and soil erosion at pedon scale under natural rainfall in Eastern Spain three decades after a forest fire. For. Ecol. Manag. 2017, 400, 447–456. [Google Scholar] [CrossRef] [Green Version]
  26. Neves dos Santos, J.C.; de Andrade, E.M.; Augusto Medeiros, P.H.; Simas Guerreiro, M.J.; de Queiroz Palacio, H.A. Effect of Rainfall Characteristics on Runoff and Water Erosion for Different Land Uses in a Tropical Semiarid Region. Water Resour. Manag. 2017, 31, 173–185. [Google Scholar] [CrossRef]
  27. Peng, T.; Wang, S.-j. Effects of land use, land cover and rainfall regimes on the surface runoff and soil loss on karst slopes in southwest China. Catena 2012, 90, 53–62. [Google Scholar] [CrossRef]
  28. Chen, H.; Zhang, X.; Abla, M.; Lu, D.; Yan, R.; Ren, Q.; Ren, Z.; Yang, Y.; Zhao, W.; Lin, P.; et al. Effects of vegetation and rainfall types on surface runoff and soil erosion on steep slopes on the Loess Plateau, China. Catena 2018, 170, 141–149. [Google Scholar] [CrossRef]
  29. Liu, B.Y.; Nearing, M.A.; Risse, L.M. Slope Gradient Effects on Soil Loss for Steep Slopes. Trans. ASAE 1994, 37, 1835–1840. [Google Scholar] [CrossRef]
  30. Hu, S.X.; Jin, C.X. Theoretical analysis and experimental study on the critical slope of erosion. Acta Geogr. Sin. 1999, 54, 356–362. [Google Scholar]
  31. Tang, G.; Song, X.; Li, F.; Zhang, Y.; Xiong, L. Slope spectrum critical area and its spatial variation in the Loess Plateau of China. J. Geogr. Sci. 2015, 25, 1452–1466. [Google Scholar] [CrossRef] [Green Version]
  32. Zhao, Q.; Li, D.; Zhuo, M.; Guo, T.; Liao, Y.; Xie, Z. Effects of rainfall intensity and slope gradient on erosion characteristics of the red soil slope. Stoch. Environ. Res. Risk Assess. 2015, 29, 609–621. [Google Scholar] [CrossRef]
  33. Xu, P.; Fu, B. The runoff characteristics under simulated rainfall on purple soil sloping cropland. Chin. J. Geochem. 2011, 30, 317–322. [Google Scholar] [CrossRef]
  34. Zhang, X.; Song, J.; Wang, Y.; Deng, W.; Liu, Y. Effects of land use on slope runoff and soil loss in the Loess Plateau of China: A meta-analysis. Sci. Total Environ. 2021, 755, 142418. [Google Scholar] [CrossRef] [PubMed]
  35. Xiong, M.; Sun, R.; Chen, L. Effects of soil conservation techniques on water erosion control: A global analysis. Sci. Total Environ. 2018, 645, 753–760. [Google Scholar] [CrossRef] [PubMed]
  36. Fang, H. Impacts of soil conservation measures on runoff and soil loss in a hilly region, Northern China. Agric. Water Manag. 2021, 247, 106740. [Google Scholar] [CrossRef]
  37. Maetens, W.; Poesen, J.; Vanmaercke, M. How effective are soil conservation techniques in reducing plot runoff and soil loss in Europe and the Mediterranean? Earth-Sci. Rev. 2012, 115, 21–36. [Google Scholar] [CrossRef] [Green Version]
  38. Wolka, K.; Mulder, J.; Biazin, B. Effects of soil and water conservation techniques on crop yield, runoff and soil loss in Sub-Saharan Africa: A review. Agric. Water Manag. 2018, 207, 67–79. [Google Scholar] [CrossRef]
  39. Wischmeier, W.H.; Smith, D.D. Predicting Rainfall Erosion Losses—A Guide to Conservation Planning; USDA-ARS Agriculture Handbook No. 537; Department of Agriculture, Science and Education Administration: Washington, DC, USA, 1978.
  40. Renard, K.G.; Foster, G.R.; Weesies, G.A.; Porter, J.P. RUSLE: Revised Universal Soil Loss Equation; US Department of Agriculture—USDA: Washington, DC, USA, 1991; Volume 46, pp. 30–33.
  41. Badaoui, K.E.; Ahmed, A.; Abdelah, A.; Essaadia, A. Erosion Potential Method (Gavrilovi Method): Methodological improvements and application in Toudgha River catchment, southeast of Morocco. Int. J. Water Sci. Environ. Technol. 2021, vi, 114–123. [Google Scholar]
  42. Stefanidis, S.; Stathis, D.J.W. Effect of Climate Change on Soil Erosion in a Mountainous Mediterranean Catchment (Central Pindus, Greece). Water 2018, 10, 1469. [Google Scholar] [CrossRef] [Green Version]
  43. Stefanidis, S.; Chatzichristaki, C.; Stefanidis, P. An ArcGIS toolbox for estimation and mapping soil erosion. J. Environ. Prot. Ecol. 2021, 22, 689–696. [Google Scholar]
  44. Chu, L.; Ishikawa, Y.; Shiraki, K.; Wakahara, T.; Uchiyama, Y. Relationship between Forest Floor Cover Percentage and Soil Erosion Rate on the Forest Floor with an Impoverished Understory Grazed by Deer (Cervus Nippon) at Doudaira, Tanzawa Mountains. J. Jpn. For. Soc. 2010, 92, 261–268. [Google Scholar] [CrossRef] [Green Version]
  45. Raclot, D.; Le Bissonnais, Y.; Annabi, M.; Sabir, M.; Smetanova, A. Main issues for preserving mediterranean soil resources from water erosion under global change. Land Degrad. Dev. 2018, 29, 789–799. [Google Scholar] [CrossRef]
  46. Buttle, J.M.; Farnsworth, A.G. Measurement and modeling of canopy water partitioning in a reforested landscape: The Ganaraska Forest, southern Ontario, Canada. J. Hydrol. 2012, 466, 103–114. [Google Scholar] [CrossRef]
  47. Molina, A.; Vanacker, V.; Balthazar, V.; Mora, D.; Govers, G. Complex land cover change, water and sediment yield in a degraded Andean environment. J. Hydrol. 2012, 472, 25–35. [Google Scholar] [CrossRef]
  48. Xiao, P.; Yao, W.; Shen, Z.; Yang, C.; Lyu, X.; Jiao, P. Effects of shrub on runoff and soil loss at loess slopes under simulated rainfall. Chin. Geogr. Sci. 2017, 27, 589–599. [Google Scholar] [CrossRef] [Green Version]
  49. Robichaud, P.R.; Lewis, S.A.; Wagenbrenner, J.W.; Ashmun, L.E.; Brown, R.E. Post-fire mulching for runoff and erosion mitigation Part I: Effectiveness at reducing hillslope erosion rates. Catena 2013, 105, 75–92. [Google Scholar] [CrossRef]
  50. Sun, L.; Zhang, G.-h.; Liu, F.; Luan, L.-l. Effects of incorporated plant litter on soil resistance to flowing water erosion in the Loess Plateau of China. Biosyst. Eng. 2016, 147, 238–247. [Google Scholar] [CrossRef]
  51. Chen, J.; Xiao, H.; Li, Z.; Liu, C.; Wang, D.; Wang, L.; Tang, C. Threshold effects of vegetation coverage on soil erosion control in small watersheds of the red soil hilly region in China. Ecol. Eng. 2019, 132, 109–114. [Google Scholar] [CrossRef]
  52. Liu, J.; Gao, G.; Wang, S.; Jiao, L.; Wu, X.; Fu, B. The effects of vegetation on runoff and soil loss: Multidimensional structure analysis and scale characteristics. J. Geogr. Sci. 2018, 28, 59–78. [Google Scholar] [CrossRef] [Green Version]
  53. Feng, T.; Wei, W.; Chen, L.; Rodrigo-Comino, J.; Die, C.; Feng, X.; Ren, K.; Brevik, E.C.; Yu, Y. Assessment of the impact of different vegetation patterns on soil erosion processes on semiarid loess slopes. Earth Surf. Process. Landf. 2018, 43, 1860–1870. [Google Scholar] [CrossRef]
  54. Fu, B.; Wang, S.; Liu, Y.; Liu, J.; Liang, W.; Miao, C. Hydrogeomorphic Ecosystem Responses to Natural and Anthropogenic Changes in the Loess Plateau of China. Annu. Rev. Earth Planet. Sci. 2017, 45, 223–243. [Google Scholar] [CrossRef]
  55. Liu, Y.; Miao, H.-T.; Huang, Z.; Cui, Z.; He, H.; Zheng, J.; Han, F.; Chang, X.; Wu, G.-L. Soil water depletion patterns of artificial forest species and ages on the Loess Plateau (China). For. Ecol. Manag. 2018, 417, 137–143. [Google Scholar] [CrossRef]
  56. Zhao, C.; Shao, M.a.; Jia, X.; Zhu, Y. Factors Affecting Soil Desiccation Spatial Variability in the Loess Plateau of China. Soil Sci. Soc. Am. J. 2019, 83, 266–275. [Google Scholar] [CrossRef]
  57. Wang, Y.; Shao, M.a.; Zhu, Y.; Liu, Z. Impacts of land use and plant characteristics on dried soil layers in different climatic regions on the Loess Plateau of China. Agric. For. Meteorol. 2011, 151, 437–448. [Google Scholar] [CrossRef]
  58. Feng, B.; Fenli, Z.; Ximeng, X.; Jia, L.; Chao, Q.; Hongyan, W. Comparison of Soil Erosion Process Between Longitudinal Ridge Slope and Non-ridge Slope in Mollisol Region of Northeast China. Bull. Soil Water Conserv. 2016, 36, 11–16. [Google Scholar] [CrossRef]
  59. Pengfei, W.; Zicheng, Z.; Xizhou, Z. Changes of Soil Surface Roughness and Its Effects on Rill Erosion in Slope of Cross Ridge at Seedling Stage of Maize. J. Soil Water Conserv. 2015, 29, 30–34. [Google Scholar] [CrossRef]
  60. Yuan, L.; Yue, K.; Gu, Z.; Chen, H.; Chi, Y. Analysis of Rainfall Factors and Soil Erosion in Different Soil and Water Conservation Measures in the Karst Plateau-Mountain. Pol. J. Environ. Stud. 2021, 30, 5343–5349. [Google Scholar] [CrossRef]
  61. Baiwen, J.; Saidong, Z.; Dan, W.; Liang, J.; Yumei, L.; Wenyi, G.; Meng, X.; Zhe, Z. Effect of Slope and Tillage Measures on Soil Erosion and Yield of Soybean. Soybean Sci. 2015, 34, 238–242. [Google Scholar]
  62. Hao, G.; Pingqi, L.; Mengxuan, Z.; Baixu, C.; Yingchun, W.; Ligang, W. Effects of Ridge Planting on Reducing Runoff and Soil Organic Carbon Loss in Black Soil Slope. J. Soil Water Conserv. 2022, 36, 300–304+311. [Google Scholar] [CrossRef]
  63. Moore, D.C.; Singer, M.J. Crust formation effects on soil erosion processes. Soil Sci. Soc. Am. J. 1990, 54, 1117–1123. [Google Scholar] [CrossRef]
  64. Chamizo, S.; Canton, Y.; Lazaro, R.; Sole-Benet, A.; Domingo, F. Crust Composition and Disturbance Drive Infiltration Through Biological Soil Crusts in Semiarid Ecosystems. Ecosystems 2012, 15, 148–161. [Google Scholar] [CrossRef]
  65. Agassi, M.; Morin, J.; Shainberg, I. Effect of Raindrop Impact Energy and Water Salinity on Infiltration Rates of Sodic Soils. Soil Sci. Soc. Am. J. 1985, 49, 186–190. [Google Scholar] [CrossRef]
  66. Yan, G.; Fenli, Z.; Bin, W.; Guifang, L.; Jiao, Z.; Yiliang, J. Effects of Soil Crust on Runoff and Sediment on Hillslope in Black Soil Region. Res. Soil Water Conserv. 2014, 21, 17–20. [Google Scholar] [CrossRef]
  67. Carmi, G.; Berliner, P. The effect of soil crust on the generation of runoff on small plots in an arid environment. Catena 2008, 74, 37–42. [Google Scholar] [CrossRef]
  68. Chongfeng, B.; Shufang, W.; Xingchang, Z.; Qiangguo, C. Development process of crust in black soil of Northeast China. Chin. J. Appl. Ecol. 2008, 19, 357–362. [Google Scholar]
  69. Wei, L.; Zhang, B.; Wang, M. Effects of antecedent soil moisture on runoff and soil erosion in alley cropping systems. Agric. Water Manag. 2007, 94, 54–62. [Google Scholar] [CrossRef]
  70. Schoener, G.; Stone, M.C. Impact of antecedent soil moisture on runoff from a semiarid catchment. J. Hydrol. 2019, 569, 627–636. [Google Scholar] [CrossRef]
  71. Liang, Y.; Jiao, J.; Tang, B.; Cao, B.; Li, H. Response of runoff and soil erosion to erosive rainstorm events and vegetation restoration on abandoned slope farmland in the Loess Plateau region, China. J. Hydrol. 2020, 584, 124694. [Google Scholar] [CrossRef]
  72. Dominici, R.; Larosa, S.; Viscomi, A.; Mao, L.; Cianflone, G.J.G. Yield Erosion Sediment (YES): A PyQGIS Plug-In for the Sediments Production Calculation Based on the Erosion Potential Method. Geosciences 2020, 10, 324. [Google Scholar] [CrossRef]
Figure 1. The locations of the study runoff plots.
Sustainability 14 08284 g001
Figure 2. Two types of tillage: (a) longitudinal ridge tillage, (b) cross ridge tillage.
Sustainability 14 08284 g002
Figure 3. (a) is the runoff depth (H) for each runoff plot and (b) is the soil loss rate (SLR) for each runoff plot. (The figures in the graph are average values. Means followed by numbers with the same letter are not significantly different at p = 0.05.)
Sustainability 14 08284 g003
Figure 4. (a) is the runoff depth (H) for each slope plot, and (b) is the soil loss rate (SLR) for each slope plot. NOTE: Take A3, B3 and C3 runoff plots as an example.
Sustainability 14 08284 g004
Figure 5. The contribution of the maximum rainfall event in each runoff plot to the annual runoff depth (H) and the annual soil loss rate (SLR).
Sustainability 14 08284 g005
Figure 6. Runoff and soil loss reduction rates (including maximum rainfall events and annual rainfall) for each runoff plot. NOTE: The A3, B3 and C3 plot is used as a reference for comparison with other plots in the same group.
Sustainability 14 08284 g006
Figure 7. Annual soil loss rates from actual monitoring and EPM model simulations for each runoff plot.
Sustainability 14 08284 g007
Figure 8. Relationship between runoff depth (H) and soil loss rate (SLR) for each runoff plot (C1, C2 plots because the production flow is not given).
Sustainability 14 08284 g008
Table 1. Information of the study runoff plots.
PlotLand UseSlope (°)Soil Conservation MeasureVegetation
A1Cultivated3longitudinal ridge tillage (distance: 70 cm)Glycine max (Linn.) Merr. (30 plants per row)
A2Cultivated3cross ridge tillage (distance: 70 cm)Glycine max (Linn.) Merr. (30 plants per row)
A3Bare land3--
B1Cultivated5longitudinal ridge tillage (distance: 70 cm)Glycine max (Linn.) Merr. (30 plants per row)
B2Cultivated5cross ridge tillage and plant hedge (distance: 70 cm)Glycine max (Linn.) Merr. (30 plants per row) and Amorpha fruticosa Linn.
B3Bare land5--
C1Shrub8-Amorpha fruticosa Linn. (coverage: 90~95%)
C2Forest and Shrub8-Ulmus pumila L. and Amorpha fruticosa Linn. (coverage: 90~95%)
C3Bare land8--
NOTE: C1 and C2 are ecological restoration plots that have been abandoned for years. The vegetation cover is the average cover from June to October. The lack of practical significance of average cover is not given due to the rapid change in soybean growing season.
Table 2. Characteristics of 17 erosive rainfall events in 2021.
P (mm)RD (min)R (MJ mm hm−2 h−1)Im (mm)I30 (mm)
Max.48.301459.00728.3745.6054.00
Min.7.6010.006.160.504.40
Mean19.78580.35132.048.2719.96
Std.12.06463.23193.4612.3814.12
NOTE: Std represents standard deviation, and P, RD, R, Im, I30 represent rainfall amount, rainfall ephemeris, rainfall erosion force, average rainfall intensity, and maximum 30 min rainfall intensity.
Table 3. Rainfall classification.
Rain TypeAggregation Center (MJ mm hm−2 h−1)Number of OccurrencesProportion of Maternal Flow (%)
I2.31385.26
20.941163.63
59.772100
132.191100
213.643100
445.611100
VII728.371100
Table 4. Regression analysis of runoff depth (H) and soil loss rate (SLR).
PlotRegression FunctionR2Adjusted R2Sig.
A1 S L R = 17.77 H 51.57 0.8020.7800.000
A2 S L R = 11.257 H 1.331 0.6930.6160.040
A3 S L R = 5.798 H 1.156 0.5770.5450.001
B1 S L R = 20.159 H 48.947 0.7120.6800.001
B2 S L R = 13.698 H 1.382 0.7720.7150.021
B3 S L R = 6.221 e 0.388 H 0.6970.6770.000
C3 S L R = 3.125 H 1.640 0.7510.7350.000
NOTE: Since no runoff was generated from plots C1 and C2, no regression analysis was performed.
Table 5. Pearson correlation coefficients of rainfall characteristic values and runoff depth (H), soil loss rate (SLR).
PRDRImI30
A1H0.902 **0.0450.896 **0.3360.744 **
SLR0.870 **−0.0920.967 **0.570.865 **
A2H0.799−0.6640.823 *0.7680.61
SLR0.124−0.720.2050.433−0.125
A3H0.937 **−0.130.912 **0.0570.849 **
SLR0.662 **0.020.580 *−0.0630.551 *
B1H0.954 **0.1210.906 **0.2150.760 **
SLR0.778 **−0.1730.886 **0.5620.770 **
B2H0.75−0.6770.7720.7340.54
SLR0.122−0.7470.2020.427−0.127
B3H0.565 *−0.240.554 *0.1450.682 **
SLR0.648 **−0.2520.576 *0.1740.704 **
C3H0.856 **−0.3340.942 **0.2760.855 **
SLR0.807 **−0.2040.814 **0.1650.785 **
NOTE: * represents significance at 0.05 level, and ** represents significance at the 0.01 level. P, RD, R, Im, and I30 represent the rainfall amount, rainfall duration, rainfall erosion force, average rainfall intensity, and maximum 30 min rainfall intensity of a single rainfall event.
Publisher’s Note: MDPI stays neutral with regard to jurisdictional claims in published maps and institutional affiliations.

