Article

A Study on Hydrochemical Characteristics and Evolution Processes of Groundwater in the Coastal Area of the Dagujia River Basin, China

1
Hebei Province Key Laboratory of Sustained Utilization and Development of Water Resources, Hebei GEO University, Shijiazhuang 050031, China
2
School of Water Resources and Environment, Hebei GEO University, Shijiazhuang 050031, China
3
Hebei Province Collaborative Innovation Center for Sustainable Utilization of Water Resources and Optimization of Industrial Structure, Hebei GEO University, Shijiazhuang 050031, China
4
College of Earth Science and Engineering, Shandong University of Science and Technology, Qingdao 266590, China
*
Author to whom correspondence should be addressed.
Sustainability 2022, 14(14), 8358; https://doi.org/10.3390/su14148358
Submission received: 11 June 2022 / Revised: 4 July 2022 / Accepted: 4 July 2022 / Published: 8 July 2022

Abstract

:
Groundwater resource is vital for industrial, drinking and irrigation purposes in the Dagujia river basin, China. The objective of this work was to comprehensively assess the hydrochemical characteristics and evolution processes of the Quaternary aquifer (QA) and the bedrock aquifer (BA) of the basin using statistical methods and hydrochemical plots. In total, 56 groundwater samples were collected from the QA (34 samples) and BA (22 samples). In addition, statistical methods combined with the geographic information system were used to identify the hydrochemical parameters of groundwater, as well as its spatial distribution in the Dagujia river basin. The Piper diagram showed that Ca-Na-HCO3 was the dominant groundwater facies type, while nine QA samples collected near the coastal line showed the Na-Cl facies type. On the other hand, the Gibbs diagram showed that most samples fell in the rock dominance zone. The principal component analysis results showed that the water–rock interaction and anthropogenic activities are the controlling factors, which is consistent with the results obtained using other methods. The results of this study indicated that rock weathering controls the hydrochemical characteristics of groundwater, while anthropogenic contamination and sea water intrusion are becoming increasingly serious issues for both QA and BA in the Dagujia river basin. Therefore, both Quaternary and bedrock aquifers require more attention.

1. Introduction

Groundwater is a reliable freshwater origin in coastal zones, where about 60% of the world’s population lives [1]. Numerous studies have indicated that economic development intensifies the demands for freshwater in many coastal areas worldwide [2]. Therefore, groundwater has become a vital resource for sustainable development [3]. Due to the increasing groundwater demand, many coastal aquifers are being overexploited, resulting in a significant reduction in groundwater quantity. In addition, coastal aquifers worldwide have also faced other serious environmental problems, including nitrate pollution, saline water mixing, climate change, the depletion of groundwater, land subsidence and soil salinization [2,4].
Hydrochemical characterization of groundwater can directly or indirectly reveal the groundwater facies types, the chemical evolution process of groundwater and the source of contamination [5]. Therefore, hydrochemical characterization of groundwater is important for water resources management and planning. The mechanisms of the natural circulation process, as well as unnatural factors, govern the hydrochemical characteristic of groundwater during its movement processes. The formation and hydrogeochemical processes of groundwater are affected by various complex factors, including the recharge source, groundwater flow direction, evaporation, rock weathering, soil property, ion exchange, saline water mixing and anthropogenic activities [1,6].
Numerous methods, including the influencing factor method, Pearson’s correlation, graphical method, multivariate statistical analysis and geochemical modeling, have been selected to research the hydrochemical properties of groundwater [4,7,8,9,10,11]. Meanwhile, the geographic information system (GIS) has become a useful and convenient tool to collect, classify and visualize associated non-spatial data and spatial features of groundwater. Kim et al. (2017) [12] revealed that the statistical and graphical methods are useful tools for assessing groundwater quality and hydrogeochemical processes. Aminiyan et al. (2020) [1] used the principal component analysis and Pearson’s correlation to determine the relationship between hydrochemical parameters, whereas Perera et al. (2022) [13] used GIS techniques for mapping the spatial variation of physicochemical parameters of groundwater and groundwater quality index.
To satisfy the fast development of urbanization, groundwater in the coastal area of the Dagujia river watershed has been overexploited. Indeed, the Dagujia river basin is a typical coastal area located in the Bohai Rim Economic Circle in China. However, in addition to groundwater pollution, this area has become a water-deficit area due to the significant decline in groundwater levels [14,15]. Moreover, the overexploitation of groundwater has induced a particular seawater intrusion in the groundwater systems, thus aggravating water problems and increasing the complexity of groundwater conditions. Therefore, understanding the hydrogeochemical characteristics and associated evolutionary processes of groundwater are of great significance for protecting groundwater resources and controlling groundwater contamination.
The hydrochemical characteristics of groundwater are closely related to the sedimentary environment. Many researchers have devoted considerable attention to assessing the groundwater resource in the basin using various methods. Hou et al. (2014) [16] observed slight nitrogen pollution levels in the shoreline of the Dagujia river basin caused by land use classes. Zhu et al. (2020) [15] assessed the impacts of various factors on pore water quality and pollution, whereas Gao et al. (2021) [17] used graphical methods to evaluate the Quaternary aquifer and its controlling factors. These studies showed that the deterioration of the groundwater is mainly due to seawater intrusion and human activities. Moreover, several studies have indicated that seawater intrusion is a complex process for both alluvial pore and bedrock fissure aquifers, which may involve saline water mixing, water–rock interactions and hydrogeochemical reactions [4,17]. According to a review of the related literature, earlier research of this basin mainly focused on the pore water aquifers near the coastal region without comprehensively investigating the hydrochemical characteristics and evolution of groundwater of the pore water and bedrock aquifers [2,15,16,17]. Therefore, both Quaternary and bedrock aquifers need to be considered for comprehensive hydrochemical research.
The aim of this work is to identify the hydrogeochemical characteristics and processes of groundwater of the Quaternary and bedrock aquifers in the Dagujia river basin. This study mainly involves: (1) analyzing the spatial distribution of the hydrochemical parameters of groundwater by combining statistical methods and GIS techniques; (2) assessing the relationships between hydrochemical parameters of groundwater; (3) identifying the facies types and evolution processes of groundwater using the Piper and Gibbs diagrams; (4) determining the factors controlling the hydrochemical characteristics of groundwater.

2. Materials and Methods

2.1. Study Area

The Dagujia river basin is located in Yantai city, Shandong province, China (Figure 1). This area is situated in the northern coastal region and is bound by the sea to the north. The main river is the Dagujia River, which flows from the confluence hill to the sea. The climate is a semi-humid monsoon/warm monsoon climate, with average annual precipitation and evaporation of 629 and 1745 mm, respectively [18]. In addition, the lowest and highest temperatures are −19.5 and 38.4 °C, respectively [15,18].
The Dagujia River has a length of 140 km, which makes it the second longest river in Yantai City. Indeed, the study area is a large river basin with perennial river runoff in the northern Shandong Peninsula, playing an important role in regional economic growth [16]. The Shandong Peninsula, which is part of the Bohai Rim Economic Belt, is a major industrialized region in China [17]. In this coastal area, groundwater is one of the main sources used to meet industrial, agricultural and domestic drinking demands.
Geological deposits can be classified as Paleoproterozoic metamorphic rocks, Neoproterozoic sedimentary rock and Quaternary loose sediments. Based on the hydrogeological characteristics, two dominant aquifer types are distinguished, namely the Quaternary aquifer (QA) and the bedrock aquifer (BA) [2]. Indeed, the QA is the most exploited aquifer. The predominant lithologies of the QA are gravel and fine to coarse sand. The thickness and hydraulic conductivity of the QA range between 5 and 20 m and from less than 10 to more than 40 m/d, respectively. The river-bed sediments of the loose aquifer are generally characterized by high transmissivity and thickness. The QA covers the plain area and is recharged mainly from precipitation and lateral flow. Groundwater exploitation constitutes the main discharge of the QA. Precipitation is the main recharge origin for the BA, while pore water and lateral flow of the river are the recharge sources of the BA, more particularly, in the low-lying area. The occurrence of 10–20 m thick BA is controlled by the extent of rock fracturing [14,15]. The hydraulic conductivity is less than 10 m/d in most areas of the BA. The groundwater level is higher in the south compared to the north. However, the local flow direction is also affected by the groundwater fall funnel due to the long-term pumping of groundwater.

2.2. Methodology

2.2.1. Sample Collection and Analyses

In total, 56 water samples were taken from public and private bore wells during the November 2016–November 2017 period, including 34 samples from the QA and 22 samples from the BA (Figure 1). The QA and BA samples were collected from depth ranges of 5–35 m and 10–40 m, respectively. Samples were collected and analyzed according to standard methods and approaches used in previous studies [1,19]. The polyethylene bottles were cleaned using groundwater after a pumping time of about 30 min [1,6]. The pH and total dissolved solids (TDS) of groundwater were first tested immediately after groundwater sampling, and then, the samples were stored at 4 °C immediately after sampling for further analyses. The potassium (K+) and sodium (Na+) concentrations were analyzed using a flame photometer, while magnesium (Mg2+) and calcium (Ca2+) were determined using the titration method [9]. The sulfate (SO42−), chloride (Cl) and nitrate (NO3) were measured using ion chromatography [5,13]. The carbonate (CO32−) and bicarbonate (HCO3) were analyzed using the acid titration method. In addition, total hardness (TH) was calculated using Mg2+ and Ca2+ concentrations [20].
On the other hand, the reliability of analysis results was checked using the ion balance error (IBE), according to the following formula [6,21]:
IBE = c a t i o n s a n i o n s c a t i o n s + a n i o n s × 100
where all ions are expressed in milliequivalents per liter (meq/L). In this study, the threshold absolute value of IBE was set at 5%. The results of groundwater samples that showed IBE values within the threshold value were used for subsequent analyses. Meanwhile, due to the low NO2 and CO32− concentrations, they were not considered in further analysis.

2.2.2. Multivariate Analysis

Multivariate analysis techniques are important tools for assessing the hydrochemical characteristics of groundwater. They were, indeed, applied in several areas [22]. Several researchers have indicated that geological and anthropogenic influences on the hydrochemical characteristics of groundwater can be assessed using multivariate statistics. In this study, correlation analysis was used to analyze the hydrochemical characteristics of QA and BA. Meanwhile, the principal component analysis (PCA) was selected to assess the controlling factor. A total of 11 physicochemical parameters of groundwater were considered in the statistical analyses.
The Pearson correlation is often selected to determine the relationships between various quantitative variables. Indeed, Pearson’s correlation coefficients (r) can indicate the strength of the linear relationship between various hydrochemical parameters of groundwater, varying from −1 to 1. In this study, the significance of the correlation was evaluated using the p < 0.05 level. Based on several related studies [8,22,23], r values greater than 0.9 and lower than 0.5 indicate strong and low positive correlations, respectively, whereas r range values of 0.5–0.7 and 0.7–0.9 indicate moderate and good correlations, respectively.
PCA is an effective multivariate analysis method. This technique is used to reduce the dimensionality of independent variables by compressing and arranging them into a reduced number of principal components (PCs) [7,24]. Therefore, the main advantage of PCA is its capability to reduce various original variables into a small number of independent new variables to summarize and represent the original dataset with low information loss [10,11]. Based on the standardized groundwater dataset, PCs can be extracted based on the symmetric correlation matrix [25]. In addition, the Kaiser criterion was used to extract the maximum number of PCs. The eigenvalues of the PCs can be obtained from the weighted covariance matrices [7]. In this study, the correlation matrix and PCs were realized using SPSS version 16.0.
On the other hand, a widely used interpolation method, the inverse distance weighted method, was selected to interpolate the chemical parameters of groundwater [20,26]. Therefore, the spatial distributions of the physicochemical characteristics of groundwater were mapped in this study using the IDW interpolation method in ArcGIS 9.3.

2.2.3. Graphical Illustration

Graphic tools were used to determine the major factors influencing the groundwater systems. Indeed, the trilinear Piper diagram is an effective and simple method for determining the evolutionary processes and hydrochemical facies types of groundwater. This diagram consists of two triangles and a central diamond. The two triangles at the bottom represent the major cations and anions separately, while the diamond diagram at the top reveals the overall characteristics of water samples [27]. The major cations and anions of groundwater samples expressed in milliequivalents percentages were used in this study.
On the other hand, the Gibbs diagram was used in several studies to analyze the hydrochemical processes of the groundwater [25]. In fact, the effects of three main mechanisms, namely the water–rock interaction, evaporation and ion exchange, can be assessed using the Gibbs diagram [6,28]. The Gibbs diagram represents the Cl/(Cl + HCO3) and Na+/(Na+ + Ca2+) ratios versus TDS to assess groundwater hydrochemical characteristics [29]. TDS and the ionic concentrations were taken in mg/L and meq/L, respectively.

3. Results and Discussion

3.1. Hydrochemical Characteristics

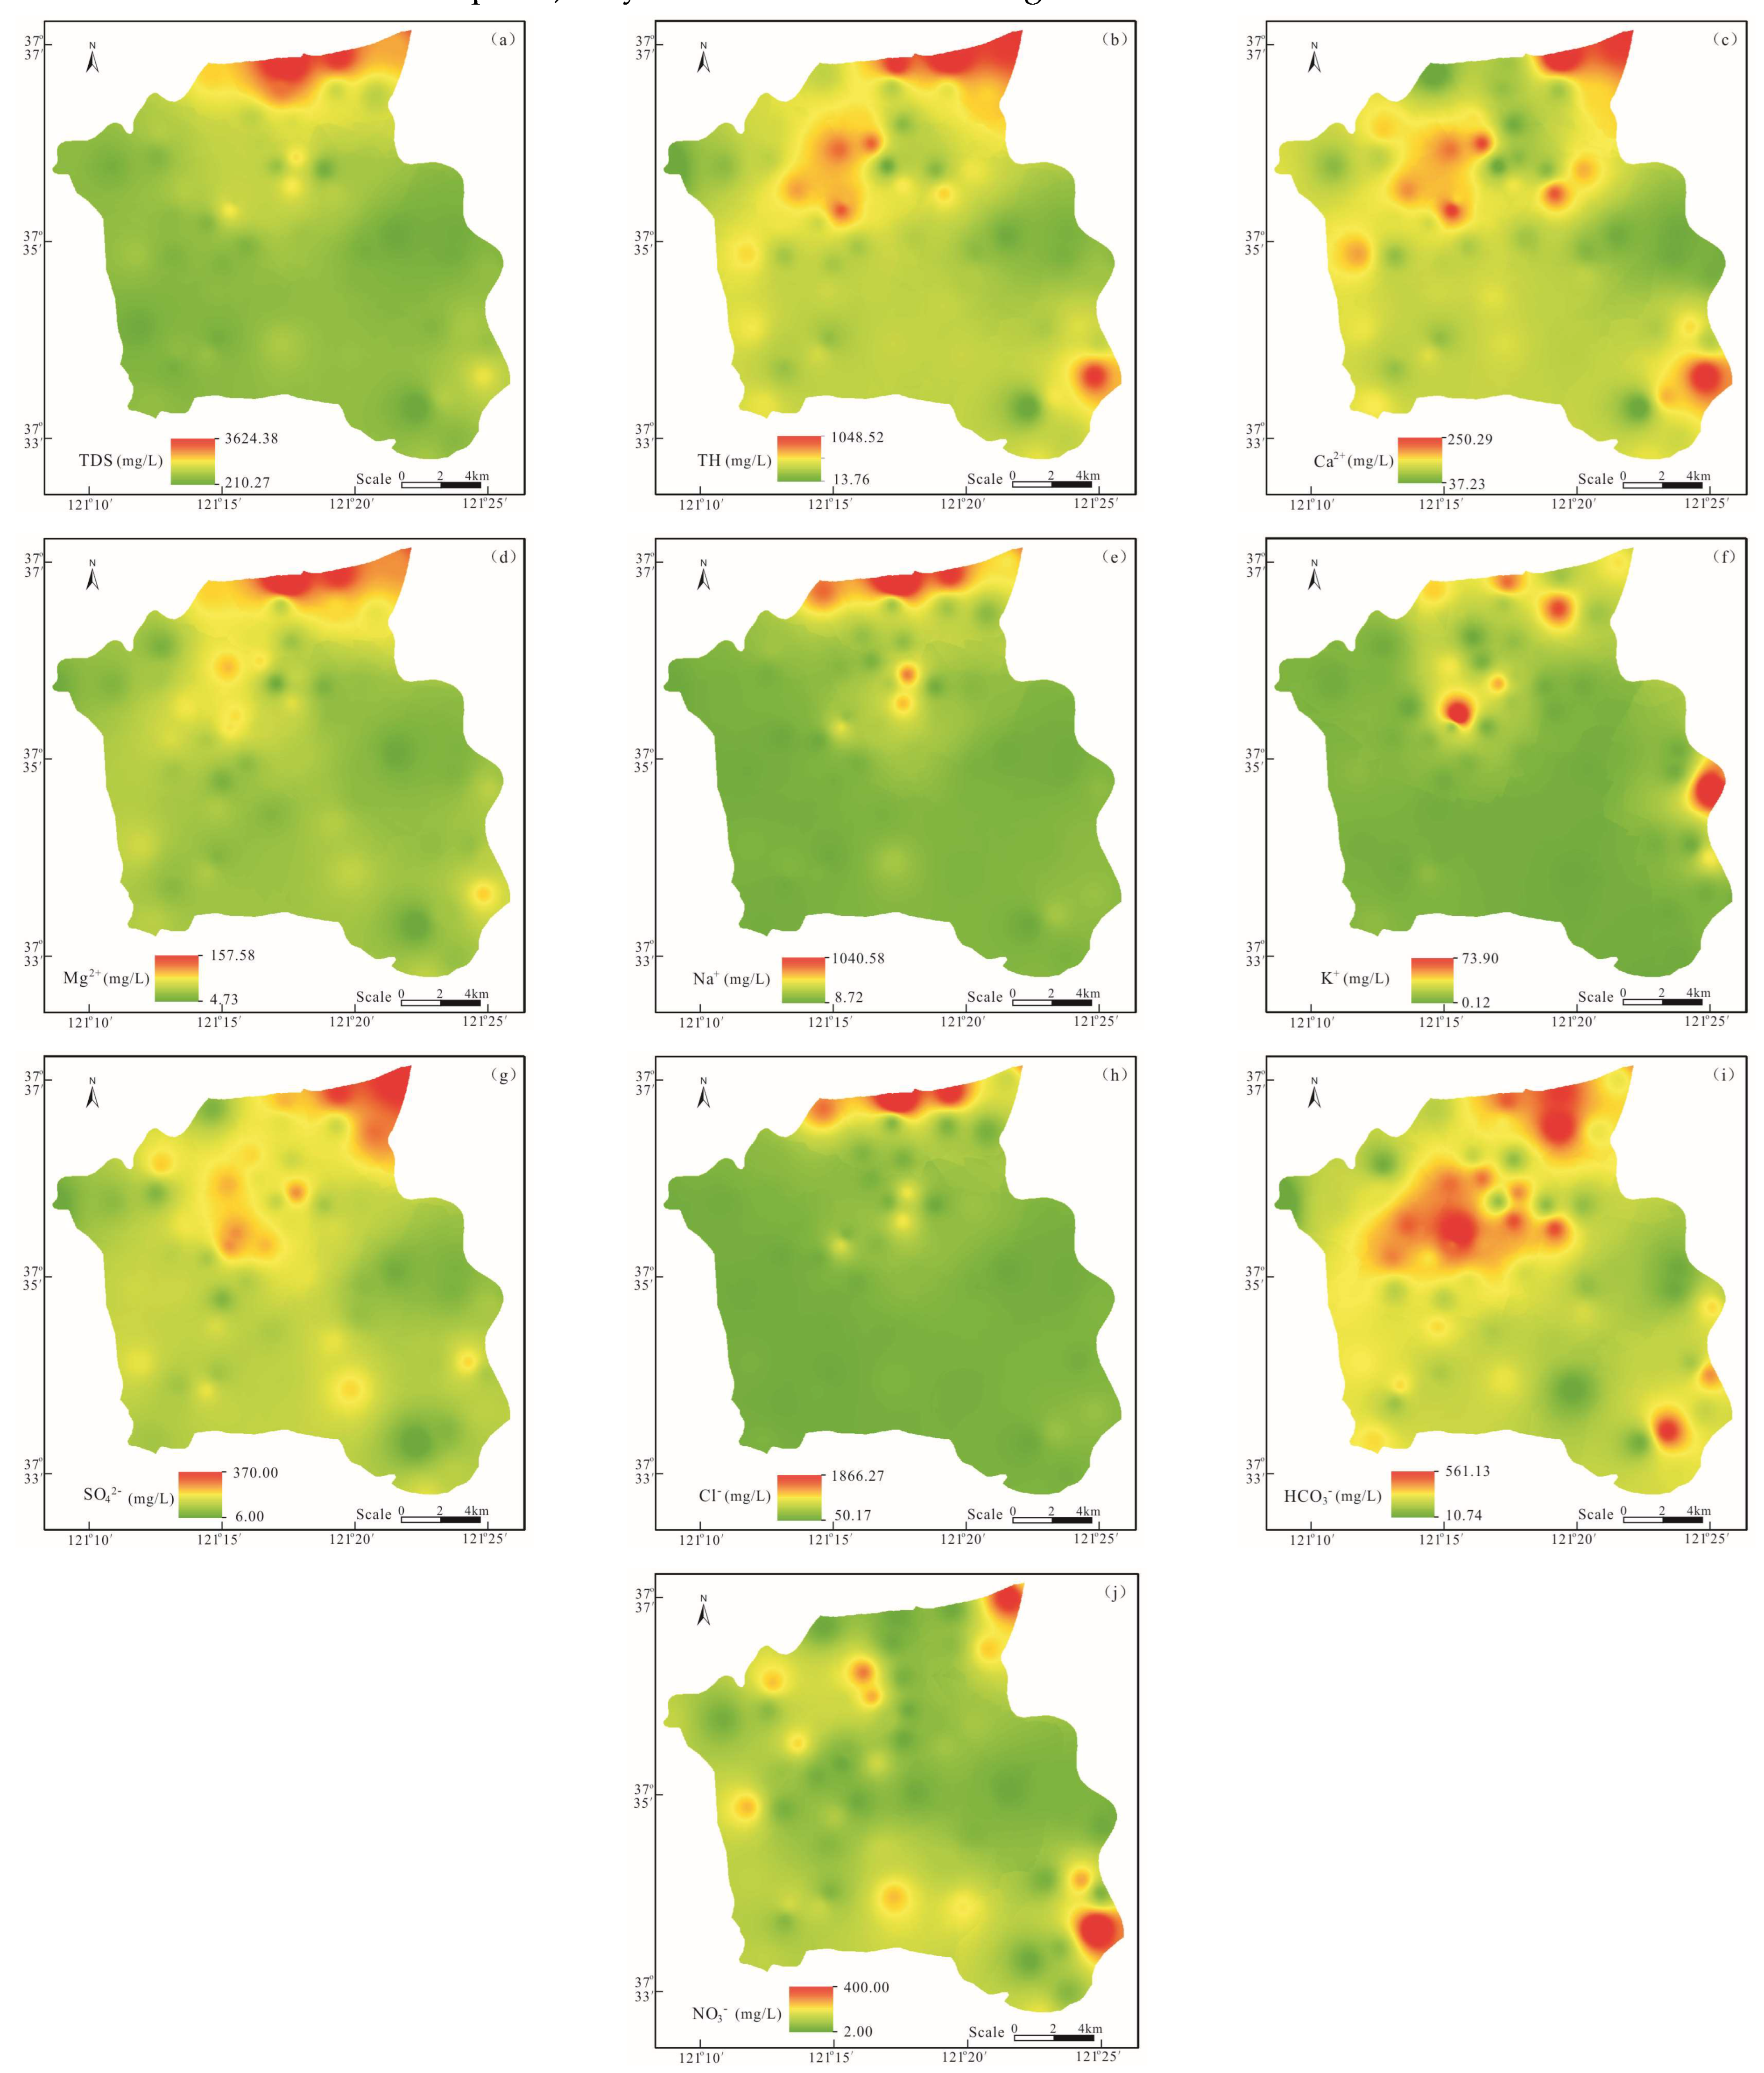
The descriptive statistics of hydrochemical data are reported in Table 1, while the spatial distributions of hydrochemical parameters (except pH) are shown in Figure 2. Overall, it was observed that the concentrations and distributions of hydrochemical parameters of the QA and BA showed significant spatiotemporal variations.
Table 1 showed high standard deviation (SD) values in most groundwater chemical parameters, indicating that the groundwater characteristics might be affected by complex factors [26]. The pH values varied from 7.71 to 8.42 and 6.96 to 8.25, with mean values of 7.79 and 7.56 in the QA and BA, respectively, suggesting slightly alkaline groundwater. Indeed, alkaline environments in groundwater imply the release of a greater number of hydroxide ions into the solution [30]. The occurrence of alkaline groundwater is related to the hydrochemical processes of groundwater (e.g., rock weathering).
On the other hand, the results showed large ranges of TDS concentrations, varying from 210.27 to 3624.42 mg/L and 293.44 to 945.24 mg/L, with mean data of 1093.63 and 625.66 mg/L, in the QA and BA, respectively. In addition, 44.11% of the QA samples revealed TDS > 1000 mg/L, while all BA samples were less than 1000 mg/L [28,30]. Groundwater samples with higher TDS concentrations (TDS > 1000 mg/L) can be classified as saline water [7]. In addition, the spatial distribution of TDS revealed an increase in the concentrations from south to north (Figure 2a), showing consistent spatial variation with those revealed by Na+ and Cl concentrations. According to previous studies, the sea/saltwater mixed intrusion is vital to the hydrochemical characteristics of groundwater [18].
Regarding TH, it showed ranges of 116.81–1048.52 mg/L and 160.61–613.23 mg/L in the QA and BA, respectively. In addition, TH revealed a consistent spatial distribution with those of Ca2+ and Mg2+ (Figure 2b). The high SD value of TH may be related to the complex hydrochemical settings. According to Shukla et al. (2021) [20], intense agricultural activities and wastewater leaching may be sources of high TH in groundwater.
The Ca2+ concentrations in the QA and BA varied from 37.23 to 250.29 mg/L and 47.70 to 157.88 mg/L, respectively. As shown in Figure 2c, higher Ca2+ concentrations in the QA were mainly observed in the northeastern part, which may be related to the saline water interaction. The high Ca2+ concentrations in the BA may be derived from rock dissolution [9]. Moreover, the high Ca2+ concentrations may also be related to anthropogenic activities. On the other hand, the ranges of Mg2+ concentrations were 4.73–157.58 mg/L and 8.27–53.19 mg/L in the QA and BA, respectively. Moreover, the highest Mg2+ concentrations were observed in the northwestern part (Figure 2d). Indeed, limestone and sandstone weathering are often the major sources of Mg2+ in groundwater [13]. The ranges of Na+ concentrations were 26.14–1040.60 mg/L and 23.87–144.60 mg/L in the QA and BA, respectively. The high Na+ concentrations were mainly observed near the coastal shore (Figure 2e). Meanwhile, the groundwater samples near the rivers also showed relatively high Na+ concentrations. In fact, Na+ ions can come from the rock–water interaction, saline water mixing and ion exchange in similar regions [31]. High Na+ concentrations may significantly affect the taste of drinking groundwater at a concentration threshold above 200 mg/L [1]. K+ concentrations in the QA and BA sample ranges were 0.14–73.80 mg/L and 0.12–73.90 mg/L, respectively, as shown in Figure 2f. In addition, high K+ concentrations in both QA and BA were observed in the northern and eastern region, respectively [5,31,32]. In total, 13 QA and 2 BA samples revealed high K+ concentration values, which may be related to the mixing of fresh groundwater with seawater, chemical fertilizer and wastewater, as demonstrated in previous studies [5,33].
According to related studies [33,34], higher SO42− concentrations are usually originated from sulfate minerals dissolution and anthropogenic activities (e.g., domestic sewage and fertilizer) [35]. The spatial distribution of SO42− concentrations indicated that samples with high concentrations were located near the northern coast, suggesting that seawater intrusion may be an additional factor causing high SO42− concentrations (Figure 2g). The ranges of Cl concentrations were 50.17–1866.31 mg/L and 50.17–247.50 mg/L in the QA and BA, respectively. In addition, the higher Cl concentrations in QA samples were observed mainly near the coastal region (Figure 2h). Similarly, Cl distribution in groundwater was consistent with that of Na+, indicating that those two anions have the same source. Nevertheless, the halite dissolution and anthropogenic factors (e.g., sewage disposal) may also be sources of Cl in groundwater.
The HCO3 concentrations in the QA and BA varied from 90.15 to 561.14 mg/L and from 101.90 to 443.81 mg/L, respectively. The highest HCO3 concentrations were consistent with the spatial distribution of Ca2+ concentrations (Figure 2i). The bicarbonate in groundwater is mainly related to the dissolution of rocks [32,34]. Sulfate concentrations in the QA and BA varied from 6.00 to 370.00 mg/L and from 10.00 to 175.00 mg/L, respectively. On the other hand, NO3 is a common pollutant in shallow groundwater systems in several areas worldwide [36]. In this study, the NO3 concentrations ranged from 2.00 to 400.00 mg/L and from 2.00 to 180.00 mg/L in the QA and BA, respectively. The spatial distribution of NO3 concentrations showed higher concentrations in agricultural land and near urban areas (Figure 2j). The high NO3 concentrations in aquifers may be due to the high density of urban areas and intensive human activity [18,22]. Overall, 44.64% of the collected groundwater samples (15 QA and 10 BA samples) exceeded the World Health Organization drinking water threshold for NO3 (50 mg/L). Indeed, high NO3 concentration is unsuitable for drinking usage.
According the hydrochemical characteristics of the QA, the average values had the orders of Na+ > Ca2+ > Mg2+ > K+ and Cl > HCO3 > SO42− > NO3 for cations and anions, respectively. Meanwhile, the average cation and anion concentrations values of the BA had the rank of Ca2+ > Na+ > Mg2+ > K+ and HCO3 > Cl> SO42− > NO3, respectively. Compared to the BA, the QA exhibited higher Cl- and Na+ concentrations, demonstrating the saline water intrusion in groundwater [13].

3.2. Correlation Relationship

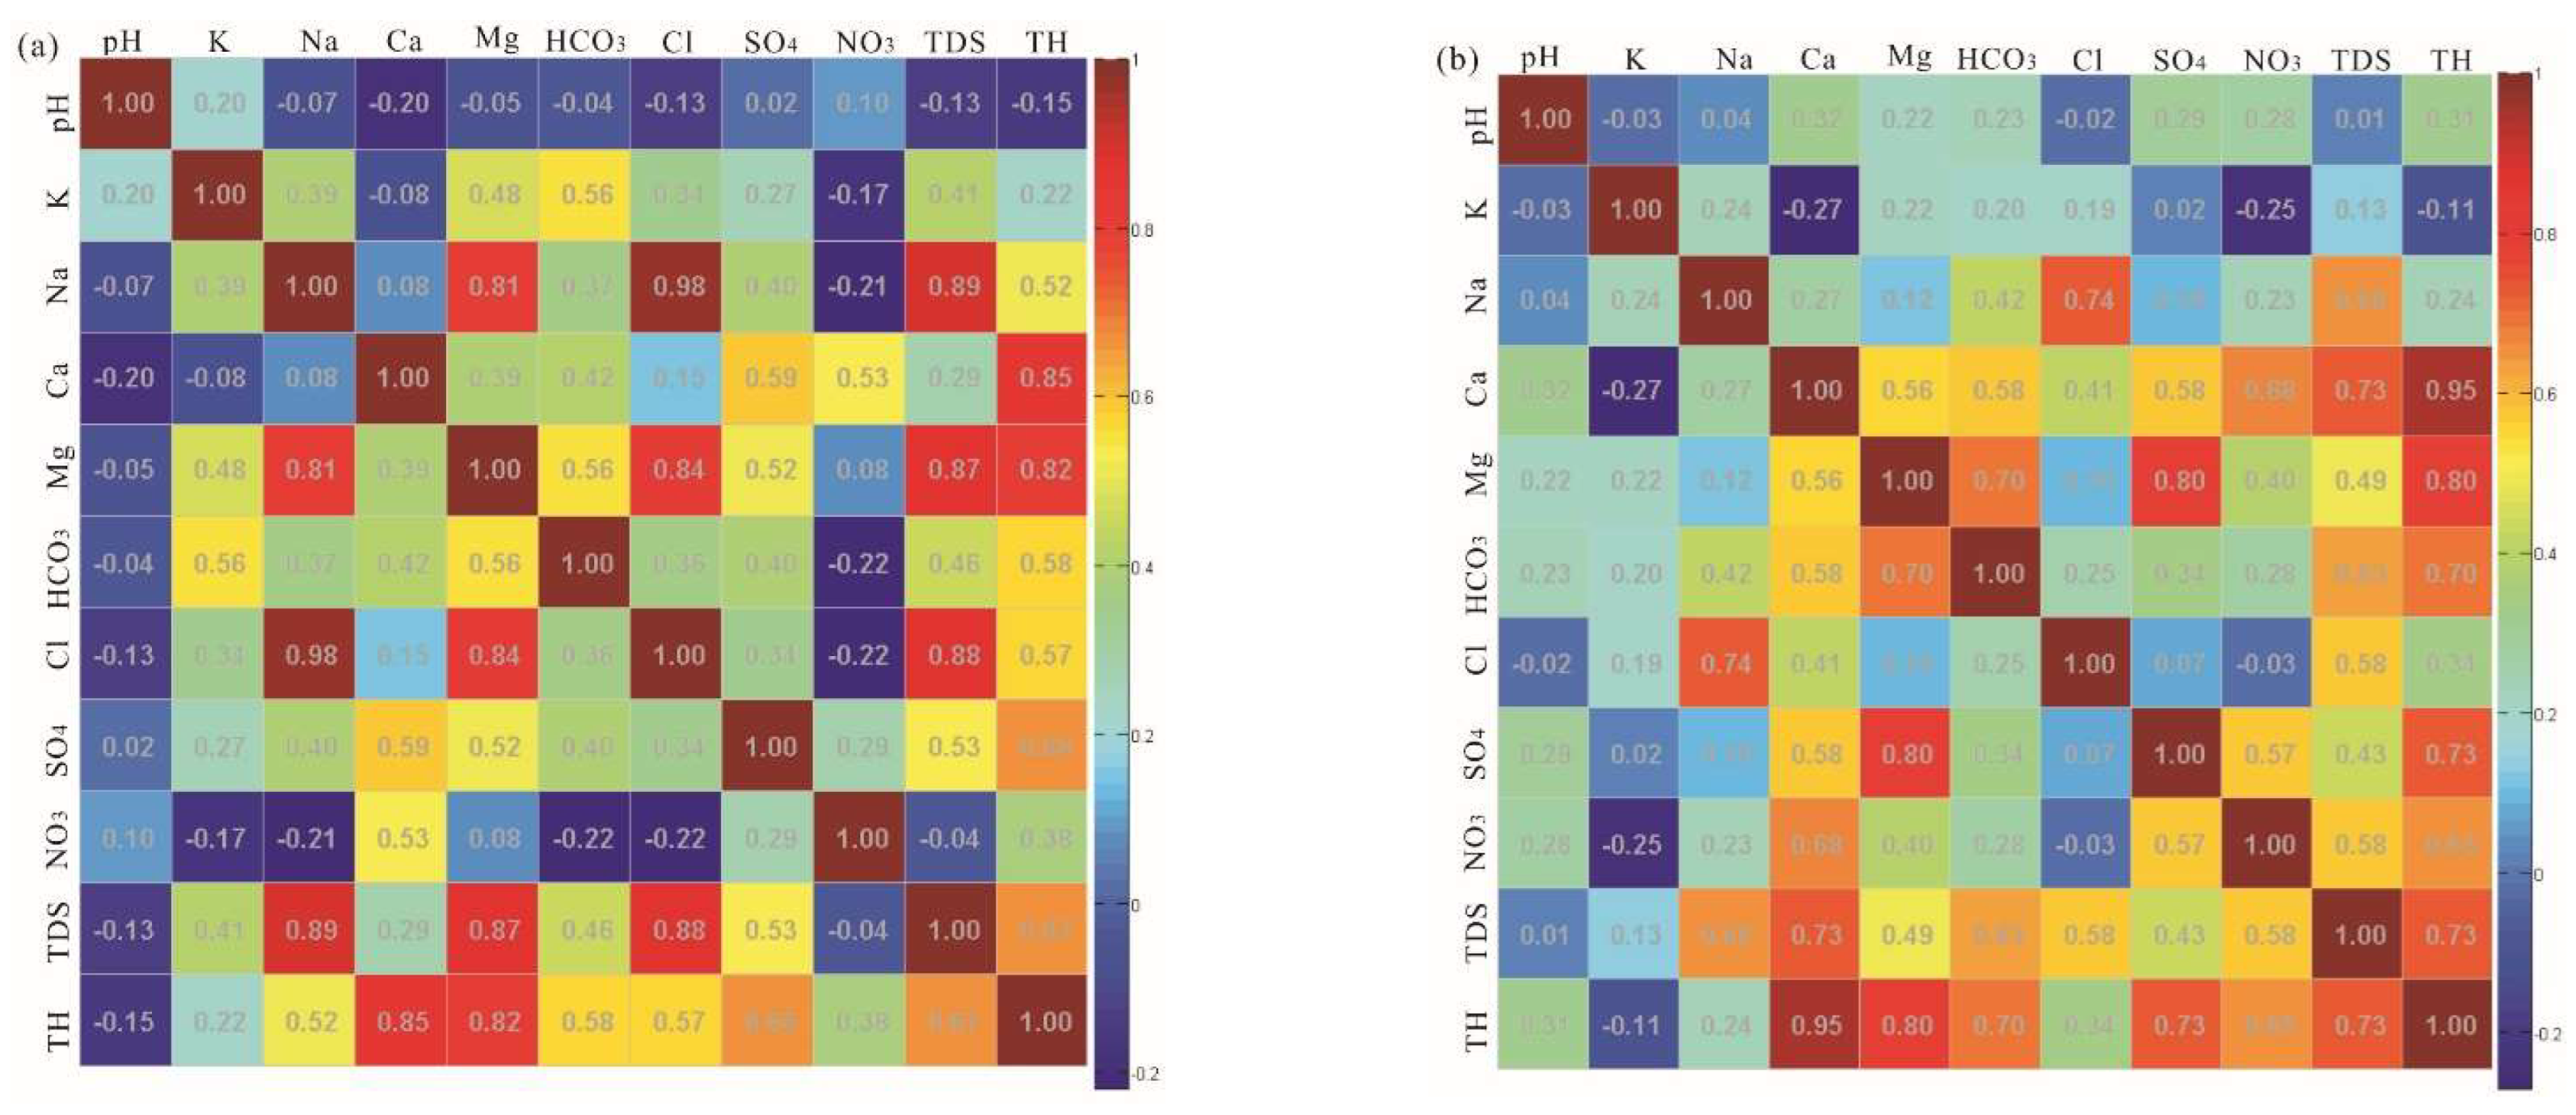
The Pearson correlation coefficient (r) can manifest the strength of the linear relationships between hydrochemical parameters of groundwater in the QA and BA, as shown in Figure 3. The statistical significance levels (p-values) were less than 0.05. The good and moderate positive correlations between TDS and major ions, namely Na+ (0.89), Mg2+ (0.87), Cl (0.88) and SO42− (0.53) in the QA and Ca2+ (0.73), Na+ (0.66), HCO3 (0.63), Cl (0.58) and NO3 (0.58) in the BA, suggested significant contributions of these ions in groundwater [8]. In addition, TH showed good positive correlation (r > 0.8) with Ca2+ and Mg2+, suggesting that Ca2+ and Mg2+ contributed significantly to the hardness of groundwater. Meanwhile, Mg2+ showed good and moderate correlations with Cl and SO42− (0.9 > r > 0.5), suggesting contamination from anthropogenic factors (e.g., magnesium fertilizer application).
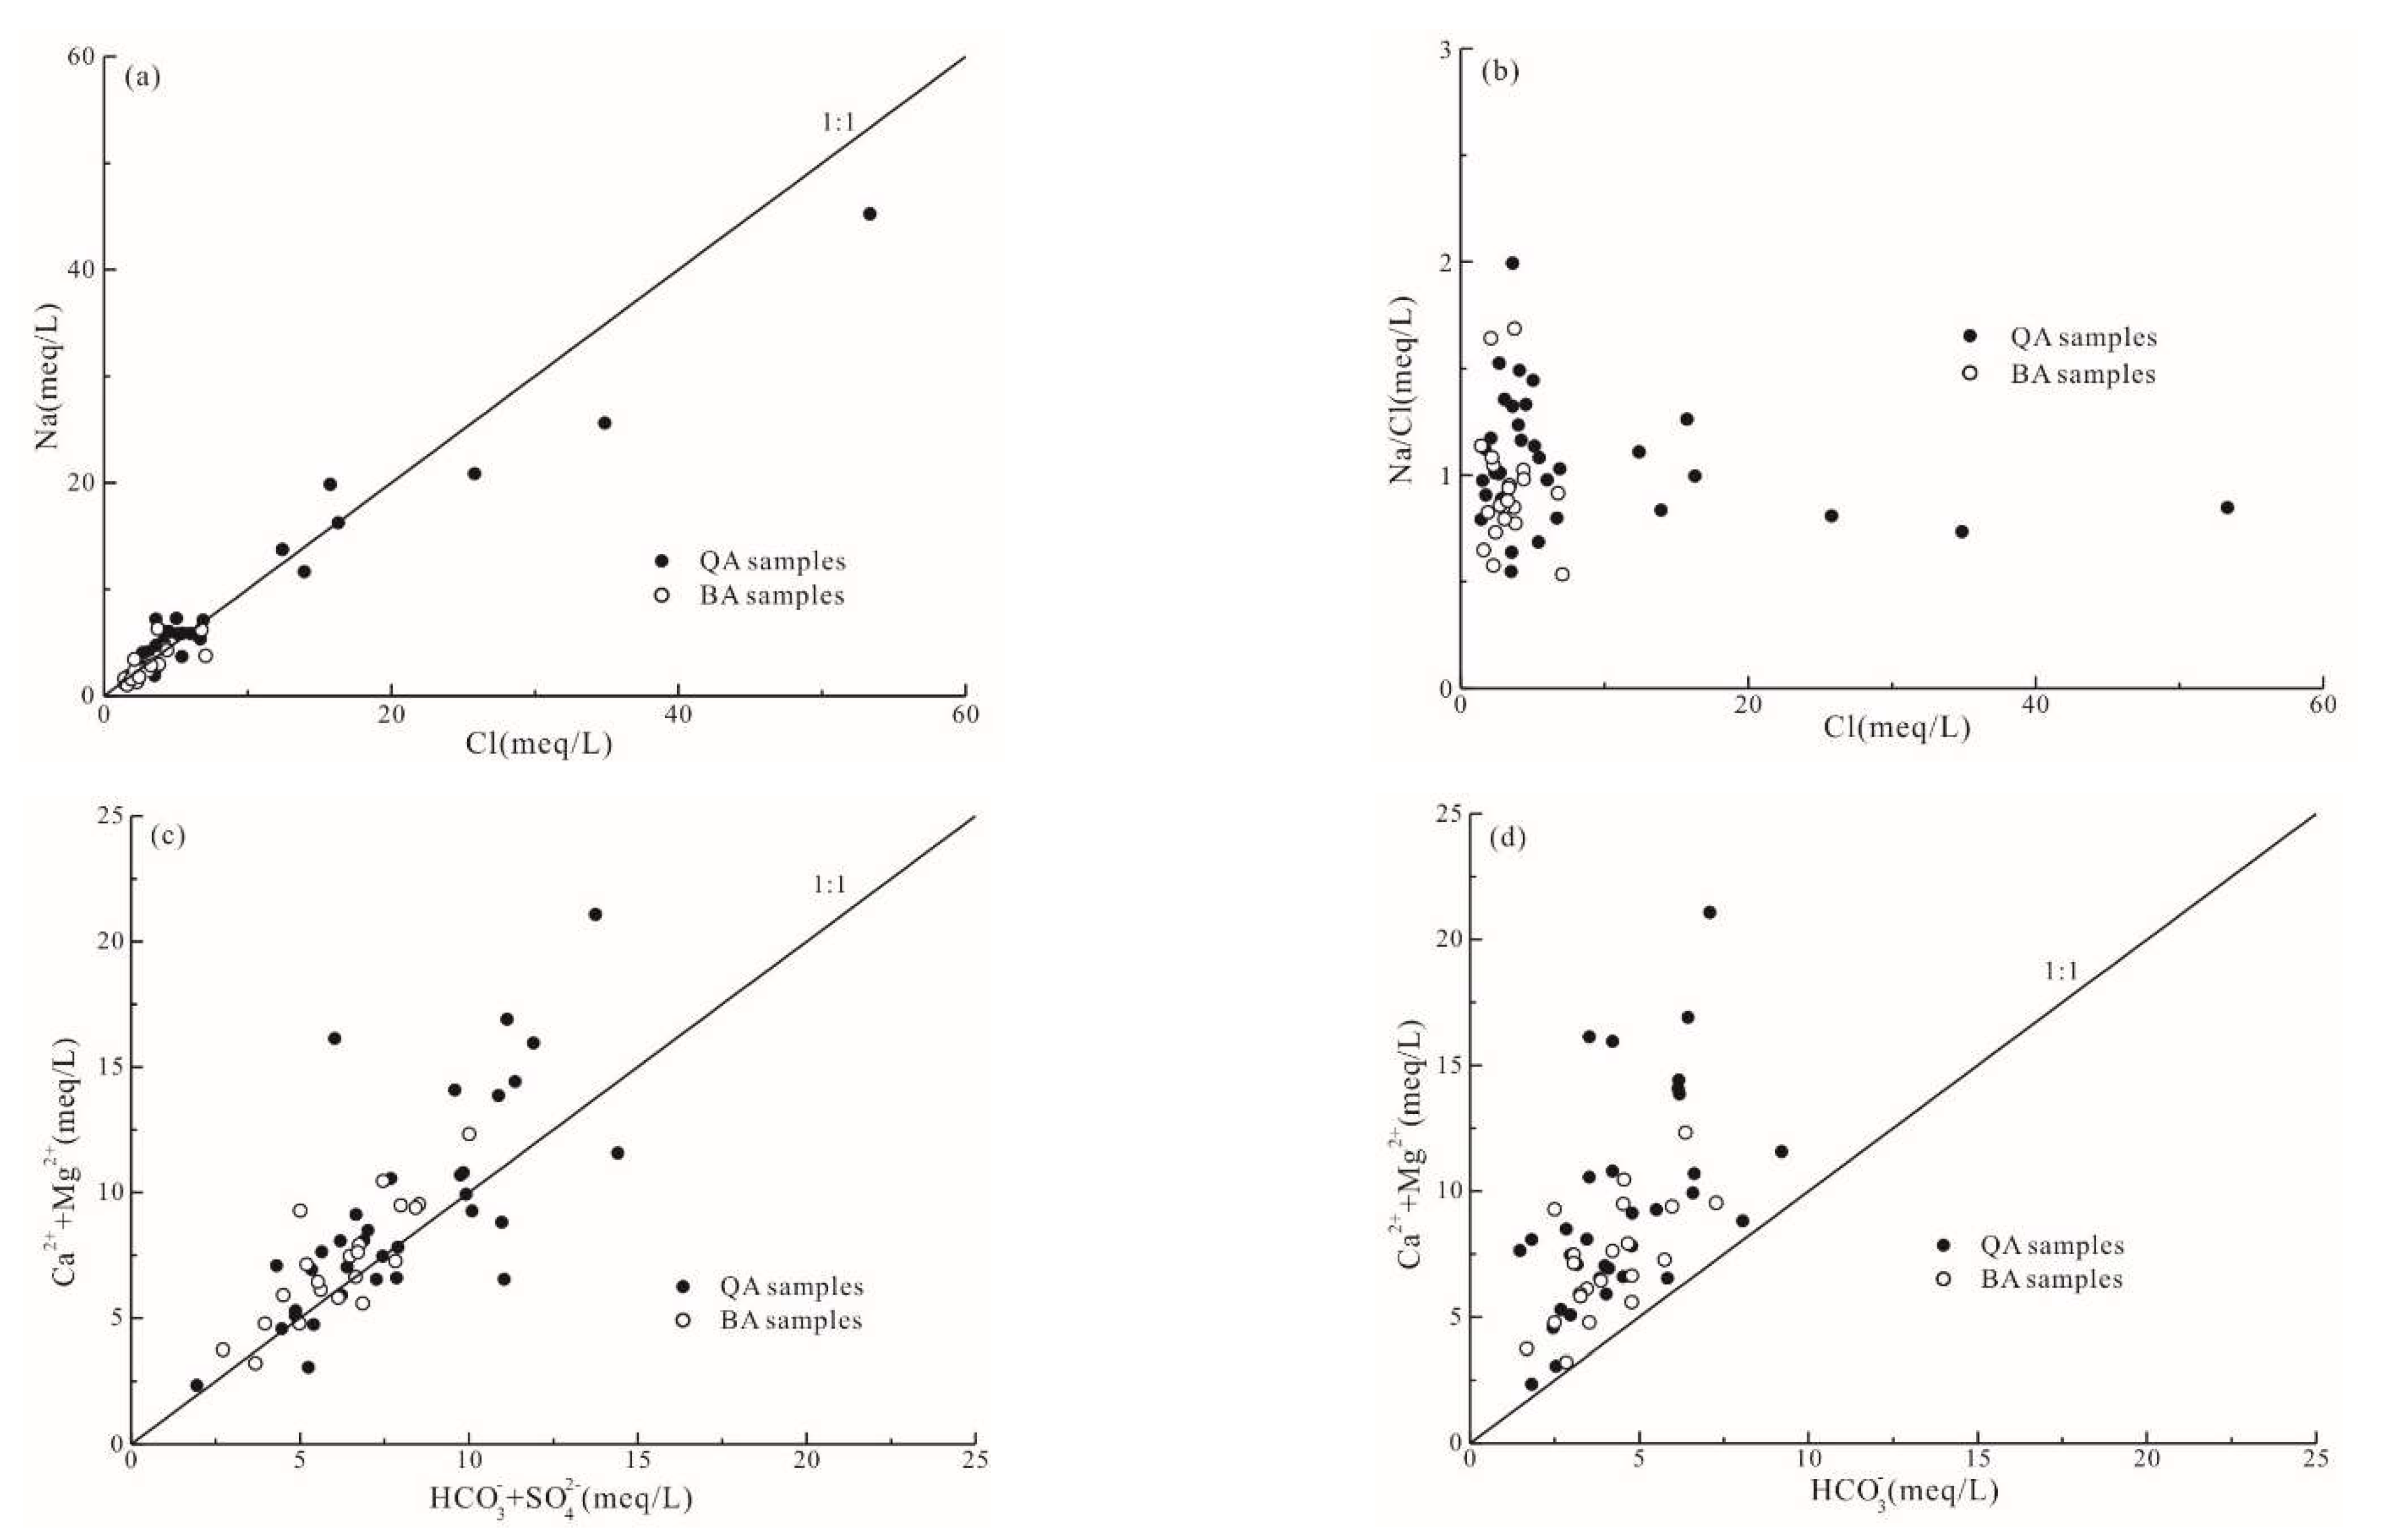
The results showed strong and good correlations between Cl and Na+ in the QA and BA, respectively, suggesting that these two ions are from the halite dissolution, as the value of the Na+/Cl was approximately 1:1 (Figure 4a) [5]. Indeed, the Na+/Cl ratio can assess the saline water mixing impact on the chemical characteristics of groundwater [8]. Moreover, this ratio was mainly less than 1 in the QA near the coastal area, indicating an effect of seawater intrusion on the coastal QA (Figure 4b) [1,37]. Meanwhile, ratio values higher than 1 suggest the influence of silicate weathering or cation exchange on the hydrochemical characteristic of groundwater [38].
On the other hand, HCO3 showed moderate positive correlations with Ca2+ and Mg2+ in both aquifers, while SO42− revealed a moderate to good positive correlation with Ca2+, suggesting carbonates and sulfate minerals dissolutions. According to the previous studies [9,39], the diagram of (Ca2+ + Mg2+)/(HCO3 +SO42−) can be selected to reveal the sources of the four ions (Ca2+, Mg2+, HCO3 and SO42−). Figure 4c showed that most of the samples were distributed near the 1:1 line, indicating that the water–rock interactions are the major source of these four major ions [40]. Meanwhile, the samples located above the 1:1 line suggested other sources of Mg2+ and Ca2+ (e.g., cation exchange and water–rock interactions) (Figure 4d) [19,39].
Overall, the correlation analysis revealed that groundwater chemical characteristics were mainly related to rock weathering and anthropogenic activities. In addition, the effect of saline water interactions contributed significantly to the increase in the hydrochemical parameters contents of the coastal QA, which is consistent with previous studies carried out in the same study area [15,18,41].

3.3. Hydrochemical Processes

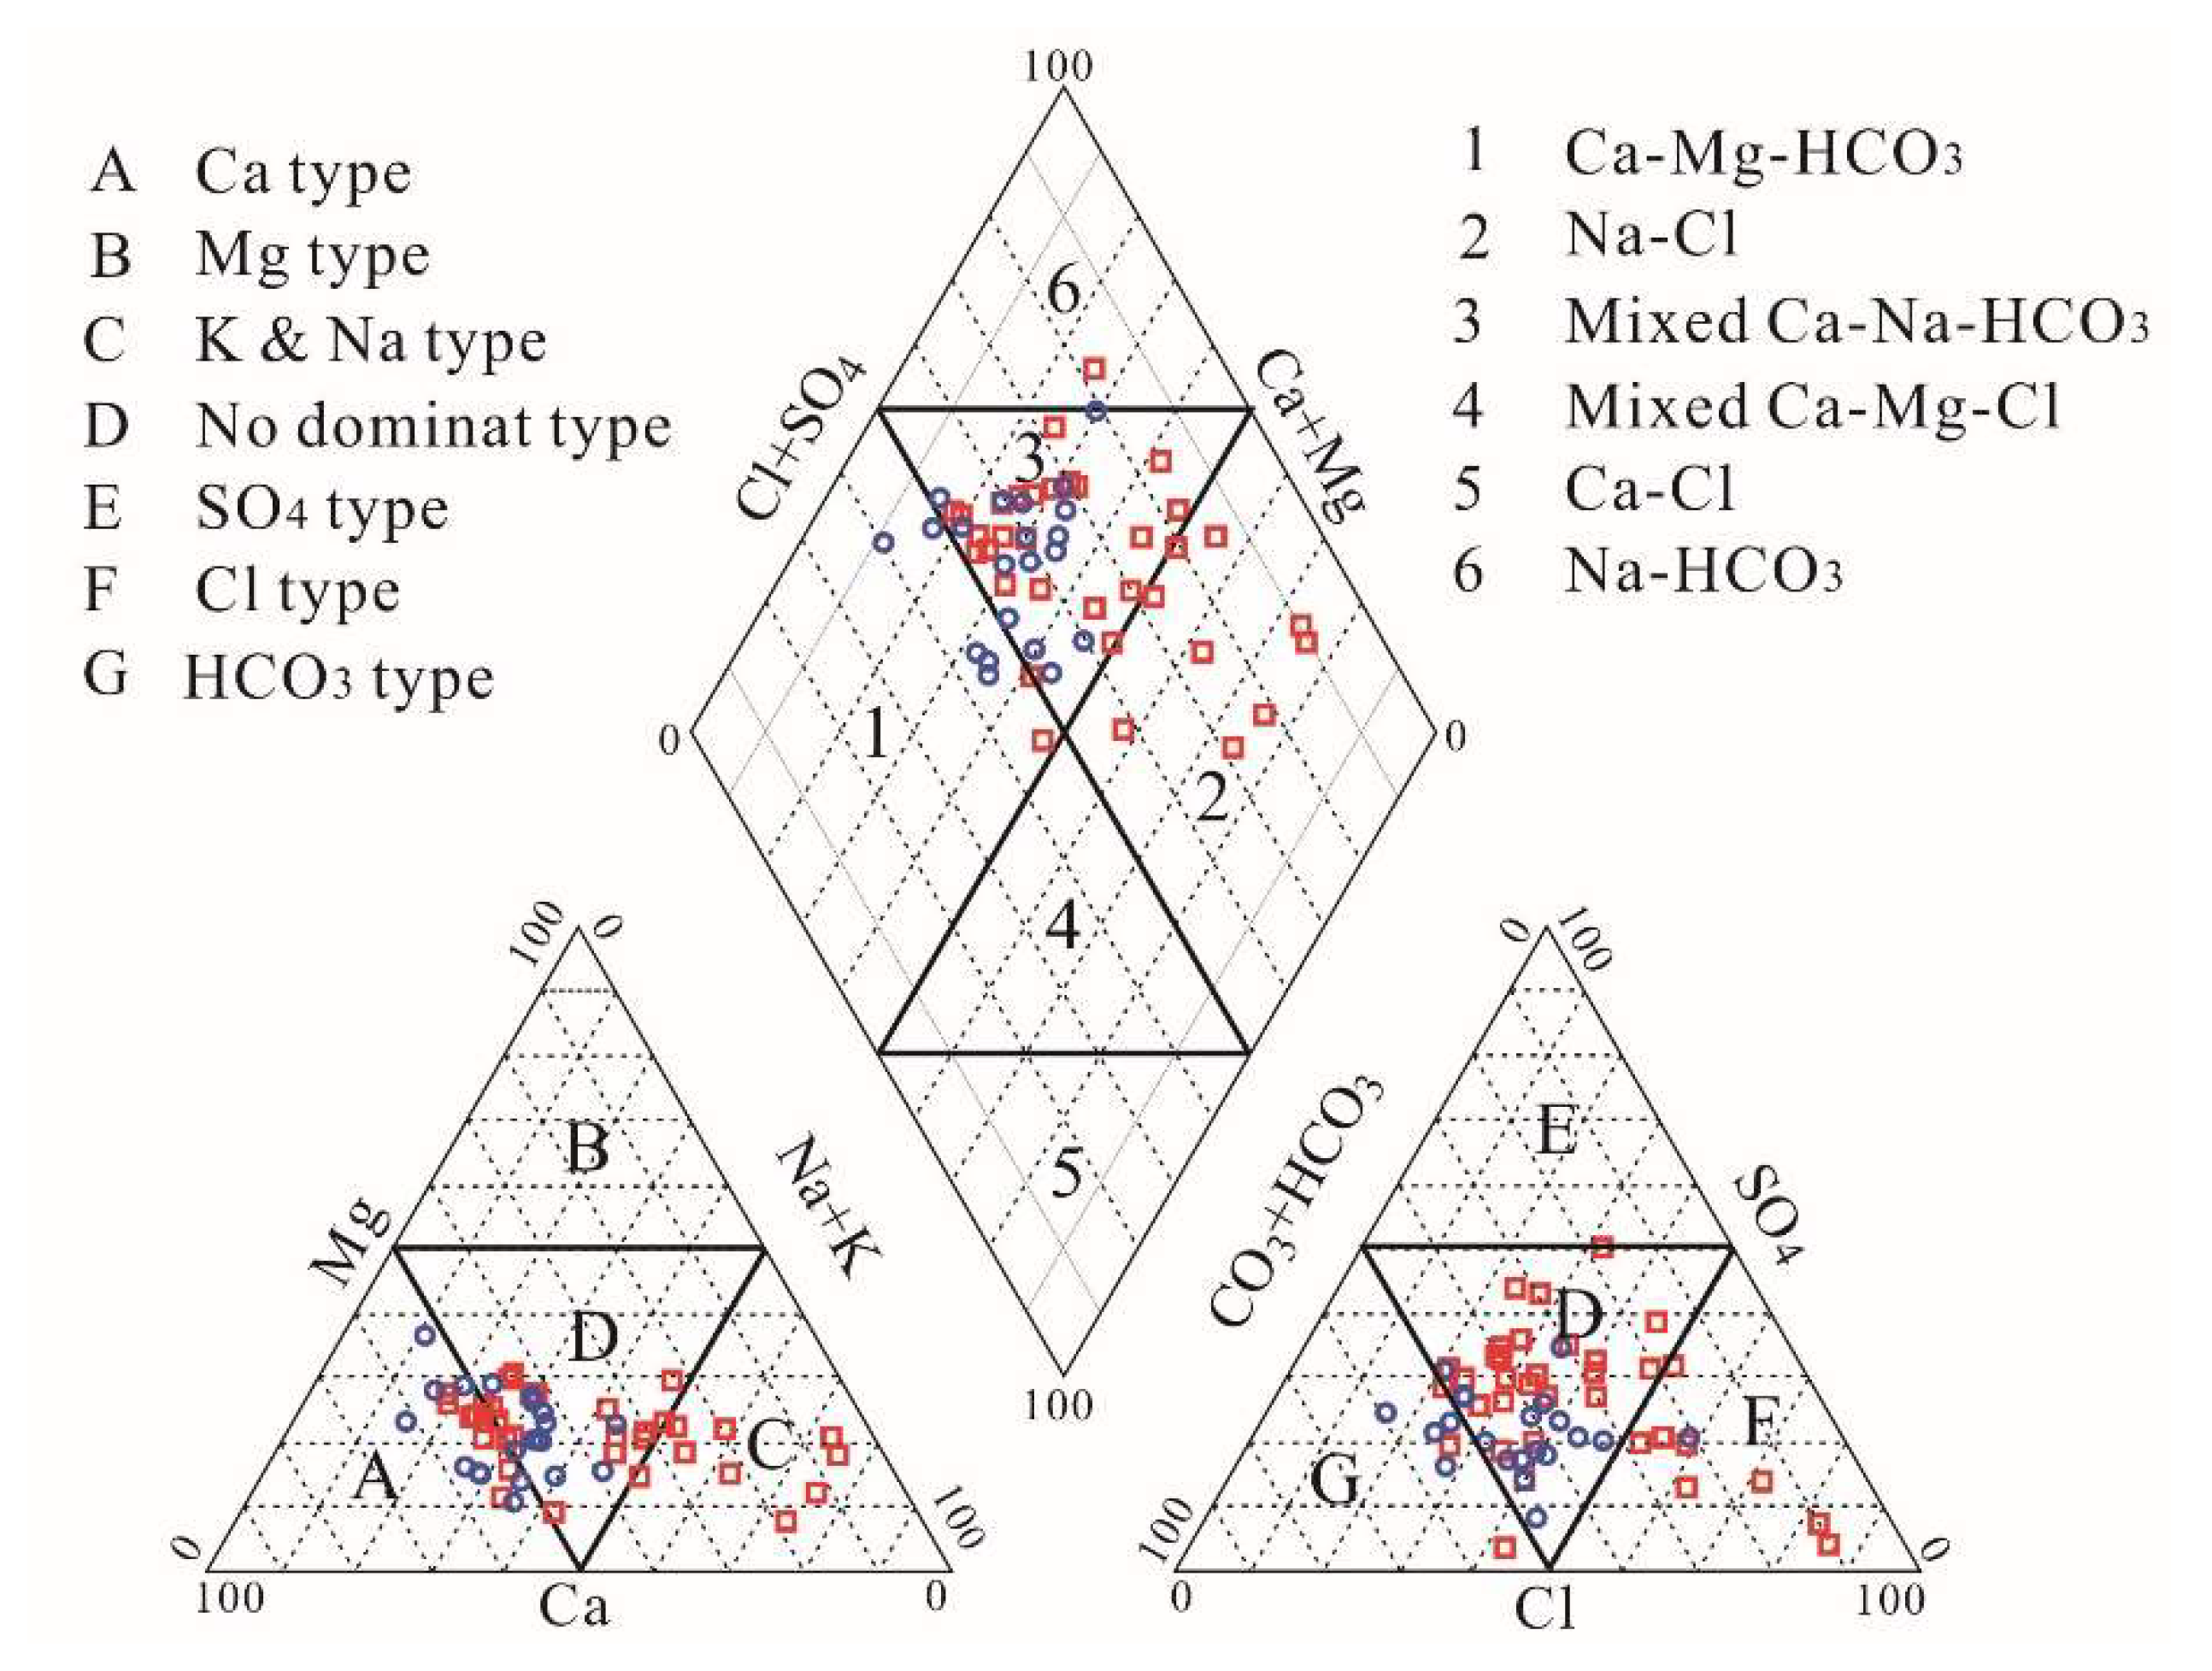
Piper diagrams can be used to determine the types and hydrochemistry evolution of groundwater [13]. The results showed slight differences in the distribution of the sampling points between the QA and BA (Figure 5). The cations in the QA belonged to the Ca, Na/K and no dominant facies, while those of the BA belonged to the Ca and no dominant facies. On the other hand, the anions in the QA mainly belonged to Cl and no dominant facies types, while those in the BA belonged to no dominant and HCO3 facies types.
In total, 73.214% of the collected groundwater samples (23 QA and 18 BA) were observed in zone 3, which represents the mixed Ca-Na-HCO3 facies type, whereas 9 QA samples, collected near the coastline, were plotted on zone 2 of the central diamond (Na-Cl facies type). The remaining four BA samples (18.182%) and one QA sample were observed in zone 1 (Ca-Mg-HCO3 facies type), while one QA sample was located in zone 6 (Na-HCO3 facies type).
The Gibbs diagram can determine some mechanisms that control hydrochemical processes of groundwater in some regions [13,29]. Gibbs diagrams (Figure 6) showed most QA samples were plotted on the rock dominant zone, while only a few samples were plotted on the evaporation dominant zone and outside the diagrams. The results of Gibbs diagrams revealed that the water–rock interaction controls the hydrochemical characteristics of the QA, followed by evaporation dominance and other factors, such as seawater intrusion [38]. The hydrochemical evolution of BA samples was related to the rock weathering, as shown in Figure 6a,b [8].

3.4. Principal Components Analysis

The PCA method is useful to gain a better understanding of the factors affecting the groundwater characteristics. PCs with eigenvalues higher than 1 were selected to reveal the groundwater chemistry [11,24]. The PCs were extracted using the varimax method [11], as shown in Table 2. The Kaiser–Meyer–Olkin values of the QA and BA were 0.593 and 0.544, respectively, indicating that the hydrochemical parameters of the samples were suitable for the PCA analysis [42]. In this study, the first three PCs were selected for both QA and BA. Based on the classification of the factor loading, only the parameters showing significant loading values above 0.5 were considered [5].
In the QA system, the first three PCs, with eigenvalues above 1, explained 77.918% of the cumulative variance of the hydrochemical parameters. Indeed, PC 1 explained the highest variance of 47.907% and revealed high positive loadings on Mg2+, TH, TDS, Cl, Na+, Ca2+ and SO42− of 0.925, 0.894, 0.869, 0.773, 0.753, 0.743 and 0.737, respectively, suggesting that PC 1 was related to the rock–water interactions and saline water mixing. PC 2 explained 17.381% of the total variance and showed high positive loadings on Ca2+ and SO42−, suggesting the impacts of gypsum dissolution and human activities on the hydrochemical characteristics of groundwater. PC 3 explained 12.630% of the total variance and showed pH and K+ had positive loadings of 0.683 and 0.696, respectively, revealing the industrial and domestic effects on the hydrochemical characteristics of groundwater.
Regarding the BA system, 77.840% of the total variance was explained by the first three PCs. PC 1 explained the highest variance of 48.206% and showed high positive loadings on TH, Ca2+, TDS, Mg2+, HCO3, SO42− and NO3 of 0.964, 0.930, 0.852, 0.791, 0.755, 0.728 and 0.701, respectively. This PC was related mainly to the rock–water interactions and anthropogenic activities that control the hydrochemical characteristics of groundwater. Meanwhile, PC 2 explained 17.217% of the total variance and indicated high loading values on Na+ and Cl, indicating the dissolution of gypsum. PC 3 explained 12.417% of the total variance and showed a strong positive loading on K+ of 0.816, suggesting that the K+ concentrations in groundwater were affected by human activities.

4. Conclusions

The hydrochemical characteristics and evolution of groundwater were assessed in this study using multivariate statistic combined with hydrochemical diagrams. A total of 56 samples were taken from the QA (34 samples) and BA (22 samples) over the November 2016–November 2017 period. Multivariate statistical techniques were used to analyze the chemical characteristics of groundwater and assess the relationships between variables by performing the PCA and Pearson correlation. In addition, hydrochemical plots, as well as Piper and Gibbs diagrams, were selected to analyze the controlling types and the hydrochemical processes of groundwater.
The groundwater samples, including QA and BA, are weak alkaline water. The major cation and anion concentrations observed in the QA system followed the order of Na+ > Ca2+ > Mg2+ > K+ and Cl > HCO3 > SO42− > NO3, respectively, whereas the major ions in the BA system followed the order of Ca2+ > Na+ > Mg2+ > K+ and HCO3 > Cl > SO42− > NO3. The high concentrations of some chemical ions and correlation results (e.g., NO3 and K+) indicated an increasing trend of anthropogenic impacts on the groundwater chemical parameters. In addition, the scatter diagrams demonstrated significant effects of water–rock interactions and intrusion of saline water on the groundwater quality in the study area. On the other hand, the Piper diagram showed that Ca-Na-HCO3 was the dominant facies type in the QA and BA systems. In addition, saline water facies type (Na-Cl) of the QA near the coastline was related to the seawater intrusion. The results of the Gibbs diagrams revealed that rock weathering was the major process controlling the hydrochemical characteristics of groundwater, followed by human activities. The PCA results further demonstrated that the rock–water interaction, saline water mixing and anthropogenic activities are the dominant factors affecting the hydrochemical characteristics of groundwater, suggesting relatively complex groundwater characteristics and evolution.
According to the results of this study, the groundwater in the QA is fresh to saline water, especially near the coastal line. In fact, the issue of saline water intrusion in the QA was found to be more severe than that observed in the BA. However, although the groundwater samples collected from the BA demonstrated freshwater resources, the long-term water–rock interaction may affect the quality of groundwater in the aquifer. Therefore, it is necessary to minimize the negative impacts of human activities and implement appropriate groundwater management policies.

Author Contributions

Conceptualization, D.L. and A.W.; methodology, A.W.; software, D.L. and R.W.; validation, Z.J. and Q.D.; formal analysis, Y.C.; investigation, Q.D.; resources, D.L.; writing—original draft preparation, A.W.; writing—review and editing, A.W. and Y.C.; visualization, R.W. and Z.J. All authors have read and agreed to the published version of the manuscript.

Funding

This research received no external funding.

Institutional Review Board Statement

Not applicable.

Informed Consent Statement

Not applicable.

Data Availability Statement

Data available on request from the corresponding author.

Acknowledgments

The authors are highly indebted to the data provider, the anonymous reviewers and the editors of the paper.

Conflicts of Interest

The authors declare no conflict of interest.

References

  1. Aminiyan, M.M.; Aminiyan, F.M. Comprehensive integrated index–based geochemistry and hydrochemical analyses of groundwater resources for multiple consumptions under coastal conditions. Environ. Sci. Pollut. Res. 2020, 27, 21386–21406. [Google Scholar] [CrossRef] [PubMed]
  2. Liu, S.; Tang, Z.; Gao, M.; Hou, G. Evolutionary process of saline-water intrusion in Holocene and Late Pleistocene groundwater in southern Laizhou Bay. Sci. Total Environ. 2017, 607, 586–599. [Google Scholar] [CrossRef]
  3. De Graaf, I.E.; Gleeson, T.; Sutanudjaja, E.H.; Bierkens, M.F. Environmental flow limits to global groundwater pumping. Nature 2019, 574, 90–94. [Google Scholar] [CrossRef] [PubMed]
  4. Wang, H.; Ni, J.; Song, Q.; Li, C.; Wang, F.; Cao, Y. Analysis of coastal groundwater hydrochemistry evolution based on groundwater flow system division. J. Hydrol. 2021, 601, 126631. [Google Scholar] [CrossRef]
  5. Yan, J.; Chen, J.; Zhang, W. Study on the groundwater quality and its influencing factor in Songyuan City, northeast China, using integrated hydrogeochemical method. Sci. Total Environ. 2021, 773, 144958. [Google Scholar] [CrossRef]
  6. Al-Barakah, F.N.; Al-jassas, A.M.; Aly, A.A. Water quality assessment and hydrochemical characterization of Zamzam groundwater, Saudi Arabia. Appl. Water Sci. 2017, 7, 3985–3996. [Google Scholar] [CrossRef] [Green Version]
  7. Ravikumar, P.; Somashekar, R.K. Principal component analysis and hydrochemical facies characterization to evaluate groundwater quality in Varahi river basin, Karnataka state, India. Appl. Water Sci. 2017, 7, 745–755. [Google Scholar] [CrossRef] [Green Version]
  8. Liu, J.; Gao, Z.; Zhang, Y.; Sun, Z.; Sun, T.; Fan, H.; Wu, B.; Li, M.; Qian, L. Hydrochemical evaluation of groundwater quality and human health risk assessment of nitrate in the largest peninsula of China based on high-density sampling: A case study of Weifang. J. Clean. Prod. 2021, 322, 129164. [Google Scholar] [CrossRef]
  9. Kenniche, S.; Bekkoussa, B.; M’nassri, S.; Teffahi, M.; Taupin, J.D.; Patris, N.; Zaagane, M.; Majdoub, R. Hydrochemical characterization, physicochemical and bacteriological quality of groundwater in Sidi Kada Mountains, northwest of Algeria. Arab. J. Geosci. 2022, 15, 1061. [Google Scholar] [CrossRef]
  10. Bastianoni, A.; Guastaldi, E.; Barbagli, A.; Bernardinetti, S.; Zirulia, A.; Brancale, M.; Colonna, T. Multivariate analysis applied to aquifer hydrogeochemical evaluation: A case study in the coastal significant subterranean water body between “Cecina River and San Vincenzo”, Tuscany (Italy). Appl. Sci. 2021, 11, 7595. [Google Scholar] [CrossRef]
  11. Marghade, D.; Malpe, D.B.; Subba Rao, N. Applications of geochemical and multivariate statistical approaches for the evaluation of groundwater quality and human health risks in a semi-arid region of eastern Maharashtra, India. Environ. Geochem. Health 2021, 43, 683–703. [Google Scholar] [CrossRef] [PubMed]
  12. Kim, J.H.; Kim, K.H.; Thao, N.T.; Batsaikhan, B.; Yun, S.T. Hydrochemical assessment of freshening saline groundwater using multiple end-members mixing modeling: A study of Red River delta aquifer, Vietnam. J. Hydrol. 2017, 549, 703–714. [Google Scholar] [CrossRef]
  13. Perera, T.A.N.T.; Herath, H.M.M.S.D.; Piyadasa, R.U.K.; Jianhui, L.; Bing, L. Spatial and physicochemical assessment of groundwater quality in the urban coastal region of Sri Lanka. Environ. Sci. Pollut. Res. 2022, 29, 16250–16264. [Google Scholar] [CrossRef]
  14. Wen, X.; Lu, J.; Wu, J.; Lin, Y.; Luo, Y. Influence of coastal groundwater salinization on the distribution and risks of heavy metals. Sci. Total Environ. 2019, 652, 267–277. [Google Scholar] [CrossRef]
  15. Zhu, H.; Zhou, J.; Song, T.; Feng, H.; Liu, Z.; Liu, H.; Ren, X. Influences of natural and anthropogenic processes on the groundwater quality in the Dagujia River Basin in Yantai, China. J. Water Supply Res. Technol. 2020, 69, 184–196. [Google Scholar] [CrossRef]
  16. Hou, X.; Ying, L.; Chang, Y.; Qian, S.S.; Zhang, Y. Modeling of non-point source nitrogen pollution from 1979 to 2008 in Jiaodong Peninsula, China. Hydrol. Process. 2014, 28, 3264–3275. [Google Scholar] [CrossRef]
  17. Gao, Z.; Han, C.; Xu, Y.; Zhao, Z.; Luo, Z.; Liu, J. Assessment of the water quality of groundwater in Bohai Rim and the controlling factors—a case study of northern Shandong Peninsula, north China. Environ. Pollut. 2021, 285, 117482. [Google Scholar] [CrossRef]
  18. Chen, G.; Xiong, G.; Lin, J.; Xu, X.; Yu, H.; Liu, W.; Fu, T.; Su, Q.; Wang, Y.; Dai, Y.; et al. Elucidating the pollution sources and groundwater evolution in typical seawater intrusion areas using hydrochemical and environmental stable isotope technique: A case study for Shandong Province, China. Lithosphere 2021, 2021, 4227303. [Google Scholar] [CrossRef]
  19. Chen, R.; Liu, L.; Li, Y.; Zhai, Y.; Chen, H.; Hu, B.; Zhang, Q.; Teng, Y. Characteristics of hydro-geochemistry and groundwater pollution in Songnen Plain in northeastern China. Sustainability 2022, 14, 6527. [Google Scholar] [CrossRef]
  20. Shukla, S.; Saxena, A.; Khan, R.; Li, P. Spatial analysis of groundwater quality and human health risk assessment in parts of Raebareli district, India. Environ. Earth Sci. 2021, 80, 800. [Google Scholar] [CrossRef]
  21. Aravinthasamy, P.; Karunanidhi, D.; Subramani, T.; Roy, P.D. Demarcation of groundwater quality domains using GIS for best agricultural practices in the drought-prone Shanmuganadhi River basin of South India. Environ. Sci. Pollut. Res. 2021, 28, 18423–18435. [Google Scholar] [CrossRef] [PubMed]
  22. Wali, S.U.; Alias, N.; Harun, S.B. Reevaluating the hydrochemistry of groundwater in basement complex aquifers of Kaduna Basin, NW Nigeria using multivariate statistical analysis. Environ. Earth Sci. 2021, 80, 208. [Google Scholar] [CrossRef]
  23. Şehnaz, Ş.; Şener, E.; Davraz, A.; Varol, S. Hydrogeological and hydrochemical investigation in the Burdur Saline Lake Basin, southwest Turkey. Geochemistry 2020, 80, 125592. [Google Scholar] [CrossRef]
  24. Panneerselvam, B.; Paramasivam, S.K.; Karuppannan, S.; Ravichandran, N.; Selvaraj, P.A. GIS-based evaluation of hydrochemical characterisation of groundwater in hard rock region, South Tamil Nadu, India. Arab. J. Geosci. 2020, 13, 837. [Google Scholar] [CrossRef]
  25. Yidana, S.; Banoeng-Yakubo, B.; Sakyi, P.A. Identifying key processes in the hydrochemistry of a basin through the combined use of factor and regression models. J. Earth Syst. Sci. 2012, 121, 491–507. [Google Scholar] [CrossRef] [Green Version]
  26. Atikul Islam, M.; Zahid, A.; Rahman, M.; Islam, M.J.; Akter, Y.; Shammi, M.; Bodrud-Doza, M.; Roy, B. Investigation of groundwater quality and its suitability for drinking and agricultural use in the south central part of the coastal region in Bangladesh. Expos. Health 2017, 9, 27–41. [Google Scholar] [CrossRef]
  27. Singh, V.B.; Ramanathan, A.L.; Sharma, P.; Pottakkal, J.G. Dissolved ion chemistry and suspended sediment characteristics of meltwater draining from Chhota Shigri Glacier, western Himalaya, India. Arab. J. Geosci. 2015, 8, 281–293. [Google Scholar] [CrossRef]
  28. Tiwari, A.K.; Pisciotta, A.; De Maio, M. Evaluation of groundwater salinization and pollution level on Favignana Island, Italy. Environ. Pollut. 2019, 249, 969–981. [Google Scholar] [CrossRef]
  29. Gibbs, R.J. Mechanisms controlling world water chemistry. Science 1970, 170, 1088–1090. [Google Scholar] [CrossRef]
  30. Raja, P.; Krishnaraj, S.; Selvaraj, G.; Kumar, S.; Francis, V. Hydrogeochemical investigations to assess groundwater and saline water interaction in coastal aquifers of the southeast coast, Tamil Nadu, India. Environ. Sci. Pollut. Res. 2021, 28, 5495–5519. [Google Scholar] [CrossRef]
  31. Rosen, M.; Jones, S. Controls on the chemical composition of groundwater from alluvial aquifers in the Wanaka and Wakatipu basins, Central Otago, New Zealand. Hydrogeol. J. 1998, 6, 264–281. [Google Scholar]
  32. Ruiz-Pico, Á.; Pérez-Cuenca, Á.; Serrano-Agila, R.; Maza-Criollo, D.; Leiva-Piedra, J.; Salazar-Campos, J. Hydrochemical characterization of groundwater in the Loja Basin (Ecuador). Appl. Geochem. 2019, 104, 1–9. [Google Scholar] [CrossRef]
  33. Ma, F.; Wei, A.; Deng, Q.; Zhao, H. Hydrochemical characteristics and the suitability of groundwater in the coastal region of Tangshan, China. J. Earth Sci. 2014, 25, 1067–1075. [Google Scholar] [CrossRef]
  34. Simsek, C.; Elci, A.; Gunduz, O.; Erdogan, B. Hydrogeological and hydrogeochemical characterization of a karstic mountain region. Environ. Geol. 2008, 54, 291–308. [Google Scholar] [CrossRef]
  35. Romshoo, S.A.; Dar, R.A.; Murtaza, K.O.; Rashid, I.; Dar, F.A. Hydrochemical characterization and pollution assessment of groundwater in Jammu Siwaliks, India. Environ. Monit. Assess. 2017, 189, 122. [Google Scholar] [CrossRef] [PubMed]
  36. Kim, C.S.; Raza, M.; Lee, J.Y.; Kim, H.; Jeon, C.; Kim, B.; Kim, J.W.; Kim, R.H. Factors controlling the spatial distribution and temporal trend of nationwide groundwater quality in Korea. Sustainability 2020, 12, 9971. [Google Scholar] [CrossRef]
  37. Thimonier, A.; Schmitt, M.; Waldner, P.; Schleppi, P. Seasonality of the Na/Cl ratio in precipitation and implications of canopy leaching in validating chemical analyses of throughfall samples. Atmos. Environ. 2008, 42, 9106–9117. [Google Scholar] [CrossRef]
  38. Gaury, P.K.; Meena, N.K.; Mahajan, A.K. Hydrochemistry and water quality of Rewalsar Lake of Lesser Himalaya, Himachal Pradesh, India. Environ. Monit. Assess. 2018, 190, 84. [Google Scholar] [CrossRef]
  39. Prusty, P.; Farooq, S.H.; Swain, D.; Chandrasekharam, D. Association of geomorphic features with groundwater quality and freshwater availability in coastal regions. Int. J. Environ. Sci. Technol. 2020, 17, 3313–3328. [Google Scholar] [CrossRef]
  40. Sharma, A.; Singh, A.K.; Kumar, K. Environmental geochemistry and quality assessment of surface and subsurface water of Mahi River Basin, western India. Environ. Earth Sci. 2012, 65, 1231–1250. [Google Scholar] [CrossRef]
  41. Zhou, M.; Wu, M.; Zhang, G.; Zhao, L.; Hou, X.; Yang, Y. Analysis of coastal zone data of northern Yantai collected by remote sensing from 1990 to 2018. Appl. Sci. 2019, 9, 4466. [Google Scholar] [CrossRef] [Green Version]
  42. Kumari, P.; Gupta, N.C.; Kaur, A.; Singh, K. Application of principal component analysis and correlation for assessing groundwater contamination in and around municipal solid waste landfill of Ghazipur, Delhi. J. Geol. Soc. India 2019, 94, 595–604. [Google Scholar] [CrossRef]
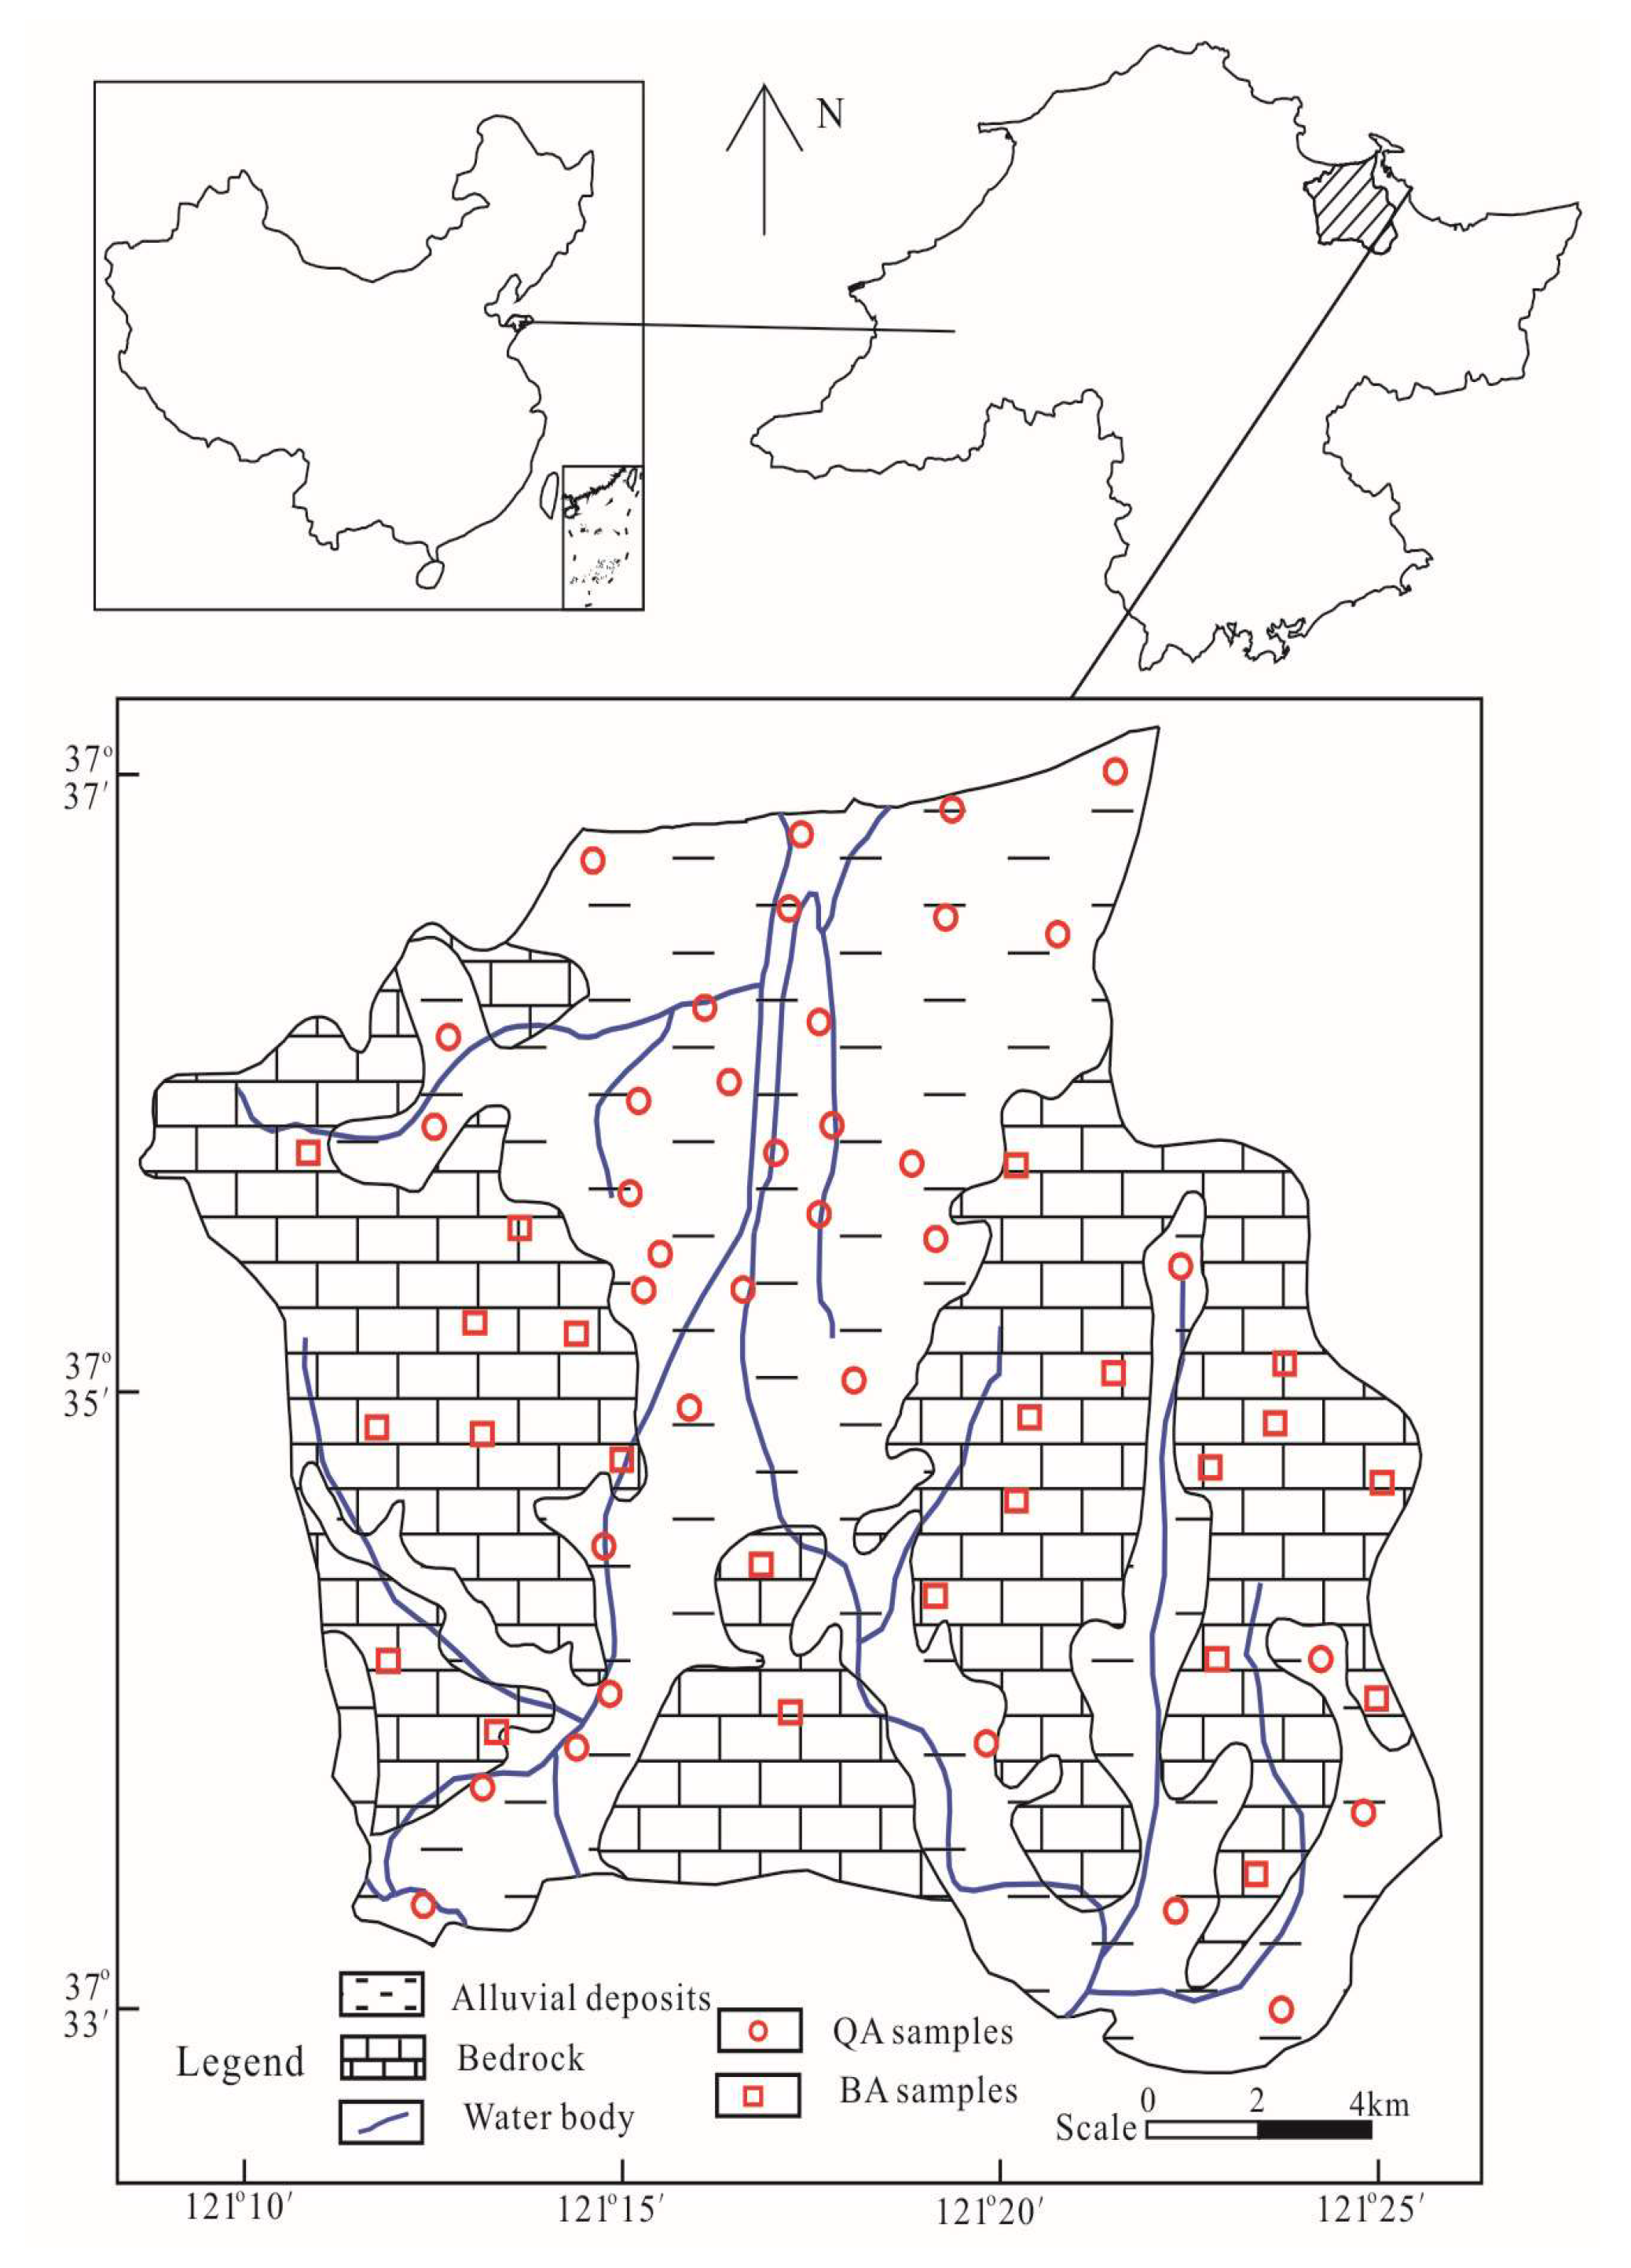
Figure 1. Geographic formation of aquifers.
Sustainability 14 08358 g001
Figure 2. Spatial distribution of the major hydrochemical parameters of groundwater samples: (a) TDS; (b) TH; (c) Ca2+; (d) Mg2+; (e) Na+; (f) K+; (g) SO42−; (h) Cl; (i) HCO3; (j) NO3.
Sustainability 14 08358 g002
Figure 3. Correlation between major hydrochemical parameters of groundwater in the QA (a) and BA (b).
Sustainability 14 08358 g003
Figure 4. Bivariate plots of Na+/Cl (a), Na+ + Cl/Cl (b), (Ca2+ + Mg2+)/(HCO3 + SO42−) (c) and (Ca2+ + Mg2+)/HCO3 (d).
Sustainability 14 08358 g004
Figure 5. Piper diagram of groundwater systems in the Dagujia river basin.
Sustainability 14 08358 g005
Figure 6. Gibbs diagram of groundwater systems in the Dagujia river basin.
Sustainability 14 08358 g006
Table 1. Descriptive statistics of hydrochemical parameters.
ParameterQA Samples (n = 34)BA Samples (n = 22)
MinMaxMeanSDMinMaxMeanSD
pH7.178.427.790.346.968.257.560.34
K+ (mg/L)0.1473.8012.4116.480.1273.906.7115.90
Na+ (mg/L)26.141040.60177.29205.5423.87144.6064.4832.22
Ca2+ (mg/L)37.23250.29109.2852.8647.70157.88100.4134.21
Mg2+ (mg/L)4.73157.5841.8629.298.2753.1928.6911.07
HCO3 (mg/L)90.15561.14263.81115.06101.90443.81250.5789.86
Cl (mg/L)50.171866.31279.23377.4650.17247.50115.0950.83
SO42− (mg/L)6.00370.00169.0676.9040.00175.00102.0039.25
NO3 (mg/L)2.00400.0076.72194.102.00180.0068.7554.81
TDS (mg/L)210.273624.421093.63700.21293.44945.24625.66188.51
TH (mg/L)116.811048.52445.25210.89160.61613.23368.86117.18
Table 2. PCA results for the QA and BA systems.
ParameterQA Samples (n = 34)BA Samples (n = 22)
PC 1PC 2PC 3PC 1PC 2PC 3
pH−0.123−0.0450.6830.319−0.481−0.482
K+0.342−0.4210.6960.0980.3210.816
Na+0.753−0.478−0.2660.5000.709−0.243
Ca2+0.7430.566−0.0630.930−0.030−0.151
Mg2+0.9250.0380.1160.791−0.3370.394
Cl0.773−0.421−0.3610.4530.734−0.258
SO42−0.7370.2220.1600.728−0.4140.154
HCO30.638−0.2230.3980.7550.0810.275
NO30.2120.8430.1080.701−0.272−0.244
TDS0.869−0.212−0.1580.8520.359−0.061
TH0.8940.3870.0090.964−0.1520.045
Eigenvalues5.2701.9121.3895.3031.8941.366
Variability (%)47.90717.38112.63048.20617.21712.417
Cumulative (%)47.90765.28877.91848.20665.42377.840
Publisher’s Note: MDPI stays neutral with regard to jurisdictional claims in published maps and institutional affiliations.