Article

Optimization of a Water-Saving and Fertilizer-Saving Model for Enhancing Xinjiang Korla Fragrant Pear Yield, Quality, and Net Profits under Water and Fertilizer Coupling

1
College of Water Conservancy & Architectural Engineering, Shihezi University, Shihezi 823003, China
2
Key Laboratory of Modern Water-Saving Irrigation of Xinjiang Production & Construction Group, Shihezi 823003, China
3
Normal College, Shihezi University, Shihezi 823003, China
*
Authors to whom correspondence should be addressed.
Sustainability 2022, 14(14), 8495; https://doi.org/10.3390/su14148495
Submission received: 29 March 2022 / Revised: 21 June 2022 / Accepted: 1 July 2022 / Published: 11 July 2022

Abstract

:
To develop an optimal irrigation and fertilization system for Korla fragrant pear in the Xinjiang region, the effects of water and fertilizer coupling on the quality, yield, irrigation water use efficiency (IWUE), fertilizer partial productivity (PFP), and net profits of Korla fragrant pear under the condition of limited water drip irrigation were studied through field experiments by combining multiple regression analysis and spatial analysis. A comprehensive quality evaluation model of fragrant pear was constructed using the principal component analysis, and 12 quality indices were evaluated comprehensively. The experiment adopted a two-factor crossover design with three irrigation levels (W1: 5250 m3 ha−1, W2: 6750 m3 ha−1, W3: 8250 m3 ha−1), accounting for 60%, 80% and 100% of the ETe (where ETe denotes evapotranspiration under sufficient water supply for crops); four fertilizer application levels (F1: 675 kg ha−1, F2: 750 kg ha−1, F3: 825 kg ha−1, F4: 900 kg ha−1), designated F80%, F90%, F100%, and F110%, respectively; and 12 treatments. The results showed that the overall quality of fragrant pear was improved based on the integrated quality of pear. Four principal components were extracted through the fragrant pear comprehensive quality evaluation model, and their cumulative contribution was 89.977%; the best comprehensive quality was obtained in the W3F2 treatment and the worst comprehensive quality in the W1F1 treatment. The spatial analysis showed that when the irrigation range is 7484–8250 m3 ha−1 and the N-P2O5-K2O fertilization range is (181-223-300)–(200-246-332) kg ha−1, the comprehensive quality, yield, IWUE, PFP, and net profits of fragrant pear can reach > 85% of the maximum value. These results provide a scientific basis for water and fertilizer management of fragrant pear orchard with drip irrigation in Korla, Xinjiang.

1. Introduction

The fruit industry is one of the key industries in Xinjiang [1]. The Xinjiang Korla fragrant pear is a kind of specialty fruit of the region; it is a national geographical standard product of China and is known as “the prince of fruits” because of its thin skin and fine flesh, rich fragrance, and nutrition [2]. In 2021, the planting area of fragrant pears in Korla City, Xinjiang, China, was nearly 3.1 × 10³ ha, of which the resulting area was 2.51 × 10³ ha, with a total output of 4.03 × 10⁴ t, bringing more than 2.5 billion CNY (CNY = Chinese yuan) in economic income to local pear farmers and related enterprises, and becoming a pillar industry for the economic development of the region [3]. The Korla area in Xinjiang, China, has suitable soil, moisture, and climatic conditions for the growth of Korla fragrant pear. At present, the irrigation method for Korla fragrant pear is mainly based on large water irrigation systems, and the irrigation capacity is more than 12,000 m3 ha−1. Although the water consumption far exceeds the requirement of total water consumption based on the indication of “three red lines”, the IWUE is low, and there is severe waste of water resources [4]. In the actual production, fruit farmers blindly pursue high yield of pear fruits, and several fertilization processes are used to obtain a high yield. Consequently, the fertilizer utilization efficiency is low, and the addition of a large number of fertilizers results in excess content of nutrients through soil solidification. This makes it difficult for the pear tree root system to absorb the nutrients, which directly affects the yield and quality of fragrant pear. Moreover, the arbitrary application of fertilizers to enhance fruit growth has resulted in an increase in nutrient poverty, fruits with rough skin, and fruits with irregularly shaped tops, which greatly weaken the competitiveness of fragrant pear in the international market. This has restricted the sustainable development of local agriculture [5,6].
Drip irrigation is one of the most important approaches of water-saving irrigation, and by using a water–fertilizer integrated irrigation system, water-saving, yield increase, and labor-saving can be achieved; moreover, this approach can reduce environmental and fruit pollution and improve economic development of fruit farmers [7,8]. Previous studies have shown that the coupling effect of water and fertilizer can significantly improve the yield of fragrant pear; when 32% of water is saved, increasing the application of fertilizers is not beneficial to increase yield [9]. Compared to the traditional model, the average yield and PFP of honeydew increased with 30% weight loss during the fertilizer chasing period [10]. Li et al. [11] found that the use of drip irrigation for fertilization not only improves single fruit weight, soluble solids, and vitamin C of pears, but also saves irrigation water, which is only 30% of traditional irrigation. Liu et al. [12] showed that increasing the lower limit of irrigation and increasing the amount of nitrogen applied increased the weight per fruit and reduced the titratable acid content of pears. Zhou et al. [13] showed that increasing fertilizer application was beneficial to increase the content of vitamin C, soluble solids, and soluble sugars, while increasing irrigation water decreased the titratable acid content and increased the sugar-to-acid ratio. The effect of irrigation and fertilizer application on IWUE and PFP was reported to be significant. Chen et al. showed that cotton producers would benefit from using deficit irrigation in terms of improving IWUE. PFP was decreased with nitrogen application and was relatively less affected by irrigation water [14]. In the crop water–fertilizer coupling system, the natural resource, economic, and ecological subsystems are interrelated. Among these subsystems, IWUE is a key index to measure the degree of irrigation water use in the irrigation area from the introduction of water to its actual use in the field [15], while PFP is an important index of the comprehensive effect of fertilizer application and reflects the nutrient level of the local soil base [16]. The economic benefits of fragrant pear orchard are also closely related to the personal interests of fruit farmers. The same water–fertilizer coupling benefits are obtained in terms of economic efficiency, with appropriate water and fertilizer inputs to obtain maximum net profits [17]. The evaluation of any crop production system should be based on a comprehensive analysis of indicators such as yield, quality, water and fertilizer use efficiency, and economic efficiency. Although several studies on these aspects have been conducted, as mentioned above, there are few studies that have investigated the effect of integration of the two main factors, namely water and fertilizer, on fragrant pear quality, yield, water and fertilizer use efficiency, and net profits [18].
In terms of optimal water fertilization solution, many scholars have used multiple regression analysis to derive the optimal water fertilization approach by using a set of equations with water fertilization as the independent variable and the single-factor index as the dependent variable. Among these scholars, Chen et al. [19] used a binary regression analysis with yield as the dependent variable to derive the optimal water and fertilizer treatment by solving the extreme value of the equation. Wang et al. [20] used principal component analysis to comprehensively evaluate the quality of tomatoes and derived the optimal water and fertilizer combination with a higher yield and water use efficiency, without significantly reducing the quality and net profit of tomatoes by simple comparison between treatments. Cao et al. [21] studied the optimal water and fertilizer treatment by computer modeling and considered index factors such as grape yield, IWUE, and PFP. The limitation of these methods is that when there are many evaluation indicators, the extreme values are often difficult to solve due to the mutual inhibition between the indicators [22]. However, the application of spatial analysis to evaluate individual indicators can solve this problem [23]. In the present study, we constructed a comprehensive quality evaluation model of fragrant pear based on principal component analysis and used multiple regression analysis and spatial analysis to conduct a multi-objective analysis on fragrant pear quality, yield, water and fertilizer utilization efficiency, and net profits. The overall the aim of the study was to determine a high-quality, high-efficiency, and high-yield ideal water and fertilizer management system and to provide a scientific basis for the determination of an optimum irrigation and fertilization system for fragrant pear in the Korla region.

2. Materials and Methods

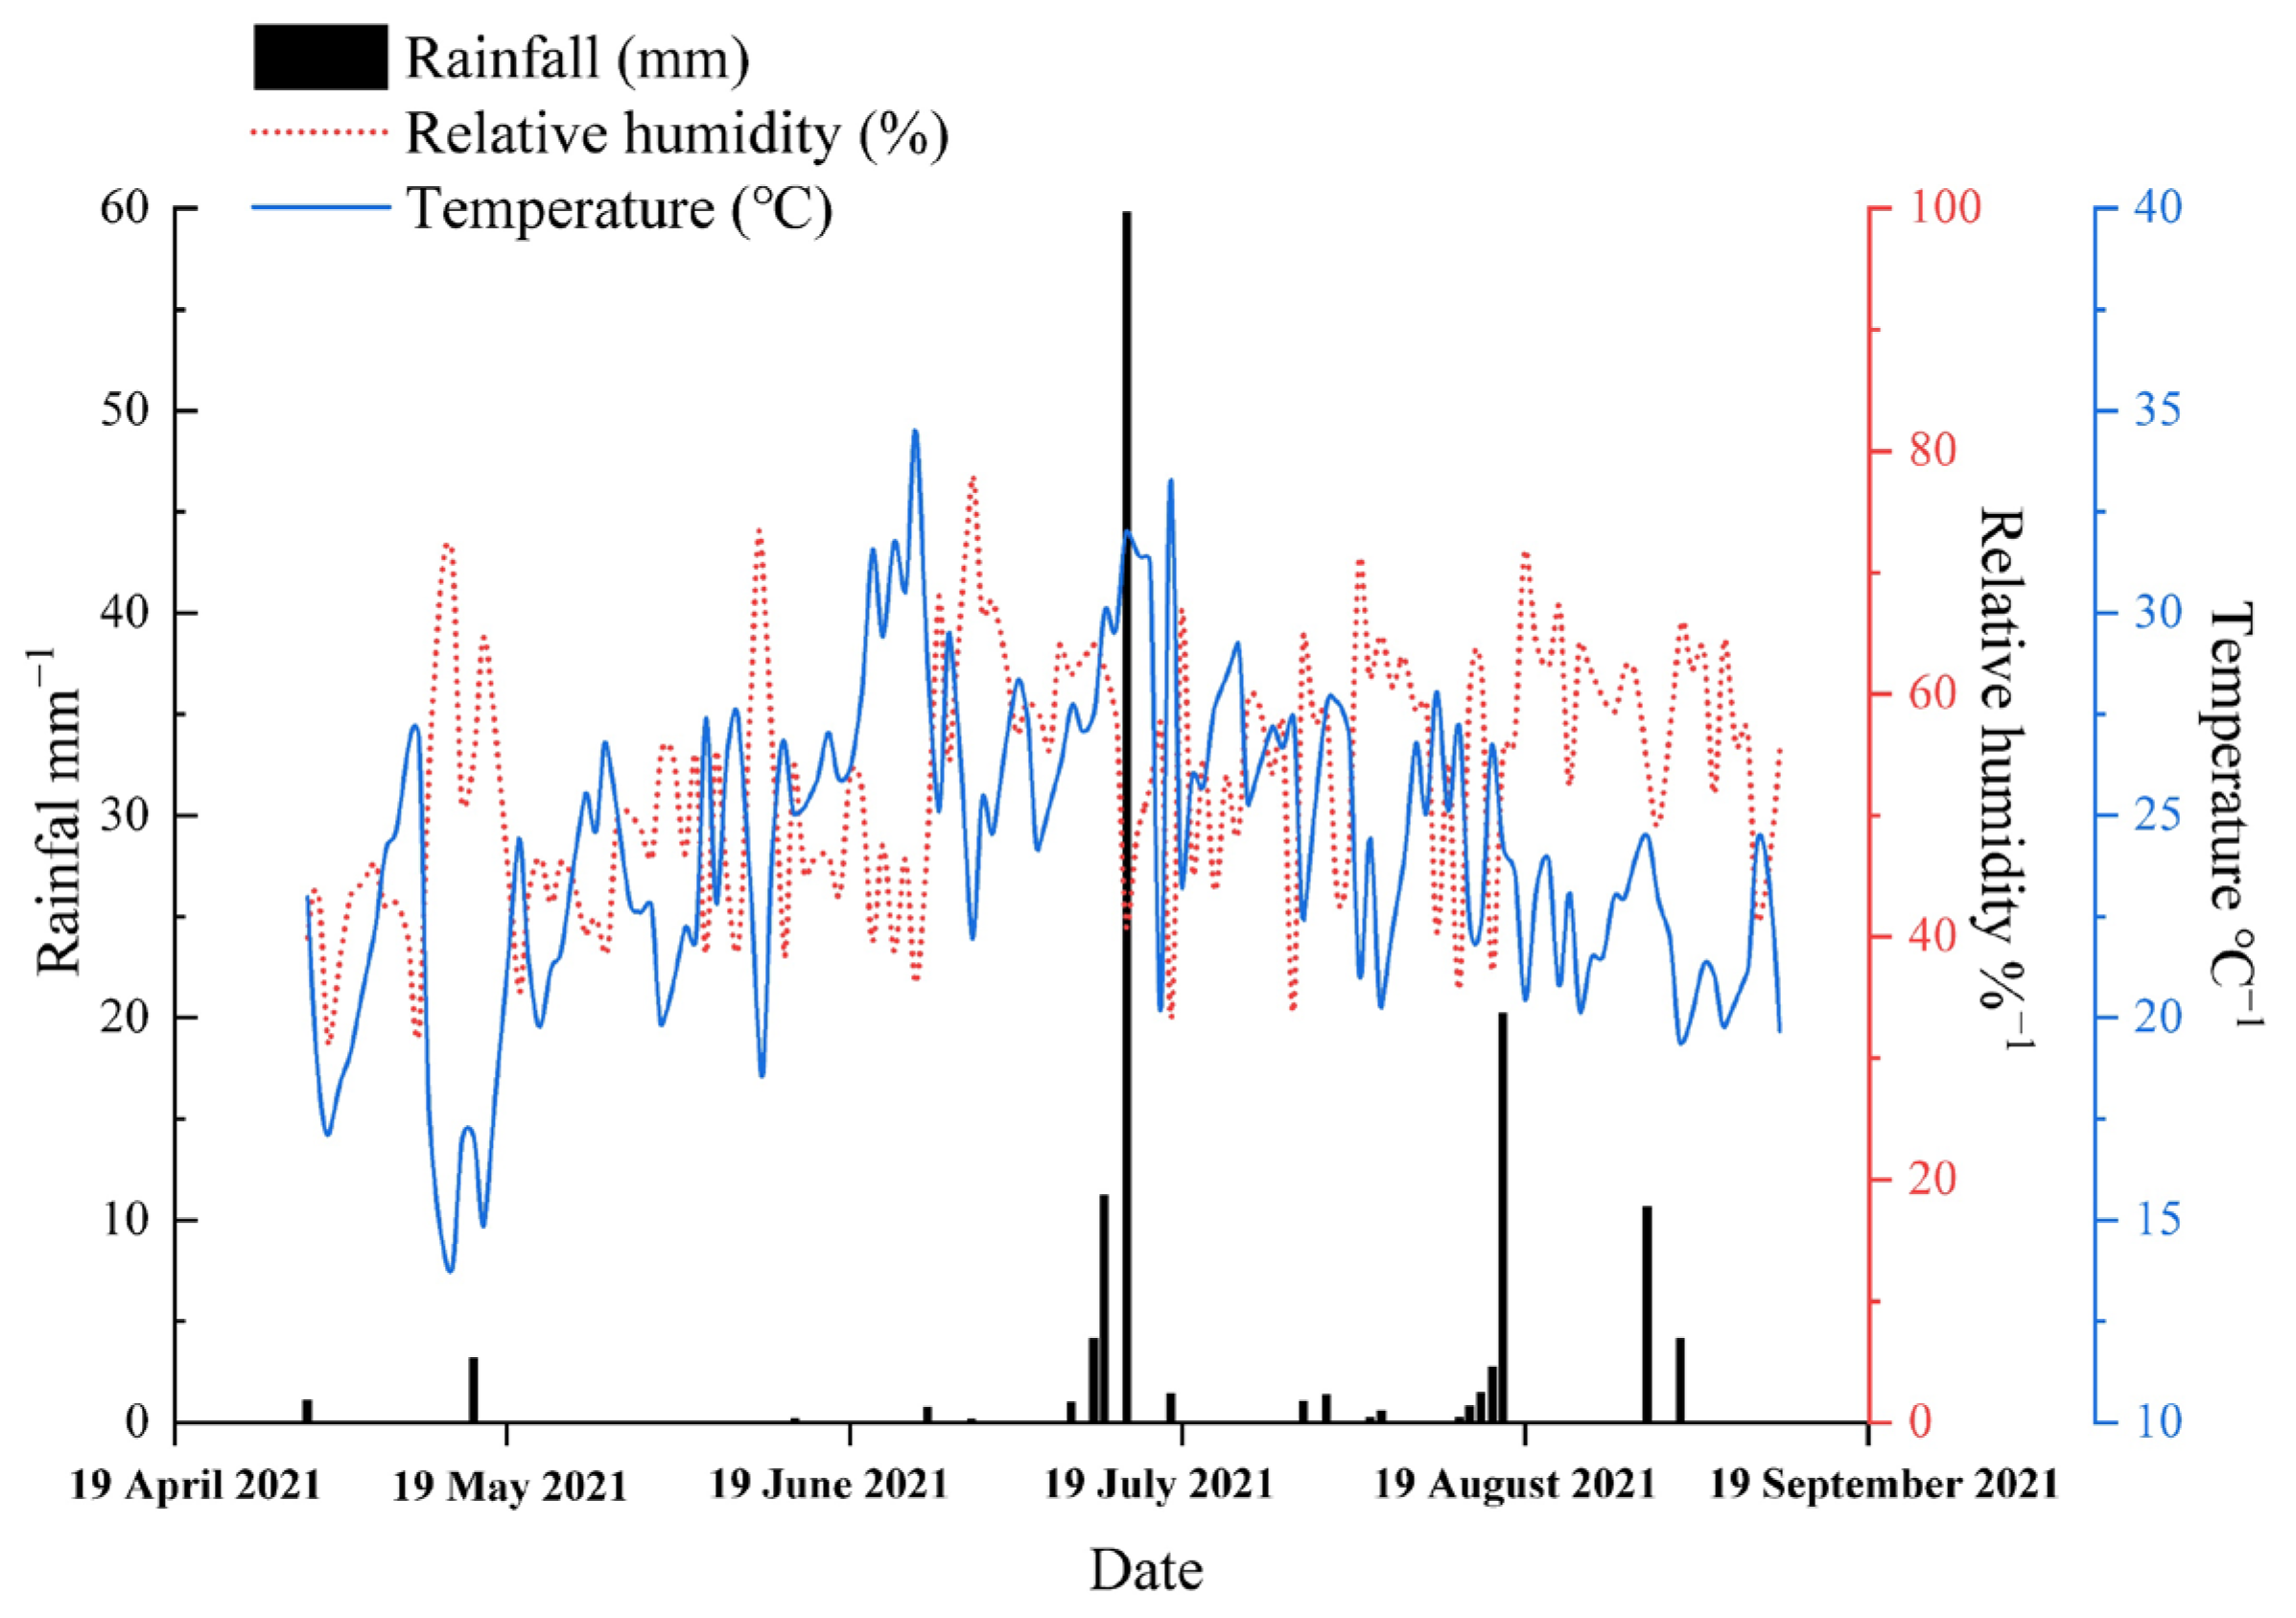
2.1. Overview of the Study Area

The study area is located in the 10th company of the 29th regiment of the 2nd division of Xinjiang Production and Construction Corps (85°88′87″ N, 41°79′50″ E, altitude 909 m), 15 km from the city of Korla, with a typical temperate continental arid desert climate. The region had an average annual rainfall of 364.305 mm, annual evaporation of 2788.2 mm, and total sunshine of 2990 h in 2020–2021. The frost-free period is 210 days, the wetness is 0.16, the average annual temperature is 15 °C, the extreme low temperature is −23 °C, the average wind speed is 10.1 km h−1, and the buried depth of groundwater is approximately 3 m. Irrigation agriculture is the main method of crop production in this area. The main physical properties of the 0–100 cm tillage soil layer in the experimental area are shown in Table 1. The soil fertility of 0–100 cm in the test area is shown in Table 2. The soil moisture detector ET100 was used to monitor soil moisture in real time (one sensor per 10 cm, a total of 100 cm). A Tianqi intelligent ecological station was installed at the experiment station to monitor the meteorological elements electronically, as shown in Figure 1.

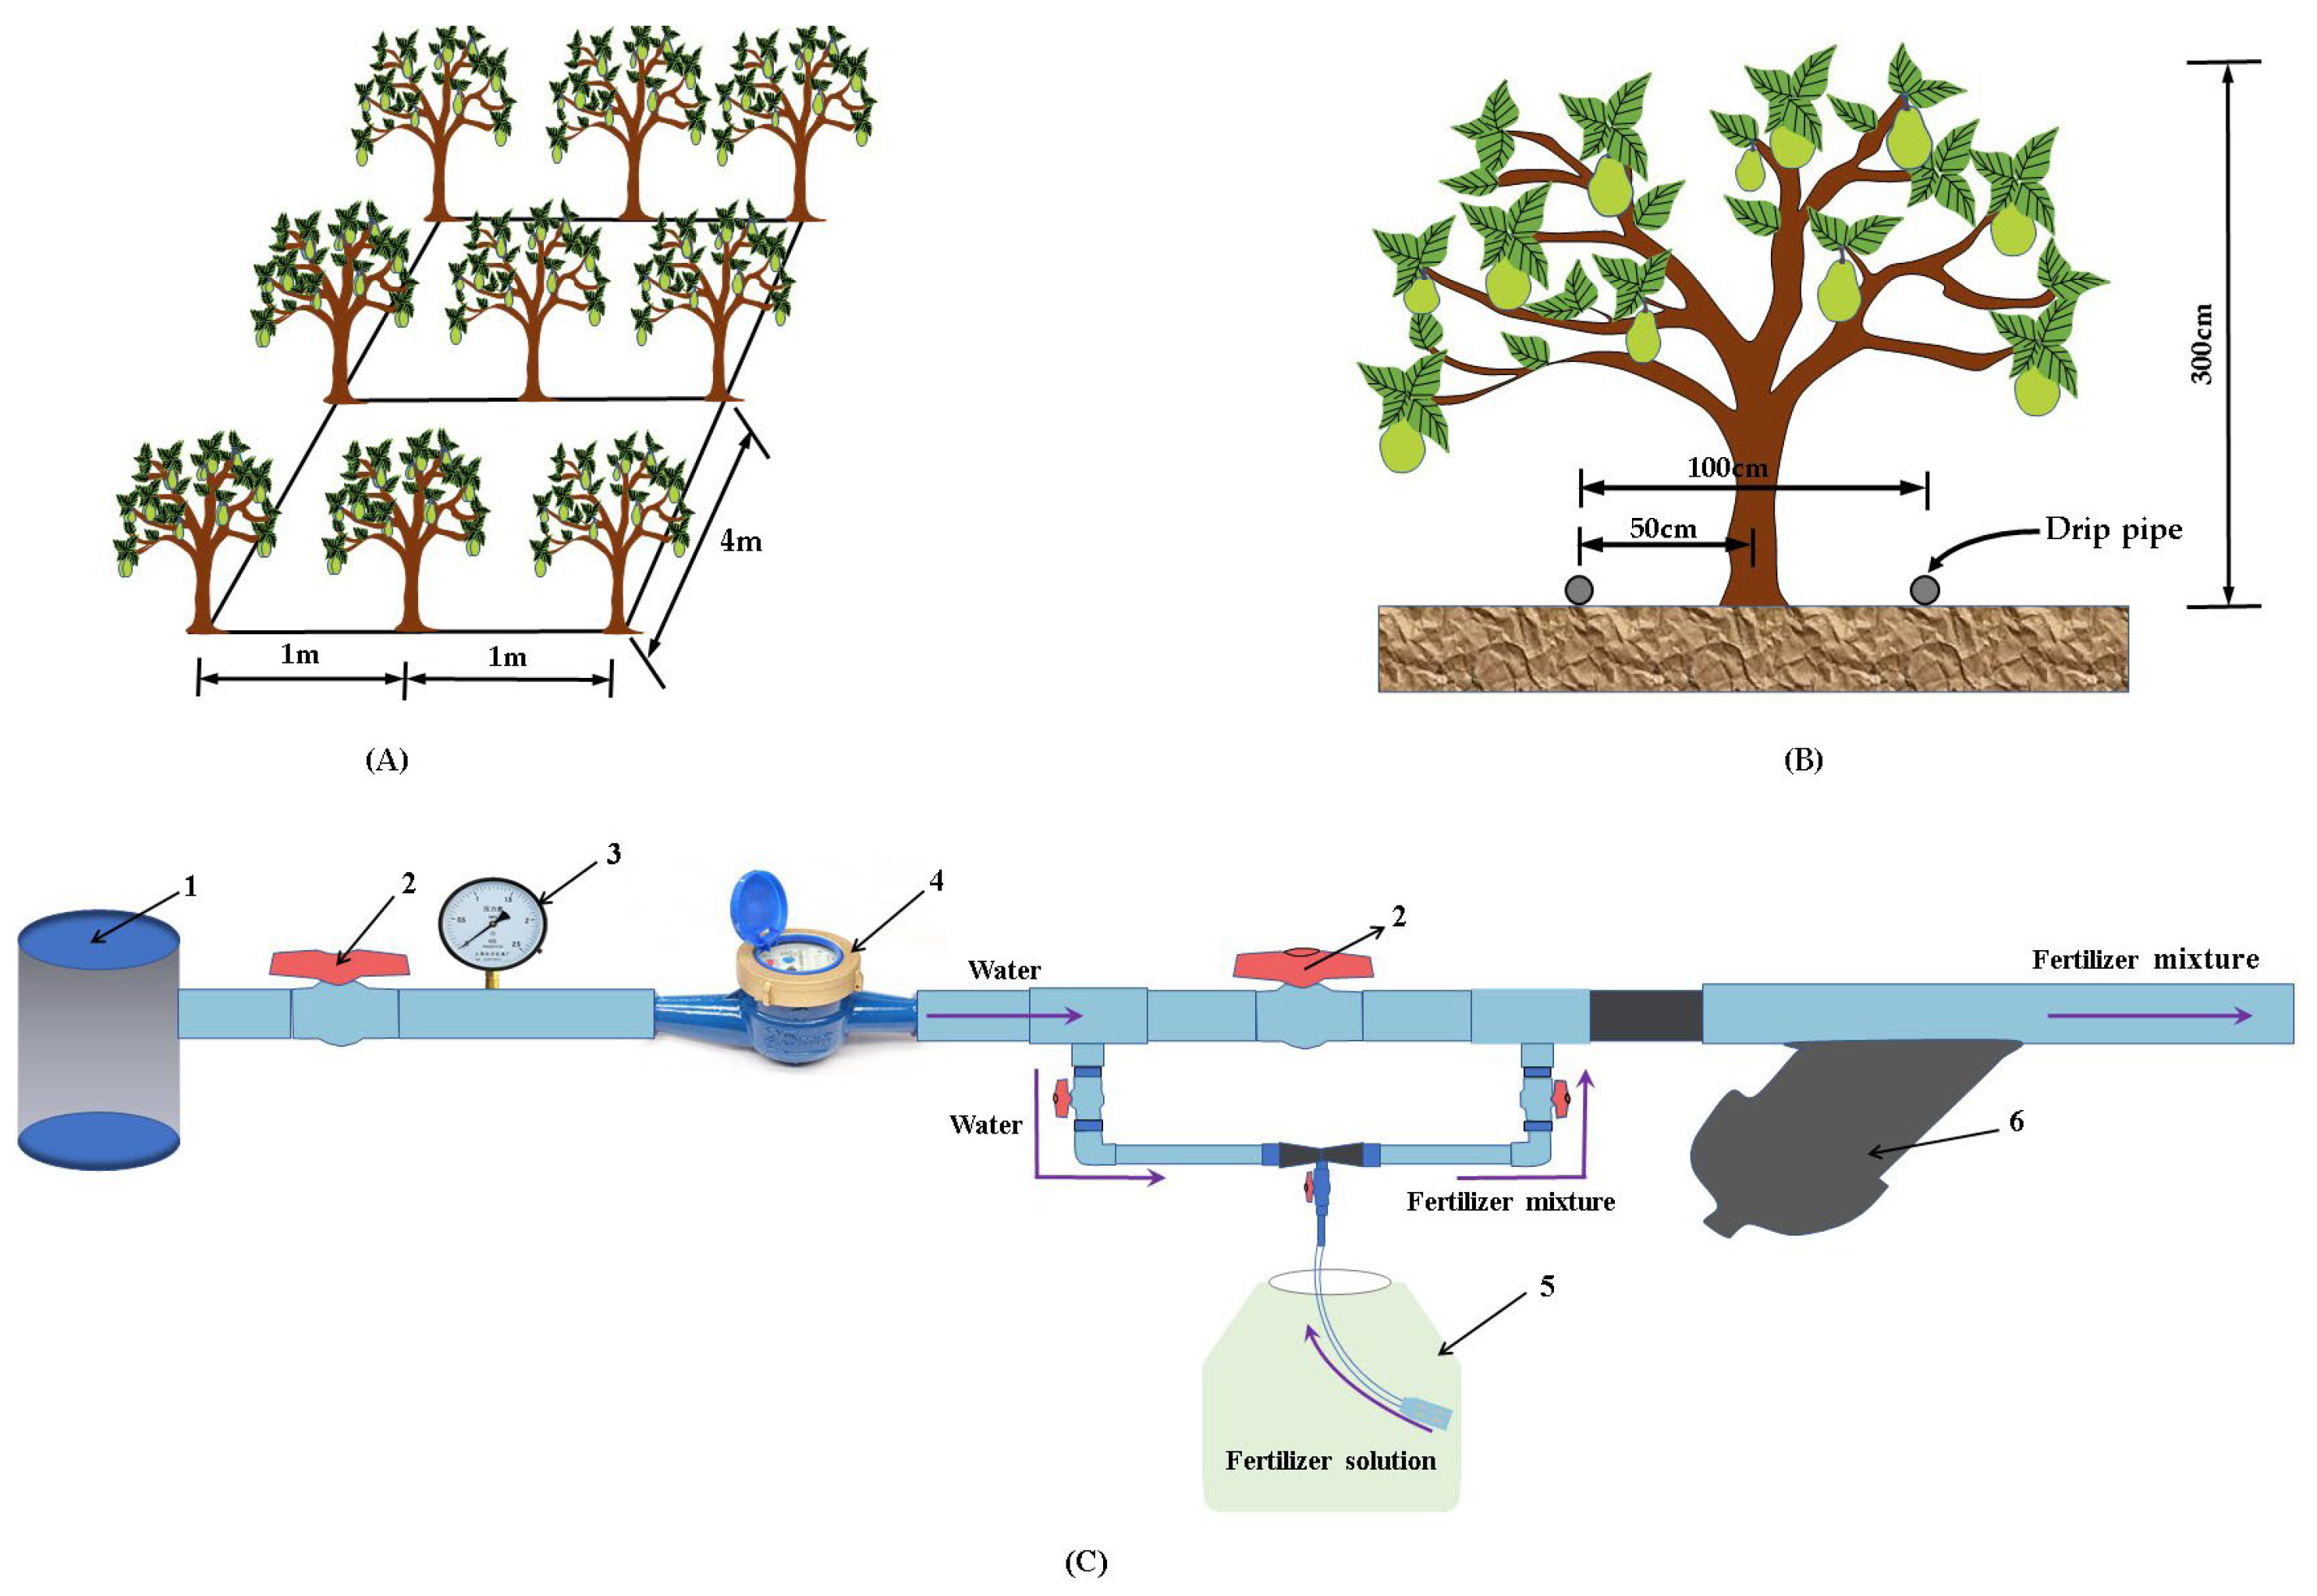
2.2. Experimental Design

The experiment was a two-factor completely randomized trial with three irrigation gradients: 5250 m3 ha−1 (W1), 6750 m3 ha−1 (W2), and 8250 m3 ha−1 (W3), according to the basic requirements of “three red lines” of water resource management [24]. By referring to Liu et al. [9], four fertilization gradients were set: 675 kg ha−1 (F1), 750 kg ha−1 (F2), 825 kg ha−1 (F3), and 900 kg ha−1 (F4). A total of 12 treatments were investigated. The water–fertilizer combination of each gradient was repeated three times, with a total of 36 plots, as shown in Figure 2.
The test fragrant pear variety was 5a fragrant pear (Pyrus bretschneideri Rehd) planted in the north–south direction. The planting pattern was 4 m row spacing, with 1 m plant spacing. The area of fragrant pear orchard was 0.82 ha, 170 m × 48 m (length × width), and the planting density was 2.5 × 10³ plants ha−1. The plot irrigation method used surface drip irrigation, with two irrigation drip pipes for one row of fruit trees and a pressure compensated drip head. The irrigation system consisted of a water outlet stake, a pressure gauge, a water meter, a ball valve, a filter, a venturi fertilizer irrigation system, a capillary pipe, and a drip head, and the working pressure was 1.5 MP. The materials of the irrigation system were provided by Xinjiang Tianye Co., Ltd., Shihezi, China and are shown in Figure 3.
Considering that the fragrant pear needs different water and fertilizer treatments in different growth periods, together with the water requirements of Korla fragrant pear and the irrigation practices followed by local farmers, irrigation was performed when the soil moisture content dropped to 60% of the local soil field water holding capacity. The approach of frequent and small amount of irrigation and fertilizer application was adopted, with 11 times of irrigation and 5 times of fertilizer chasing during the entire reproductive period (see Table 3). As shown in Figure 1, the rainfall on 14 July was 58.04 mm, which was equivalent to the rainfall of the test area in previous years, and was included in the irrigation amount on 16 July because of rainfall conversion. The test was conducted with a water-soluble fertilizer 1 (N-P2O5-K2O: 5-10-35) and a water-soluble fertilizer 2 (potassium sulfate type) (N-P2O5-K2O: 10-30-10) manufactured by Qifeng Menong Biotechnology Co. Ltd., Shaanxi, China. Fertilizers 1 and 2 were mixed in a ratio of 2:5 to form a water-soluble compound fertilizer (N-P2O5-K2O: 1:1.23:1.66). The fertilizer solution was applied to each experimental plot through the venturi application irrigation system. All treatments were applied with a base fertilizer near the shade-facing roots of fragrant pear trees at the pre-bloom stage, with a mixture of sheep manure organic fertilizer (N: 2.01%, P2Q5: 0.50%, K2O: 1.32%, 3750 kg ha−1) and fungal fertilizer (effective number of live bacteria ≥ 1 × 10¹⁰ g−1, N + P2Q5 + K2O ≥ 15%, 900 kg ha1) at a depth of 30 cm and a width of 25 cm.

2.3. Testing Indices and Methods

2.3.1. Single Fruit Weight and Yield

In the ripening period of fragrant pear, three fragrant pear trees were randomly selected from each treatment from the southeast to northwest in five directions. By using an electronic balance, the weight of each fragrant pear single fruit was determined, accurate to 0.1 g. Each measurement was repeated three times, and the average value was taken. In addition, three fragrant pear trees were randomly selected, and the quality of all fragrant pear fruits on each tree was determined; the average value for a single treatment of single yield was taken, and the yield of each treatment was calculated using Formula (1):
Y = n × M
where Y is the yield of fragrant pear (kg), n is the number of fragrant pear in the plot treatment, and M is the single yield (kg).

2.3.2. Fragrant Pear Quality

After measuring the yield, 15–20 fragrant pear samples were randomly selected from each treatment after yield measurement to determine their soluble solids, vitamin C, titratable acid, total soluble sugar content, peeled hardness, and stone cell content. Soluble solids were determined by a hand-held saccharometer [25,26,27], vitamin C by the 2,6-dichlorophenol indophenol method [28], titratable acid by the acid–base indicator method [29], total soluble sugar content by the anthrone sulfate colorimetric method [30], peeled hardness and pulp hardness by the fruit hardness meter GY-1 [31], and fruit stone cell content by the freezing method [32]. The sugar–acid ratio was determined as the ratio of total sugars to titratable acids, while the solid–acid ratio was determined as the ratio of soluble solids to titratable acids.
According to the national standard GB/T 9859-2005 of the People’s Republic of China [33] and the group standard of Korla fragrant pear [34], the comprehensive analysis resulted in the certification indexes and evaluation system listed in Table 4. Titratable acid, stone cell content, and cross diameter of the nucleus are negative indicators, and soluble solids, vitamin C, total sugar, sugar–acid ratio, solid–acid ratio, fruit shape index, single fruit weight, and stone cell are positive indicators.

2.3.3. IWUE

IWUE was determined using Equation (2).
I W U E = Y / E T ,
where I W U E is irrigation water use efficiency (kg m−3), Y is fragrant pear yield (kg), and E T is fragrant pear water consumption (m3 ha−1) [35,36].
The water consumption of fragrant pear was determined according to the water balance equation [37], as shown in Equation (3).
E T = P 0 + K + M C N Δ W ,
where E T is the water consumption of fragrant pear (mm), P 0 is the rainfall (mm), K is the groundwater recharge (mm), M is the irrigation water (mm), C is the deep seepage (mm), N is the surface runoff (mm), and Δ W is the water storage within the wetted layer of the soil plan (mm). In this study, K, C, and N were neglected [38].

2.3.4. PFP

The PFP was determined using Equation (4) as follows:
P F P = Y / F ,
where P F P is fertilization use efficiency, Y is fragrant pear yield (kg), and F is fragrant pear fertilizer application amount (kg ha−1) [39].

2.3.5. Net Profits

Net profit was determined according to Equation (5).
N = G W C F C L ,
where N is the net profit (CNY ha−1), G is the economic income (CNY ha−1), W C is the water and electricity cost during the entire fertility period, F C is the fertilizer cost (CNY ha−1), and L is other costs such as field management fee, pesticide charges, and labor charges [40].
According to a previous study [40], the grade of the commercial fruit of Korla fragrant pear was classified into A, B, and C. In 2021, the purchase guide price of Korla fragrant pear is as follows: A grade fruit, 11 CNY ha−1; B grade fruit, 7.9 CNY ha−1; C grade fruit, 6 CNY ha−1. Economic income G is determined according to Equation (6).
G = 11 a + 7.9 b + 6 c ,
where a , b , and c denote the mass of A, B, and C grade fruits per hectare (kg ha−1), respectively.

2.3.6. Principal Component Analysis

The scores of each principal component were calculated according to Equations (7) and (8):
F i = U 1 i X 1 + U 2 i X 2 + , , + U p i X p
F g = W 1 F 1 + W 2 F 2 + , , + W i F i
where F i is the score of the i-th principal component; U 1 i , U 2 i , …, U p i are the score coefficients of the i-th principal component; X p is the value after normalization; F g is the comprehensive score of the principal component; W i is the weight of the i-th principal component [41].

2.4. Data Processing

SPSS Statistics 26 statistical software (IBM, Armonk, NY, USA) was used for statistical analysis. All test data were tested for normal distribution and homogeneity of variance. Two-way analysis of variance and Duncan’s test (p = 0.05) were used for multiple comparisons between treatments, and Origin 2021 (OriginLab, Northampton, MA, USA) was used for nonlinear surface fitting and graphing. The regression allowed the computation of a binary quadratic function Y = A x 2 + 2 B x y + C y 2 + D x + E y + H . The values of A, B, C, D, E, and H were calculated based on the measured data; convergence of the solution was also assessed.

3. Results

3.1. The Effect of Water and Fertilizer Coupling on the Comprehensive Quality of Fragrant Pear

As shown in Table 5, the effects of the single-factor irrigation on each quality index of fragrant pear were highly significant (p < 0.01) (i.e., the effect of the single-factor irrigation on single fruit weight was significant (0.01 < p < 0.05)). The effects of the single-factor fertilization on soluble solids, total sugar, single fruit weight, peeled hardness, and stone cell content were highly significant (p < 0.01). The effects of water–fertilizer coupling on soluble solids, vitamin C, titratable acid content, sugar–acid ratio, solid–acid ratio, and stone cell content were highly significant (p < 0.01). The effects of the single-factor fertilization on vitamin C and titratable acid content were significant (0.01 < p < 0.05). The effect of water–fertilizer coupling on lithocytes was significant.
Table 5 also shows that the soluble solid content ranged from 11.86% (W1F1) to 13.65% (W2F2), the vitamin C content ranged from 3.67 mg 100g−1 (W1F1) to 14.16 mg 100g−1 (W1F4), the titratable acid content from 0.24% (W1F1) to 0.44% (W1F4), the total sugar content from 7.08% (W2F1) to 8.26% (W2F3), the sugar to acid ratio from 15.49 (W1F2) to 31.77 (W3F2), the solid to acid ratio from 27.64 (W1F2) to 53.25 (W3F2), the number of fruit fingers from 1.09 (W3F4) to 1.20 (W1F3), the single fruit weight from 98.52 g (W1F1) to 123.59 g (W2F2), peeled hardness from 9.98 kg cm−2 (W1F1) to 11.67 kg cm−2 (W2F3), pulped hardness from 5.98 kg cm−2 (W1F1) to 8.00 kg cm−2 (W2F2), kernel transverse diameter from 24.35 mm (W2F2) to 31.14 mm (W3F4), and the amount of stone cells from 0.10% (W1F4) to 0.24% (W3F3).
According to Table 4 and Table 5, soluble solids, vitamin C, titratable acid content, total sugar, sugar–acid ratio, and solid–acid ratio reached the optimum values in W2F2 (13.65%), W3F4 (14.16 mg 100 g−1), W1F1 (0.24%), W2F3 (8.26%), W3F2 (31.77), and W3F2 (53.25) treatments, respectively; however, no significant difference was observed with W3F2 treatment (p > 0.05). Under W1 irrigation treatment, the levels of soluble solids, vitamin C, titratable acid content, total sugars, and solid to acid ratio were the lowest, which indicated that the chemical quality of fragrant pear would be seriously affected under insufficient irrigation, and therefore, sufficient water was a prerequisite to ensure the chemical quality of fragrant pear. Fruit shape index, single fruit weight, peeled hardness, pulped hardness, transverse diameter of the nucleus, and stone cell content reached the optimum values in W1F3 (1.20), W2F2 (123.59 g), W2F3 (11.67 kg cm−2), W1F1 (5.98 kg cm−2), W2F2 (24.35 mm), and W1F4 (0.10%) treatments, respectively. Under the W2F2 treatment, single fruit weight and kernel cross diameter showed optimal values, but they were not significantly different from the W2F2 treatment (p > 0.05).

3.2. A Comprehensive Evaluation Model of Fragrant Pear Quality

Because a single index cannot fully reflect the quality of fragrant pear, different fragrant pear quality indices in different water and fertilizer treatments were analyzed to determine the optimal value. Therefore, SPSS software with principal component analysis (PCA) was used to comprehensively evaluate the chemical and physical quality of fragrant pear [42]. In the present study, six fragrant pear chemical quality indices and six fragrant pear physical quality indexes were selected. Thus, the following 12 variables were evaluated: soluble solids (X1), vitamin C (X2), titratable acid content (X3), stone cell content (X4), sugar–acid ratio (X5), solid–acid ratio (X6), fruit shape index (X7), single fruit weight (X8), peeled hardness (X9), pulped hardness (X10), core diameter (X11), and stone cell content (X12). The principal component factor loadings and variance contribution rates are shown in Table 6.
With the principle of eigenvalues greater than 1, four principal components were extracted, and their cumulative contribution reached 89.977%; that is, the four principal components reflected 89.977% of the total information, which shows that the problem is reliable using PCA. The first principal component contributed to 34.760% of the total variance and is mainly determined by four indicators of single fruit weight, pulped hardness, soluble solids, and peeled hardness. The second principal component explained 26.656% of the total variance and is mainly influenced by titratable acid content, sugar–acid ratio, and solid–acid ratio. The third principal component covered 18.010% of the total variance and represents indicators of vitamin C, total sugar, and stone cell content. The fourth principal component covered 10.551% of the total variance, and its size was mainly determined by stone cell content, fruit shape index, and peeled hardness.
The scores of each principal component were calculated according to Equations (7) and (8) and ranked according to the comprehensive score of each treatment, as shown in Table 7. Among the treatments, W3F2 treatment showed the best quality of fragrant pear, while W1F1 treatment showed the worst comprehensive quality of fragrant pear. The comprehensive quality of fragrant pear in descending order was W3, W2, and W1, which indicated that insufficient irrigation water leads to unfavorable quality of fragrant pear. Under W1 irrigation treatment, the comprehensive quality of fragrant pear for different fertilization treatments was in the descending order of F3, F2, F4, and F1; under W2 irrigation treatment, the comprehensive quality of fragrant pear for different fertilization treatments was in the descending order of F3, F2, F4, and F1; and under W3 irrigation treatment, the comprehensive quality of fragrant pear for different fertilization treatments was in the descending order of F2, F3, F1, and F4, which indicated that both high and low fertilization rates were not favorable to improve the comprehensive quality of fragrant pear.

3.3. Effect of Water and Fertilizer Coupling on Fragrant Pear Yield

The effects of different water and fertilizer treatments on the yield of fragrant pear are shown in Figure 4. As shown in the figure, there were significant differences (p < 0.05) between all treatments, except for W3F2 and W3F3 treatments, W3F1 and W2F2 treatments, and W3F4 and W2F2 treatments, W3F4 and W2F3 treatments, W2F1 and W2F4 treatments, W1F2 and W1F4 treatments, W1F3 and W1F4 treatments, and there was no significant difference (p > 0.05) between W1F1 and W1F3 treatments. Therefore, the different irrigation and fertilizer treatments all had a significant (p < 0.05) effect on yield (except W3F2 and W3F3, W3F1 and W2F2, W3F4 and W2F2, and W3F4 and W2F3, W2F1 and W2F4, W1F2 and W1F4, W1F3 and W1F4, W1F1 and W1F3).
As seen in Figure 4, when the irrigation level was the same, under W1 irrigation treatment, the fragrant pear yield for different fertilization treatments was in the descending order of F2, F4, F3, and F1. Under W2 and W3 irrigation treatments, the fragrant pear yield initially increased and then decreased with the increase in fertilizer application, in the descending order of F2, F1, F3, and F4. When the fertilizer application level was kept the same, the fragrant pear yield increased with the increase in irrigation water, in the descending order of F1, F2, F3, and F4. The average yields of fragrant pear under W1, W2, and W3 irrigation treatments were 11,100, 15,188, and 18,563 kg ha−1, respectively, and the yields of W2 and W3 increased by 36.82% and 67.23%, respectively, compared to W1. The average yields of fragrant pear under F1, F2, F3, and F4 fertilization treatments were 11,363, 12,375, 10,687, and 10,425 kg ha−1, respectively. Compared with F1, the yield of F2 increased by 5.94%, and the yield of F3 decreased by 8.25%. Among the different treatments, the fragrant pear yield of W3F2 treatment was the highest, with a yield of 20,250 kg ha−1, and that of W1F1 treatment was the lowest, with a yield of 10,200 kg ha−1. The yield increase was 98.53% as compared to that under the condition of water and fertilizer deficit. This indicates that water and fertilizer are closely related to fragrant pear yield, that the W3 irrigation treatment is more favorable for fragrant pear yield than W1 and W2 irrigation treatments, and that the appropriate increase in irrigation under the condition of water restriction is favorable for yield increase. The appropriate amount of fertilizers is favorable to fragrant pear yield increase, as a fertilizer amount lower than F2 (750 kg ha−1) and higher than F3 (825 kg ha−1) is not beneficial to fragrant pear yield increase.

3.4. Effect of Water–Fertilizer Coupling on IWUE, PFP, and Net Profits of Fragrant Pear Irrigation

Table 8 shows that irrigation, fertilizer application, and water–fertilizer coupling exert highly significant effects on IWUE and PFP (p < 0.01). Table 8 also shows that the IWUE value ranged from 1.94 to 2.56 kg m−3, with the maximum IWUE for the W2F2 treatment and the minimum IWUE for the W1F1 treatment. At the same irrigation level, IWUE first increased and then decreased with the increase in fertilizer application, while the increase in the fertilizer application level to F4 did not benefit IWUE. For example, under W2 irrigation treatment, the IWUE values of F1, F2, F3, and F4 fertilizer treatments were 2.11, 2.56, 2.33, and 2.00 kg m−3, respectively, with an increase of 21.12% for F2, 10.58% for F3, and 5.21% for F4 as compared with F1 treatment. The PFP ranged from 12.73 kg kg−1 to 27.00 kg kg−1, with the maximum PFP in W3F2 treatment and the minimum in W1F3 treatment. At the same fertilizer application level, PFP increased with the increase in irrigation water, and the increase was significant. At the same level of irrigation, PFP decreased with the increase in fertilizer application.
From Table 8, it can also be concluded that irrigation, fertilizer application, and water–fertilizer coupling had a highly significant effect on economic income (p < 0.01). Irrigation and fertilizer application had a highly significant effect on net profits (p < 0.01), while water–fertilizer coupling had no significant effect on net profits (p > 0.05). The economic income ranged from 77,907 (W1F1) to 163,281 (W3F3) CNY ha−1, and the net profits ranged from 72,365 CNY (W1F1) to 158,241 CNY (W3F3). The highest economic income increased by 109.58% as compared to the lowest economic income, and the highest net income increased by 118.67% as compared to the lowest net income. At the same irrigation level, the net return initially increased and then decreased with the increase in fertilizer application. When the fertilizer application level was lower than F2 (750 kg ha−1), the net profits decreased, and when the fertilizer application level exceeded F3 (825 kg ha−1), increasing the fertilizer input did not lead to a sustained increase in net profits, but rather, the net profits decreased. At the same fertilizer application level, the net profits were W3 > W2 > W1 from the largest to the smallest, and the net profits increased with the increase in irrigation water.

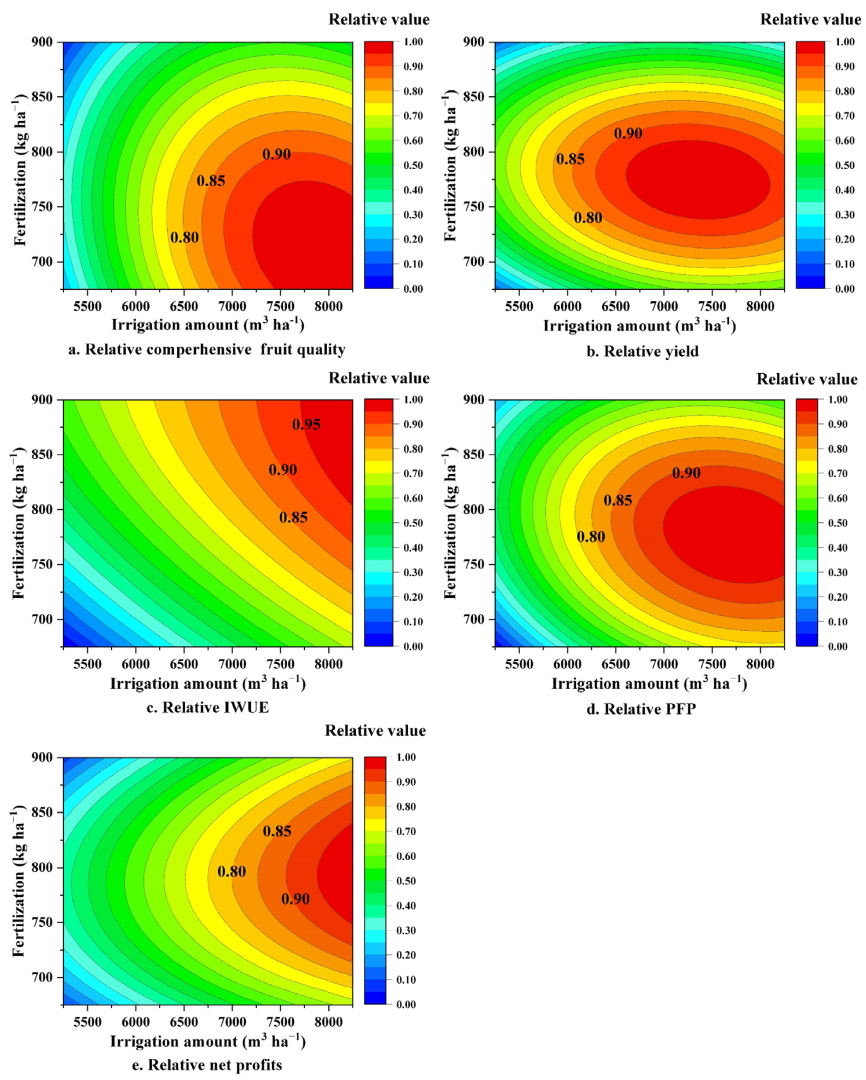
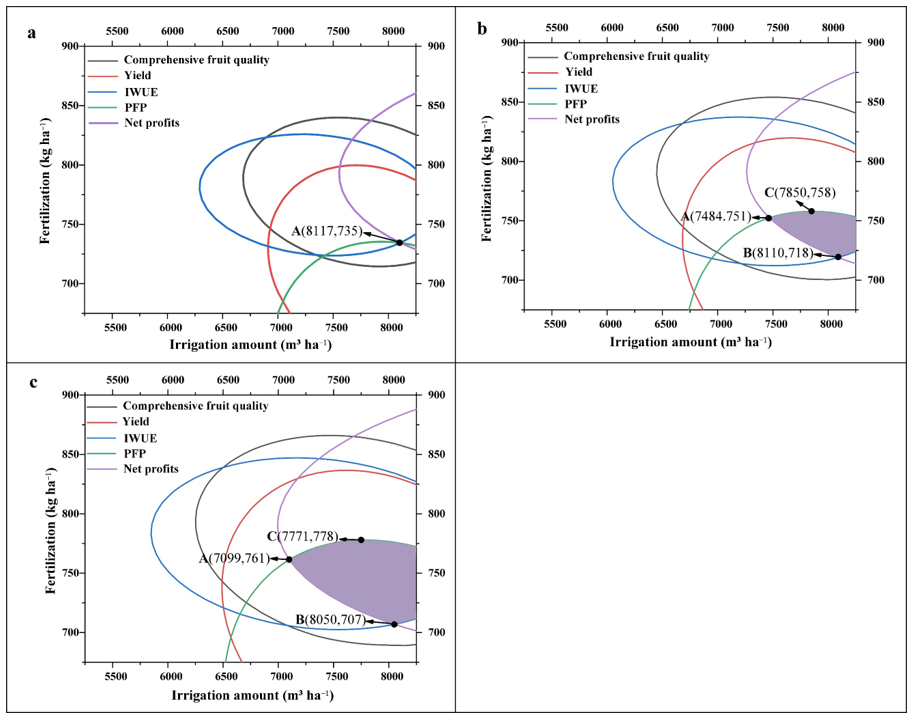
3.5. Multi-Objective Solution for Optimal Water and Fertilizer Amount

The binary quadratic regression equation was established with water and fertilizer inputs as independent variables and the comprehensive quality, yield, IWUE, PFP, and net profits of fragrant pear as dependent variables [43,44], as shown in Table 9. The regression analysis showed that the effects of water and fertilizer inputs on the indicators reached a highly significant level (p < 0.01), and the coefficients of determination were > 0.85 (Table 9).
The coupling effect of irrigation and fertilization on the fragrant pear comprehensive fruit, yield, IWUE, PFP, and net profits have a downward convex shape. When they reach their maximum levels, the amount of irrigation and fertilizer required by crops is similar (Figure 5).
The boundary conditions of the multi-objective solution were determined by taking W3 as the upper limit of irrigation and W1 as the lower limit of irrigation under the water-limited drip irrigation condition. The maximum fertilizer application amount F4 was considered as the upper limit of fertilizer application and the minimum fertilizer application amount F1 as the lower limit of fertilizer application. Since the comprehensive quality, yield, IWUE, PFP, and net profits are difficult to be optimal at the same time and the magnitude of each evaluation index is different, the linear normalization method was used to normalize the data of each evaluation index, as shown in Figure 6.
The relative values of ≥90%, ≥85%, and ≥80% were defined as acceptable regions, and the boundaries of these three acceptable regions corresponded to the contours of 0.90, 0.85, and 0.80, respectively, in Figure 7. From the spatial analysis method [45], the contours of 0.9, 0.85, and 0.8 for each evaluation index in Figure 6 were projected onto a plane (Figure 7). As shown in Figure 7, the relative value of ≥90% acceptable area is a point that deviates far from those of IWUE, PFP, and net profits. Within the acceptable region ≥80%, each evaluation index has an overlapping region; however, the overlapping areas are too large and lead to deviation from the extreme values. However, there are overlapping areas within 85% of the acceptable area that simultaneously satisfy the five evaluation indicators, and 85% of the acceptable area is closer to the extreme values of each indicator than 80% of the acceptable area. Therefore, the overlapping area with relative values of each evaluation index ≥0.85 is the ideal range for water and fertilizer input; that is, the comprehensive quality, yield, IWUE, PFP, and net profits of fragrant pear can reach more than 85% of the maximum value at the same time when the irrigation water amount is 7484–8250 m3 ha−1 and the fertilizer application amount is 707–778 kg ha−1.

4. Discussion

4.1. Effect of Water–Fertilizer Coupling on the Comprehensive Quality of Fragrant Pear

In terms of fruit quality, fruit hardness, soluble solid content, soluble sugar content, titratable acid content, and stone cell content directly determine the taste and flavor of fragrant pear [13,46], and fruit shape index, single fruit weight, and kernel cross diameter are important components to evaluate fruit quality [47,48]. We considered the fruit quality of fragrant pear based on taste, nutrition, and appearance and evaluated the fruit quality by PCA. The cumulative contribution rate was 89.977%, which explained most of the variance, and the results were reliable. In the present study, the quality of fragrant pear was found to gradually increase with the increase in water irrigation; this finding differed from the results of previous studies [49,50]. This is because the previous irrigation capacity of Korla fragrant pear was mostly 12,000 m3 ha−1, while the irrigation capacity in this experiment was temporarily set at 7875 m3 ha−1 based on the constraint of “three red lines”. Consequently, the irrigation quantity was greatly reduced, and the irrigation capacity was lower than the threshold value. Within a certain range, increasing the irrigation amount can promote root growth and nutrient uptake and accelerate photosynthetic rate and organic matter synthesis [40]. It may also adjust the ratio of photosynthetic product nutrient growth and reproductive growth distribution due to moderate water stress and improve the transport and distribution of assimilated products within the plant [51], which may improve the quality of fragrant pear. Both high and low fertilizer applications were found to be detrimental to the overall quality of fragrant pear; this finding is consistent with the results of most previous studies [51,52].

4.2. Effect of Water–Fertilizer Coupling on the Comprehensive Quality of Fragrant Pear

Yield is the main index to measure the economic benefits of fragrant pear cultivation, and water and fertilizer application are the direct factors that affect the yield of fragrant pear [53]. The coordinated coupling of water and fertilizer relationship is considered to be conducive to high quality, high yield, high efficiency, and high profitability. Previous studies have shown that there is a threshold response for water–fertilizer coupling. Below the threshold, increasing water–fertilizer input increases yield significantly, while above the threshold, yield reduction occurs instead [54]. The application of an N fertilizer can significantly affect dry matter accumulation, nutrient uptake, and distribution of crops, thus affecting crop yield and quality. Yield and quality affect each other with mutual constraints [55]. Under the drip irrigation fertilization condition, increasing the irrigation amount can increase N fertilizer utilization efficiency, while increasing N application reduces both quality and N utilization efficiency of cucumber [27]. Liu et al. [12] found that water productivity increased with increasing fertilizer application and showed a U-shaped change with increasing irrigation water amount. In the present study, the yield of fragrant pear ranged from 10,200 (W1F1) to 20,250 kg ha−1 (W3F2). When the fertilization level was kept the same, the yield of fragrant pear decreased with the increase in irrigation water; when the irrigation water amount was kept the same, the yield of fragrant pear initially increased and then decreased with the increase in fertilization. This is because an appropriate increase in irrigation is conducive to the increase in soil water content, promotion of root growth and development, and improvement in nutrient uptake, which eventually leads to changes in fragrant pear yield and improves fertilizer utilization. Under W1 treatment, even with the increased fertilizer application, its yield increasing effect was not significant. Fertilizer application can also promote the growth of the fragrant pear root system, which can promote soil water uptake and thus improve water use efficiency [56]; however, excessive fertilizer application will impair the balance between nutritional and reproductive growth, resulting in a lower yield and PFP of fragrant pear. Similar findings were reported by Xing et al. [42] and Faloye et al. [57]. Moreover, Liu et al. [9] showed that the optimal fragrant pear yield was 53,790 kg ha−1 when the fertilizer application was 690 kg ha−1 and when the irrigation amount was 10,650 m3 ha−1. The fragrant pear yield in the present study was reduced as compared to previous findings because of the low fruit set rate in recent years due to frequent adverse natural disasters in the pear orchards in the Korla region during the flowering and fruit harvesting periods [58].
The economic efficiency of orchards is the main concern of fruit farmers. By comparing the quality, planting benefit, and cost and calculating the yield to investment ratio, Feng et al. [59] found that the optimal treatment recommended for use in fragrant pear production was 900 kg ha−1 of biofertilizer (effective number of live bacteria ≥ 1 × 10⁹ g−1, organic matter ≥ 50 g kg−1), 150 kg ha−1 of urea (total nitrogen ≥ 46%), 600 kg ha−1 of compound fertilizer (total nutrient ≥ 45%, S ≥ 10%), 1.13 kg ha−1 of foliar fertilizer (Ca ≥ 160 g L−1, sugar alcohol chelate ≥ 98%), and 1050 kg ha−1 of drip irrigation fertilizer (potassium sulfate water-soluble fertilizer, N + P2O5 + K2O ≥ 50%). The net profits of fragrant pear were 101,393.25 CNY, and the best combined yield to investment ratio was 2.04:1. In the present experiment, by using sheep manure (3750 kg ha−1) and fungal fertilizer (900 kg ha−1) as the base fertilizer, the net profits of fragrant pear reached the maximum of 158,241 CNY ha−1 when the irrigation volume was 8250 m3 ha−1, and the fertilizer application volume was 825 kg ha−1. Compared to a previous study, in the present study, high efficiency and high benefit of fertilizer saving were achieved in the fragrant pear orchard. The main reason for this is that in this study, we used the irrigation method of surface drip irrigation, which can save more irrigation water and save more electricity cost as compared to a large water irrigation system; secondly, we implemented the irrigation and fertilization approach of frequent and small amounts to reduce the loss of water and fertilizer, thus reducing the cost. We also found that increasing irrigation is beneficial to improve the net profits of fragrant pear, while the cost of irrigation is a small percentage of the total investment. However, when the irrigation is insufficient, the net profits will be significantly reduced, which is the main reason why farmers are reluctant to save water and use a large amount of irrigation water in the agricultural production process. At the same level of irrigation, a large increase in fertilizer input will not lead to a sustained increase in net profits, but rather a decrease in net profits. This is because fertilizer application and irrigation need to be coupled in a coordinated manner, and a single increase in fertilizer application may lead to soil nutrient structure disorders while increasing production costs. This is consistent with the results of a previous study by Feng et al. [59].

4.3. Optimal Water and Fertilizer Solution

To determine the optimal combination of irrigation and fertilization for each indicator, scholars have mostly used multiple regression methods to establish water and fertilizer regression equations with water and fertilizer application as independent variables and single indicators as dependent variables and derived the optimal water and fertilizer combination by solving the extreme values of the equations [60]. The limitation of this method is that when there are more than two evaluation indicators, the method becomes more difficult to implement, and the resulting water–fertilizer combination often does not consider all evaluation indicators and cannot simultaneously make each indicator optimal. Thompson et al. [23] used this method to evaluate the agronomic, economic, and environmental benefits of drip-irrigated oilseed rape and found the optimal water and fertilizer ratio in 95% of the overlapping area. Wang et al. [44] found the optimal water and fertilizer area in 80% of the overlapping area. Li et al. [42] concluded that the acceptable area for grapes was the optimal amount of water and fertilizer in the overlap area with relative values ≥ 90% through a 3-year experiment. The advantage of using this method is that it can accurately quantify the optimal value of the target and determine the acceptable zone to meet different requirements, rather than analyzing through the trend of change and simple size comparison. The disadvantage is that the interval is only an estimation of the optimal water and fertilizer interval, but it cannot accurately determine the specific irrigation and fertilization amount. Thus, the promotion and application of this method in the Korla region for drip irrigation fragrant pear need further research. In the present study, through multiple regression analysis, normalization treatment, and spatial analysis method, the optimal irrigation and fertilization interval was found in the 85% overlap area, and its fertilization irrigation interval was 7484–8250 m3 ha−1 and 707–777 kg ha−1 when N (181–200 kg ha−1), P2O5 (223–246 kg ha−1), and K2O (300–332 kg ha−1) were applied. This provides a basis for the determination of a water and fertilizer management system for high quality, high yield, high efficiency, and high profitability of Korla fragrant pear. The optimal fertilizer application interval in this study was approximately the same as reported in previous studies [61,62], while the optimal irrigation amount was reduced. The reason may be that the optimal irrigation water amount is different due to more factors considered in this study, which integrates the comprehensive quality, yield, IWUE, PFP, and net profits of fragrant pear. The optimal water and fertilizer area of this study intersects with the right coordinate axis, which implies that there is still a part of the optimal water and fertilizer area outside the figure. With the current implementation of the strictest water resource management system and total water use control, the current tentative irrigation capacity of 7875 m3 ha−1 needs to be adjusted upward.

5. Conclusions

More effective use of water and fertilizer resources and the development of reasonable water and fertilizer management schemes are among the urgent problems faced by China. In the present experiment, we investigated the effects of water–fertilizer coupling on the comprehensive quality, yield, IWUE, PFP, and net profits of drip-irrigated fragrant pear and provided a multi-objective optimization scheme for drip irrigation of Korla fragrant pear in the Xinjiang region; the experimental results improve the scientific basis for the implementation of the strictest water management system in Xinjiang Korla fragrant pear orchards. The following conclusions were drawn:
(1) Through the comprehensive quality evaluation model for fragrant pear, four principal components were extracted, and their cumulative contribution rate was 89.977%, with W3F2 treatment showing the best comprehensive quality and W1F1 treatment showing the worst comprehensive quality. Under the condition of limited water drip irrigation, the yield of fragrant pear was significantly affected by the coupling effect of water and fertilizer. The yield was positively correlated with the amount of irrigation water and showed an inverted U-shaped change with the amount of fertilizer application. The yield of fragrant pear ranged from 10,200 (W1F1) to 20,250 kg ha−1 (W3F2). The yield showed a descending order of W3, W2, and W1 when the fertilizer application level was the same, while it showed a descending order of F2, F1, F3, and F4 when the irrigation amount was the same. The lower and upper threshold values of fertilizer application were F2 (750 kg ha−1) and F3 (825 kg ha−1), respectively.
(2) IWUE, PFP, and net profits reached the maximum value in W2F2, W3F2, and W3F3 treatments, respectively. IWUE initially increased and then decreased with the increase in irrigation water and fertilizer application, while PFP increased with the increase in irrigation water and decreased with the increase in fertilizer application. The net profits showed a trend of initial increase and then decrease with the increase in fertilizer application and increased with the increase in irrigation water.
(3) Through the combination of multiple regression analysis and spatial analysis, we concluded that under the conditions of this experiment when the irrigation water amount was 7484–8250 m3 ha−1 and the fertilizer application amount was 707–778 kg ha−1, in which N (181–200 kg ha−1), P2O5 (223–246 kg ha−1), and K2O (300–332 kg ha−1) were applied, the comprehensive quality, yield, IWUE, PFP, and net profits of fragrant pear could simultaneously reach more than 85% of the maximum value.

Author Contributions

Conceptualization, J.W. and P.G.; methodology, J.W.; software, J.W. and P.G.; validation, J.W.; investigation, J.W., P.G., D.Z., Y.Z., J.Z. and Z.W.; writing—original draft preparation, J.W.; writing—review and editing, X.H. and P.G; supervision, X.H.; project administration, P.G.; funding acquisition, X.H. All authors have read and agreed to the published version of the manuscript.

Funding

This research was funded by Corps Financial Science and Technology Plan Projects of Xinjiang Province, China (grant number 2021DB012), the National Natural Science Foundation of China (grant number U1803244, 51969027), and Corps Major Science and Technology Projects of Xinjiang Province, China (grant number 2021AB021).

Institutional Review Board Statement

Not applicable.

Informed Consent Statement

Not applicable.

Data Availability Statement

All data generated or analyzed during this study are included in this published article.

Acknowledgments

The authors thank the editor and anonymous reviewers who significantly helped improve this manuscript.

Conflicts of Interest

The authors declare no conflict of interest.

References

  1. Chen, J.; Lu, J.; He, Z.; Zhang, F.; Zhang, S.; Zhang, H. Investigations into the production of volatile compounds in Korla fragrant pears (Pyrus sinkiangensis Yu). Food Chem. 2020, 302, 125337. [Google Scholar] [CrossRef] [PubMed]
  2. Niu, Y.; Chen, X.; Zhou, W.; Li, W.; Zhao, S.; Nasir, M.; Dong, S.; Zhan, S.; Liao, K. Genetic relationship between the ‘Korla fragrant pear’ and local pear varieties in xinjiang based on floral organ characteristics. Sci. Hortic. 2019, 257, 108621. [Google Scholar] [CrossRef]
  3. Feng, Z.; Zhiqin, J.; Xiaoguang, C.; Shiqiang, L.; Tianming, H. The Development Factors of Pyrus sinkiangensis ‘Korla Xiangli’lndustry. Chin. Agric. Sci. Bull. 2021, 37, 159–164, (In Chinese with English Abstract). [Google Scholar]
  4. Dou, M.; Wang, Y. The construction of a water rights system in China that is suited to the strictest water resources management system. Water Sci. Technol.-Water Supply 2017, 17, 238–245. [Google Scholar] [CrossRef]
  5. Wu, Y.; Wang, E.; Miao, C. Fertilizer Use in China: The Role of Agricultural Support Policies. Sustainability 2019, 11, 4391. [Google Scholar] [CrossRef] [Green Version]
  6. Xu, C.; Li, R.; Song, W.; Wu, T.; Sun, S.; Hu, S.; Han, T.; Wu, C. Responses of Branch Number and Yield Component of Soybean Cultivars Tested in Different Planting Densities. Agriculture 2021, 11, 69. [Google Scholar] [CrossRef]
  7. Jia, H.; Wang, Z.; Zhang, J.; Li, W.; Ren, Z.; Jia, Z.; Wang, Q. Effects of biodegradable mulch on soil water and heat conditions, yield and quality of processing tomatoes by drip irrigation. J. Arid. Land 2020, 12, 819–836. [Google Scholar] [CrossRef]
  8. Wezel, A.; Casagrande, M.; Celette, F.; Vian, J.-F.; Ferrer, A.; Peigne, J. Agroecological practices for sustainable agriculture. A review. Agron. Sustain. Dev. 2014, 34, 1–20. [Google Scholar] [CrossRef] [Green Version]
  9. Hongbo, L.; Yungang, B.; Jianghui, Z.; Ping, D. Effect of water fertilizer coupling on yield of fragrant pear. J. Irrig. Drain. 2015, 34, 15–17, (In Chinese with English Abstract). [Google Scholar]
  10. Qing, Z.; Fangliang, L.; Qingbo, K.; Mulai, Z. Effect of different reduced fertigation modes on the yield, quality and economic benefits of honey pomelo. J. Fruit Sci. 2021, 38, 361–371. [Google Scholar] [CrossRef]
  11. Li, B.; Shukla, M.K.; Du, T. Combined environmental stresses induced by drip irrigation positively affect most solar greenhouse grown tomato fruit quality. Sci. Hortic. 2021, 288, 110334. [Google Scholar] [CrossRef]
  12. Yanan, L.; Meijian, B.; Baozhong, Z.; Xianbing, W.; Yuan, S. Responses of Pear Tree Growth and Fruit Quality Indexes to Water and Nitrogen Coupling and Correlation Degree Analysis. Water Sav. Irrig. 2020, 4, 52–56, (In Chinese with English Abstract). [Google Scholar]
  13. Liu, K.; Wang, X.; Young, M. Effect of bentonite/potassium sorbate coatings on the quality of mangos in storage at ambient temperature. J. Food Eng. 2014, 137, 16–22. [Google Scholar] [CrossRef]
  14. Chen, X.; Feng, S.; Qi, Z.; Sima, M.W.; Zeng, F.; Li, L.; Cheng, H.; Wu, H. Optimizing Irrigation Strategies to Improve Water Use Efficiency of Cotton in Northwest China Using RZWQM2. Agriculture 2022, 12, 383. [Google Scholar] [CrossRef]
  15. Zou, Y.; Saddique, Q.; Ali, A.; Xu, J.; Khan, M.I.; Qing, M.; Azmat, M.; Cai, H.; Siddique, K.H.M. Deficit irrigation improves maize yield and water use efficiency in a semi-arid environment. Agric. Water Manag. 2021, 243, 106483. [Google Scholar] [CrossRef]
  16. Sun, G.; Hu, T.; Liu, X.; Peng, Y.; Leng, X.; Li, Y.; Yang, Q. Optimizing irrigation and fertilization at various growth stages to improve mango yield, fruit quality and water-fertilizer use efficiency in xerothermic regions. Agric. Water Manag. 2022, 260, 107296. [Google Scholar] [CrossRef]
  17. Li, W.; Yang, M.; Wang, J.; Wang, Z.; Fan, Z.; Kang, F.; Wang, Y.; Luo, Y.; Kuang, D.; Chen, Z.; et al. Agronomic Responses of Major Fruit Crops to Fertilization in China: A Meta-Analysis. Agronomy 2020, 10, 15. [Google Scholar] [CrossRef] [Green Version]
  18. Xia, C.; Liu, Z.; Suo, X.; Cao, S. Quantifying the net benefit of land use of fruit trees in China. Land Use Policy 2020, 90, 104276. [Google Scholar] [CrossRef]
  19. Xiubing, C.; Lin, P.; Qingli, W.; Xinxin, X. Water-fertilizer coupling effects and its optimization in greenhouse tomato production. J. Nanjing Agric. Univ. 2006, 29, 138–141, (In Chinese with English Abstract). [Google Scholar]
  20. Pengbo, W.; Jianming, L.; Juanjuan, D.; Guoying, L.; Tonghua, P.; Qingjie, D.; Yibo, C. Effect of Water and Fertilizer Coupling on Quality, Yield and Water Use Efficiency of Tomato Cultivated by Organic Substrate in Bag. Sci. Agric. Sin. 2015, 48, 314–323, (In Chinese with English Abstract). [Google Scholar]
  21. Yi, C.; Yonghong, Z.; Geng, Z.; Zhonglili, Z.; Feifei, S.; Xin, Z. Effects of Water and Fertilizer Coupling on Yield, Quality and Utilization of Protected Grape. J. Agric. Mech. Res. 2021, 43, 186–193. [Google Scholar] [CrossRef]
  22. Yingying, X.; Fucang, Z.; Lifeng, W. Determination of optimal amount of irrigation and fertilizer under drip fertigated system based on tomato yield, quality, water and fertilizer use efficiency. Trans. Chin. Soc. Agric. Eng. 2015, 31, 110–121, (In Chinese with English Abstract). [Google Scholar]
  23. Thompson, T.L.; Doerge, T.A.; Godin, R.E. Nitrogen and water interactions in subsurface drip-irrigated cauliflower: II. Agronomic, economic, and environmental outcomes. Soil Sci. Soc. Am. J. 2000, 64, 412–418. [Google Scholar] [CrossRef] [Green Version]
  24. Wu, B.; Zeng, H.; Zhu, W.; Yan, N.; Ma, Z. Enhancing China’s Three Red Lines strategy with water consumption limitations Comment. Sci. Bull. 2021, 66, 2057–2060. [Google Scholar] [CrossRef]
  25. Bessho, H.; Kudo, K.; Omori, J.; Inomata, Y.; Wada, M.; Masuda, T.; Nakamoto, Y.; Fujisawa, H.; Suzuki, Y. A portable non-destructive quality meter for understanding fruit soluble solids in apple canopies. In Proceedings of the 8th International Symposium on Canopy, Rootstocks and Environmental Physiology in Orchard Systems, Budapest, Hungary, 13–18 June 2007; pp. 593–597. [Google Scholar]
  26. Lan, H.; Wang, Z.; Niu, H.; Zhang, H.; Zhang, Y.; Tang, Y.; Liu, Y. A nondestructive testing method for soluble solid content in Korla fragrant pears based on electrical properties and artificial neural network. Food Sci. Nutr. 2020, 8, 5172–5181. [Google Scholar] [CrossRef]
  27. Zhang, H.; Chi, D.; Wang, Q.; Fang, J.; Fang, X. Yield and Quality Response of Cucumber to Irrigation and Nitrogen Fertilization Under Subsurface Drip Irrigation in Solar Greenhouse. Agric. Sci. China 2011, 10, 921–930. [Google Scholar] [CrossRef]
  28. Jukneviciene, E.; Cerniauskiene, J.; Kulaitiene, J.; Jukneviciene, Z. Oil pumpkins—Important source of antioxidants. J. Food Agric. Environ. 2013, 11, 156–158, (In Chinese with English Abstract). [Google Scholar]
  29. De Oliveira, L.M.A.; Dos Santos, V.B.; Da Silva, E.K.N.; Lopes, A.S.; Dantas-Filho, H.A. An environment-friendly spot test method with digital imaging for the micro-titration of citric fruits. Talanta 2020, 206, 120219. [Google Scholar] [CrossRef]
  30. Sunderwirth, S.G.; Olson, G.G.; Johnson, G. Paper Chromatography-Anthrone Determination of Sugars. J. Chromatogr. 1964, 16, 176–180. [Google Scholar] [CrossRef]
  31. Inoue, H.; Tateishi, A. The application of non-destructive handy hardness meter for assessment of avocado fruit firmness. In Proceedings of the XXVth International Horticultural Congress, Brussels, Belgium, 2–7 August 1998. [Google Scholar]
  32. Xue, Y.; Xu, S.; Xue, C.; Wang, R.; Zhang, M.; Li, J.; Zhang, S.; Wu, J. Pearprocess: A new phenotypic tool for stone cell trait evaluation in pear fruit. J. Integr. Agric. 2020, 19, 1625–1634. [Google Scholar] [CrossRef]
  33. National Public Service Platform for Standards Information. Available online: http://std.samr.gov.cn/gb/search/gbDetailed?id=71F772D767C7D3A7E05397BE0A0AB82A (accessed on 1 January 2006).
  34. National Public Service Platform for Standards Information. Available online: http://std.samr.gov.cn/hb/search/stdHBDetailed?id=8B1827F18E5CBB19E05397BE0A0AB44A (accessed on 20 December 2002).
  35. Jia, H.; Zheng, L. Irrigation Water Use Efficiency Based on the Deficit Irrigation Theories. In Proceedings of the 3rd International Conference on Energy, Environment and Sustainable Development (EESD 2013), Shanghai, China, 12–13 November 2014. [Google Scholar]
  36. Omezzine, A.; Zaibet, L. Management of modern irrigation systems in oman: Allocative vs. irrigation efficiency. Agric. Water Manag. 1998, 37, 99–107. [Google Scholar] [CrossRef]
  37. Garavito, J.; Herrera, A.O.; Castellanos, D.A. A combined mathematical model to represent transpiration, respiration, and water activity changes in fresh cape gooseberry (Physalis peruviana) fruits. Biosyst. Eng. 2021, 208, 152–163. [Google Scholar] [CrossRef]
  38. Andreu, L.; Hopmans, J.W.; Schwankl, L.J. Spatial and temporal distribution of soil water balance for a drip-irrigated almond tree. Agric. Water Manag. 1997, 35, 123–146. [Google Scholar] [CrossRef]
  39. Ierna, A.; Pandino, G.; Lombardo, S.; Mauromicale, G. Tuber yield, water and fertilizer productivity in early potato as affected by a combination of irrigation and fertilization. Agric. Water Manag. 2011, 101, 35–41. [Google Scholar] [CrossRef]
  40. Zou, H.; Fan, J.; Zhang, F.; Xiang, Y.; Wu, L.; Yan, S. Optimization of drip irrigation and fertilization regimes for high grain yield, crop water productivity and economic benefits of spring maize in Northwest China. Agric. Water Manag. 2020, 230, 105986. [Google Scholar] [CrossRef]
  41. Subasi, I. Agro-Morphological Characterization and Some Seed Characteristics of Wild Crambe (Brassicaceae) Species in Turkey. Sustainability 2022, 14, 287. [Google Scholar] [CrossRef]
  42. Rajametov, S.N.; Lee, K.; Jeong, H.-B.; Cho, M.-C.; Nam, C.-W.; Yang, E.-Y. Physiological Traits of Thirty-Five Tomato Accessions in Response to Low Temperature. Agriculture 2021, 11, 792. [Google Scholar] [CrossRef]
  43. Li, X.; Liu, H.; Li, J.; He, X.; Gong, P.; Lin, E.; Li, K.; Li, L.; Binley, A. Experimental study and multi-objective optimization for drip irrigation of grapes in arid areas of northwest China. Agric. Water Manag. 2020, 232, 106039. [Google Scholar] [CrossRef]
  44. Hou, Y.; Wang, Z.; Ding, H.; Li, W.; Wen, Y.; Zhang, J.; Dou, Y. Evaluation of Suitable Amount of Water and Fertilizer for Mature Grapes in Drip Irrigation in Extreme Arid Regions. Sustainability 2019, 11, 2063. [Google Scholar] [CrossRef] [Green Version]
  45. Zhenhua, W.; Qingyong, B.; Wenhao, L.; Chaoyang, L. Suitable water and fertilizer amount for mature jujube with drip-irrigation under fertigation in southern Xinjiang sandy area. Trans. Chin. Soc. Agric. Eng. 2018, 34, 96–104, (In Chinese with English Abstract). [Google Scholar]
  46. Liu, X.; Li, S.; Feng, X.; Li, L. Study on Cell Wall Composition, Fruit Quality and Tissue Structure of Hardened ‘Suli’ Pears (Pyrus bretschneideri Rehd). J. Plant Growth Regul. 2021, 40, 2007–2016. [Google Scholar] [CrossRef]
  47. Zheng, P.; Zhang, M.; Wang, Z.; Wang, T.; Tang, L.; Ma, E.; Liu, J.; Shi, F. Comprehensive evaluation of the Fruit Quality of the Main Cultivars of Pear (Pyrus spp.) in North China. Erwerbs-Obstbau 2021, 64, 219–227. [Google Scholar] [CrossRef]
  48. Song, X.H.; Xie, K.; Zhao, H.B.; Li, Y.L.; Dong, C.X.; Xu, Y.C.; Shen, Q.R. Effects of Different Organic Fertilizers on Tree Growth, Yield, Fruit Quality, and Soil Microorganisms in a Pear Orchard. Eur. J. Hortic. Sci. 2012, 77, 204–210, (In Chinese with English Abstract). [Google Scholar]
  49. Melissa, V.; Luigi, M.; Demetrio, P.G.; Alexandra, B.; Kushtrim, B.; Luca, C.G.; Brunella, M. Deficit Irrigation as a Tool to Optimize Fruit Quality in Abbé Fetél Pear. Agronomy 2021, 11, 1141. [Google Scholar]
  50. Mattar, M.A.; Soliman, S.S.; Al-Obeed, R.S. Effects of Various Quantities of Three Irrigation Water Types on Yield and Fruit Quality of ‘Succary’ Date Palm. Agronomy 2021, 11, 796. [Google Scholar] [CrossRef]
  51. Sihua, Y.; Yanming, G.; Minjiao, T.; Yongqiang, T.; Jianshe, L. Comprehensive evaluation of effects of various carbon-rich amendments on tomato production under continuous saline water irrigation: Overall soil quality, plant nutrient uptake, crop yields and fruit quality. Agric. Water Manag. 2021, 255, 106995. [Google Scholar]
  52. Lu, J.; Shao, G.; Gao, Y.; Zhang, K.; Wei, Q.; Cheng, J. Effects of water deficit combined with soil texture, soil bulk density and tomato variety on tomato fruit quality: A meta-analysis. Agric. Water Manag. 2021, 243, 106427. [Google Scholar] [CrossRef]
  53. Babak, M.; Qifu, M.; Reza, T.A.; Reza, F.; Farzaneh, B. Nutritional, Yield, and Quality Responses of Apple, Pear, and Cherry to Calcium Nitrate Application. Commun. Soil Sci. Plant Anal. 2021, 52, 1132–1148. [Google Scholar]
  54. Jiankai, Z.; Hongxia, C.; Xiaoyan, P.; Xueping, N. Optimization of drip irrigation and topdressing nitrogen based on apple yield and quality in Northern Shaanxi. Agric. Res. Arid. Areas 2020, 38, 143–152, (In Chinese with English Abstract). [Google Scholar]
  55. Zhou, H.; Zhang, F.; Kjelgren, R.; Wu, L.; Gong, D.; Zhao, N.; Yin, D.; Xiang, Y.; Li, Z. Effects of Water and Fertilizer Coupling on Yield, Fruit Quality and Water and Fertilizer Use Efficiency of Young Apple Tree. J. Integr. Agric. 2017, 16, 1173–1183. [Google Scholar] [CrossRef]
  56. Shen, R.; Wang, K.; Zhang, Y.; Yang, L.; Mu, J.; Zhao, L. Experimental study on crop yield, water use and root nitrogen uptake under water fertilizer coupling. Trans. Chin. Soc. Agric. Eng. 2001, 5, 35–38, (In Chinese with English Abstract). [Google Scholar]
  57. Faloye, O.T.; Alatise, M.O.; Ajayi, A.E.; Ewulo, B.S. Effects of biochar and inorganic fertiliser applications on growth, yield and water use efficiency of maize under deficit irrigation. Agric. Water Manag. 2019, 217, 165–178. [Google Scholar] [CrossRef]
  58. Ma, J.; Jiang, F.; Wang, G.; Chen, J.; Huang, G.; Liang, Y. Causes of low yield and measures for increasing yield of Korla Fragrant Pear. Deciduous Fruits 2021, 53, 77–78, (In Chinese with English Abstract). [Google Scholar]
  59. Feng, Y.; Wang, Y.; Wang, Y. Geng, W.; Fan, G.; Zhang, S. Effects of Different Fertilizer Treatments on Planting Benefit of Korla Fragrant Pear. Tianjin Agric. Sci. 2021, 27, 25–29, (In Chinese with English Abstract). [Google Scholar]
  60. Xiao, Z.; Jiang, W.; Yu, H. Research Progress on coupling effect of crop water and fertilizer. Crops 2007, 53, 18–22, (In Chinese with English Abstract). [Google Scholar]
  61. Wang, Q.D.; Chen, B.L.; Yusufujiang, Y.; Wang, C.; Chai, Z.P. Characteristics of absorption, utilization, and distribution of 15N-urea for Korla fragrant pear in spring. Ying Yong Sheng Tai Xue Bao J. Appl. Ecol. 2018, 29, 1443–1449. [Google Scholar] [CrossRef]
  62. He, C.; Ali, K.; Zare, M. Effects of Different Fertilizer Amount on Chloroplast Ultra-structure and Photosynthesis of Korla Fragrant Pear. In Proceedings of the 3rd Conference on Horticulture Science and Technology (CHST 2012), Beijing, China, 22–23 December 2012; pp. 6–14. [Google Scholar]
Figure 1. Meteorological elements of the test station.
Sustainability 14 08495 g001
Figure 2. Experimental plot layout.
Sustainability 14 08495 g002
Figure 3. Illustration of the main components of (A) the fragrant pear planting pattern, (B) irrigation method, (C) fertilization irrigation system: (1) water source from water tanks, (2) ball valve, (3) brass manometer, (4) water flowmeter, (5) fertilizer bucket, (6) filter.
Sustainability 14 08495 g003
Figure 4. Effects of different water and fertilizer treatments on the yield of fragrant pear. Note: Different letters following the values denote a significant difference at p < 0.05 according to Duncan’s test—two treatments with the same letter (a, b, c, etc.) indicates insignificant differences.
Sustainability 14 08495 g004
Figure 5. Three-dimensional surface plots of water and fertilizer input for each evaluation indicator. Field observation values of evaluation indicators are represented by blue dots in the figure. (a) Comprehensive fruit quality; (b) yield; (c) IWUE; (d) PFP; (e) net profits.
Sustainability 14 08495 g005
Figure 6. The relationship of the relative value of each evaluation index with the amounts of irrigation and fertilization.
Sustainability 14 08495 g006
Figure 7. The relationship of the relative value of each evaluation index with the amounts of irrigation and fertilization. (a): The acceptable area is the relative value ≥ 90%; (b): The acceptable area is the relative value ≥ 85%; (c): The acceptable area is the relative value ≥ 80%.
Sustainability 14 08495 g007
Table 1. Main physical properties of the soil in the study area.
Soil Depth (cm)Soil
Texture
Particle Mass Fraction (%)Soil Salt
Content (g kg−1)
Bulk
Density
(g cm−1)
Saturated Water
Content (%)
Field Water Holding
Capacity (%)
Wilting
Point (%)
SandSiltClay
0–20Sandy clay55.4836.348.188.16 1.3834.4922.316.95
20–40Sandy clay57.7235.187.110.77 1.4334.3619.147.31
40–60Sandy clay53.8237.78.4810.38 1.5036.3220.047.41
60–80Sandy clay45.9447.076.999.01 1.5034.4719.547.55
80–100Sandy clay49.1540.1710.687.62 1.3933.1418.287.85
Table 2. Fertility characteristics of 0–100 cm soil.
Organic Matter
(g kg−1)
Total Nitrogen
(g kg−1)
Total Phosphorus (%)Alkaline Hydrolyzed Nitrogen
(mg kg−1)
Available Phosphorus (mg kg−1)Available Potassium (mg kg−1)
15.00.60.139181.622.2200.9
Table 3. Irrigation schedule of Pyrus bretschneideri Rehd in the experimental area.
Growth PeriodIrrigation DateFertilization DateIrrigation Amount
(m3 ha−1)
Fertilization Amount
(kg ha−1)
W1W2W3F1F2F3F4
Budding period
(26 March 2021–8 April 2021)
7 April 2021/477614750////
Florescence
(9 April 2021–21 April 2021)
21 April 2021/477614750////
Twig growth stage
(22 April 2021–14 May 2021)
10 May 2021/477614750////
Fruit setting period
(15 May 2021–8 July 2021)
26 May 2021 477614750////
14 June 202114 June 2021477614750112.5125137.5150
30 June 202130 June 2021477614750112.5125137.5150
Fruit swelling period
(9 July 2021–28 August 2021)
16 July 202116 July 2021477614750112.5125137.5150
28 July 202128 July 2021477614750112.5125137.5150
9 August 20219 August 2021477614750112.5125137.5150
21 August 202121 August 2021477614750112.5125137.5150
Mature period
(29 August 2021–14 September 2021)
29 August 2021/477614750////
Total//525067508250675750825900
Table 4. Quality certification indicators for Pyrus bretschneideri Rehd.
Quality FactorsIndicators
Grade AGrade AGrade A
Soluble sugar≥12.5≥12.0≥11.0
Fruit shape index1.0–1.11.1–1.2>1.2, <1.0
Single fruit weigh120–160100–12080–100
Pulp hardness4.9–6.86.8–7.8>7.8, <4.9
Stone cell≤0.5≤0.6≤1.0
Table 5. Effects of different water and fertilizer treatments on the quality of fragrant pear.
TreatmentSoluble Solids (%)Vitamin C (mg 100 g−1)Titratable
Acid (%)
Total Sugar
(%)
Ratio of Sugar to AcidRatio of
Soluble Sugar to Acid
Fruit Shape IndexSingle Fruit
Weight (g)
Peel Hardness
(kg cm−2)
Pulp
Hardness
(kg cm−2)
Transverse Diameter of
Kernel (mm)
Stone Cell
(%)
W1F111.86 ± 0.26 g3.67 ± 0.43 c0.24 ± 0.06 e7.08 ± 0.04 e30.76 ± 7.29 ab51.51 ± 12.33 ab1.14 ± 0.07 abc98.52 ± 19.45 c9.98 ± 0.12 f5.98 ± 0.06 e27.36 ± 3.21 ab0.21 ± 0.03 bcd
W1F212.90 ± 0.18 cde4.15 ± 1.30c0.47 ± 0.05 a7.22 ± 0.06 de15.49 ± 1.7 e27.64 ± 2.59 e1.18 ± 0.08 ab109.07 ± 21.89 abc10.68 ± 0.61 cdef6.50 ± 0.25 cde25.73 ± 1.97 b0.28 ± 0.03 a
W1F312.67 ± 0.37 de9.61 ± 1.22b0.33 ± 0.06 cd8.05 ± 0.41 ab24.99 ± 5.3 abc39.23 ± 7.51 cd1.20 ± 0.11 a106.35 ± 23.13 abc10.35 ± 0.1 def7.02 ± 0.21 bcd27.22 ± 2.25 ab0.11 ± 0.01 ef
W1F412.02 ± 0.13 fg12.29 ± 2.30ab0.44 ± 0.07 ab7.62 ± 0.71 abcde17.66 ± 3.71 de27.66 ± 3.69 e1.13 ± 0.07 abc101.25 ± 29.06 bc10.01 ± 0.32 f6.15 ± 0.55 cde29.39 ± 2.72 a0.10 ± 0.03 f
W2F112.01 ± 0.14 fg11.90 ± 1.75 ab0.37 ± 0.03 bc7.34 ± 0.19 cde19.97 ± 2.2 cde32.62 ± 2.6 de1.17 ± 0.07 ab112.62 ± 21.43 abc10.25 ± 0.3 ef7.12 ± 0.52 abc25.32 ± 7.51 b0.22 ± 0.02 bc
W2F213.65 ± 0.20 a11.63 ± 0.63 ab0.42 ± 0.04 ab7.44 ± 0.17 bcde17.84 ± 1.87 de32.69 ± 2.78 de1.18 ± 0.08 ab123.59 ± 24.39 a11.52 ± 0.21 ab8.00 ± 0.83 a24.35 ± 3.16 b0.18 ± 0.02 cde
W2F313.47 ± 0.44 ab11.68 ± 0.34 ab0.37 ± 0.02 bc8.26 ± 0.33 a22.35 ± 1.29 cde36.44 ± 1.51 cde1.13 ± 0.06 bc118.93 ± 24.32 ab11.00 ± 0.24 abcd7.01 ± 0.62 bcd27.53 ± 4.48 ab0.14 ± 0.01 efg
W2F412.66 ± 0.10 de11.39 ± 1.88 ab0.27 ± 0.02 de8.05 ± 0.38 ab29.90 ± 2.43 ab47.02 ± 2.96 abc1.16 ± 0.09 c106.96 ± 19.18 abc10.89 ± 0.37 bcde6.52 ± 0.33 cde26.22 ± 2.5 ab0.16 ± 0.02 def
W3F113.02 ± 0.10 bcd14.16 ± 1.03 a0.31 ± 0.02 cde7.86 ± 0.07 abcd25.43 ± 1.51 abc42.12 ± 2.57 bcd1.13 ± 0.08 bc107.36 ± 13.39 abc10.45 ± 0.24 cdef7.00 ± 0.02 bcd25.68 ± 4.52 b0.19 ± 0.03 bcd
W3F213.27 ± 0.26 abc11.95 ± 2.38ab0.25 ± 0.02 de7.91 ± 0.19 abc31.77 ± 2.83 a53.25 ± 3.77 a1.17 ± 0.06 ab121.00 ± 24.62 a11.67 ± 0.74 a7.80 ± 0.39 ab25.47 ± 5.01 b0.21 ± 0.02 bc
W3F313.01 ± 0.18 bcd10.36 ± 0.64 b0.32 ± 0.05 cde8.01 ± 0.35 ab25.53 ± 4.58 abc41.35 ± 6.3 bcd1.13 ± 0.07 bc113.31 ± 31.69 abc11.12 ± 0.22 abc6.98 ± 0.82 bcd27.52 ± 4.47 ab0.24 ± 0.02 ab
W3F412.48 ± 0.35 ef9.98 ± 1.80 b0.33 ± 0.03 cd8.01 ± 0.34 ab24.44 ± 2.39 bcd38.15 ± 4.59 cde1.09 ± 0.06 c105.6 ± 14.99 abc11.00 ± 0.18 abcd6.12 ± 0.31 de31.14 ± 3.31 a0.21 ± 0.02 bcd
Double factor variance analysis
W21.900 **32.422 **8.557 **5.927 **6.228 **6.785 **5.639 **2.495 *17.561 **7.864 **4.077 **9.155 **
F33.806 **2.968 *4.752 *8.603 **1.7211.3572.6655.897 **13.933 **9.426 **1.69815.254 **
W × F5.695 **13.260 **11.698 **1.3769.631 **11.071 **2.3571.1560.5562.1351.34911.938 **
Note: The values are expressed as mean ± standard deviation. Different letters following the values denote a significant difference at p < 0.05 according to Duncan’s test—two treatments with the same letter (a, b, c, etc.) indicate insignificant differences, * denotes a significant difference at the 0.05 level, ** denotes a significant difference at the 0.01 level. p denotes significance level, W denotes irrigation, F denotes fertilization.
Table 6. Factor loadings and variance contribution rates of the principal components.
Indicator VariablesFactor Loading
Principal Components
1234
Soluble sugar (X1)0.8850.0030.1430.219
Vitamin C (X2)0.4580.1590.657−0.288
Soluble solids (X3)0.058−0.9500.2690.090
Total sugar (X4)0.3110.5100.6950.009
Fruit shape index (X5)0.396−0.355−0.471−0.579
Peel hardness (X6)0.8300.2160.0580.412
Pulp hardness (X7)0.945−0.047−0.079−0.193
Ratio of sugar to acid (X8)−0.0200.966−0.230−0.103
Ratio of soluble sugar to acid (X9)0.0740.923−0.357−0.071
Fruit weight (X10)0.951−0.0930.0330.134
Transverse diameter of kernel (X11)−0.6440.1890.5750.328
Stone cell (X12)0.132−0.092−0.6410.665
Characteristic value4.1713.1992.1611.266
Variance contribution rates/%34.76026.65618.01010.551
Contribution rates/%34.76061.41679.42689.977
Table 7. Principal component score and comprehensive evaluation of different water and fertilizer treatments.
TreatmentPrincipal ComponentOverall ScoreOverall Ranking
1234
W1F10.0050.394−0.3850.2250.23812
W1F20.736−0.069−0.2420.6621.08710
W1F30.9630.3680.465−0.3681.4278
W1F40.3810.1560.578−0.2980.81711
W2F10.7640.0380.2520.1131.1679
W2F21.8320.1730.4890.4092.9023
W2F31.5100.5180.8400.2923.1602
W2F40.9420.6810.5460.1182.2876
W3F10.9990.5200.6880.2392.4465
W3F21.8350.7830.3740.4273.4201
W3F31.2950.5300.3870.5972.8094
W3F40.8790.4890.3600.4962.2247
Table 8. Effects of different water and fertilizer treatments on irrigation water use efficiency, fertilizer partial productivity, and net profits.
TreatmentIWUE (kg m−3)PFP (kg kg1)G(CNY ha−1)WC(CNY ha−1)FC(CNY ha−1)L(CNY ha−1)N(CNY ha−1)
W1F11.94 ± 0.04 f15.11 ± 0.3e77,907 ± 1528 i11173375105072,365 ± 1528 g
W1F22.29 ± 0.19 bcd16.00 ± 1.33e105,600 ± 8800 efg11173750116799,567 ± 8800 ef
W1F32.00 ± 0.10 ef12.73 ± 0.61f94,006 ± 4476 gi11174125128387,481 ± 4476 fg
W1F42.23 ± 0.10 cd13.00 ± 0.56f90,894 ± 3884 efg11174500140083,878 ± 3884 fg
W2F12.11 ± 0.05 bc21.11 ± 0.52c104,378 ± 6610 abc14383375135095,856 ± 3211 ef
W2F22.56 ± 0.01 a23.00 ± 0.07b143,365 ± 416 abc143837501500136,677 ± 416 bc
W2F32.33 ± 0.11 def19.09 ± 0.91d125,857 ± 9455 cde143841251650121,396 ± 6632 cd
W2F42.00 ± 0.07 ef15.00 ± 0.56e115,133 ± 12,617 def143845001800110,448 ± 10,162 de
W3F12.18 ± 0.10 abc26.67 ± 1.19a139,740 ± 29,157 bc176333751650126,414 ± 24,365 bcd
W3F22.45 ± 0.09 ab27.00 ± 1.00 a151,441 ± 5609 ab176337501833144,095 ± 5609 ab
W3F32.36 ± 0.18 cde23.64 ± 1.82 b163,281 ± 14,885 a176341252017158,241 ± 13,127a
W3F42.00 ± 0.07 ef18.33 ± 0.67 d131,993 ± 4800 bcd176345002200123,530 ± 4800 cd
W1F11.94 ± 0.04 f15.11 ± 0.3e77,907 ± 1528 i11173375105072,365 ± 1528 g
Double factor variance analysis
W336,322 **6674 **10,669 ** 17,970 **
F91,067 **21,657 **70,008 ** 90,656 **
W × F8650 **6787 **1629 ** 2323
Note: The values are expressed as mean ± standard deviation. Different letters following the values denote a significant difference at p < 0.05 according to Duncan’s test—two treatments with the same letter (a, b, c, etc.) indicate insignificant differences, * denotes a significant difference at the 0.05 level, ** denotes a significant difference at the 0.01 level. p denotes significance level, W denotes irrigation, F denotes fertilization.
Table 9. Regression model between water and fertilizer input and evaluation indices.
Output Variables YRegression EquationR2p
Comprehensive fruit quality/Y1Y1= −3.24 × 10⁻⁷ W2 − 1.95 × 10⁻⁶ WF − 8.82 × 10⁻⁵ F2 + 6.53 × 10⁻³ W + 0.155 F − 83.11110.965 <0.01
Yield/Y2Y2= −2.11 × 10⁻⁴ W2 − 5.82 × 10⁻³ WF − 0.079 F2 + 10.003 W + 150.297 F – 80,3970.986 <0.01
IWUE/Y3Y3= −5.64 × 10⁻⁸ W2 − 2.98 × 10⁻⁷ WF − 2.44 × 10 – 5 F2 + 1.06 × 10⁻³ W + 0.040 F − 83.1110.875 <0.01
PFP/Y4Y4= −4.00 × 10⁻⁷ W2 − 7.01 × 10⁻⁶ WF − 1.94 × 10⁻⁴ F2 + 0.01438 W + 0.321 F − 83.1110.988 <0.01
Net profits/Y5Y5= −2.49 × 10⁻³ W2 − 1.33 × 10⁻² WF − 2.044 F2 + 41.569 W + 3138.541 F – 1,311,0720.986 <0.01
Publisher’s Note: MDPI stays neutral with regard to jurisdictional claims in published maps and institutional affiliations.

