Article

Responses of Vegetation Autumn Phenology to Climatic Factors in Northern China

1
School of Horticulture and Plant Protection, Joint International Research Laboratory of Agriculture and Agri-Product Safety of the Ministry of Education, Yangzhou University, Yangzhou 225009, China
2
Jiangsu Key Laboratory of Agricultural Meteorology, Collaborative Innovation Center on Forecast and Evaluation of Meteorological Disasters, Nanjing University of Information Science & Technology, Nanjing 210044, China
3
College of Hydraulic Science and Engineering, Yangzhou University, Yangzhou 225009, China
4
College of Physical Science and Technology, Yangzhou University, Yangzhou 225002, China
*
Author to whom correspondence should be addressed.
Sustainability 2022, 14(14), 8590; https://doi.org/10.3390/su14148590
Submission received: 20 May 2022 / Revised: 28 June 2022 / Accepted: 12 July 2022 / Published: 13 July 2022
(This article belongs to the Section Sustainability in Geographic Science)

Abstract

:
Understanding the dynamics of vegetation autumn phenology (i.e., the end of growing season, EOS) is crucial for evaluating impacts of climate change on vegetation growth. Nevertheless, responses of the EOS to climatic factors were unclear at the regional scale. In this study, northern China was chosen for our analysis, which is a typical ecologically fragile area. Using the Enhanced Vegetation Index (EVI) and climatic data from 1982 to 2016, we extracted the EOS and analyzed its trends in northern China by using the linear least-squares regression and the Bayesian change-point detection method. Furthermore, the partial correlation analysis and multivariate regression analysis were used to determine which climatic factor was more influential on EOS. The main findings were as follows: (1) multi-year average of EOS mainly varied between 275 and 305 day of year (DOY) and had complicated spatial differences for different vegetation types; (2) the percentage of the pixel showing delaying EOS (65.50%) was larger than that showing advancing EOS (34.50%), with a significant delaying trend of 0.21 days/year at the regional scale during the study period. As for different vegetation types, their EOS trends were similar in sign but different in magnitude; (3) temperature showed a dominant role in governing EOS trends from 1982 to 2016. The increase in minimum temperature led to the delayed EOS, whereas the increase in maximum temperature reversed the EOS trends. In addition to temperature, the impacts of precipitation and radiation on EOS trends were more complex and largely depended on the vegetation types. These findings can provide a crucial support for developing vegetation dynamics models in northern China.

1. Introduction

It has been observed that a continued rise in surface temperature has led to more extreme climate events and profoundly influenced vegetation growth and ecosystem stability [1]. Phenology is considered a key indicator for understanding the vegetation dynamics and impacts of climate change on the terrestrial ecosystem [2,3]. Furthermore, it also has significant feedback on regional climate through land-climate interactions [4,5]. Autumn phenology is a crucial parameter for reflecting the end date of vegetation growing season (EOS) and influencing the length of vegetation growth [6,7]. Thus, it is necessary to study the responses of EOS to climatic factors, which can deepen our understanding of vegetation dynamics under the background of climate change.
With the rapid acquisition of multi-source satellite data in the past few decades, monitoring EOS has made great progress through the use of spectral indices—e.g., the Normalize Difference Vegetation Index (NDVI), Enhanced Vegetation Index (EVI), etc.—at the larger spatial scales [8,9,10]. However, previous work found that the inconsistent trends of EOS, e.g., advanced, delayed, and unchanged, have been detected across different regions over the Northern Hemisphere [11,12,13]. For example, EOS had a delaying trend before 2000, followed by a reversal from 2000 to 2015 over the Northern Hemisphere [14]. However, Wang et al. [15] reported that EOS had no trend during the warming hiatus of 1998–2012. Furthermore, trends of EOS were more heterogeneous at the regional scale over Northern Hemisphere [16,17,18].
On the other hand, the climate-driven factors of EOS were still unclear [19,20]. The meta-analysis of published EOS studies demonstrated that temperature was the dominant controlling factor affecting EOS [21]. However, the results from different temperature indices were inconsistent. Specifically, Wu et al. [22] found that maximum and minimum temperatures had an asymmetric effect on EOS, causing a low explanation of the mean temperature of EOS. Apart from temperature, precipitation and solar radiation also contributed to autumn leaf senescence and had different sensitivities of EOS at the spatial scale [23,24,25]. Although these findings suggested that the EOS-climate relationships were complex, there has been little progress toward quantifying the relative importance of these climatic factors affecting regional-scale EOS variations.
Northern China, accounting for about 56.9% of China’s land area, is an ecologically fragile area. An evident warming trend above 0.3 °C/decade has been found in this region during the recent decades [26], which has profoundly impacted vegetation growth [27,28,29]. Although some studies have been reported EOS in northern China using satellite NDVI data [30,31,32], the NDVI data was more saturated at higher biomass levels due to leaf canopy variations [33,34]. Comparatively, the Enhanced Vegetation Index (EVI) is an optimized vegetation index designed to enhance the vegetation signal [35,36]. However, EVI-based long-term changes of EOS, e.g., the trend and potential turning point, were still unclear in this region. Furthermore, previous studies have mainly reported the impacts of mean temperature and precipitation on EOS in northern China [31,32]. However, the relative importance of different climatic factors, including minimum temperature, maximum temperature, precipitation, and solar radiation on EOS variations, were still unclear in this region. Given the complex climate-vegetation relationships, it is necessary and beneficial to quantify the climatic factors affecting EOS dynamics in northern China. Therefore, our major research purposes were (1) to analyze the long-term variation in EOS from 1982 to 2016 using the EVI data, and (2) to comprehensively evaluate impacts of different climatic factors on EOS. Answers to these scientific questions may provide a valuable reference for developing vegetation dynamics models in northern China.

2. Materials and Methods
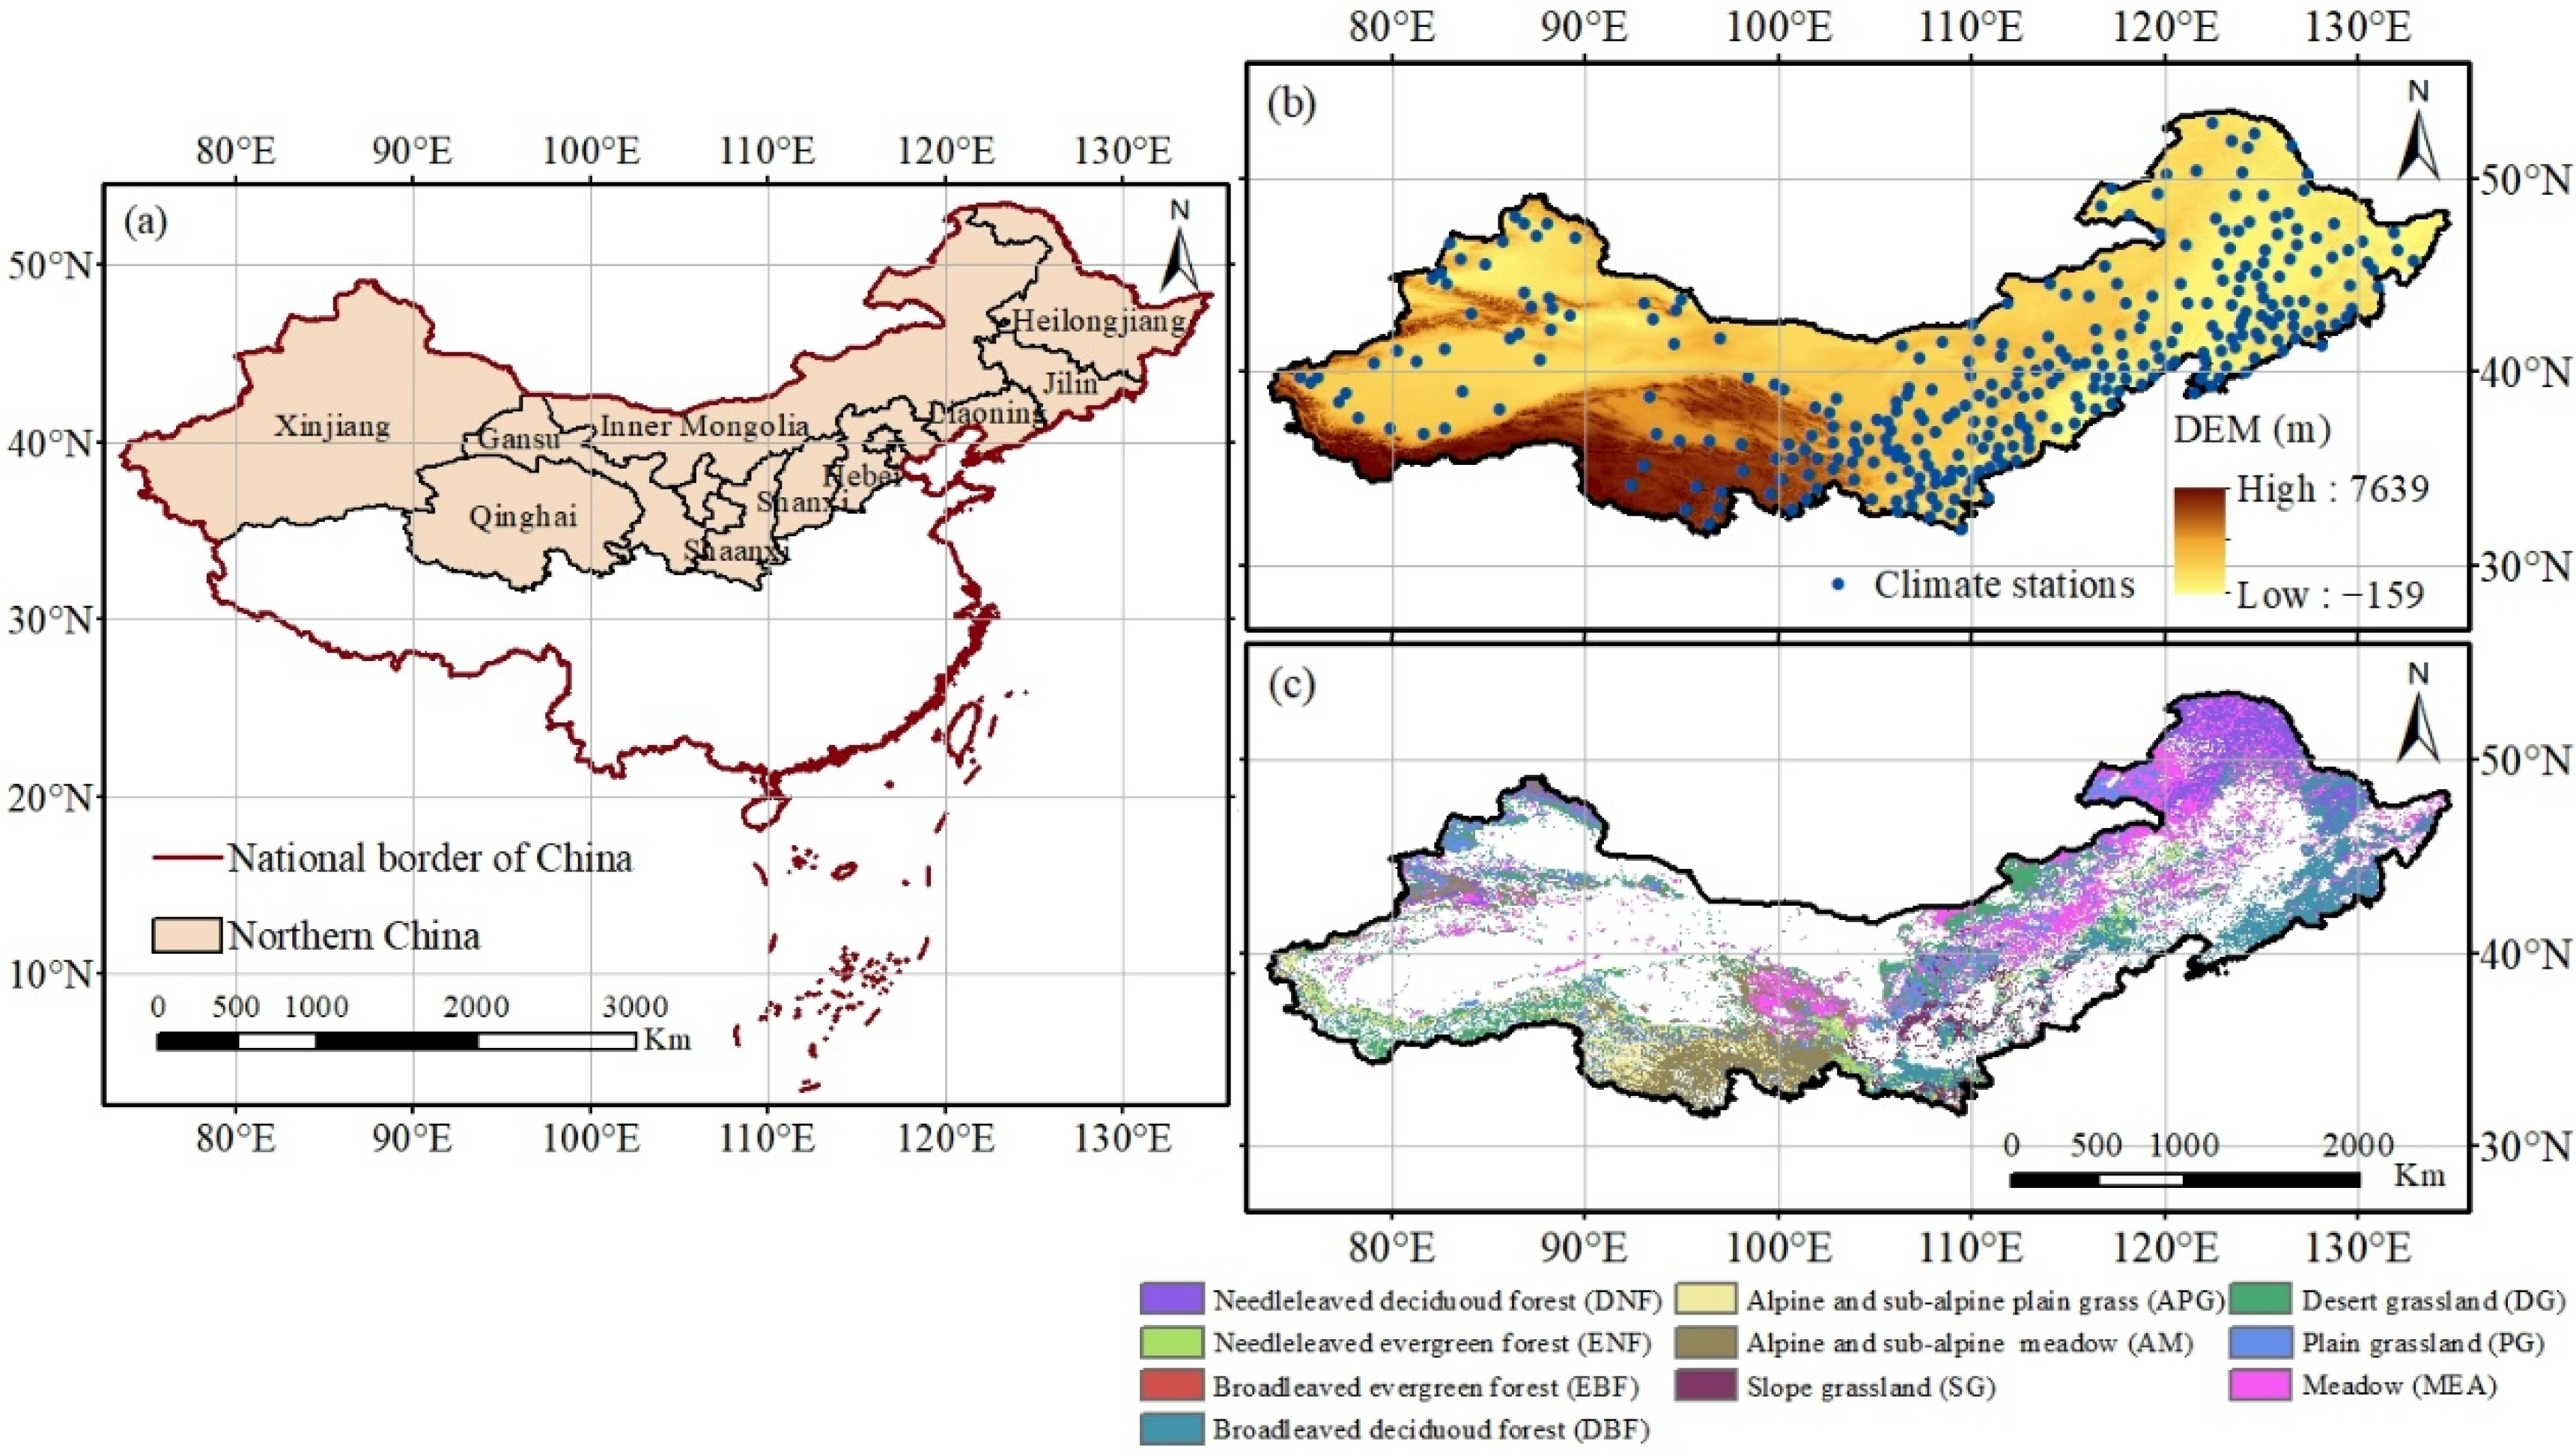
2.1. Study Region

Located in the northeast, north, and northwest China (Figure 1a), northern China (97°12′ E–135°05′ E, 34°34′ N–53°33′ N) had an area of 2.35 × 10⁶ km2. The eastern part of the study area is dominated by plains, while plateaus and basins are distributed in the mid-west (Figure 1b). Under the complex circulation system, the climate ranged from temperate monsoon climate in the east to temperate continental climate in the mid-west, characterized by warm summers and cold winters. Although precipitation is mainly occurring in summer, annual precipitation had a larger spatial difference, ranging from 50 mm in the west to 1200 mm in the east. Due to uneven hydrothermal conditions, the central and eastern parts of northern China were dominated by forest, cropland, and grassland, while grassland, desert, and Gobi mainly characterized the western parts (Figure 1c).

2.2. Data

The EVI data was widely used to monitor phenological changes in previous studies [35,36], which reduced sensitivity to soil, litter, woody tissues, and atmospheric effects but remained sensitive to variation in canopy density where NDVI saturated [33]. In this study, a two-band EVI dataset with 5 km spatial resolution and 7 day temporal resolution was used to extract EOS in northern China from 1982 to 2016, which can be composed of the following satellites: AVHRR (1981–1999), SPOT (1998–2002) and MODIS (2000–2016). These EVI data have been corrected by vigorous quality control and can be downloaded at https://vip.arizona.edu/viplab_data_explorer.php (accessed on 1 May 2021).
Monthly minimum temperature (Tmin), maximum temperature (Tmax), precipitation (Pre), and solar radiation (Rad) datasets were collected from 312 stations spanning 1981–2016 in northern China (http://www.nmic.cn/, accessed on 1 January 2020). The raster images of monthly climate data were generated based on the Kriging method, which had a spatial resolution of 5 km.
Northern China was divided into 11 clusters based on a vegetation cluster map from the Chinese Academy of Sciences (https://www.resdc.cn/, accessed on 1 January 2021). However, the crop was removed because of the impact of human management. Finally, ten vegetation types were included.

2.3. Methods

2.3.1. Retrieval of the EOS from EVI Data

Several methods have been proposed to monitor phenology metrics, e.g., the threshold method, derivative method, etc. [37]. Comparative studies have suggested that the dynamic threshold method was suitable for monitoring EOS in previous studies [38,39]. Therefore, this method was used in this study. The EVI ratio was calculated for each pixel according to the Equation (1):
EVIratio = (EVIt − EVImin)/(EVImax − EVImin),
where EVIt is the EVI value at a given day of the year (DOY) and EVImax (EVImin) is the annual maximum (minimum) EVI value.
According to previous studies [39,40], we applied 0.5 as the dynamic threshold. The EOS was defined as the first day when the EVI ratio decreased by 0.5 in this region. The TIMESAT software was used to extract the EOS, which can be downloaded at http://www.nateko.lu.se/timesat/timesat.asp, accessed on 10 May 2021.

2.3.2. Interannual Variation of EOS

A linear least-squares regression was calculated trends of EOS for each pixel in our study. The trend was calculated for each pixel according to the Equation (2):
T E O S = n × i = 1 n i × E O S i i = 1 n i × i = 1 n E O S i n × i n i 2 ( i n i ) 2 ,
where TEOS is the trend of EOS, n is the years, and EOSi is the EOS in the i th year. A negative TEOS denotes an advancing trend of EOS, whereas a positive one denotes a delaying trend. The significance level of 5% was determined in this study.
Subsequently, a ‘Rbeast’ R software package was used to detect the turning point of EOS. As a Bayesian-based model, the probability function of this package could provide the exact number of turning points and the year in which the turning point occurs [41]. More details can be found at https://cran.r-project.org/web/packages/Rbeast/index.html (accessed on 20 May 2022).

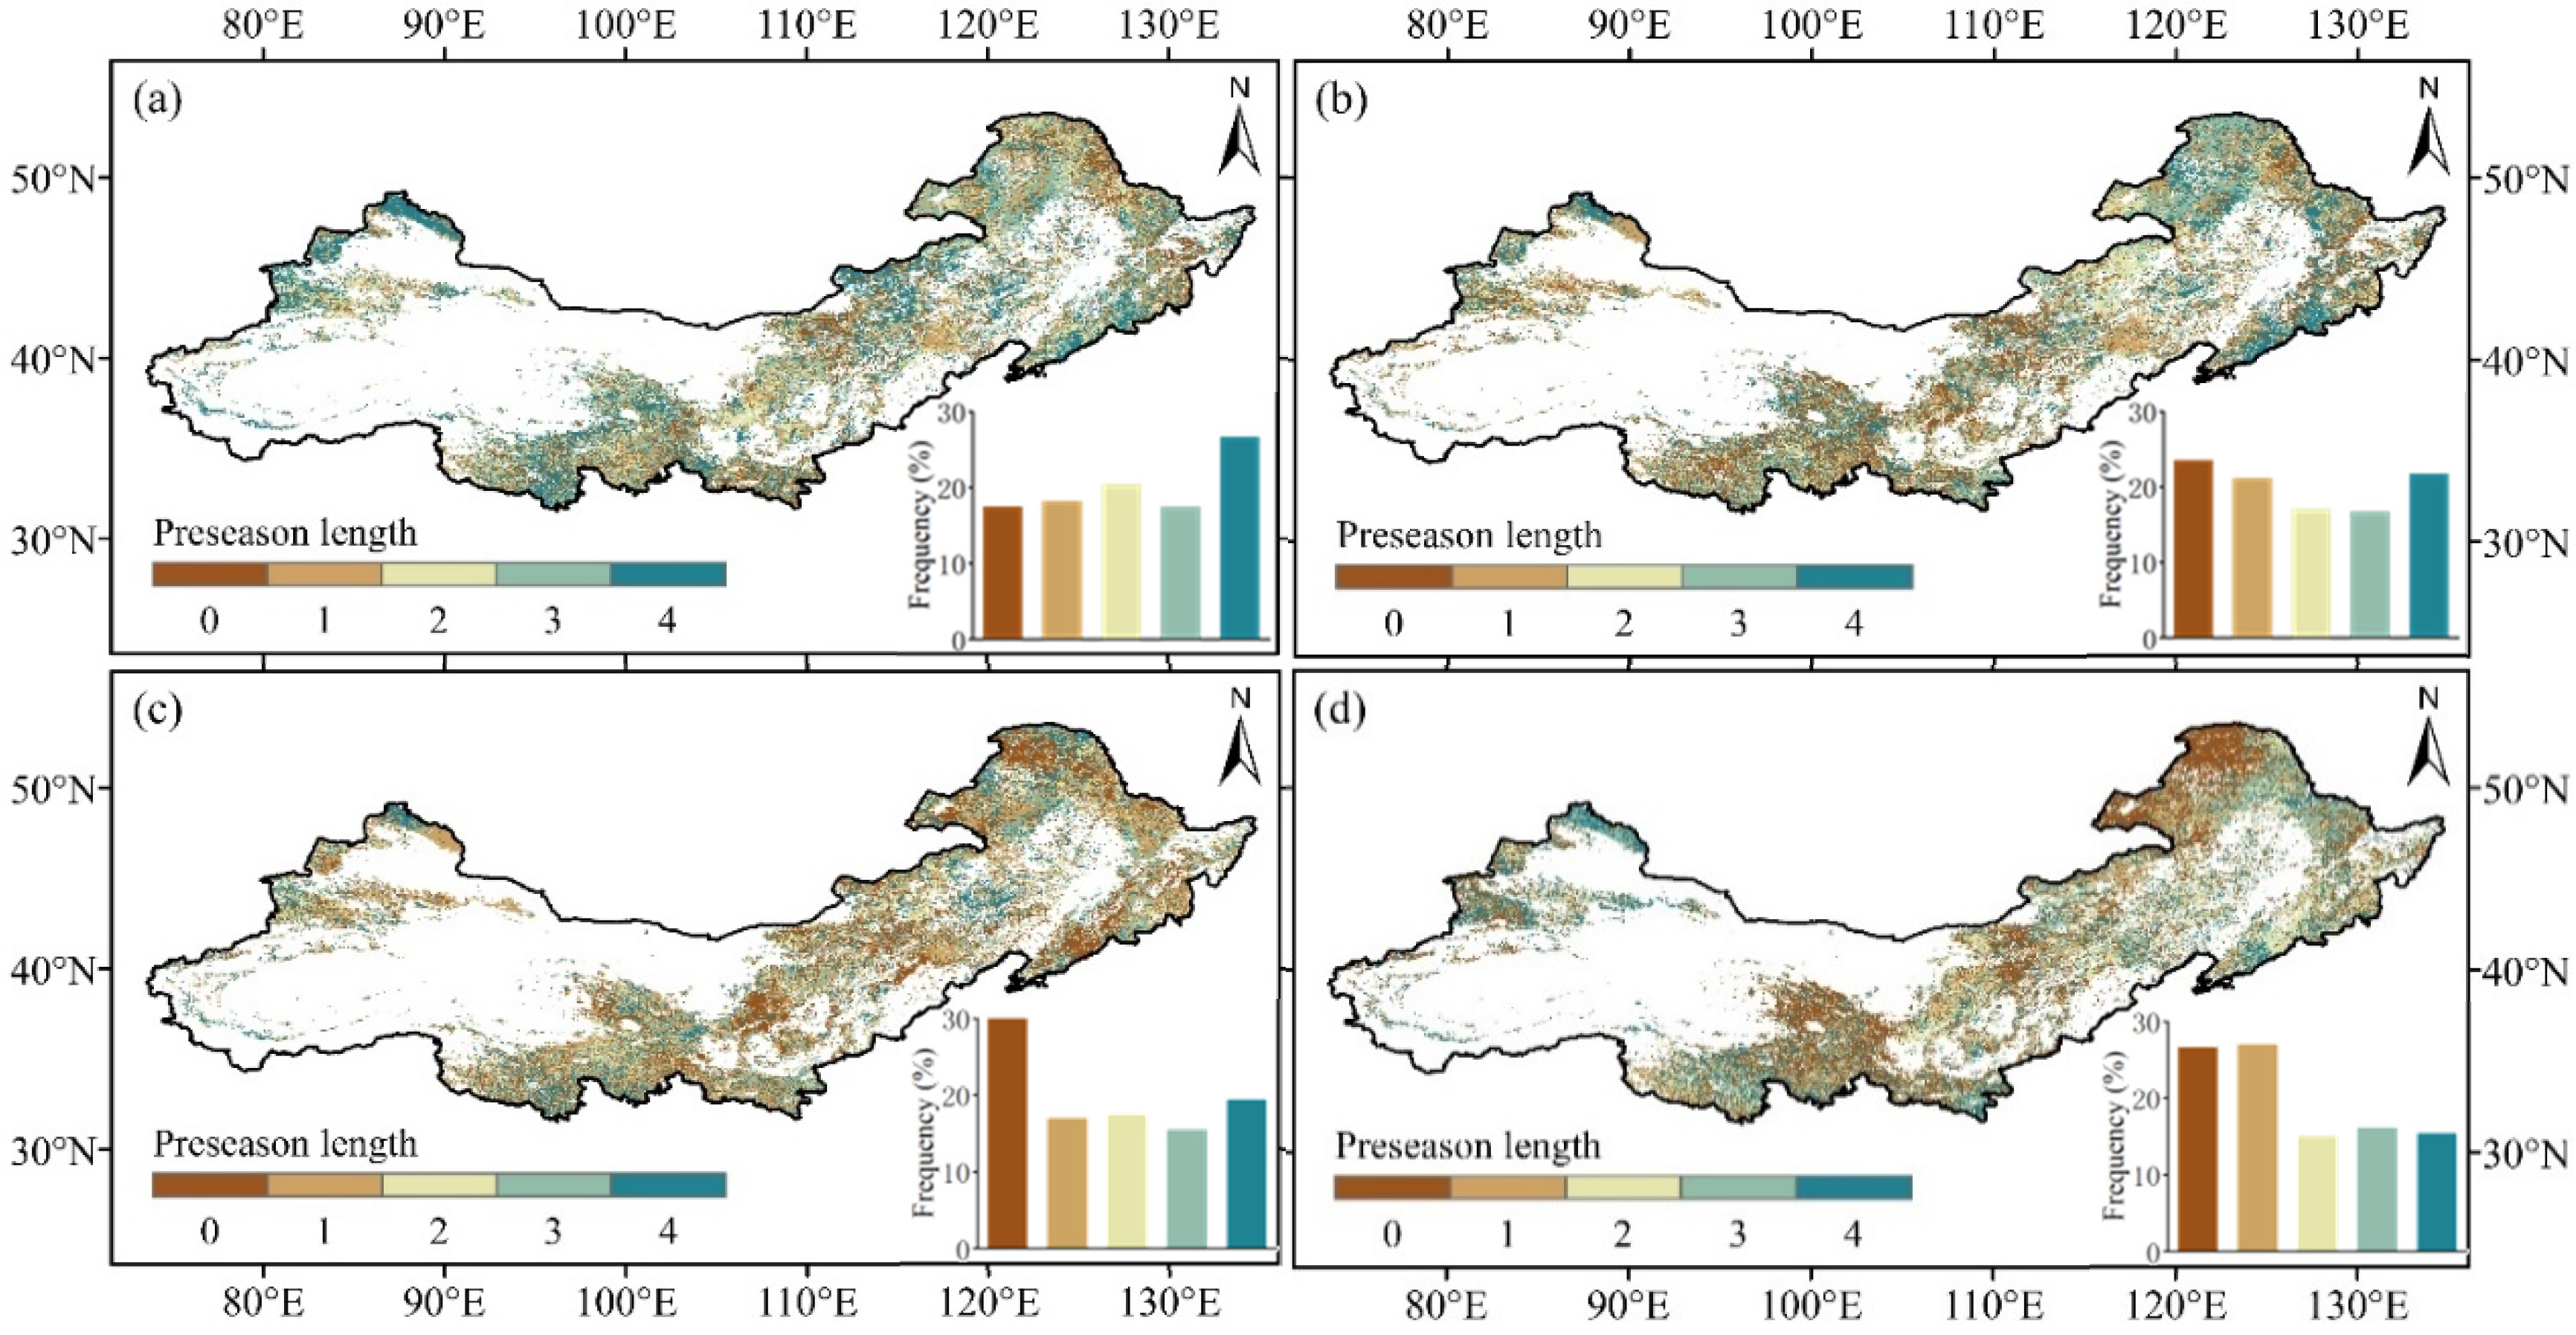
2.3.3. Determination of the Length of Preseason Climatic Factors

Some studies have found that climatic factors have produced a cumulative effect on vegetation phenology [3,42]. According to Wu et al. [43], the length of preseason climatic factors was determined with the partial correlation analysis. Taking Tmin as an example, we calculated the partial correlation coefficients between EOS and Tmin during 1, 2, 3, 4, and 5 months before EOS while controlling the other climatic factors. By comparing these partial correlation coefficients, we obtained the optimal preseason length of Tmin for each pixel. Similar steps were also used for other climatic factors to determine the preseason length for each climatic factor at the pixel scale.

2.3.4. Multivariate Regression Analysis

In order to further understand the sensitivity of EOS to different preseason climatic factors, we used the gridded data of EOS and climatic factors to calculate slopes between EOS and these climatic factors for each pixel based on the multivariate regression analysis. The calculation formula is as follows:
EOS = α × Tmin + β × Tmax + γ × Pre + δ × Rad + θ,
where EOS is the annual time series of EOS values. α, β, γ, and δ are the regression coefficients for Tmin, Tmax, Pre, and Rad, respectively. θ is the intercept of the regression model.
Furthermore, the standard regression coefficient for each pixel was also calculated using Equation (3). According to the absolute highest standard regression coefficient and significance level, the most related factor controlling EOS was determined for each pixel.

3. Results

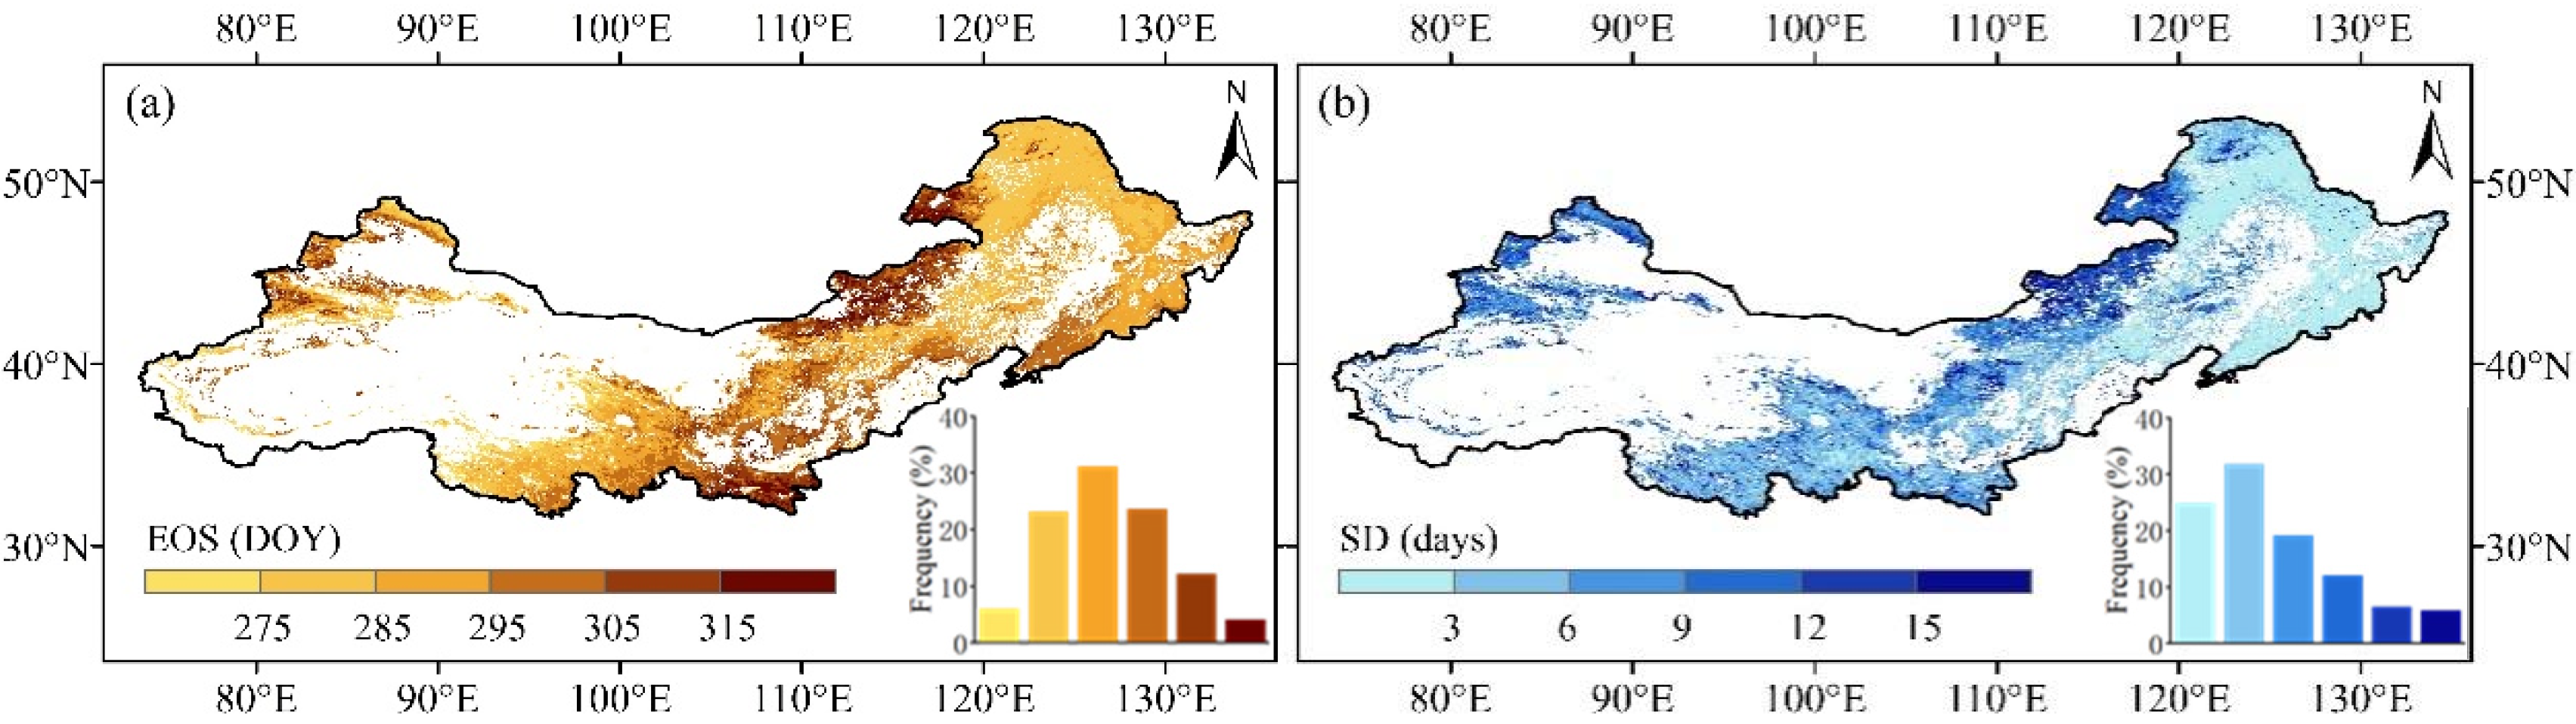
3.1. Spatial Distributions of EOS in Northern China

Figure 2 shows spatial distributions of mean and standard deviation (SD) of EOS in northern China from 1982 to 2016. As shown in Figure 2a, the multi-year average of EOS mainly ranged between 275 and 305 DOY (i.e., early October to the end of October) with a mean of 291.77 DOY (i.e., mid-October), which accounted for more than 66% of the pixels. Earlier EOS (<275 DOY) were mainly found in the regions of higher latitudes, e.g., southwestern Qinghai and central Xinjiang, accounting for 6.07% of the pixels. However, areas with the delayed EOS (>305 DOY) accounted for 16.19% of the pixels in southern Gansu, southern Shaanxi, and central-north Inner Mongolia. During the past 35 years, over 75% of the pixels had a lower SD of EOS (<9 days) (Figure 2b). However, 12% of the pixels located in central-north Inner Mongolia and northern Xinjiang exhibited a larger SD (>12 days).
Table 1 lists the mean and SD of EOS for different vegetation types in northern China. As shown in Table 1, the mean EOS of almost all vegetation types ranged from 282 to 300 DOY (i.e., mid-October to the end of October). However, EBF had the delayed EOS reaching 313.15 ± 6.35 DOY. As for the SD of EOS at the vegetation type scale, the SD values of forest types (<7 d) were lower than that of meadow and grassland types (>9 d).

3.2. Inter-Annual Variations of EOS in Northern China

Inter-annual variations of mean EOS in northern China can be shown in Figure 3. As shown in Figure 3a, regional time-series of mean EOS had a slightly advancing trend of 0.02 days/year between 1982 and 1992, and then delayed rapidly at a rate of 0.35 days/year (p < 0.05) during 1992–2007. However, EOS advanced slightly in recent 10 years (2007–2016). In general, EOS showed a significantly delaying trend with 0.21 days/year (p < 0.05) in northern China during the study period. To identify the spatial pattern of EOS trends, we calculated their trends at the pixel scale (Figure 3b). From 1982 to 2016, a delaying trend of EOS accounted for 65.50% of pixels. Among them, pixels with the significant positive trend accounted for 48.38%, which were located in central-north Inner Mongolia and northern Xinjiang. In contrast, pixels with significant advancing EOS were only 12.87% and distributed in a small segment of the northern Northeast China, southern Qinghai, and the junction of Inner Mongolia and Shaanxi. Figure 3c shows the EOS trends of different vegetation types in northern China. All vegetation types showed delaying trends of EOS. Specifically, the grassland and meadow had the relatively higher delaying trends.

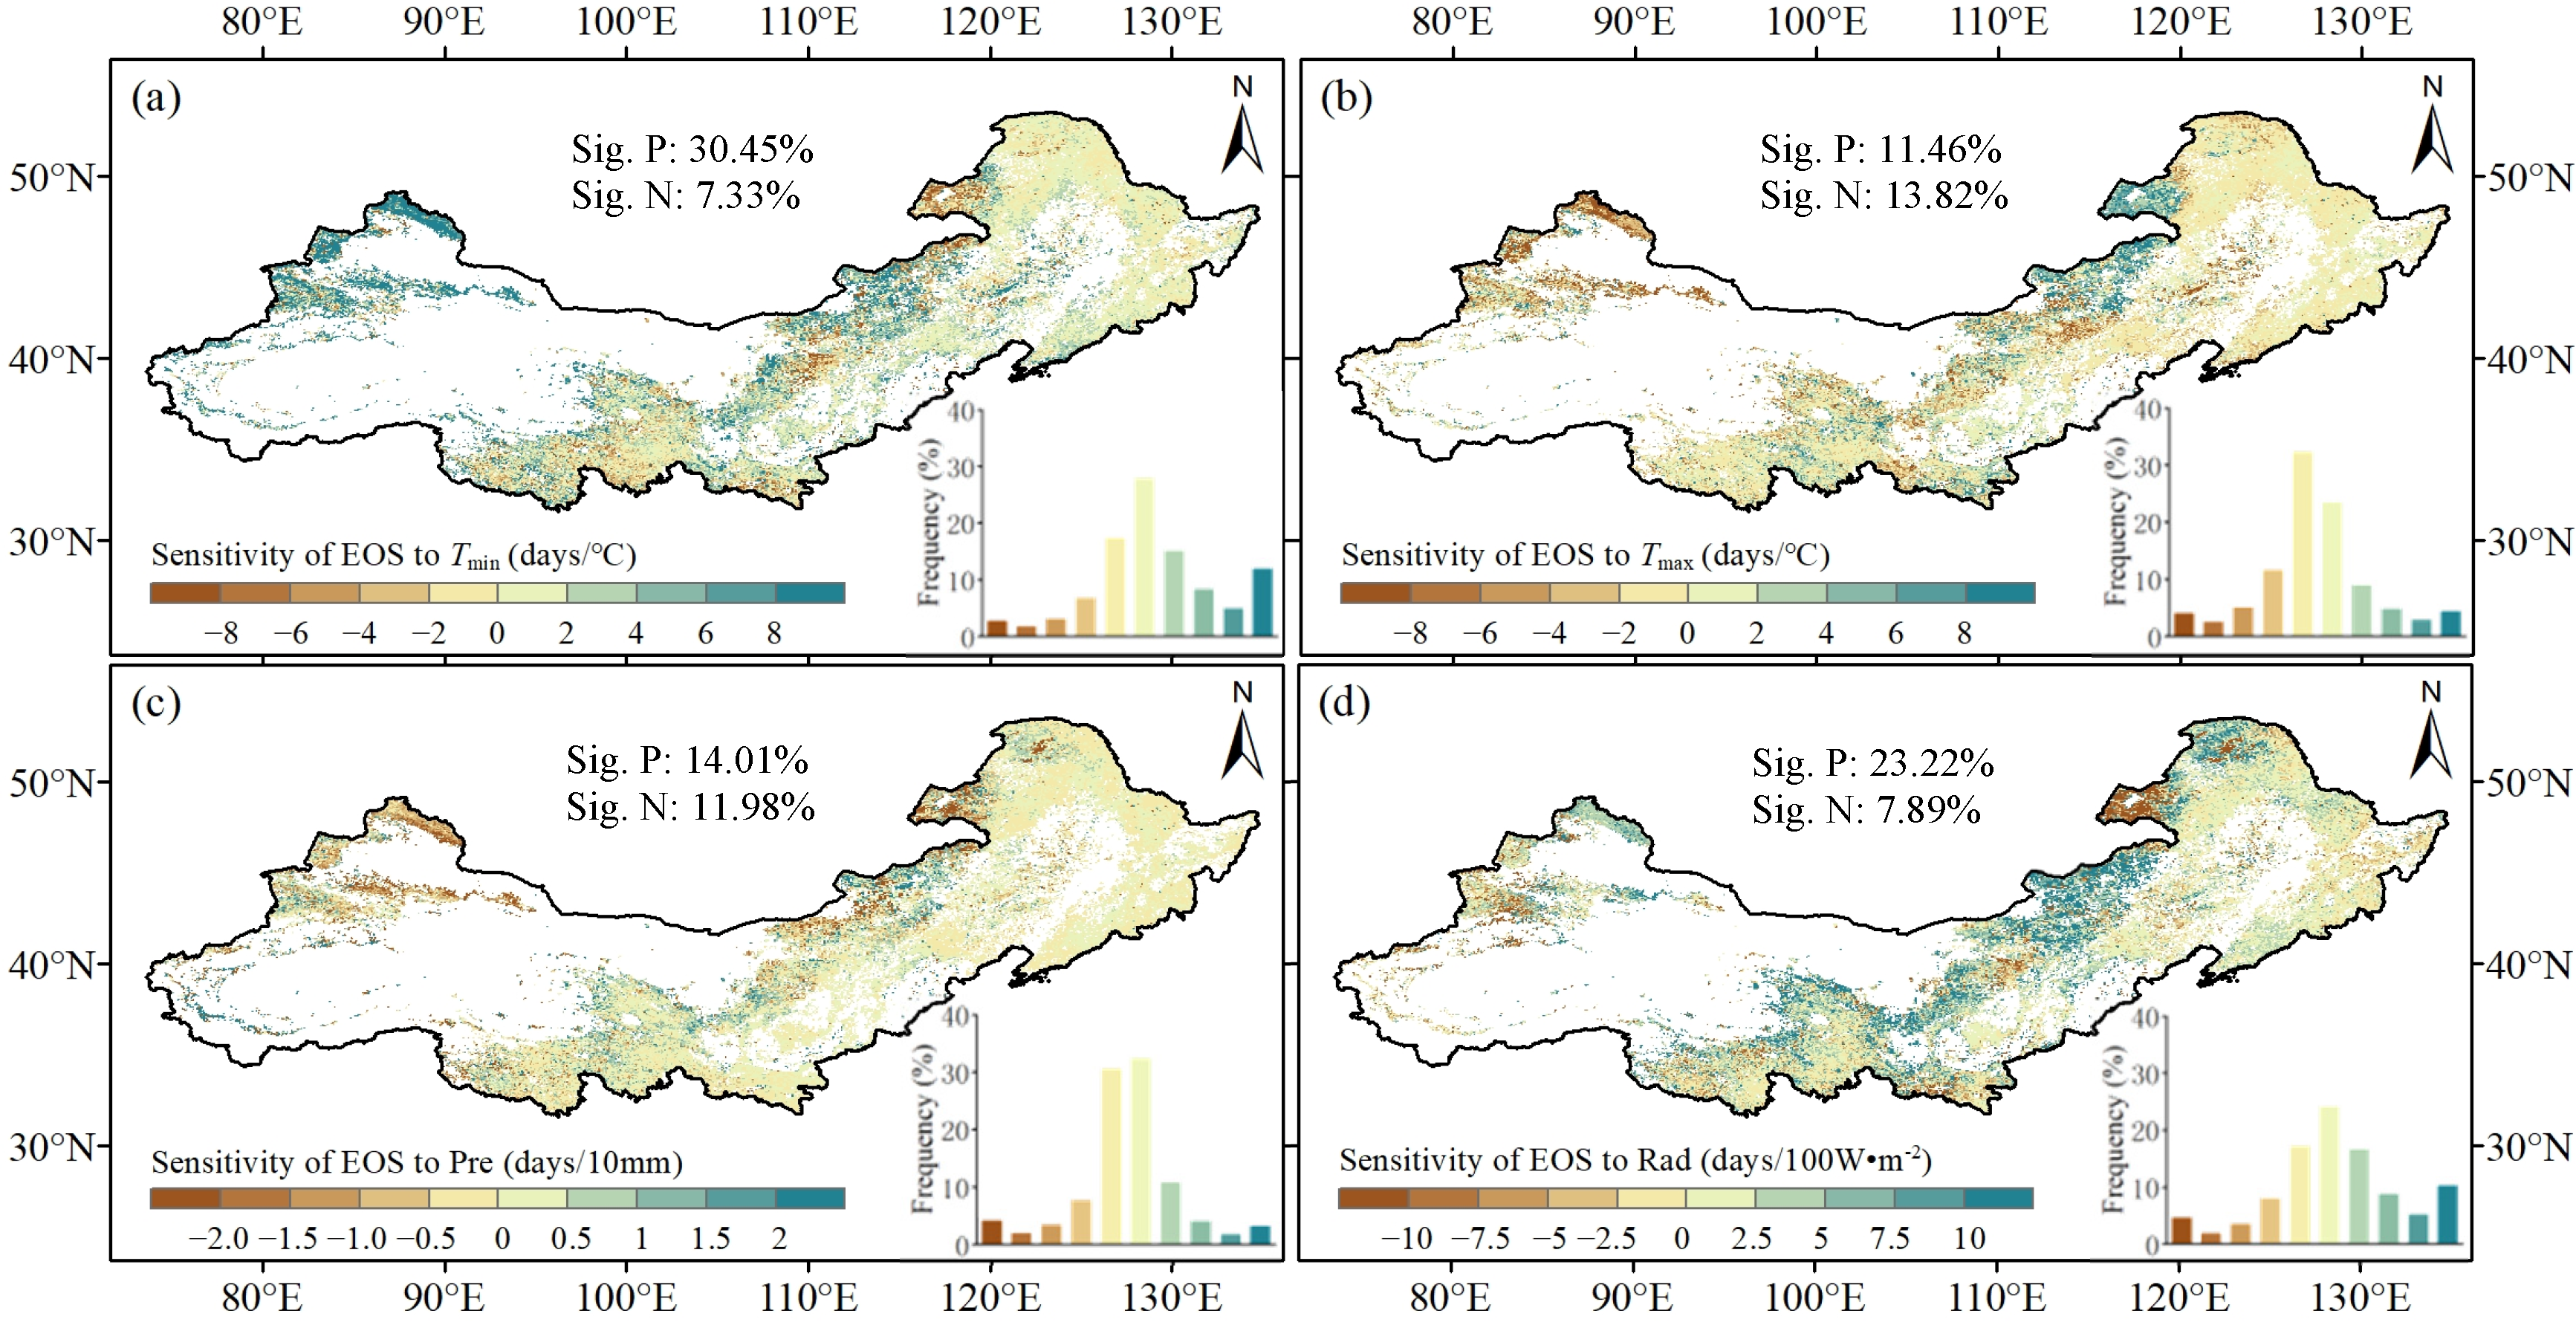
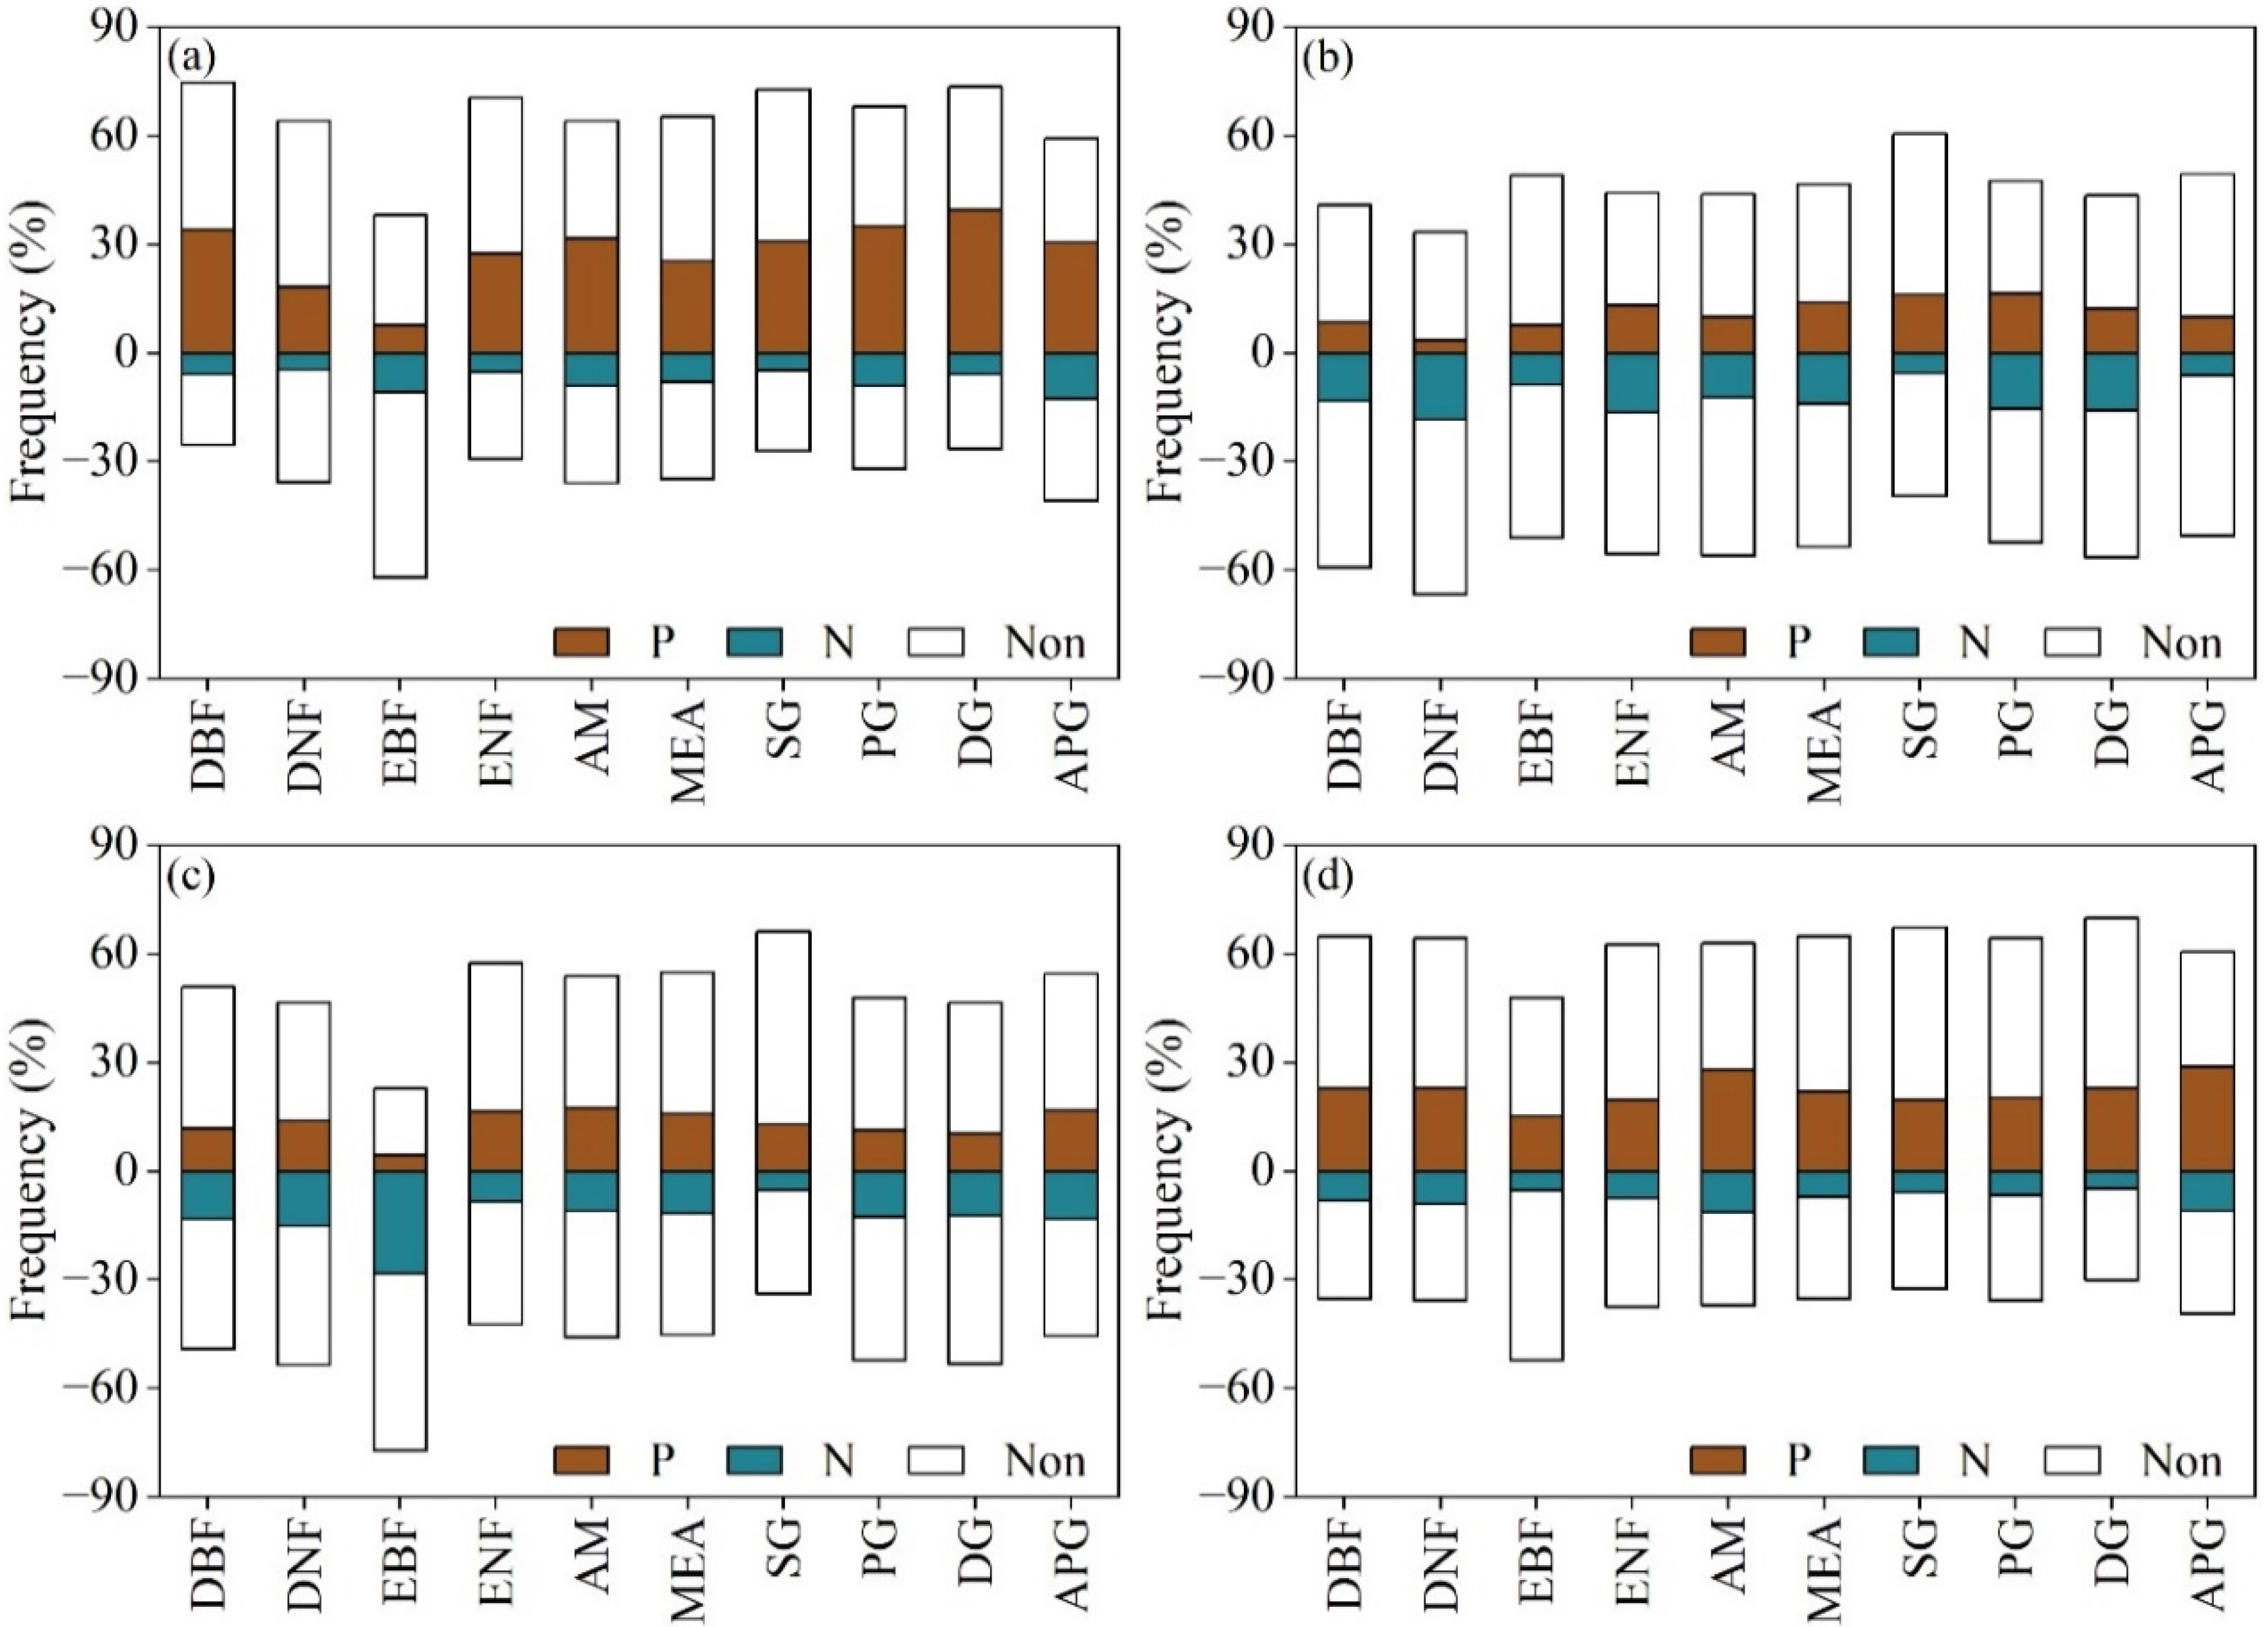
3.3. The Sensitivity of EOS to Climatic Factors in Northern China

Figure 4 demonstrates the preseason length of different climatic factors. As shown in Figure 4a–d, the preseason length for these climatic factors mainly varied between 0 and 3 months, which was in agreement with previous studies [43,44]. Therefore, the sensitivity of EOS to preseason climatic factors was calculated at the pixel scale (Figure 5). As shown in Figure 5a, EOS exhibited a positive sensitivity with Tmin, accounting for 68.23% of all pixels. Pixels with a sensitivity larger than 4 days/°C accounted for 25.22%, mainly distributed in central Inner Mongolia, northern Xinjiang, and central Northwest China. This finding indicated that the increase in preseason Tmin generally caused a delayed EOS. However, the EOS for nearly 55% of the pixels had a negative sensitivity with preseason Tmax (Figure 5b), which meant Tmin and Tmax had an asymmetric effect on EOS. In addition to temperature, the sensitivity of EOS to preseason Pre and Rad showed high spatial heterogeneity (Figure 5c,d). Over 52% of the pixels had a positive sensitivity between EOS and preseason Pre. The sensitivity greater than 1 day/10 mm was mainly located in central-north Inner Mongolia, central Northwest China, and southern Xinjiang (Figure 5c), which indicated that if preseason precipitation increased by 10 mm, corresponding EOS could likely increase by more than one day in these regions. The EOS for 64.84% of the pixels had a positive sensitivity with preseason Rad, and pixels with a sensitivity larger than 5 days/100 W·m−2 accounted for 24.16% (Figure 5d), primarily located in central Inner Mongolia, northern Northeast China, central Northwest China, and northern Xinjiang.
For different vegetation types, the sensitivity of EOS to preseason climatic factors was complex (Figure 6). EOS of almost all vegetation types showed positive sensitivity with preseason Tmin (Figure 6a). Nevertheless, EOS of forest and meadow showed negative sensitivity with preseason Tmax (Figure 6b), which meant the asymmetric effect was found in the temperature-EOS relationship for these vegetation types. As shown in Figure 6c, the sensitivity between EOS and precipitation was mainly positive in ENF, AM, MEA, SG, and APG, while it was negative in the remaining vegetation types. Interestingly, all the vegetation types showed a positive sensitivity between EOS and preseason Rad (Figure 6d).

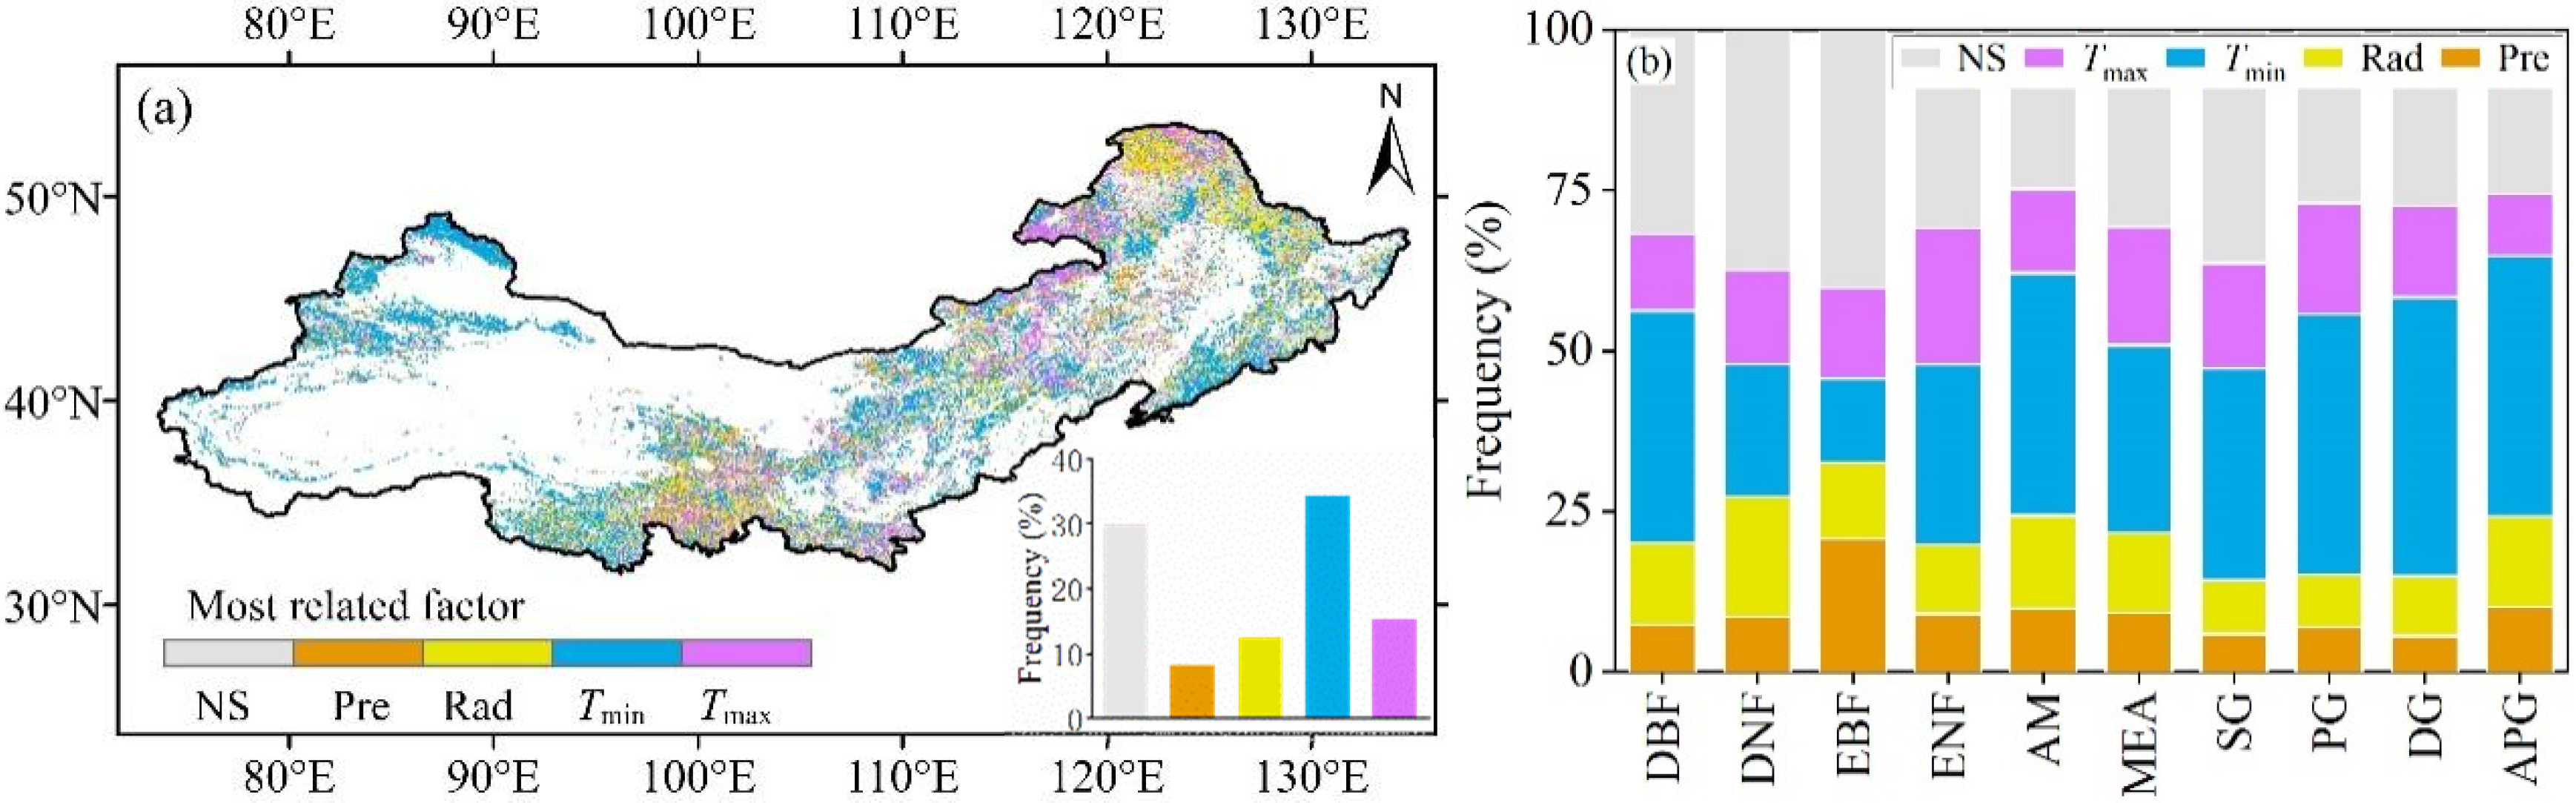
3.4. Determining the Key Climatic Factor driving EOS in Northern China

As shown in Figure 7, the most significant factor controlling EOS were calculated at the pixel scale according to the standardized regression coefficients and significance level between EOS and preseason climatic factors.
Among the four climatic factors (Figure 7a), preseason Tmin was the dominant factor in nearly 34.39% of all pixels, followed by preseason Tmax (15.23%) and Rad (12.31%). As shown in Figure 7a, Tmin was widely found to dominate the EOS in most parts of northern China. However, EOS of northern parts of the Beijing-Tianjin-Hebei region was mainly affected by preseason Tmax. In this region, higher preseason Tmax contributed to an advancing EOS. The spatial distribution of pixels dominated by Rad and Pre was much more fragmented. Positive impacts of Rad were distributed in the northern Northeast China, central Inner Mongolia, and central Northwest China. In contrast, positive impacts of Pre were clustered in a small segment of the eastern Qinghai, eastern Inner Mongolia, and western Xinjiang, accounting for 8.21% of all pixels.
As for different vegetation types (Figure 7b), the EOS of EBF was mainly affected by preseason Pre, and more Pre contributed to an advancing EOS (Table 2). For other vegetation types, Tmin was the most influencing factor. The increases in Tmin contributed to a delaying EOS for these vegetation types.

4. Discussion

4.1. Comparisons of EOS Trends in Different Regions

In order to compare with previous studies, the EOS results derived from satellite data in regions surrounding northern China are listed in Table 3. As shown in Table 3, our results revealed that EOS significantly delayed in northern China during 1982–2016, which was similar to the results of the temperate China [25] and Tibetan Plateau [13], but opposite to those of the Mongolian Plateau [45], central Asia [46], and north-south transect of Northeast Asia [47]. Furthermore, the delaying magnitude in northern China was larger than that in temperate China and Tibetan Plateau (Table 3), suggesting that northern China was a sensitive region with a larger delaying trend of EOS. The trend differences in EOS may be related to different study periods, methods of trend detection, and vegetation types. Further analysis indicated complicated spatial differences in EOS trends (Figure 3b), due to the vast area of northern China with different climatic and vegetation types.
On the other hand, the accuracy of remotely sensed EOS was lower than that of in-situ observations. For example, Zhu et al. [48] reported that estimated EOS was later than that of the in-situ observations in North America. However, it is worth mentioning that both variations of EOS showed high consistency, indicating that the remotely sensed EOS was still reliable in detecting the shift of vegetation phenology [29,43,48].

4.2. Comparison between the Impacts of Different Climatic Factors on EOS

Temperature displayed an important impact on controlling EOS dynamics in northern China, which was in agreement with previous work [21,31,32]. Interestingly, warming Tmin had a positive impact on EOS, whereas warming Tmax had a negative impact (Figure 5a,b). This finding may be explained by several reasons. First, the plant senescence is largely associated with cold nights and frosts [20,49,50]. Higher Tmin could reduce the carbohydrate content of plants by enhancing nighttime respiration, which stimulates photosynthesis and eases the decomposition of chlorophyll [21]. Furthermore, an increase in Tmin extended the length of the frost-free period and reduced the risk of frost damage [45]. In contrast, higher Tmax could increase water stress and weaken plant transpiration in northern parts of the Beijing-Tianjin-Hebei region (Figure 7a). A possible explanation was that warming without increased precipitation could intensify risks of evapotranspiration and drought, which led to the weakening of photosynthesis and thus to an advanced termination of autumn phenology [28,51]. Interestingly, the asymmetric Tmax and Tmin effects have been reported for spring phenology by Wang et al. [52]. They found that Tmax instead of Tmin accounts for the slowdown in the advancing spring phenology using long-term records of leaf unfolding across central Europe, which suggested the asymmetric effects of temperature on spring and autumn phenology existed different mechanisms.
In addition to temperature, the delaying effect of greater Rad on EOS was found in higher latitudes or altitudes of northern China, e.g., northern Northeast China, central Inner Mongolia, and central Northwest China (Figure 7a). A possible explanation was that an increase of Rad could increase photosynthetic capacity and CO2 sequestration rate and thus slow the speed of leaf senescence. However, the delaying trends of EOS in higher latitudes or altitudes regions caused by warming were also dampened by a decrease of Rad [25]. As for arid and semi-arid regions, e.g., eastern Qinghai, eastern Inner Mongolia, and western Xinjiang (Figure 7a), water is an important limiting factor. Abundant precipitation delayed EOS by increasing soil moisture in the root attachments of plants [53]. Overall, the relationships between EOS and climatic factors were more complex, and these relationships at the spatial scale depended on the climatic constraints of vegetation [26,54,55]. More in-situ experiments focusing on EOS should explore the mechanisms behind the observed results.
It is worth mentioning that climatic factors (including Tmin, Tmax, Pre, and Rad) alone explained 70.14% of EOS changes (Figure 7a). Therefore, the impacts of non-climatic factors, e.g., rising atmospheric CO2 and N limitation, on EOS cannot be ignored [40,43,56], which is necessary to study the impacts of non-climatic factors on EOS at the next stage [57,58,59].

4.3. Limitations and Future Work

In this study, we quantitatively investigated the response of EOS to climatic factors, which could deepen our understanding of climate-vegetation relationships in northern China. Although we selected the long-time series of satellite data and the widely used method of phenological extraction, some limitations existed in this work. First, results of remotely sensed EOS with a coarse spatial resolution were difficult to validate due to the lack of in-situ observation data in northern China, which could hardly reflect EOS changes at the finer scale [29,60]. Therefore, the adequate coverage of in-situ observations should be improved at the next stage to compare the observed and the satellite-derived phenological results and to explain the mechanism of EOS changes at the finer scale. Second, temperature, precipitation, and radiation were important factors for vegetation growth [61,62]. However, more extreme climate events and intensifying human activities under the background of global change also posed complex impacts on vegetation growth and EOS [14,60], which should be analyzed at the next stage. For the above limitations, we hope to understand the impacts of droughts and human activities on EOS using satellite and in-situ datasets.

5. Conclusions

The results of this research showed the mean EOS regionally ranged between 275 and 305 DOY. However, an earlier EOS was found at higher altitudes. An evident delaying trend of EOS was observed in northern China from 1982 to 2016, but the magnitude of this delay had strong heterogeneity for different vegetation types.
Among four climatic factors, preseason Tmin was the dominant factor for nearly 34.39% of all pixels, followed by preseason Tmax (15.23%) and Rad (12.31%). Interestingly, Tmin and Tmax had an asymmetric effect on EOS. The increase in Rad contributed to a delayed EOS; however, the impacts of precipitation were highly dependent on regions and vegetation types.
These results suggest that there are complicated spatial differences in EOS trends, due to the vast area of northern China, which indicates that future vegetation phenology models should consider these EOS trends to accurately simulate vegetation growth in northern China.

Author Contributions

Conceptualization, R.W. and C.L.; methodology, Z.L. and C.L.; software, Z.L.; writing—original draft preparation, Z.L. and C.L.; writing—review and editing, B.L., Z.Q., Y.W. and C.L. All authors have read and agreed to the published version of the manuscript.

Funding

This research was funded by the National Key Research and Development Program of China (2018YFE0109600, 2017YFC1502303, and 2019YFC0507403), the National Natural Science Foundation of China (41875097, 41875096, 41801013, and 41975062), the ‘High-level Talent Support Program’ funding of Yangzhou University and Six Talent Peaks of Jiangsu Province (grant number JNHB-071).

Institutional Review Board Statement

Not applicable.

Informed Consent Statement

Not applicable.

Data Availability Statement

The data presented in this study are available on request from the corresponding author.

Conflicts of Interest

The authors declare no conflict of interest.

References

  1. Richardson, A.D.; Hufkens, K.; Milliman, T.; Aubrecht, D.M.; Furze, M.E.; Seyednasrollah, B.; Krassovski, M.B.; Latimer, J.M.; Nettles, W.R.; Heiderman, R.R.; et al. Ecosystem Warming Extends Vegetation Activity but Heightens Vulnerability to Cold Temperatures. Nature 2018, 560, 368–371. [Google Scholar] [CrossRef]
  2. Xia, J.; Niu, S.; Ciais, P.; Janssens, I.A.; Chen, J.; Ammann, C.; Arain, A.; Blanken, P.D.; Cescatti, A.; Bonal, D.; et al. Joint Control of Terrestrial Gross Primary Productivity by Plant Phenology and Physiology. Proc. Natl. Acad. Sci. USA 2015, 112, 2788–2793. [Google Scholar] [CrossRef] [Green Version]
  3. Zhou, X. Legacy Effect of Spring Phenology on Vegetation Growth in Temperate China. Agric. For. Meteorol. 2020, 281, 107845. [Google Scholar] [CrossRef]
  4. Duveneck, M.J.; Thompson, J.R. Climate Change Imposes Phenological Trade-Offs on Forest Net Primary Productivity. J. Geophys. Res. Biogeosci. 2017, 122, 2298–2313. [Google Scholar] [CrossRef]
  5. Zeng, Z.; Piao, S.; Li, L.Z.X.; Zhou, L.; Ciais, P.; Wang, T.; Li, Y.; Lian, X.; Wood, E.F.; Friedlingstein, P.; et al. Climate Mitigation from Vegetation Biophysical Feedbacks during the Past Three Decades. Nat. Clim. Chang. 2017, 7, 432–436. [Google Scholar] [CrossRef]
  6. Fu, Y.H.; Piao, S.; Delpierre, N.; Hao, F.; Hänninen, H.; Liu, Y.; Sun, W.; Janssens, I.A.; Campioli, M. Larger Temperature Response of Autumn Leaf Senescence than Spring Leaf-out Phenology. Glob. Chang. Biol. 2018, 24, 2159–2168. [Google Scholar] [CrossRef]
  7. Peng, J.; Wu, C.; Wang, X.; Lu, L. Spring Phenology Outweighed Climate Change in Determining Autumn Phenology on the Tibetan Plateau. Int. J. Climatol. 2021, 41, 3725–3742. [Google Scholar] [CrossRef]
  8. Dannenberg, M.P.; Wise, E.K.; Janko, M.; Hwang, T.; Smith, W.K. Atmospheric Teleconnection Influence on North American Land Surface Phenology. Environ. Res. Lett. 2018, 13, 034029. [Google Scholar] [CrossRef]
  9. Li, C.; Wang, R.; Cui, X.; Wu, F.; Yan, Y.; Peng, Q.; Qian, Z.; Xu, Y. Responses of Vegetation Spring Phenology to Climatic Factors in Xinjiang, China. Ecol. Indic. 2021, 124, 107286. [Google Scholar] [CrossRef]
  10. Zhang, X.; Friedl, M.A.; Schaaf, C.B.; Strahler, A.H.; Hodges, J.C.F.; Gao, F.; Reed, B.C.; Huete, A. Monitoring Vegetation Phenology Using MODIS. Remote Sens. Environ. 2003, 84, 471–475. [Google Scholar] [CrossRef]
  11. Rozenstein, O.; Adamowski, J. Linking Spaceborne and Ground Observations of Autumn Foliage Senescence in Southern Québec, Canada. Remote Sens. 2017, 9, 630. [Google Scholar] [CrossRef] [Green Version]
  12. Wang, X.; Gao, Q.; Wang, C.; Yu, M. Spatiotemporal Patterns of Vegetation Phenology Change and Relationships with Climate in the Two Transects of East China. Glob. Ecol. Conserv. 2017, 10, 206–219. [Google Scholar] [CrossRef]
  13. Cong, N.; Shen, M.; Piao, S. Spatial Variations in Responses of Vegetation Autumn Phenology to Climate Change on the Tibetan Plateau. J. Plant Ecol. 2016, 10, 744–752. [Google Scholar] [CrossRef] [Green Version]
  14. Yuan, H.; Wu, C.; Gu, C.; Wang, X. Evidence for Satellite Observed Changes in the Relative Influence of Climate Indicators on Autumn Phenology over the Northern Hemisphere. Glob. Planet. Chang. 2020, 187, 103131. [Google Scholar] [CrossRef]
  15. Wang, X.; Xiao, J.; Li, X.; Cheng, G.; Ma, M.; Zhu, G.; Altaf Arain, M.; Andrew Black, T.; Jassal, R.S. No Trends in Spring and Autumn Phenology during the Global Warming Hiatus. Nat. Commun. 2019, 10, 2389. [Google Scholar] [CrossRef]
  16. Li, P. Combined Control of Multiple Extreme Climate Stressors on Autumn Vegetation Phenology on the Tibetan Plateau under Past and Future Climate Change. Agric. For. Meteorol. 2021, 308–309, 108571. [Google Scholar] [CrossRef]
  17. Liu, Q.; Fu, Y.H.; Zhu, Z.; Liu, Y.; Liu, Z.; Huang, M.; Janssens, I.A.; Piao, S. Delayed Autumn Phenology in the Northern Hemisphere Is Related to Change in Both Climate and Spring Phenology. Glob. Chang. Biol. 2016, 22, 3702–3711. [Google Scholar] [CrossRef]
  18. Ren, S.; Yi, S.; Peichl, M.; Wang, X. Diverse Responses of Vegetation Phenology to Climate Change in Different Grasslands in Inner Mongolia during 2000–2016. Remote Sens. 2017, 10, 17. [Google Scholar] [CrossRef] [Green Version]
  19. Zu, J.; Zhang, Y.; Huang, K.; Liu, Y.; Chen, N.; Cong, N. Biological and Climate Factors Co-Regulated Spatial-Temporal Dynamics of Vegetation Autumn Phenology on the Tibetan Plateau. Int. J. Appl. Earth Obs. Geoinf. 2018, 69, 198–205. [Google Scholar] [CrossRef]
  20. Li, P.; Peng, C.; Wang, M.; Luo, Y.; Li, M.; Zhang, K.; Zhang, D.; Zhu, Q. Dynamics of Vegetation Autumn Phenology and Its Response to Multiple Environmental Factors from 1982 to 2012 on Qinghai-Tibetan Plateau in China. Sci. Total Environ. 2018, 637–638, 855–864. [Google Scholar] [CrossRef]
  21. Li, P.; Zhu, Q.; Peng, C.; Zhang, J.; Wang, M.; Zhang, J.; Ding, J.; Zhou, X. Change in Autumn Vegetation Phenology and the Climate Controls From 1982 to 2012 on the Qinghai–Tibet Plateau. Front. Plant Sci. 2020, 10, 1677. [Google Scholar] [CrossRef] [Green Version]
  22. Wu, C.; Wang, X.; Wang, H.; Ciais, P.; Peñuelas, J.; Myneni, R.B.; Desai, A.R.; Gough, C.M.; Gonsamo, A.; Black, A.T.; et al. Contrasting Responses of Autumn-Leaf Senescence to Daytime and Night-Time Warming. Nat. Clim. Chang. 2018, 8, 1092–1096. [Google Scholar] [CrossRef] [Green Version]
  23. Xie, Y.; Wang, X.; Silander, J.A. Deciduous Forest Responses to Temperature, Precipitation, and Drought Imply Complex Climate Change Impacts. Proc. Natl. Acad. Sci. USA 2015, 112, 13585–13590. [Google Scholar] [CrossRef] [Green Version]
  24. Ahlström, A.; Raupach, M.R.; Schurgers, G.; Smith, B.; Arneth, A.; Jung, M.; Reichstein, M.; Canadell, J.G.; Friedlingstein, P.; Jain, A.K.; et al. The Dominant Role of Semi-Arid Ecosystems in the Trend and Variability of the Land CO2 Sink. Science 2015, 348, 895–899. [Google Scholar] [CrossRef] [Green Version]
  25. Liu, Q.; Fu, Y.H.; Zeng, Z.; Huang, M.; Li, X.; Piao, S. Temperature, Precipitation, and Insolation Effects on Autumn Vegetation Phenology in Temperate China. Glob. Chang. Biol. 2016, 22, 644–655. [Google Scholar] [CrossRef]
  26. Wen, K.; Ren, G.; Li, J.; Zhang, A.; Ren, Y.; Sun, X.; Zhou, Y. Recent Surface Air Temperature Change over Mainland China Based on an Urbanization-Bias Adjusted Dataset. J. Clim. 2019, 32, 2691–2705. [Google Scholar] [CrossRef]
  27. Ren, S.; Peichl, M. Enhanced Spatiotemporal Heterogeneity and the Climatic and Biotic Controls of Autumn Phenology in Northern Grasslands. Sci. Total Environ. 2021, 788, 147806. [Google Scholar] [CrossRef]
  28. Park, T.; Chen, C.; Macias-Fauria, M.; Tømmervik, H.; Choi, S.; Winkler, A.; Bhatt, U.S.; Walker, D.A.; Piao, S.; Brovkin, V.; et al. Changes in Timing of Seasonal Peak Photosynthetic Activity in Northern Ecosystems. Glob. Chang. Biol. 2019, 25, 2382–2395. [Google Scholar] [CrossRef] [Green Version]
  29. Fu, Y.; He, H.S.; Zhao, J.; Larsen, D.R.; Zhang, H.; Sunde, M.G.; Duan, S. Climate and Spring Phenology Effects on Autumn Phenology in the Greater Khingan Mountains, Northeastern China. Remote Sens. 2018, 10, 449. [Google Scholar] [CrossRef] [Green Version]
  30. Cui, L.; Shi, J. Evaluation and Comparison of Growing Season Metrics in Arid and Semi-Arid Areas of Northern China under Climate Change. Ecol. Indic. 2021, 121, 107055. [Google Scholar] [CrossRef]
  31. Tao, Z.; Wang, H.; Liu, Y.; Xu, Y.; Dai, J. Phenological Response of Different Vegetation Types to Temperature and Precipitation Variations in Northern China during 1982–2012. Int. J. Remote Sens. 2017, 38, 3236–3252. [Google Scholar] [CrossRef]
  32. Zhang, R.; Qi, J.; Leng, S.; Wang, Q. Long-Term Vegetation Phenology Changes and Responses to Preseason Temperature and Precipitation in Northern China. Remote Sens. 2022, 14, 1396. [Google Scholar] [CrossRef]
  33. Kumari, N.; Srivastava, A.; Dumka, U.C. A Long-Term Spatiotemporal Analysis of Vegetation Greenness over the Himalayan Region Using Google Earth Engine. Climate 2021, 9, 109. [Google Scholar] [CrossRef]
  34. Wu, C.; Chen, J.M.; Black, T.A.; Price, D.T.; Kurz, W.A.; Desai, A.R.; Gonsamo, A.; Jassal, R.S.; Gough, C.M.; Bohrer, G.; et al. Interannual Variability of Net Ecosystem Productivity in Forests Is Explained by Carbon Flux Phenology in Autumn: Autumn Phenology and NEP. Glob. Ecol. Biogeogr. 2013, 22, 994–1006. [Google Scholar] [CrossRef]
  35. Zhang, J.; Tong, X.; Zhang, J.; Meng, P.; Li, J.; Liu, P. Dynamics of Phenology and Its Response to Climatic Variables in a Warm-Temperate Mixed Plantation. For. Ecol. Manag. 2021, 483, 118785. [Google Scholar] [CrossRef]
  36. Kong, D.; Zhang, Y.; Wang, D.; Chen, J.; Gu, X. Photoperiod Explains the Asynchronization Between Vegetation Carbon Phenology and Vegetation Greenness Phenology. J. Geophys. Res. Biogeosci. 2020, 125, e2020JG005636. [Google Scholar] [CrossRef]
  37. Zhang, Q.; Kong, D.; Shi, P.; Singh, V.P.; Sun, P. Vegetation Phenology on the Qinghai-Tibetan Plateau and Its Response to Climate Change (1982–2013). Agric. For. Meteorol. 2018, 248, 408–417. [Google Scholar] [CrossRef]
  38. Hufkens, K.; Friedl, M.; Sonnentag, O.; Braswell, B.H.; Milliman, T.; Richardson, A.D. Linking Near-Surface and Satellite Remote Sensing Measurements of Deciduous Broadleaf Forest Phenology. Remote Sens. Environ. 2012, 117, 307–321. [Google Scholar] [CrossRef]
  39. Wang, S.; Zhang, B.; Yang, Q.; Chen, G.; Yang, B.; Lu, L.; Shen, M.; Peng, Y. Responses of Net Primary Productivity to Phenological Dynamics in the Tibetan Plateau, China. Agric. For. Meteorol. 2017, 232, 235–246. [Google Scholar] [CrossRef]
  40. Guo, M.; Wu, C.; Peng, J.; Lu, L.; Li, S. Identifying Contributions of Climatic and Atmospheric Changes to Autumn Phenology over Mid-High Latitudes of Northern Hemisphere. Glob. Planet. Chang. 2021, 197, 103396. [Google Scholar] [CrossRef]
  41. White, J.H.R.; Walsh, J.E.; Thoman Jr, R.L. Using Bayesian Statistics to Detect Trends in Alaskan Precipitation. Int. J. Climatol. 2021, 41, 2045–2059. [Google Scholar] [CrossRef]
  42. Peng, J.; Wu, C.; Zhang, X.; Wang, X.; Gonsamo, A. Satellite Detection of Cumulative and Lagged Effects of Drought on Autumn Leaf Senescence over the Northern Hemisphere. Glob. Chang. Biol. 2019, 25, 2174–2188. [Google Scholar] [CrossRef] [PubMed]
  43. Yuan, M.; Zhao, L.; Lin, A.; Li, Q.; She, D.; Qu, S. How Do Climatic and Non-Climatic Factors Contribute to the Dynamics of Vegetation Autumn Phenology in the Yellow River Basin, China? Ecol. Indic. 2020, 112, 106112. [Google Scholar] [CrossRef]
  44. Yang, Z.; Shen, M.; Jia, S.; Guo, L.; Yang, W.; Wang, C.; Chen, X.; Chen, J. Asymmetric Responses of the End of Growing Season to Daily Maximum and Minimum Temperatures on the Tibetan Plateau. J. Geophys. Res. Atmos. 2017, 122, 13278–13287. [Google Scholar] [CrossRef]
  45. Jin, H.; Tong, S.; Chen, J.; Huang, X.; Shao, C.; Mandakh, U.; Chopping, M.; Du, L. Autumn Phenology and Its Covariation with Climate, Spring Phenology and Annual Peak Growth on the Mongolian Plateau. Agric. For. Meteorol. 2021, 298–299, 108312. [Google Scholar]
  46. Wu, L.; Ma, X.; Dou, X.; Zhu, J.; Zhao, C. Impacts of Climate Change on Vegetation Phenology and Net Primary Productivity in Arid Central Asia. Sci. Total Environ. 2021, 796, 149055. [Google Scholar] [CrossRef] [PubMed]
  47. Mo, Y.; Chen, S.; Jin, J.; Lu, X.; Jiang, H. Temporal and Spatial Dynamics of Phenology along the North–South Transect of Northeast Asia. Int. J. Remote Sens. 2019, 40, 7922–7940. [Google Scholar] [CrossRef]
  48. Zhu, W.; Tian, H.; Xu, X.; Pan, Y.; Chen, G.; Lin, W. Extension of the Growing Season Due to Delayed Autumn over Mid and High Latitudes in North America during 1982–2006. Glob. Ecol. Biogeogr. 2012, 21, 260–271. [Google Scholar] [CrossRef]
  49. Cong, N.; Piao, S.; Chen, A.; Wang, X.; Lin, X.; Chen, S.; Han, S.; Zhou, G.; Zhang, X. Spring Vegetation Green-up Date in China Inferred from SPOT NDVI Data: A Multiple Model Analysis. Agric. For. Meteorol. 2012, 165, 104–113. [Google Scholar] [CrossRef]
  50. Pei, T.; Ji, Z.; Chen, Y.; Wu, H.; Hou, Q.; Qin, G.; Xie, B. The Sensitivity of Vegetation Phenology to Extreme Climate Indices in the Loess Plateau, China. Sustainability 2021, 13, 7623. [Google Scholar] [CrossRef]
  51. Wang, G.; Huang, Y.; Wei, Y.; Zhang, W.; Li, T.; Zhang, Q. Inner Mongolian Grassland Plant Phenological Changes and Their Climatic Drivers. Sci. Total Environ. 2019, 683, 1–8. [Google Scholar] [CrossRef] [PubMed]
  52. Wang, J.; Xi, Z.; He, X.; Chen, S.; Rossi, S.; Smith, N.G.; Liu, J.; Chen, L. Contrasting Temporal Variations in Responses of Leaf Unfolding to Daytime and Nighttime Warming. Glob. Chang. Biol. 2021, 27, 5084–5093. [Google Scholar] [CrossRef]
  53. An, S.; Chen, X.; Zhang, X.; Lang, W.; Ren, S.; Xu, L. Precipitation and Minimum Temperature Are Primary Climatic Controls of Alpine Grassland Autumn Phenology on the Qinghai-Tibet Plateau. Remote Sens. 2020, 12, 431. [Google Scholar] [CrossRef] [Green Version]
  54. Seyednasrollah, B.; Young, A.M.; Li, X.; Milliman, T.; Ault, T.; Frolking, S.; Friedl, M.; Richardson, A.D. Sensitivity of Deciduous Forest Phenology to Environmental Drivers: Implications for Climate Change Impacts Across North America. Geophys. Res. Lett. 2020, 47, e2019GL086788. [Google Scholar] [CrossRef]
  55. Zhao, J.; Wang, Y.; Zhang, Z.; Zhang, H.; Guo, X.; Yu, S.; Du, W.; Huang, F. The Variations of Land Surface Phenology in Northeast China and Its Responses to Climate Change from 1982 to 2013. Remote Sens. 2016, 8, 400. [Google Scholar] [CrossRef] [Green Version]
  56. Gonsamo, A.; Chen, J.M.; Ooi, Y.W. Peak Season Plant Activity Shift towards Spring Is Reflected by Increasing Carbon Uptake by Extratropical Ecosystems. Glob. Chang. Biol. 2018, 24, 2117–2128. [Google Scholar] [CrossRef]
  57. Fu, Y.S.H.; Campioli, M.; Vitasse, Y.; De Boeck, H.J.; Van den Berge, J.; AbdElgawad, H.; Asard, H.; Piao, S.; Deckmyn, G.; Janssens, I.A. Variation in Leaf Flushing Date Influences Autumnal Senescence and next Year’s Flushing Date in Two Temperate Tree Species. Proc. Natl. Acad. Sci. USA 2014, 111, 7355–7360. [Google Scholar] [CrossRef] [Green Version]
  58. Gao, M.; Wang, X.; Meng, F.; Liu, Q.; Li, X.; Zhang, Y.; Piao, S. Three-dimensional Change in Temperature Sensitivity of Northern Vegetation Phenology. Glob. Chang. Biol. 2020, 26, 5189–5201. [Google Scholar] [CrossRef]
  59. Richardson, A.D.; Black, T.A.; Ciais, P.; Delbart, N.; Friedl, M.A.; Gobron, N.; Hollinger, D.Y.; Kutsch, W.L.; Longdoz, B.; Luyssaert, S.; et al. Infuence of Spring and Autumn Phenological Transitions on Forest Ecosystem Productivity. Philos. Trans. R. Soc. B Biol. Sci. 2010, 1555, 3227–3246. [Google Scholar] [CrossRef] [Green Version]
  60. Yuan, M.; Zhao, L.; Lin, A.; Wang, L.; Li, Q.; She, D.; Qu, S. Impacts of Preseason Drought on Vegetation Spring Phenology across the Northeast China Transect. Sci. Total Environ. 2020, 738, 140297. [Google Scholar] [CrossRef]
  61. Keenan, T.F.; Richardson, A.D. The Timing of Autumn Senescence Is Affected by the Timing of Spring Phenology: Implications for Predictive Models. Glob. Chang. Biol. 2015, 21, 2634–2641. [Google Scholar] [CrossRef] [PubMed] [Green Version]
  62. Yu, H.; Luedeling, E.; Xu, J. Winter and Spring Warming Result in Delayed Spring Phenology on the Tibetan Plateau. Proc. Natl. Acad. Sci. USA 2010, 107, 22151–22156. [Google Scholar] [CrossRef] [PubMed] [Green Version]
Figure 1. The location (a), DEM (b) and vegetation type (c) in northern China.
Sustainability 14 08590 g001
Figure 2. The spatial distribution of mean (a) and standard deviation (b) of EOS in northern China from 1982 to 2016.
Sustainability 14 08590 g002
Figure 3. The trend of EOS in northern China from 1982 to 2016 at the regional scale (a), at the pixel scale (b), and at the vegetation type scale (c). Significance was set at p < 0.05. Note: The small map in (b) was shown pixels with significant trends in northern China (red and green indicates significant positive trends and significant negative trends, respectively). The “*” in (c) represented significant at p < 0.05 level.
Sustainability 14 08590 g003
Figure 4. The length of the preseason for four climatic factors at the pixel scale (Unit: months). (a) Tmin, (b) Tmax, (c) Pre, and (d) Rad.
Sustainability 14 08590 g004
Figure 5. Sensitivity of EOS to four climatic factors at the pixel scale. (a) Tmin, (b) Tmax, (c) Pre, and (d) Rad. Significance was set at p < 0.05.
Sustainability 14 08590 g005
Figure 6. Sensitivity of EOS to four climatic factors at the vegetation type scale. (a) Tmin, (b) Tmax, (c) Pre, and (d) Rad. Significance was set at p < 0.05. Note: Bars above (below) zero line represent percentage of positive (negative) correlations. Colored parts indicate significant correlations at p < 0.05, while white parts indicate non-significant (NS) correlations.
Sustainability 14 08590 g006
Figure 7. The most related climate factors for EOS at the pixel scale (a), and at the vegetation type scale (b). Note: NS indicate no most related climate factors.
Sustainability 14 08590 g007
Table 1. Statistical characteristics of mean and standard deviation of EOS for different vegetation types.
TypeEOS (DOY)SD (Days)TypeEOS (DOY)SD (Days)
Broadleaved deciduoud forest (DBF)294.69 ± 10.653.70 ± 5.58Meadow (MEA)291.81 ± 11.877.33 ± 7.53
Needleleaved deciduoud forest (DNF)282.13 ± 6.064.06 ± 4.68Slope grassland (SG)298.53 ± 22.399.64 ± 13.40
Broadleaved evergreen forest (EBF)313.15 ± 6.356.71 ± 3.48Plain grassland (PG)295.26 ± 13.779.49 ± 6.72
Needleleaved evergreen forest (ENF)296.99 ± 12.435.74 ± 4.76Desert grassland (DG)297.42 ± 15.1711.86 ± 10.55
Alpine and sub-alpine meadow (AM)286.28 ± 12.397.37 ± 8.52Alpine and sub-alpine plain grass (APG)280.02 ± 12.609.87 ± 11.71
Table 2. Percentage of the most related climatic factors of EOS for different vegetation types.
TypePercentage (%)
Tmin (P)Tmin (N)Tmax (P)Tmax (N)Pre (P)Pre (N)Rad (P)Rad (N)
DBF31.684.576.455.464.462.858.773.96
DNF16.464.152.3812.185.612.9613.715.03
EBF6.526.527.616.52020.657.614.35
ENF24.243.7611.799.515.903.177.153.61
AM30.467.298.194.916.972.969.075.38
MEA23.156.1011.327.126.462.749.432.99
SG29.163.7313.802.653.672.236.392.05
PG33.806.7913.134.214.232.736.301.85
DG38.784.5510.923.413.502.077.771.62
APG29.5211.147.631.955.534.609.424.67
Note: The P (N) in the parentheses represents the positive (negative) impact.
Table 3. The EOS trends from our work and other published researches in regions surrounding northern China.
Study AreaTrend (Days/Year)PeriodReference
Temperate China0.12 ± 0.011982–2011[25]
Tibetan Plateau0.071982–2011[13]
Mongolian Plateau−0.061982–2013[45]
Central Asia−0.692000–2019[46]
North-south transect of Northeast Asia−0.091982–2014[47]
This study0.211982–2016
Publisher’s Note: MDPI stays neutral with regard to jurisdictional claims in published maps and institutional affiliations.

