Abstract
Over the life cycle of a civil infrastructure (a bridge as an example), 0.4–2% of the construction cost is spent annually on its maintenance. Utilising new technologies including the internet of things (IoT) and digital twin (DT) can significantly reduce the infrastructure maintenance costs. An infrastructure DT involves its digital replica and must include data on geometric, geospatial reference, performance, attributes (material, environment etc.) and management. Then, the acquired data need to be analysed and visualised to inform maintenance decision making. To develop this DT, the first step is the study of the infrastructure life cycle to design DT architecture. Using data semantics, this paper presents a novel DT architecture design for an intelligent infrastructure maintenance system. Semantic modelling is used as a powerful tool to structure and organize data. This approach provides an industry context through capturing knowledge about infrastructures in the structure of semantic model graph. Using new technologies, DT approach derives and presents meaningful data on infrastructure real-time performance and maintenance requirements, and in a more expressible and interpretable manner. The data semantic model will guide when and what data to collect for feeding into the infrastructure DT. The proposed DT concept was applied on one of the conveyors of Dalrymple Bay Coal Terminal in Queensland Australia to monitor the structural performance in real-time, which enables predictive maintenance to avoid breakdowns and disruptions in operation and consequential financial impacts.
1. Introduction
Increasing utilisation and aging infrastructure has resulted in the requirement for infrastructure assets continuous health monitoring [1].
There are about 22,500 bridges in Australia with a replacement cost of around AUD 3 billion, and an annual maintenance expenditure of about AUD 300 million [2]. The United States Federal Highway Administration incurs a bi-annual inspection cost of AUD 3.4 billion where the average inspection cost for each bridge structure is AUD 5500 to 12,500.
The architecture, engineering and construction industries combined worldwide annual expenditure is more than AUD 10 trillion. These industries are globally the largest consumers of raw material, and their built assets are responsible for 25 to 40% of the world’s total carbon emissions [3]. Furthermore, according to the World Bank, demand for civil infrastructure exceeds supply at a shortfall of AUD one trillion every year [3].
A total of 65% to 85% of the facility management cost is spent for their maintenance and yet there is not an efficient management and decision making strategy to optimise this cost [4]. In facility maintenance management, there are two main issues with existing facility management systems [4]:
- inability of computerised maintenance management systems or, in other words, facility management systems to automatically schedule maintenance work orders
- difficulty in accessing accurate information for the facility management staff.
The mentioned shortcomings are applicable to asset maintenance management of almost all other disciplines (i.e., structures, utilities, production plants etc.).
Existing practices in infrastructure health monitoring rely either upon site inspections (level 1, 2 and 3 for bridges, for example) and abstract software to obtain, store and process the acquired data. Figure 1 illustrates an overview of the currently in practice infrastructure maintenance management processes.
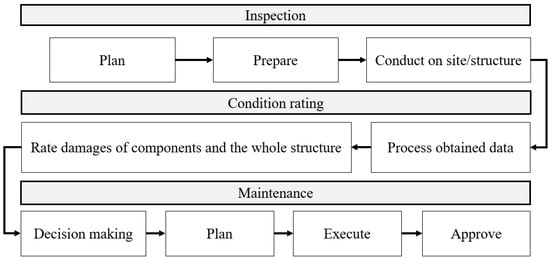
Figure 1.
Overview of existing maintenance processes.
Problems of existing maintenance processes:
- Data exchange: One of the costly shortcomings of the existing processes is data exchange during inspection planning, implementation and reporting, as most likely each of these phases is conducted by a different party (i.e., planners, inspectors, maintainers). In existing practices, data transfer from inspections, planning and maintenance needs to be either manually entered or converted (to a compatible format), which carries the risk of errors and data loss.
- Interoperability: This issue is an important function in data management [5]. Currently produced digital data are in different formats and not necessarily compatible between different software, which makes their lifespan limited and with little guarantee that the data will make it to later stages of asset utilisation. According to Smith and Domer [3], the model-based application outputs’ interoperability challenges costs the U.S. facility owners USD 15.8 billion as a result of lost efficiency. Of this amount more than 65% belongs to the operation and maintenance stage.
- Data management: 80% of the time spent on managing a facility is to look for appropriate and useful information. Previous research has revealed that new technologies such as Building Information Modelling.
- (BIM) enables a reduction of 98% in the time spent to update the database while managing facilities [3].
- Data loss along asset lifecycle phases as a result of (1) incoherent naming conventions (2) lack of a universal standard for the required asset information (3) insufficient categorisation of data in different model-based applications (4) ill synchronisation of information (5) lack of a structured model for capturing existing assets and their details [4].
- Being labour intensive and therefore not cost effective.
Monitoring infrastructures is a multidisciplinary task and way too complex to assure the consideration of all involved variables. Notwithstanding this, the objectives of monitoring practices have similarities in working towards more precision in detecting damages, straightforward management, data storage, timeliness and reliability of the collected information [6]. An international standard framework for data exchange is the ISO 15926. Due to not being specific for practical utilisation, many different specialisations of this standard have been derived without much alignment between them. There is not a universal data model for conducting infrastructure inspections, identifying defects, or determining maintenance strategies which can avoid inconsistencies and inefficiencies. Furthermore, existing data exchange or transfer practices along different lifecycle phases (i.e., construction, planning and implementing inspection, executing maintenance strategies, monitoring) could result in data loss and re-works due to inefficient practices and interoperability difficulties between the utilised technologies. Recent advances, such as unmanned aerial photography, has already resulted in reducing the risk of data loss and error. Though, even with this advancement, the problem of data loss while digitising the obtained analogue information still exists and retaining the lost data is costly and time consuming [7]. Another challenge is ever increasing amounts of collected data, which needs to be stored and processed to make informed decisions about infrastructure maintenance as the existing practices do not have the capacity to keep up with the demand (due to scale of telemetry data and rapid growth of systems and existing approaches, whose reliance on operators to detect and correct anomalies in the systems is impractical [8]).
Following are different maintenance strategies based on the intervention time:
- Reactive (firefighting/corrective) also known as failure-based.
- Preventative—also known as time-based. DT approach (further explained in Section 4) can be utilised in preventative strategies to predict the state of an asset and therefore reduce the number of unnecessary preventative maintenance activities providing longer time intervals between them.
- Condition-based (based on asset condition)—also known as diagnosis-based maintenance (efficient detection of anomalies in the existing condition of an asset and fast data processing is made possible thanks to the developed state of technologies such as IOT and cloud computing [9]). Artificial intelligence algorithms can enhance this maintenance approach in diagnosing and acquiring detailed status data [10].
- Predictive (prognosis)—this approach can use a data driven (data driven techniques (clustering, neural networks, Bayesian networks, support vector machine (SVM) and principal components analysis (PCA)) are data-oriented, which can be obtained with appropriate sensor deployment) or model driven (the model driven technique uses mathematical methods (analytical, physical, or numerical models) to describe an asset) technique to predict maintenance.
The main process of maintenance prediction is prognosis. Predictive maintenance is one of intensively investigated subjects in the industry 4.0 movement [10]. Industry 4.0 (the 4th industrial revolution after steam engine, assembly line and automation) combines existing technologies within the industry with new IT and communication (IoT) technologies [11]. Industry 4.0 is bridging the cyber and physical worlds and its ultimate goal is to digitalise modern systems [12]. Figure 2 illustrates industry evolution from the beginning to now.
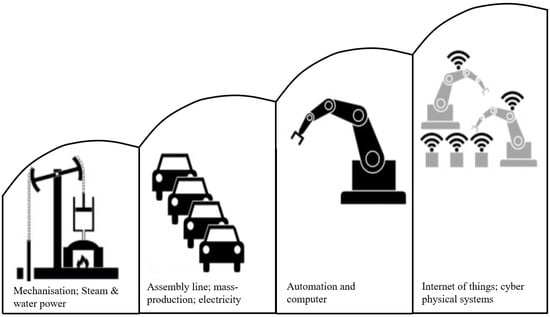
Figure 2.
Evolution of industry.
Predictive maintenance reduces both maintenance planning and implementation in domains of time and cost by 5 to 10 and 20 to 50%, respectively [9].
- Prescriptive (knowledge-based) maintenance—in addition to predicting the status of the asset this approach aims to optimise maintenance via prescribing action to maintain an asset by using historical and real-time data.
Triggered by industry and technology evolution, structural health monitoring (SHM) has been introduced as a new branch of civil engineering which focuses on assessing the civil infrastructure health status [13]. A typical SHM system is made up of three different systems including sensing, processing and evaluation [6]. SHM uses in situ monitoring instruments to assist engineers in understanding the structural behaviour of a structure and ensuring their integrity and ultimate safety of the users [13]. SHM addresses the mentioned challenges with data management and, as its name implies, focuses on assessing the infrastructure health status.
The next section of the paper explains advances in the condition health monitoring of infrastructures, followed by Section 3, which elaborates on the DT application in infrastructure maintenance and its challenges. Architecture design for the proposed DT method is explained in Section 4. Section 5 explains the details of the application of the proposed DT on the case study followed by Section 6 which concludes the paper.
2. Advancements in Structural Health Monitoring (SHM) Methods
An infrastructure health management system needs to be capable of simultaneously taking into account different domains, such as vibration, displacement, strain, stress etc., to be able to accurately diagnose structure health related problems. It should also be capable of efficient processing and real-time communication to guarantee timely response to defects [14]. Despite being widely researched, existing approaches lack a formal description for the SHM systems, which enable appropriate documenting and exchanging the accumulated information during monitoring of structures [15].
SHM integration with the BIM have been attempted to monitor the vibration, strain, and deformation of precast elements during transportation to construction sites or as a result of misalignment during installation. This integration has two modules including data acquisition and storage using automated sensors and a data modelling/visualisation, which interprets sensor data to identify anomalies and damages in the structure. The BIM model highlights damaged elements using colour coding, which is based on predefined threshold values [16]. Existing BIM-based approaches, especially the Industry Foundation Classes (IFC) standard, only focus on describing sensor related information, and further aspects of SHM related information, such as real-time data processing and analysis, are not covered [15].
Feng and Feng [17] offered non-contact vision-based sensor systems for SHM due to their flexibility in extracting structural displacements at multiple locations. Their study aimed to link measured displacements to the quantification of structural health condition through validating feasible simultaneous identification of the stiffness of structures and unknown excitation forces in the time domain. Results of the laboratory experiment on a small scall beam revealed that displacement measurements at two points along the beam can identify the global stiffness as well as external hammer excitation forces.
In another study, metal packaged optical fibre strain sensors were utilised to instrument selected reinforcement bars in a wind turbine foundation before concrete casting. The measured foundation strains showed a high extent correlation with measured tower displacements as well as the foundation finite element model (FEM) analysis [18]. Furthermore, in the last few decades, improvements in the field of smart sensing systems, which results in enabling event-triggered (real-time) high fidelity data acquisition when strong ground motion events occur, and emerging signal processing techniques has led to considerable growth of seismic SHM [19].
A computer vision based non-destructive SHM method encompassing a digital high speed imaging system combined with artificial intelligence for detecting civil structures’ dynamic vibrations has been proposed by [1]. Their research claims to provide factual information regarding the location and displacement amount of an existing fracture in a civil structure. An artificial neural network was also utilised in their study to infer qualitative characteristics of the vibrations within the structure based on their intensity.
Global navigation satellite systems (GNSS) and Earth observation (EO) technologies have been attempted in a study by the University of Nottingham for SHM of a long span bridge [13]. The initial results have shown significant potential of the technologies and therefore the project was further extended to the demonstration stage where two long span bridges in China were considered as test structures.
Three dimensional digital image correlation systems have proved their ability to provide reliable objective information of structural changes, strain and geometric profiles of large structures [20]. Unmanned aerial vehicles technique have been combined with three dimensional digital image correlation by Reagan et al. [20] to monitor the structural health of concrete infrastructures.
DT technology has recently gained momentum in being investigated for utilisation in intelligent asset management. Infrastructure DT is the digital replica of an infrastructure which enables simulation of its real-time performance. DT encompasses three aspects: physical object, its digital replica, and the communication channel between the two. DT technology incorporates benefits of most of the methods which have previously been utilised for SHM including:
- BIM—to visualise the infrastructure performance
- sensors—to collect real-time data and
- structural analysis methods—to simulate and study structural performance (e.g., finite element analysis (FEA), which is a simulation method to objectively define and predict the performance of infrastructures)
DT has been researched in the SHM of spacecraft structures by Shangguan et al. [8], small-scale knuckle boom crane by Moi et al. [21], and collapse fragility assessment of long span bridges under strong earthquakes by Lin et al. [22].
In the next sections the terminologies and steps in developing DT architecture design for infrastructure SHM and its application on a port structure will be explained.
3. DT and Intelligent Infrastructure Maintenance
According to the literature, DT (in its current concept) was first proposed by Prof. Michael Greives at the University of Michigan in 2002 [23]. Since then, the DT concept has evolved.
Rosen et al. [24] introduced the DT concept as two identical physical and virtual spaces which allow mirroring between them to analyse the conditions that they experience in different phases of the object’s lifecycle. Then, Boschert and Rosen [25] detailed that a DT encompasses all the potential useful physical and functional information from a physical object/system/process. Furthermore, Boschert and Rosen [25] agree that DT not only is formed by data but also algorithms that explain behaviours to make decisions. Grieves and Vickers [26] defined DT as: a physical product in a real space, virtual product in a virtual space and the connection of data, which ties the two together. The information they were referring to was a set of information that provides a comprehensive description of a real object including from its most general geometry to its most concrete behaviour. Furthermore, according to Smart Cities Council of Australia and New Zealand, a digital twin must include data sets including geometric and graphical data, geospatial reference data, attributes (semantics) of the material, and performance and management data [27].
The concept of using DT dates back to NASA’s Apollo program where two identical spacecrafts/vehicles were manufactured to not only allow engineers to mirror the performance of the space vehicle during the mission by monitoring the twin vehicle remaining on earth but also be used for training during flight preparation [25].
The U.S. Air Force also published the idea of establishing the concept of DT as being part of their long-term vision. Their idea was to have a DT of every airplane with all deviations from its nominal design. Iron bird is another example of a twin in the form of hardware. Iron bird is an engineering tool in the aircraft industry which is ground based and is tasked to incorporate, optimise, and validate vital aircraft systems. The iron bird enables engineers to validate characteristics of components of the system and discover anomalies and incompatibilities that may need to be modified at early development stages. Iron bird capabilities goes even further and allows engineers to study and analyse effects and treatments of failures. Improvements in the simulation technologies allow the engineers to utilise the concept of iron bird but replace the hardware parts with virtual models even before the physical parts are built.
Simulation and modelling are nowadays a standard process to support designing or validating system properties. To describe all the disciplines in a system—both separately and in combination with other disciplines—simulation models are needed and only simulation models will enable the mastering of the extended challenges resulting from new technologies, which are used in all kinds of systems [25]. Classical goals, which are pursued from simulation, are to reduce development time/time-to-market, reduce the cost of developing a system/product, and meeting quality and client requirements. As can be seen in Figure 3, recently, simulation has evolved from being a technology restricted to computer experts and mathematicians to a standard tool for engineers to simulate speculated scenarios in developing engineering designs.
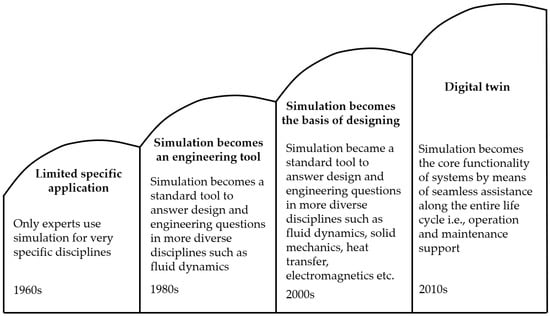
Figure 3.
Simulation technology evolvement into new domains (adapted with permission from [25], 2016, Springer International.
Future systems will have simulation not only as an essential part during design and development but also an important element to support systems’ future lifecycle phases monitoring, i.e., operation/performance. Evolutionary development of simulation models significantly improved its capability in addressing the rising complexity of future systems.
Due to instrumentation requirements and its high cost for conducting asset inspections, simulation methods also offer a great alternative for measuring anomalies and responses and, consequently, structural health monitoring [28].
Even though its primary use is defined and focused on specific questions, DT evolves with the physical twin. In other words, an important benefit of developing a DT model for an asset is enabling asset owners to add changes in the asset configuration (or whatever physical damage that might impact asset performance) to allow analysis of the asset realistic condition. This capability is vital since the main goal of applying DT technology in infrastructure maintenance is to determine the time and location where structural damage/failure is likely to occur and therefore undertake an optimal maintenance interval. Therefore, DT extends the concept of model-based systems engineering (MBSE (“Model-based systems engineering (MBSE) is the formalised application of modelling to support system requirements, design, analysis, verification and validation activities which is conducted in the conceptual design phase and continues throughout development and later lifecycle phases”)) from early phases, i.e., design, engineering and manufacturing/construction, to operation and maintenance phases.
Figure 4 illustrates the DT principal approach, which is using created data by authoring tools and sources, e.g., client requirements, CAD, and operation data to make it available as data and simulation models.
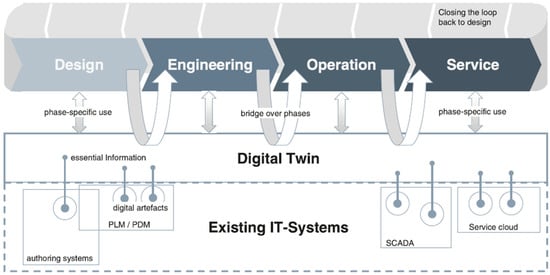
Figure 4.
DT utilises information from different sources and makes it available for succeeding phases of asset lifecycle (adapted with permission from [25], 2016, Springer International).
Therefore, the DT can close the lifecycle loop from operation to design to inform designing new systems or updated revisions.
BIM is not a DT, but it is an imperative basis for development of a DT. Table 1 compares DT and BIM.

Table 1.
Comparison of DT and BIM.
Further use cases of BIM in infrastructure DT applications other than geometry visualisation/representation include:
- Structural classifications (annotate elements of structure)
- Localising damage from structural inspections over time
- Localising installed sensors
- Contextualising generated data (damages to structural components etc.).
3.1. DT Application in Improving Maintenance Practices
DT is a smart way to collect all essential information about an asset in one place and benefit from improved consistency and seamless development processes at early stages and re-use of collected data for maintenance decision making at later lifecycle stages [25]. Maintenance is one of the most researched lifecycle phases of different industries. Errandonea et al. [10] conducted a review on the application of DT in maintenance within different industries. Their review included a total of 167 results, which included journal and conference articles, book chapters, reviews, and business articles. According to their review, the manufacturing industry is the number one field with the highest amount of research on implementing DT followed by industries with offshore infrastructure, such as oil and gas and wind turbines. In a study conducted by Wang et al. [29] on the DT related patents, they also concluded most of the DT-related patents appear in the manufacturing industry. Construction (buildings and bridges) and aeronautics are in third place in the research on the application of DT.
DT have been previously used to partially improve maintenance strategies, for example maintenance planning by Hlady et al. [30], fault detection and diagnosis by Barbosa et al. [31], calculating maintenance cost by Kaewunruen and Xu [32], or helping operators in performing specific maintenance tasks by Pairet et al. [33]; Rødseth et al. [34]; Longo et al. [35]; Venables [36]; Omer et al. [37]; and Anderson et al. [38].
As mentioned in Section 1, there are five different maintenance strategies including reactive, preventative, condition based, predictive and prescriptive depending on intervention time. Reactive maintenance does not need to utilise an expensive technology, such as DT, as a reactive strategy consists of repairing an asset or a component when it fails.
DT has application in preventative maintenance strategies to predict the state of infrastructure and therefore reduce the number of unnecessary preventative maintenance activities providing longer time intervals between them.
Furthermore, condition-based maintenance, or the detection of anomalies in the existing condition of an infrastructure, is made possible thanks to the advanced technologies, such as IoT and cloud computing. Artificial intelligence (AI) algorithms can enhance this maintenance approach in diagnosing and acquiring detailed status data.
As previously stated in Section 1, predictive and prescriptive strategies offer the highest potential in existing digitisation trends and can use a data or model driven techniques to predict maintenance.
So far, only condition-based, and predictive maintenance strategies have been researched in the construction industry and no paper is found in prescriptive maintenance strategy in the construction industry as far as our review of the literature is concerned.
3.2. Roadblocks, Alternatives and Research Questions
The roadblocks in evolving from basic maintenance strategies to more advanced strategies using a DT technology includes:
- A detailed maintenance procedure to structure the processes
- Data availability, integrity, security, and quality
- Regulatory barriers (regulatory bodies have a timely process in adopting new technologies)
- Reluctance to change traditional methods (making asset owners aware of DT’s benefits is fundamental in gradual incremental deployment of the DT)
- Alternatives to generate required data to address data availability challenges include:
- IoT/industry internet of things (IIoT) technologies
- FEM (generating synthetic data via simulation though defining the scenarios to simulate and generate data is a challenge) and
- BIM as a source of data
Furthermore, the rising maintenance cost as well as the demand for services motivates the regulatory bodies to be more flexible and efficient in implementing regulatory procedures and willingness to onboard innovative methods, which will result in overall reduction in the asset management costs.
So, this research is attempting to answer the following questions in relation to DT application in infrastructure maintenance management:
- Is DT application for infrastructure SHM using FEM models feasible?
- What are the challenges in terms of interoperability? How to make different software/platforms communicate with each other?
- What sensor configuration is needed to collect the required data? How to determine sensor locations?
4. Designing DT Architecture for Infrastructure SHM
Designing DT of an infrastructure, for maintenance decision-making purposes, should take into account all required operational, organisational and technical information and be able to run simulations of the physical object behaviour.
Since DT consists of both cyber and physical elements, it can be considered as a systems engineering approach, which seeks multidisciplinary stakeholder goals. DT can be created in different ways depending on the purpose and structure lifecycle phase, which in turn leads to different architectural designs. The architecture design of DT describes the components, interactions between them and the interaction of the DT as a whole with its environment, i.e., physical twin and communication related elements [39]. The concept of semantic modelling which relates to illustration of the relationships between individual elements as well as the bigger picture which will be explained in this section helps in understanding the importance of DT architecture design. Furthermore, cybersecurity is essential when moving towards more complex and intelligent DT systems, integrating advanced technologies, such as IoT/IIoT, data processing algorithms, remote communications and simulation processes [10].
As previously stated, DT include a physical object (which exists in real-world/environment), and a virtual object (a digital representation of a physical object in virtual world/environment). According to Tekinerdogan et al. [39], following are some of other key concepts related to DT:
- State: Current value/condition of either of the entities (physical or virtual objects)
- Metrology: Measuring/gauging state of either of the entities (physical or virtual)
- Twining: As the name implies this is the process of communicating the entities’ state to each other
- Data processing: this is related to analysis and process of the telemetry data from real object collected from sensors
- Realisation: this is after on boarding the result of the data processing in the previous step which results in changing the state of the physical/virtual objects
- Twining rate: is related to the frequency of creating the connection between the two entities
- Physical to virtual and virtual to physical connection: relate to the connection flow direction between the two entities
There are also some innovative concepts which researchers have put forward and are considered futuristic including federated learning or blockchain in DT which add to the system’s security, transparency etc. and result in more efficiency [40]. Before explaining DT architecture design, semantic modelling, data processing and physical–digital integration will be further explained.
4.1. Semantic Modelling
One of the challenges in realising IoT ecosystems is the way to provide common understanding of data which add value to the subject ecosystem through analysis and providing solutions to existing issues. Automated data sharing, exchanging, and securely accessing is critical in creating multi-stakeholder IoT systems. Semantic technologies address these challenges [41].
Semantic, in the linguistics context, is defined as the study of meanings, but it is an important concept in domains such as computer science [42]. In simple words, semantic modelling understandably depicts the relationships between specific data values relative to one another and the bigger picture in its concept. As an example, in mapping the data related to a bridge collapse after inspecting its components including piers and foundations, the data modelling in Figure 5 doesn’t reveal the bigger picture clearly (i.e., infrastructure collapse and its underlying factors) and therefore it is not possible to understand what it wants to present.
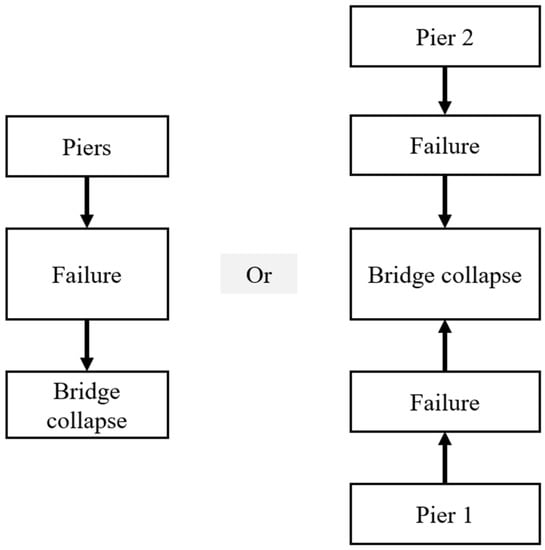
Figure 5.
An example of data modelling.
Whereas, in Figure 6 using semantic modelling and, consequently, relationships and values between the data, a clearer and more understandable picture is presented.
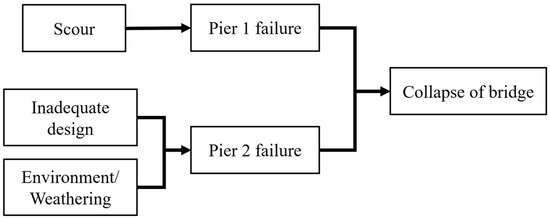
Figure 6.
Data representation using semantic modelling concept.
Simple illustration, such as Figure 6, is informative enough and does not need further detail to make it overly complex and unusable. Likewise, for the infrastructure maintenance purposes, geometric and semantic information are necessary and should be mapped properly to comprehensively model the structural performance status [7].
4.2. Processing Monitoring Data
There are two main approaches to process and interpret obtained data from physical infrastructure including: physics-based and data-driven [43]. Table 2 summarises the capabilities, characteristics, and limitations of these two approaches.
Table 2.
Physics-based vs. data-driven analytical approaches.
Combining physics-based and data-driven analytical approaches is also possible and has been investigated by civil engineers and statisticians to extract information from infrastructure data [43].
4.3. Integration Levels
As can be seen in Figure 7, depending on the level of automation of the data flow between the digital and physical objects, different integration levels can be defined.
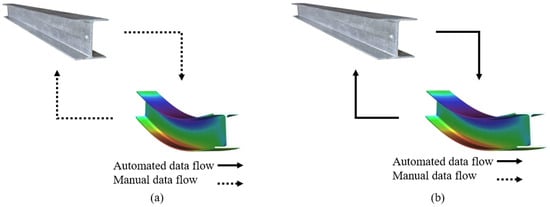
Figure 7.
Data flow in (a) digital model (b) digital twin.
Therefore, the relationship/dataflow mode between the physical object and its virtual counterpart may or may not be automatic. Digital model is related to early concept and development stage of the systems engineering lifecycle and has been in practice by infrastructure construction for decades. Since its creation is manual and there is no data synchronisation, digital model does not result in a truly DT-based system. However, digital model is righteously considered as the initial fundamental step towards a DT-based system because it becomes the basis of a physical object development [39].
Other defined relationships between physical objects and their virtual twins includes digital shadow and digital generator, as shown below in Figure 8 [39].
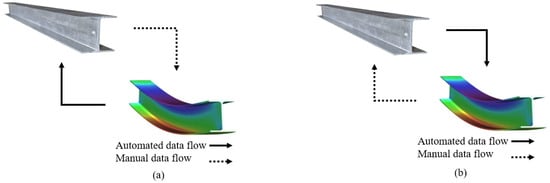
Figure 8.
Data flow in (a) digital generator (b) digital shadow.
Digital generator and digital model are similar as they both define the production of a physical object based on a digital model blueprint, but the difference is that the manual human intervention is not needed as the production is now automated. Therefore, implementing this pattern also requires the implementation of the generation process that takes as an input the digital blueprint and releases physical object as an output [39].
Digital shadow provides a DT based on an assumed existing physical item. Depending on the intended system requirements, multiple different DTs can be generated for a physical object. Implementation of this pattern requires equipping the physical object with necessary sensors to acquire the needed data to then be modelled by the DT. In principle, developing a DT based on the digital shadow concept could be a reverse manual process [39].
Kritzinger et al.’s [44] explanation of the relationships between the digital and physical object does not include digital generator and this shows the evolving nature of the concept of DT. In a complete infrastructure DT, the digital model receives data from the physical infrastructure (to represent a real-time digital model of the physical object) and the physical object also receives data (related to the prescribed maintenance measures) from the digital replica. Considering the integration levels in Figure 7 and Figure 8, digital shadow can relate to the preventative and condition-based maintenance strategies, and DT to prescriptive strategy [10].
4.4. DT Architecture Design
Developing an appropriate and comprehensive DT is a system engineering practice [23]. Successful development of a DT for infrastructure maintenance warrants the integration of high volume and heterogenous data and various analytical approaches as key factors [43]. Design patterns (documented best practice and generic solutions to problems which recur) have been introduced by the software and systems engineering community to support the reuse of design expertise including architecture design. The architectural design of DT depends on the overall purpose and application context since, in practice, DTs can be applied in various ways to different problems or to different lifecycle phases [39]. Since applying DT for intelligent and efficient infrastructure maintenance is to enhance the overall system’s intelligence, infrastructure DT architecture design requires understanding several independent, but related, domains. Key characteristics when designing an infrastructure DT architecture include:
- a visualised digital replica containing geometric and semantic data in terms of materials, stresses, and strains
- utilising data spanning along the infrastructure whole life cycle, i.e., planning, design, constructing, operation and maintenance, and disposal
- physical connection (i.e., to monitor existing state in real time)
- ability to inform future projects and maintenance practices through generating valuable informative data from processing real-time data and/or simulating what-if scenarios
Therefore, the following are challenges ahead of developing an infrastructure DT for intelligent maintenance purpose:
- Building appropriate model of an infrastructure (multi-domain, multi-disciplinary)
- Establishing the connection between the infrastructure and its DT to support seamless monitoring
- Integrating different services
- Consolidating data from physical model and its DT and developing data aggregation and interpretation methods/algorithms (key to generating consumable information) and
- Developing maintenance measure decision-making methods
So, the major questions to answer when developing an infrastructure DT, include:
- Which parts/components need to be monitored?
- What domain needs to be measured (e.g., displacement, temperature, deflection etc.)?
- Which sensors (and configuration/arrangement) are adopted to monitor and measure infrastructure responses?
- What are the thresholds for fault warnings? (e.g., the predefined allowable tolerance for the measured strain by a strain gauge before a fault alarm is triggered)
- What is the frequency of data collection and simulation to make the system efficient?
- What analysis processes are needed to drive and interpret the data (modelling and simulation)?
In practical applications, if not impossible, it is difficult to directly measure external acting force on a performing infrastructure. In structural dynamics, where the response of a structure is found from known loads applied to it, the problem is called forward problem. On the other hand, an inverse problem is where the response of a structure is estimated from physical sensor measurements attached to it. A strain gauge is a type of electrical sensor with the primary application of measuring strain. When an external load is applied to an infrastructure, two parameters exist including stress and strain. Stress is the resisting force, which pushes back in the opposite direction of the applied load, and strain is the deformation within the infrastructure, which can be measured by the strain gauge sensor. In an inverse method for structural analysis, strain gauges measure the strain (both expansion and contraction) to calculate the causing stress. Then, the applied load to the structural component can be calculated from the measured stress.
Figure 9 presents the process map to implement the DT technology for infrastructure intelligent maintenance.
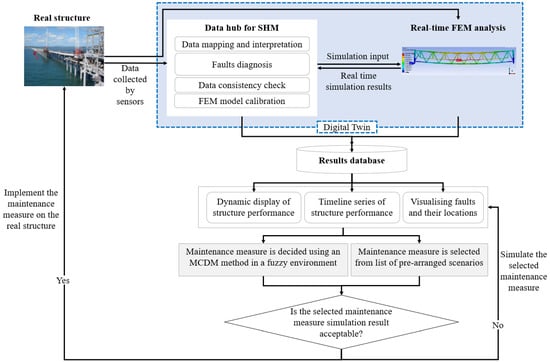
Figure 9.
Process map in DT-driven SHM system.
Given the purpose of this study, which is efficient and intelligent monitoring and understanding the structural performance of an in-operation structure, in Figure 9, the section which is related to the proposed DT approach is highlighted in blue. As can be seen in the highlighted section in Figure 9, telemetry data from the physical infrastructure are collected, studied, and interpreted to understand and analyse the performance state of the infrastructure and determine if it performs as designed. The proposed DT model entails automatic transmittal of real-time data from the in-service infrastructure to its virtual model and therefore enable simulation of the structure response.
Data are obtained via different sources including infrastructure historical data and in situ monitoring tools (e.g., strain gauge, vibrometers, tiltmeters etc.). To facilitate one-to-one mapping between the real-time data and the virtual model data and consequently allowing the infrastructure performance monitoring, the telemetry data need to be parsed into the same format as engineering values in the virtual model.
Simulation is the basis for design decisions and testing for many engineering problems [25]. Finite element (FE) models are often relied upon by engineers to better understand current and future structural condition of infrastructures. The model complexity depends on the purpose of their development, the infrastructure they represent and available resources (technical skills, computational power, time, etc.). Accordingly, infrastructure structural health in this study (i.e., characterising damage and establishing health condition of infrastructure) will be evaluated via numerical modelling and simulation.
FE models involve assumptions and other parameters, which are unavoidably susceptible to uncertainties. So, proper verification and interpretation of the FE model results warrants experience of the users. In this study, sensor data acquisition methods and the historical data will be used to calibrate the FE model and validate the fidelity of its simulation results. Taking pre-defined acceptable values (based on historical data for the infrastructure performance) as the reference, simulation data as well as real-time data, faults are identified using FE models (via mapping the real-time modelling result against expected values based on original design). Then, extracted data including faulty components will be visualised to: (1) display the structure health state and performance timeline, and (2) visually present the faulty components in an interpretable and expressible manner.
To decide about alternative maintenance solutions for the diagnosed failure, the proposed method chooses the preferred maintenance measure from either a series of pre-arranged maintenance measures or through a qualitative decision-making method. Pre-arranged maintenance measures are based on historical data. They are maintenance measures which have been previously applied to similar structural failure and are likely to be effective. They can be relied upon for quicker and more effective responses to similar failure modes and therefore bring about cost and time savings.
On the other hand, if the failure mode is new and unknown, the proposed architecture design utilises a multi-criteria decision-making (MCDM) method in a fuzzy environment to qualitatively prioritise different maintenance alternatives [45]. Benefits of the fuzzy MCDM method include: (1) qualitatively evaluating potential maintenance measures while considering uncertainty in judgements (thanks to the fuzzy logic and its ability to take into account the footprint of uncertainty in subjective/qualitative decision-making environments), and (2) enabling the asset owner to select the best maintenance measure option based on its current asset management strategy (i.e., MCDM enables the asset owner to choose the maintenance measure which provides the most optimum outcome that is desired by an organisation’s maintenance strategy at the time). The proposed MCDM method also is flexible in terms of the number of evaluation criteria and maintenance alternatives that can be considered for evaluation.
Before being implemented, the selected maintenance measure is simulated using the DT model to verify its effectiveness in addressing the identified defect(s). As can be seen in the process map, this cycle (selecting a maintenance measure and simulating its effectiveness) continues until the best maintenance measure is selected.
What-if scenarios discover the consequences of informal speculations before implementation, which can save time and cost. Another benefit of the proposed DT model includes the ability to simulate a physical asset’s behaviour and evaluate its performance and response under different scenarios before implementation and consequently bringing about considerable savings at the very early stage during strategic decision-making for future investments.
Advantages of the Proposed Architecture Compared to Existing Methods
The proposed architecture offers the following benefits:
Data acquisition: existing infrastructure maintenance management methods (in practice) require allocating workforce to attend the asset locations, conduct physical inspections (which might require shutting down the plant or infrastructure). However, the proposed method utilises sensors to collect data, which brings about time and cost savings to the asset owners as there will be no shut down required or manpower utilised to acquire real-time data.
Data accuracy: existing methods use expert judgement (which always carries some level of uncertainty) to identify defects and prescribe measures for rectification. The proposed method, however, uses an objective approach, i.e., real-time data, to analyse the realistic status of the asset, map it against the design expectation and then decide about its maintenance.
Some of the previous applications in utilising IoT technologies partially applied these technologies to inform decision making about asset maintenance management. Examples of such applications include Rubert et al. [18], which just utilised strain gauges to monitor strains in wind turbine foundation to avoid physical inspections, or Heo et al. [14], who aimed to develop a method to measure diverse structural responses based on wireless system. Their test included measuring the distance that communication (wireless system) is possible, and the accuracy of responses collected, or Muttillo et al. [6], who designed an IoT system for SHM to identify possible damages and monitor structure performance over time. Their work used smart devices to collect data and a data logger/interface to display the outputs, but did not run any structural analysis to analyse and monitor the overall performance. As far as our review of the literature is concerned, no previous DT application for conducting a real-time structural integrity assessment of civil infrastructure has been conducted.
The proposed method provides a real-time structural assessment of infrastructure performance compared to some previous similar applications, which take the appearance of physical assets to decide about their structural health, such as utilising image processing and 3D models to inform decision making about asset maintenance management, conducted by Shim et al. [46]. One of the biggest disadvantages of such an approach is using a non-structural assessment method to decide about the structural health condition of an infrastructure asset.
5. Case Study
Dalrymple Bay Coal Terminal (DBCT) is among the largest coal suppliers at Hay Port, Queensland, Australia. Metallurgical and thermal coal are two main coal categories of this terminal (80% of export is metallurgical coal). This terminal consists of three rail receival stations and has a “Live Capacity” of 2.28 million tons.
To implement the developed DT concept, one of the structures at DBCT is selected. The subject structure (Figure 10) is a truss type conveyor jetty stretched about 3.8 km from onshore to offshore where the berth structures are located.
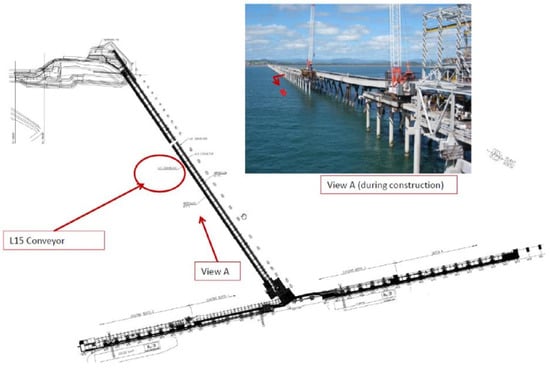
Figure 10.
L15 conveyor at DBCT.
Implementing the DT Concept on DBCT
Vibration, corrosion and loading are the most contributing factors in determining the structure behaviour. To understand where to install sensors along the L15 conveyor, a FEM model was created as can be seen in Figure 11. Therefore, wireless tilt sensors, strain gauges, and vibrometers are installed on a typical truss structure of the conveyor, as shown in Figure 12. Tilt meter was installed to record deflections of vertical side members due to various imposed load cases, particularly as result of the followings:
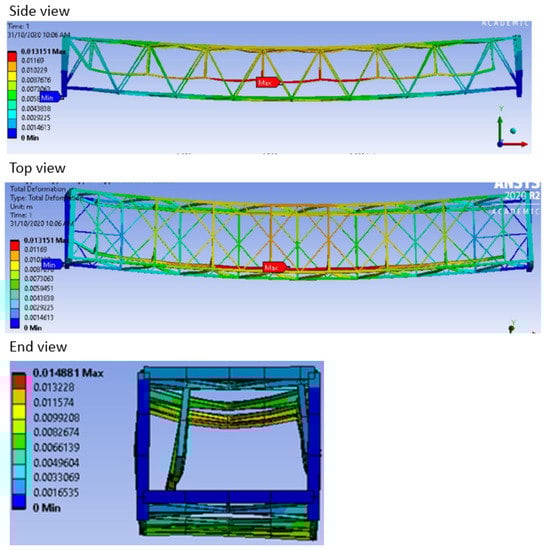
Figure 11.
Views of finite element model under live load 4 m/s.
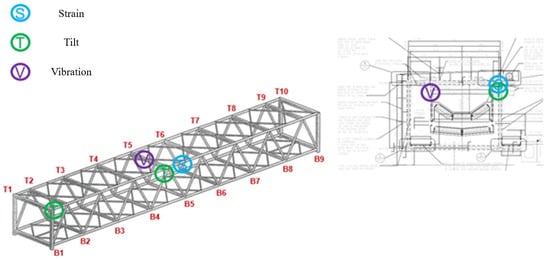
Figure 12.
Locations to install sensors.
- Wind and cyclonic pressures as the structure is located in a tropical coastal area and prone to cyclones and strong winds (e.g., as per AS 1170.2 the cyclonic wind speed can be as strong as 55 m/s)
- Live loads on belts and their fluctuations over time to monitor the structural responses to these loads including belt floodings and encrustation.
It is worth noting that the type and location of sensors are selected based on the results of a 3D structural finite element model with some load assumptions close to actual truss-imposed loads. The assumed load cases are listed in Table 3.
Table 3.
Assumed load cases in the Conveyor L15 3D model.
Figure 11 shows a typical output of 3D deformation model.
Figure 12 illustrates the approximate locations along the structure to mount the sensors.
Figure 13 illustrates photos of the installed tilt meters.
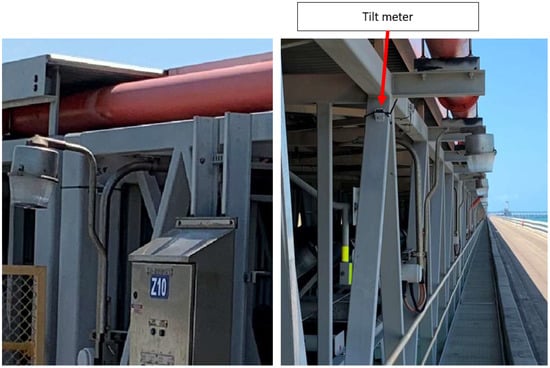
Figure 13.
Installed tilt meter.
Senscope software, provided by RESENSYS, MD, USA, was used as the data hub to store the real-time data from the tilt sensors. The data have been collected and stored for a period of 12 months. Due to Senscope software, provided by RESENSYS, MD, USA, limitation and a few other challenges only tilt sensor data were considered as input into the 3D model in ANSYS workbench, provided by ANSYS, PA, USA. Figure 14, Figure 15 and Figure 16 show the conveyor boundary conditions, the deformations resulted from real-time values collected by tilt sensors and maximum principal stress along the conveyor respectively. A sample of the collected data is presented in Appendix A.1.
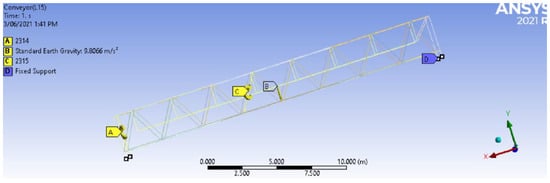
Figure 14.
Applied boundary conditions on the conveyor.
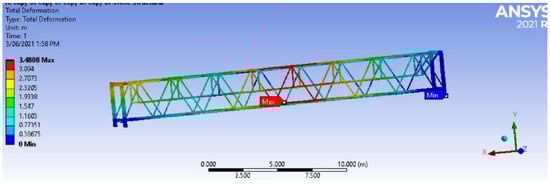
Figure 15.
Total deformation along the conveyor.
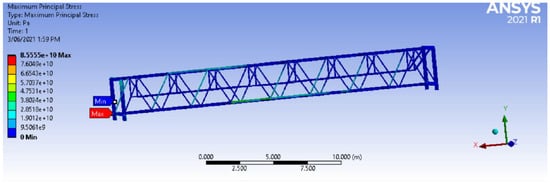
Figure 16.
Maximum principal stress along the conveyor.
Results from applying real-time tilt data is presented in Appendix A.2.
Then, a CSV or DOE file is created to build a reduced order model (ROM), validate it and export into ANSYS twin builder for creating the DT. Appendix A.3 shows building and evaluating ROM in Static ROM Builder. A Static ROM file with these input and output parameters is generated and opened in ANSYS Twin Builder. The ROM conducts its analysis in less processing time compared to conventional finite element analysis in Workbench. So, to achieve the objective of the digital twin, the inputs are applied to the 3D model continuously and automatically to monitor the structure. To monitor the structure changes under different real-time loading conditions, ROM and sensor data should be connected in an IoT platform. ThingWorx ptc is selected as IoT platform to connect the ROM (in ANSYS Twin Builder) and sensor data (in Senscope software). Therefore, to federate all the sources into one IoT platform, a code is developed, and a Thing is created. The sequel code to generate a Thing is presented in Appendix A.4.
Then, as presented in Appendix A.5, a mashup page is created to map the data (from sensors and ROM) in Thingworx. Senscope (which contains the sensor data) was connected to Thingworx (IoT platform/hub) and real-time analysis of the static structural data of the conveyor was conducted.
6. Conclusions
To develop a DT for intelligent infrastructure maintenance purposes, first the structural health and behaviour of the infrastructure should be understood. This is achieved by collecting data from the infrastructure and conducting computational processing, and simulation. Real-time simulation modelling is useful where detailed information on the infrastructure dynamics can be achieved and enables us to determine the root causes of structural responses, including failures. Data modelling, on the other hand, is applicable for situations where sufficient data can be obtained from the infrastructure for model learning, but the model cannot determine root causes. Furthermore, if a change in structure or operation environment takes place, the previous data model cannot be used and a new learning model is required. Evaluating the structural health condition is then followed by an infrastructure fault diagnosis and maintenance measure prescription.
The advantages of the proposed DT approach in intelligent infrastructure maintenance mainly lie in the deep integration of cyber and physical environments. The proposed DT concept is powered by integration, outcome orientated, is customisable, and built on data. Therefore, its success warrants the technological solution providers to integrate the advances and consequently facilitate the implementation of the DT technology.
In this study we utilised tilt sensor, strain gauge, and vibrometer to monitor an offshore jetty conveyor of a port terminal. Collected sensor data represented real structural behaviour of the jetty conveyor truss structure and was modelled in the ANSYS mechanical FEA, provided by ANSYS, PA, USA, tool followed by a static ROM in ANSYS Twin Builder, provided by ANSYS, PA, USA. There are still many interoperability challenges to create the DT of infrastructure because of the dynamic loadings and complications in connecting them to the virtual models. As part of the future work for this study we are planning to install strain gauges and displacement sensors, utilise different platforms/scripts to facilitate interoperability and communication between the different software which we will be using to dynamically monitor structural performance. Furthermore, we will be using the iTwin platform, provided by Bentley Systems, PA, USA, to conduct finite element analysis and use inverse methods to feed the sensor data to the digital model for simulation. The future work of this study will also include simulating maintenance measures before implementing, which will result in more time and cost savings in asset management.
Author Contributions
Conceptualization, M.M. and F.S.; methodology, M.M., S.S. and F.S.; software, M.M.; writing—original draft preparation, F.S.; writing—review and editing, F.S., M.M. and S.M.; supervision, M.M. and S.S.; project administration, F.S. and M.M. All authors have read and agreed to the published version of the manuscript.
Funding
This research received no external funding.
Institutional Review Board Statement
Not applicable.
Informed Consent Statement
Not applicable.
Data Availability Statement
Not applicable.
Conflicts of Interest
The authors declare no conflict of interest.
Appendix A
Appendix A.1
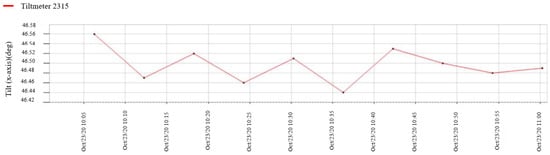
Figure A1.
A Sample of the Collected Data from One of the Tilt Sensos (in graph format).
Table A1.
A Sample of the Collected Data from One of the Tilt Sensos (in table format).
Table A1.
A Sample of the Collected Data from One of the Tilt Sensos (in table format).
| Time | 2315 (X-Axis) | 2315 (Y-Axis) | 2315 (Z-Axis) |
|---|---|---|---|
| 4 July 2021 16:05:29.000 | 46.56 | 2.69 | 43.01 |
| 4 July 2021 16:11:29.000 | 46.6 | 2.71 | 43.03 |
| 4 July 2021 16:17:29.000 | 46.6 | 2.76 | 43.04 |
| 4 July 2021 16:23:29.000 | 46.58 | 2.76 | 43.02 |
| 4 July 2021 16:29:29.000 | 46.57 | 2.76 | 43.04 |
| 4 July 2021 16:35:29.000 | 46.58 | 2.76 | 43.03 |
| 4 July 2021 16:41:29.000 | 46.58 | 2.72 | 43.04 |
| 4 July 2021 16:47:29.000 | 46.58 | 2.76 | 43.04 |
| 4 July 2021 16:53:29.000 | 46.58 | 2.78 | 43.07 |
| 4 July 2021 16:59:29.000 | 46.6 | 2.8 | 43.07 |
| 4 July 2021 17:05:29.000 | 46.58 | 2.66 | 43.05 |
Appendix A.2
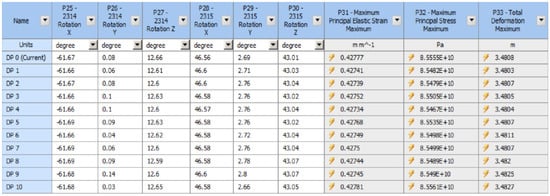
Figure A2.
Results from Applied Real-Time Tilt Data.
Appendix A.3
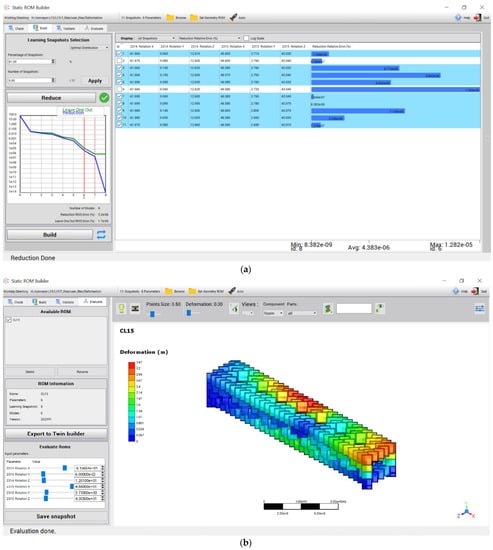
Figure A3.
(a). Building ROM. (b). Evaluating ROM.
Appendix A.4. The Sequel Codes to Generate a Thing in Thingworx
For query data
“Data_<<SID>>`.`Data.<<DID>>.<<SID>>.<<DF>>` where Time < [[to]] and Time > [[from]]”
2. For query script
“logger.warn(“did = ‘“ + did+”‘“);
logger.warn(“sid = ‘“ + sid+”‘“);
logger.warn(“df = ‘“ + df+”‘“);
logger.warn(“from = ‘“ + from+”‘“);
logger.warn(“to = ‘“ + to+”‘“);
let result = me.queryData({
DF: df,
from: from,
to: to,
DID: did,
SID: sid
});
logger.warn(“result = ‘“ + result.getRowCount() +”‘“);”
3. For Table list
“select ql.*, REPLACE(DID, “-”, ““) did2, REPLACE(SID, “-”, ““) SID2 from QuantityList ql;”
Appendix A.5
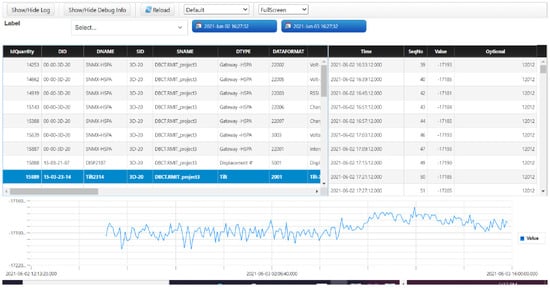
Figure A4.
Mashup Page.
References
- Medhi, M.; Dandautiya, A.; Raheja, J.L. Real-Time Video Surveillance Based Structural Health Monitoring of Civil Structures Using Artificial Neural Network. J. Nondestruct. Eval. 2019, 38, 63. [Google Scholar] [CrossRef]
- Shi, W.; Wu, C.; Wang, X. A Prototype Tool of Optimal Wireless Sensor Placement for Structural Health Monitoring; Springer International Publishing: Cham, Switzerland, 2018; pp. 53–73. [Google Scholar] [CrossRef]
- Smith, I.F.C.; Domer, B. Advanced Computing Strategies for Engineering: 25th EG-ICE International Workshop 2018, Lausanne, Switzerland, June 10–13, 2018, proceedings. Part II; Springer International Publishing: Cham, Switzerland, 2018. [Google Scholar]
- Chen, W.; Chen, K.; Cheng, J.C.P.; Wang, Q.; Gan, V.J.L. BIM-based framework for automatic scheduling of facility maintenance work orders. Autom. Constr. 2018, 91, 15–30. [Google Scholar] [CrossRef]
- Hallaji, S.M.; Fang, Y.; Winfrey, B.K. Predictive maintenance of pumps in civil infrastructure: State-of-the-art, challenges and future directions. Autom. Constr. 2022, 134, 104049. [Google Scholar] [CrossRef]
- Muttillo, M.; Stornelli, V.; Alaggio, R.; Paolucci, R.; Di Battista, L.; de Rubeis, T.; Ferri, G. Structural Health Monitoring: An IoT Sensor System for Structural Damage Indicator Evaluation. Sensors 2020, 20, 4908. [Google Scholar] [CrossRef] [PubMed]
- Artus, M.; Koch, C. State of the art in damage information modeling for RC bridges—A literature review. Adv. Eng. Inform. 2020, 46, 101171. [Google Scholar] [CrossRef]
- Shangguan, D.; Chen, L.; Ding, J. A Digital Twin-Based Approach for the Fault Diagnosis and Health Monitoring of a Complex Satellite System. Symmetry 2020, 12, 1307. [Google Scholar] [CrossRef]
- Mourtzis, D.; Angelopoulos, J.; Panopoulos, N. Intelligent Predictive Maintenance and Remote Monitoring Framework for Industrial Equipment Based on Mixed Reality. Front. Mech. Eng. 2020, 6, 578379. [Google Scholar] [CrossRef]
- Errandonea, I.; Beltrán, S.; Arrizabalaga, S. Digital Twin for maintenance: A literature review. Comput. Ind. 2020, 123, 103316. [Google Scholar] [CrossRef]
- Haag, S.; Anderl, R. Digital twin—Proof of concept. Manuf. Lett. 2018, 15, 64–66. [Google Scholar] [CrossRef]
- Mourtzis, D.; Angelopoulos, J.; Panopoulos, N. Design and Development of an Edge-Computing Platform Towards 5G Technology Adoption for Improving Equipment Predictive Maintenance. Procedia Comput. Sci. 2022, 200, 611–619. [Google Scholar] [CrossRef]
- Meng, X.; Nguyen, D.T.; Xie, Y.; Owen, J.S.; Psimoulis, P.; Ince, S.; Chen, Q.; Ye, J.; Bhatia, P. Design and Implementation of a New System for Large Bridge Monitoring-GeoSHM. Sensors 2018, 18, 775. [Google Scholar] [CrossRef] [PubMed] [Green Version]
- Heo, G.; Son, B.; Kim, C.; Jeon, S.; Jeon, J. Development of a wireless unified-maintenance system for the structural health monitoring of civil structures. Sensors 2018, 18, 1485. [Google Scholar] [CrossRef] [PubMed] [Green Version]
- Theiler, M.; Dragos, K.; Smarsly, K. Semantic Description of Structural Health Monitoring Algorithms Using Building Information Modeling; Springer International Publishing: Cham, Switzerland, 2018; pp. 150–170. [Google Scholar]
- Valinejadshoubi, M.; Bagchi, A.; Moselhi, O. Development of a BIM-Based Data Management System for Structural Health Monitoring with Application to Modular Buildings: Case Study. J. Comput. Civ. Eng. 2019, 33, 5019003. [Google Scholar] [CrossRef]
- Feng, D.; Feng, M.Q. Identification of structural stiffness and excitation forces in time domain using noncontact vision-based displacement measurement. J. Sound Vib. 2017, 406, 15–28. [Google Scholar] [CrossRef]
- Rubert, T.; Perry, M.; Fusiek, G.; McAlorum, J.; Niewczas, P.; Brotherston, A.; McCallum, D. Field Demonstration of Real-Time Wind Turbine Foundation Strain Monitoring. Sensors 2018, 18, 97. [Google Scholar] [CrossRef] [Green Version]
- Quqa, S.; Landi, L.; Diotallevi, P.P. Seismic structural health monitoring using the modal assurance distribution. Earthq. Eng. Struct. Dyn. 2021, 50, 2379–2397. [Google Scholar] [CrossRef]
- Reagan, D.; Sabato, A.; Niezrecki, C. Feasibility of using digital image correlation for unmanned aerial vehicle structural health monitoring of bridges. Struct. Health Monit. 2018, 17, 1056–1072. [Google Scholar] [CrossRef]
- Moi, T.; Cibicik, A.; Rølvåg, T. Digital twin based condition monitoring of a knuckle boom crane: An experimental study. Eng. Fail. Anal. 2020, 112, 104517. [Google Scholar] [CrossRef]
- Lin, K.; Xu, Y.-L.; Lu, X.; Guan, Z.; Li, J. Digital twin-based collapse fragility assessment of a long-span cable-stayed bridge under strong earthquakes. Autom. Constr. 2021, 123, 1. [Google Scholar] [CrossRef]
- Zhang, L.; Zhou, L.; Horn, B.K.P. Building a right digital twin with model engineering. J. Manuf. Syst. 2021, 59, 151–164. [Google Scholar] [CrossRef]
- Rosen, R.; von Wichert, G.; Lo, G.; Bettenhausen, K.D. About The Importance of Autonomy and Digital Twins for the Future of Manufacturing. IFAC-Papersonline 2015, 48, 567–572. [Google Scholar] [CrossRef]
- Boschert, S.; Rosen, R. Digital Twin—The Simulation Aspect; Springer International Publishing: Cham, Switzerland, 2016; pp. 59–74. [Google Scholar]
- Grieves, M.; Vickers, J. Digital Twin: Mitigating Unpredictable, Undesirable Emergent Behavior in Complex Systems; Springer International Publishing: Cham, Switzerland, 2016; pp. 85–113. [Google Scholar]
- Delzendeh Elham, A.-A.M. Digital Twin in Construction—Part 2. Available online: https://cyberrealityx.com/digital-twin-in-construction-2/ (accessed on 20 August 2021).
- iMove Smart Bridge Health Monitoring and Maintenance Prediction. Available online: https://imoveaustralia.com/project/smart-bridge-health-monitoring-and-maintenance-prediction/?subscribe=success#subscribe-blog-1 (accessed on 3 May 2022).
- Wang, K.-J.; Lee, T.-L.; Hsu, Y. Revolution on digital twin technology—A patent research approach. Int. J. Adv. Manuf. Technol. 2020, 107, 4687–4704. [Google Scholar] [CrossRef]
- Hlady, J.; Glanzer, M.; Fugate, L. Automated Creation of the Pipeline Digital Twin During Construction: Improvement to Construction Quality and Pipeline Integrity. In Proceedings of the 2018 12th International Pipeline Conference, Calgary, AB, Canada, 24–28 September 2018; p. V002T02A004. [Google Scholar] [CrossRef]
- Barbosa, A.d.S.; Silva, F.P.; Crestani, L.R.d.S.; Otto, R.B. Virtual assistant to real time training on industrial environment. In Transdisciplinary Engineering Methods for Social Innovation of Industry 4.0; IOS Press: Amsterdam, The Netherlands, 2018; pp. 33–42. [Google Scholar] [CrossRef]
- Kaewunruen, S.; Xu, N. Digital Twin for Sustainability Evaluation of Railway Station Buildings. Front. Built Environ. 2018, 4, 77. [Google Scholar] [CrossRef] [Green Version]
- Pairet, È.; Ardón, P.; Liu, X.; Lopes, J.; Hastie, H.; Lohan, K. A Digital Twin for Human-Robot Interaction. In Proceedings of the 2019 14th ACM/IEEE International Conference on Human-Robot Interaction (HRI), Daegu, Korea, 11–14 March 2019; p. 372. [Google Scholar]
- Rødseth, H.; Eleftheriadis, R.; Lodgaard, E.; Fordal, J. Operator 4.0—Emerging Job Categories in Manufacturing; Springer: Singapore, 2019; pp. 114–121. [Google Scholar]
- Longo, F.; Nicoletti, L.; Padovano, A. Ubiquitous knowledge empowers the Smart Factory: The impacts of a Service-oriented Digital Twin on enterprises’ performance. Annu. Rev. Control 2019, 47, 221–236. [Google Scholar] [CrossRef]
- Venables, M. Future maintenance: Transitioning from digitalisation to industry 4.0. Plant Eng. 2017, 2017, 10–12. [Google Scholar]
- Omer, M.; Margetts, L.; Hadi Mosleh, M.; Hewitt, S.; Parwaiz, M. Use of gaming technology to bring bridge inspection to the office. Struct. Infrastruct. Eng. 2019, 15, 1292–1307. [Google Scholar] [CrossRef] [Green Version]
- Anderson, S.; Barvik, S.; Rabitoy, C. Innovative Digital Inspection Methods; Offshore Technology Conference: Houston, TX, USA, 2019. [Google Scholar]
- Tekinerdogan, B.; Verdouw, C. Systems architecture design pattern catalog for developing digital twins. Sensors 2020, 20, 5103. [Google Scholar] [CrossRef]
- Pal, S.K.; Mishra, D.; Pal, A.; Dutta, S.; Chakravarty, D.; Pal, S. Digital Twin—Fundamental Concepts to Applications in Advanced Manufacturing; Springer International Publishing AG: Cham, Switzerland, 2021. [Google Scholar]
- Palo, H.K. Semantic IoT: The Key to Realizing IoT Value; Springer International Publishing: Cham, Switzerland, 2021; Volume 941, pp. 81–102. [Google Scholar]
- Grzybek, H.; Xu, S.; Gulliver, S.; Fillingham, V. Considering the Feasibility of Semantic Model Design in the Built-Environment. Buildings 2014, 4, 849–879. [Google Scholar] [CrossRef] [Green Version]
- Ye, C.; Butler, L.; Calka, B.; Iangurazov, M.; Lu, Q.; Gregory, A.; Girolami, M.; Middleton, C. A digital twin of bridges for structural health monitoring. In Structural Health Monitoring 2019: Enabling Intelligent Life-Cycle Health Management for Industry Internet of Things (IIOT)—Proceedings of the 12th International Workshop on Structural Health Monitoring; DEStech Publications: Stanford, CA, USA, 2019. [Google Scholar] [CrossRef]
- Kritzinger, W.; Karner, M.; Traar, G.; Henjes, J.; Sihn, W. Digital Twin in manufacturing: A categorical literature review and classification. IFAC Pap. 2018, 51, 1016–1022. [Google Scholar] [CrossRef]
- Shahrivar, F.; Mahmoodian, M.; Li, C.Q. Comparative analysis of Fuzzy Multi Criteria Decision Making methods in maintenance prioritization of infrastructure assets. Int. J. Crit. Infrastruct. 2022, 18, 1. [Google Scholar] [CrossRef]
- Shim, C.-S.; Dang, N.-S.; Lon, S.; Jeon, C.-H. Development of a bridge maintenance system for prestressed concrete bridges using 3D digital twin model. Struct. Infrastruct. Eng. 2019, 15, 1319–1332. [Google Scholar] [CrossRef]
Publisher’s Note: MDPI stays neutral with regard to jurisdictional claims in published maps and institutional affiliations. |
© 2022 by the authors. Licensee MDPI, Basel, Switzerland. This article is an open access article distributed under the terms and conditions of the Creative Commons Attribution (CC BY) license (https://creativecommons.org/licenses/by/4.0/).