Article

Application of Open Government Data to Sustainable City Indicators: A Megacity Case Study

by
Harmi Takiya
1,2,*,
Iara Negreiros
3,
Charles Lincoln Kenji Yamamura
1,
José Alberto Quintanilha
4,
Cláudia Aparecida Soares Machado
5,
Alex Abiko
3,
Cintia Isabel de Campos
6,
Marcelo Schneck de Paula Pessoa
1 and
Fernando Tobal Berssaneti
1
1
Department of Production Engineering, Polytechnic School, University of São Paulo, São Paulo 05508-010, Brazil
2
President’s Office, Court of Auditors of the City of São Paulo, São Paulo 04027-000, Brazil
3
Department of Civil Construction Engineering, Polytechnic School, University of São Paulo, São Paulo 05508-010, Brazil
4
Institute of Energy and Environment, University of São Paulo, São Paulo 05508-010, Brazil
5
Department of Transportation Engineering, Polytechnic School, University of São Paulo, São Paulo 05508-070, Brazil
6
Faculty of Science and Technology, Federal University of Goias, Rua Mucuri S/N—Setor Conde dos Arcos, Aparecida de Goiânia 74968-755, Brazil
*
Author to whom correspondence should be addressed.
Sustainability 2022, 14(14), 8802; https://doi.org/10.3390/su14148802
Submission received: 10 June 2022 / Revised: 13 July 2022 / Accepted: 13 July 2022 / Published: 18 July 2022

Abstract

:
The access to open government data has been a relevant topic for societies around the world, especially over the last ten years. This paper aims to analyze the indicators of the São Paulo City Observatory (ObservaSampa), confronting them with the ISO 3712x series (sustainable, smart, and resilient cities) standards, to assess if the former meet both open data principles and the ISO prescriptions. Bibliometric analysis, comparative analysis, cluster analysis, and principal component analysis (PCA) were the methods used in this research. From the comparative analysis, 18 indicators were identified as conforming and 41 as partially conforming. Thus, 20% of the ObservaSampa indicators adhere to the ISO standards. The PCA applied to the conforming indicators shows component 1 is related to socioeconomic dimensions, while component 2 refers to social policy, with both appraisals confirmed by cluster analysis. Measuring and presenting city data in compliance with indicator standards is relevant because they open the possibility of comparing different cities. However, there is still a lack of consensus on a common set of indicators to be accommodated within the current ISO standards system.

1. Introduction

The study of global population growth and its concentration in megacities (more than 10 million inhabitants) [1,2] has disclosed several challenges that must be faced by local governments. For instance, providing quality services, such as health, security, education, and public transportation, or tackling environmental issues, such as atmospheric pollution, waste disposal, and energy consumption [1], demand sustainable and intelligent solutions [2].
The current smart city discussion is closely related to the transparency and availability of information in an open data format, empowering the population to inspect, participate, and propose public policies [3,4,5,6], instead of just voting occasionally [7,8]. Open government data (OGD) presents government information to any interested parts, in a format suitable to their needs, enhancing its transparency. OGD moves a city closer to the smart city profile.
Growing demand for transparency of government data and its compliance to legislation has turned open government data into a very contemporary topic of discussion, especially over the last ten years [9,10,11,12]. Brazil is a member of the OGP—Open Government Partnership [13]—an important institutional action for the global adoption of regulatory transparency and open data frameworks and policies—from its inception in 2011 [9,14,15]. The city of São Paulo has been an OGP member since 2016.
The implementation of government data disclosure policies is intensely debated by Bates [11], who presents an OGD overview of London. The author presents a bibliographic review referring to the 2008–2019 period, pointing to a significant increase in scientific production on open government experiences from 2012, also observed by the authors of [10]. Stakeholder and civil society training in OGD is important as it intensifies both its applicability and effectiveness. The authors of [16] present examples of OGD training in Spain, Italy, and the United States.
The new ISO series on sustainable cities has been published from 2013, with three city indicator standards: ISO 37120:2018 (“Indicators for city services and quality of life”) [17], ISO 37122:2019 (“Indicators for smart cities”) [18], and ISO 37123:2019 (“Indicators for resilient cities”) [19]. Collectively, they compose the ISO 3712x series and are discussed further in Section 2.1.1. Standardized city data allow comparison among cities [20,21] and provide both consistency and reliability of information for sound public policies. The authors in [22,23,24,25] present the cases of Polish [26] and Italian [27] cities, noting both the correspondence between urban indicators and ISO 3712x prescriptions [17,18,19], and the correlation between continuously monitoring standardized indicators and improvements in the quality of life. City benchmarking can be used by decision makers to prioritize quality-of-life improvement projects and to estimate a city’s future performance [28]. In practice, however, there are significant limitations on comparing data underpinned by standardized indicators [29].
Government decision-making is becoming increasingly data driven. Data-driven government is a recent domain where data are used to create public value. Data are collected by IoT devices, surveys, and social media, and algorithms and data analytics are applied to support policy and decision making [30,31,32].
São Paulo is the largest city in Brazil, with 11,960,216 inhabitants in 2022 [33]. The Observatory of the City of São Paulo website [34]—known as ObservaSampa—was developed by the Municipal Department for Urban Development and Licensing in 2016, presenting 572 indicators on 18 themes, including education, health, economy, human rights, and governance. Many indicators contain historical data from 1996 and are updated every year.
The main objective of this paper is to analyze the ISO 3712x series standard indicators and compare them with the ObservaSampa indicators. The aim is to verify whether the ObservaSampa indicators meet the ISO requirements and formulas. We also discuss both the applicability of standardized indicators to the megacity of São Paulo and the characteristics of available open data.
The remaining sections of this article are organized as follows. Section 2 introduces the area of investigation and provides explanations on the ISO standards, open government data, and the São Paulo City Observatory indicators, which are the data sources used in this study. Next, we detail the bibliometric analysis and then discuss the applied methodology, which used both comparative analysis and principal component analysis. Section 3 presents the results; Section 4 discusses the results; and last, Section 5 concludes the investigation.

2. Materials and Methods

The geographical area of study is the megacity of São Paulo, which is part of, along with 38 other municipalities, the world’s fourth most populous metropolitan region, according to the United Nations [35]. The Municipality of São Paulo has a population of 11,960,216 inhabitants, an area of 1,532 km2, and 99.1% of its population lives in the urban area [33]. The municipality is divided into 32 subprefectures and 96 districts, the smallest administrative unit of the city, as illustrated in Figure 1.
Brazil had a national human development index (HDI) of 0.765 in 2019 [36] and uses an adapted method to calculate this index for municipalities, called the municipal human development index—IDHM [37]. Although its municipal human development index is high—0.805 in 2010 [33]—São Paulo has significant social inequality and peripheral regions lack basic infrastructure and have insufficient public transport, housing, leisure, and green areas. On the other hand, São Paulo presents a well-developed service sector, robust business tourism, technology centers, and universities, responsible for substantial knowledge generation. These characteristics are reflected in the ObservaSampa urban indicators.

2.1. Theoretical Foundations

2.1.1. ISO Standards

Standardized indicator systems such as ISO help cities and communities to meet their needs, develop cooperation, and communicate their performance. Appropriate indicator monitoring has the objectives of supporting efficient and coherent strategies, promoting sustainable, smart, and resilient cities and communities. Consequently, cities and communities are able to create and adopt policies and programs related to sustainable development [20,21].
ISO 37120 (“Indicators for city services and quality of life”) was the first international standard focused on data at city level, published in 2014 and revised in 2018 [17]. Two additional standards, ISO 37122 (“Indicators for smart cities”) [18] and ISO 37123 (“Indicators for resilient cities”) [19], were published by the Technical Committee ISO/TC 268 (“Sustainable cities and communities”) [21], providing 276 indicators in total (Figure 2). Together they comprise a consistent approach on what to measure and how measurement is carried out. ISO indicators do not provide value thresholds, judgement, or numerical targets for the indicators. Those 276 indicators are structured around 19 themes (Table 1), to help cities to measure performance of urban services and quality of life over time, and to compare with other cities, enabling them to learn and to share best practices. With sustainability as its guiding principle, ISO 37120:2018 defines a city indicator as a “quantitative, qualitative or descriptive measure” [17] (p. 1).
ISO 3712x (19 themes and 276 indicators) and the 2030 United Nations Agenda for Sustainable Development (17 Sustainable Development Goals—SDGs) [38] are similar and related. ISO 3712x indicators are designed to steer and evaluate city management performance. They can drive positive change, fostering city-level progress toward UN SDGs. Meanwhile, benchmarking or peer learning from relevant comparators can support realistic targets. In this respect, the UN Sustainable Development Goals are important reference points and benchmarks.
The Technical Committee ISO/TC 268 discussions refer to existing international sustainable development indicators, their respective SDGs, and other metrics, with the major objective of choosing a standard set of variables and calculation formulas to allow comparison among cities around the world.
A mirror committee of the ISO/TC 268 Technical Committee was launched by the Brazilian Technical Standards Association (ABNT/CEE-268), in October 2015, to scope out sustainable cities and communities. The comparison between 3712x standards and Brazilian indicator systems—allowing for local city profiles and legal framework—clarified the applicability of those standards in Brazil. Eight Brazilian standards were adapted from ISO/TC 268 (including ISO 3712x standards) to the local reality by ABNT/CEE-268 [39,40,41].
In addition to the 32 standards published by the ISO/TC 268 committee and 22 standards under development, there is a standard in FDIS (Final Draft International Standard) stage, entitled ISO 37110 “Sustainable cities and communities management requirements and recommendations for open data in smart cities and communities—overview and general principles”. This standard, with active participation of the Brazilian mirror committee, states that “the main beneficiaries of open government data in cities are the citizens” [42] (p. 1). The ISO 3712x series do not require the indicators to be reported in open data format, stating only that “reports on city indicators should compile the data required in the individual test methods” [17] (p. 80). ISO series publications are access-free for universities and ISO subscribers.

2.1.2. Case Studies Using the ISO 3712x Indicators

Since 2014, Technical Committee ISO/TC 268 (“Sustainable cities and communities”) has been collecting information on existing activities relevant to metrics, as well as sustainable, smart, and resilient city concepts, theoretical frameworks, and indicators [43].
In addition to the cases listed in the Technical Report ISO/TR 37150:2014 (“Smart community infrastructures—Review of existing activities relevant to metrics”) [43], there are many publications that rank several cities around the world [44,45,46], including Brazilian cities [47]. An oddity of those published rankings is that calculation formulas, variables, and metadata are not clearly presented. Those rankings present indicators that, despite being relevant and interesting, are calculated by institutions outside of the city administration. Unfortunately, those city rankings sometimes score cities, inducing inaccurate comparisons and are also used for labeling and marketing purposes. In other words, those city indicators lose their primary function, which is to analyze and monitor data-driven policies in search of continuous quality-of-life improvement.
The authors in [48] analyzed city indicators real-time dashboards (including Operations Centre in Rio de Janeiro, Brazil) and the authors in [2] reviewed 66 relevant research studies on the impact of open data initiatives to smart cities. Similarly, [23,25,49] performed a comprehensive analysis of various city indicators, with part of the ISO 3712x series applied to cities in the World Council on City Data (WCCD) database (https://www.dataforcities.org/, accessed on 3 July 2022. Unfortunately, data on ISO 37120 indicators for several cities that used to be in the platform are no longer available.
These authors undertook important critical analysis [23], using cases of cities such as London, Boston, New York, Amsterdam, Copenhagen, and Barcelona. The ISO 37120 indicators in the WCCD were also analyzed by [50], for Amsterdam, Gdynia, London, and Zagreb.
Some authors presented quantitative indicator studies (not necessarily of the entire ISO 3712x series), such as [26], which investigated 276 cities in Poland, applying questionnaires to assess the quality of life based on ISO 37120 indicators. Similarly, [27] used some indicators from ISO 37122 for Carugate, Melzo, and Pioltello, three municipalities in Northern Italy. On the other hand, [24] discussed the applicability of ISO 37120 indicators in 46 Arctic cities, but they did not present a numerical collection of these indicators, only the level of relevance in those cities.
While some authors have selected indicators from the ISO 3712x series due to their relevance, others chose them because of a theme, such as energy [51] and mobility [52,53]. The authors in [51] analyzed energy indicators of 21 cities from the WCCD database, such as Hague, Zwolle, Oslo, Valencia, and Porto. The research in [52] used ISO 37120 transport indicators from several cities in the Netherlands, Poland, Spain, Portugal, United Kington, and Belgium.
In Brazil, there are numerical surveys on ISO 37120 indicators in Rio de Janeiro [54] and the city of Sorocaba [55], ISO 37122 in a university campus in Sorocaba [56,57], and ISO 37123 in a district of São Paulo [58]. The authors of [54] and [55] also make comparisons with other cities from the WCCD database.
The Observatory of the City of São Paulo (ObservaSampa) was chosen not only because of the city’s projection but also due to the profusion of scientifically interesting and relevant data, in the form of indicators calculated by the City Hall and its specialists and used for city monitoring and management. In addition, ObservaSampa is an open database in compliance with open government data (as discussed further in Section 2.2.4). Each city indicator numerical value is followed by clearly presented calculation formulas, variables, metadata, and sources.

2.1.3. Indicators Observatory of the City of São Paulo—ObservaSampa

The São Paulo City Indicators Observatory, ObservaSampa [34], was developed by the Municipal Department for Urban Development in 2016 and presents 572 indicators (updated in October 2021) in 18 thematic areas. Historical series from 1996, most of them updated yearly (not all indicators are updated), are available with metadata tables, including calculation formulas, territorial coverage, and the definition of indicators.
The ObservaSampa dataset used in this study meets the principles of the Open Knowledge Foundation [59] and the Brazilian legislation [60] (Item 2.2.4, p. 12) related to public data represented in digital form. The dataset is structured in open format, processable by a machine referenced in the World Wide Web. The site is user-friendly, easy to access, and divided into several themes, showing metadata, year, and territorial scope.
Table 2 presents the ObservaSampa Observatory 572 indicators grouped in the 18 themes defined by City Hall, in alphabetical order.
The ObservaSampa website [34] also refers its 572 indicators to the 17 Sustainable Development Goals (SDGs) in the United Nations 2030 Agenda [38]. There are 300 SDG corresponding indicators in ObservaSampa, covering almost all SDGs, except goals 13, 14, and 15. ObservaSampa presents a higher number of indicators (572) than ISO 3712x standards (276). In the “Health” theme, there are 89 indicators; “Public Management”, 71; and “Economy”, 61. The municipality has created its own indicators, deemed essential to monitor public policies in a city with 12 million inhabitants, a diversity of socioeconomic, environmental, health, and other issues.

2.1.4. Open Government Data (OGD)

The city’s data transparency policy is backed by city laws. The City Hall data transparency website had 1,137,522 hits in 2021 [61]. However, the dissemination of information to the population must not only comply with open data principles—“open means anyone can readily access, use, modify, and share the data for any purpose (subject, at most, to requirements that preserve provenance and openness)” [59]—but should also be of easy access, search, and usage. Obstacles such as functionality and inclusiveness of open data initiatives are explored in [62]. Authors of [63,64,65] discussed applicability and the use of the instrument precommitment in open government data.
The Brazilian legislation defines OGD as “public data presented by digital means, structured in open format, able to be processed by a machine referenced in the World Wide Web and made available under open license which allows free use, consumption or crossing, limited to crediting the authorship or source” [60].
An important OGD characteristic widely discussed by authors is the re-utilization of data, as in the transformation of primary (or even secondary) data into information which can better serve and add value to specific demands of both citizens and stakeholders [66,67,68]. This added value is also described as “linked data”, one of the stages of data life-cycle defined by the authors of [10].
Data quality can be evaluated, among other characteristics, by citation of reliable sources, metadata when applicable, and the presence of historical series. Those attributes are also present in the Data Curation of Life Cycle stage as defined by the authors of [10].
Regarding the assumptions of OGD, the ObservaSampa dataset used in this study meets the principles defined by the Open Knowledge Foundation [59] and the Brazilian legislation [60] (Item 2.2.4, p. 12).

2.2. Methods

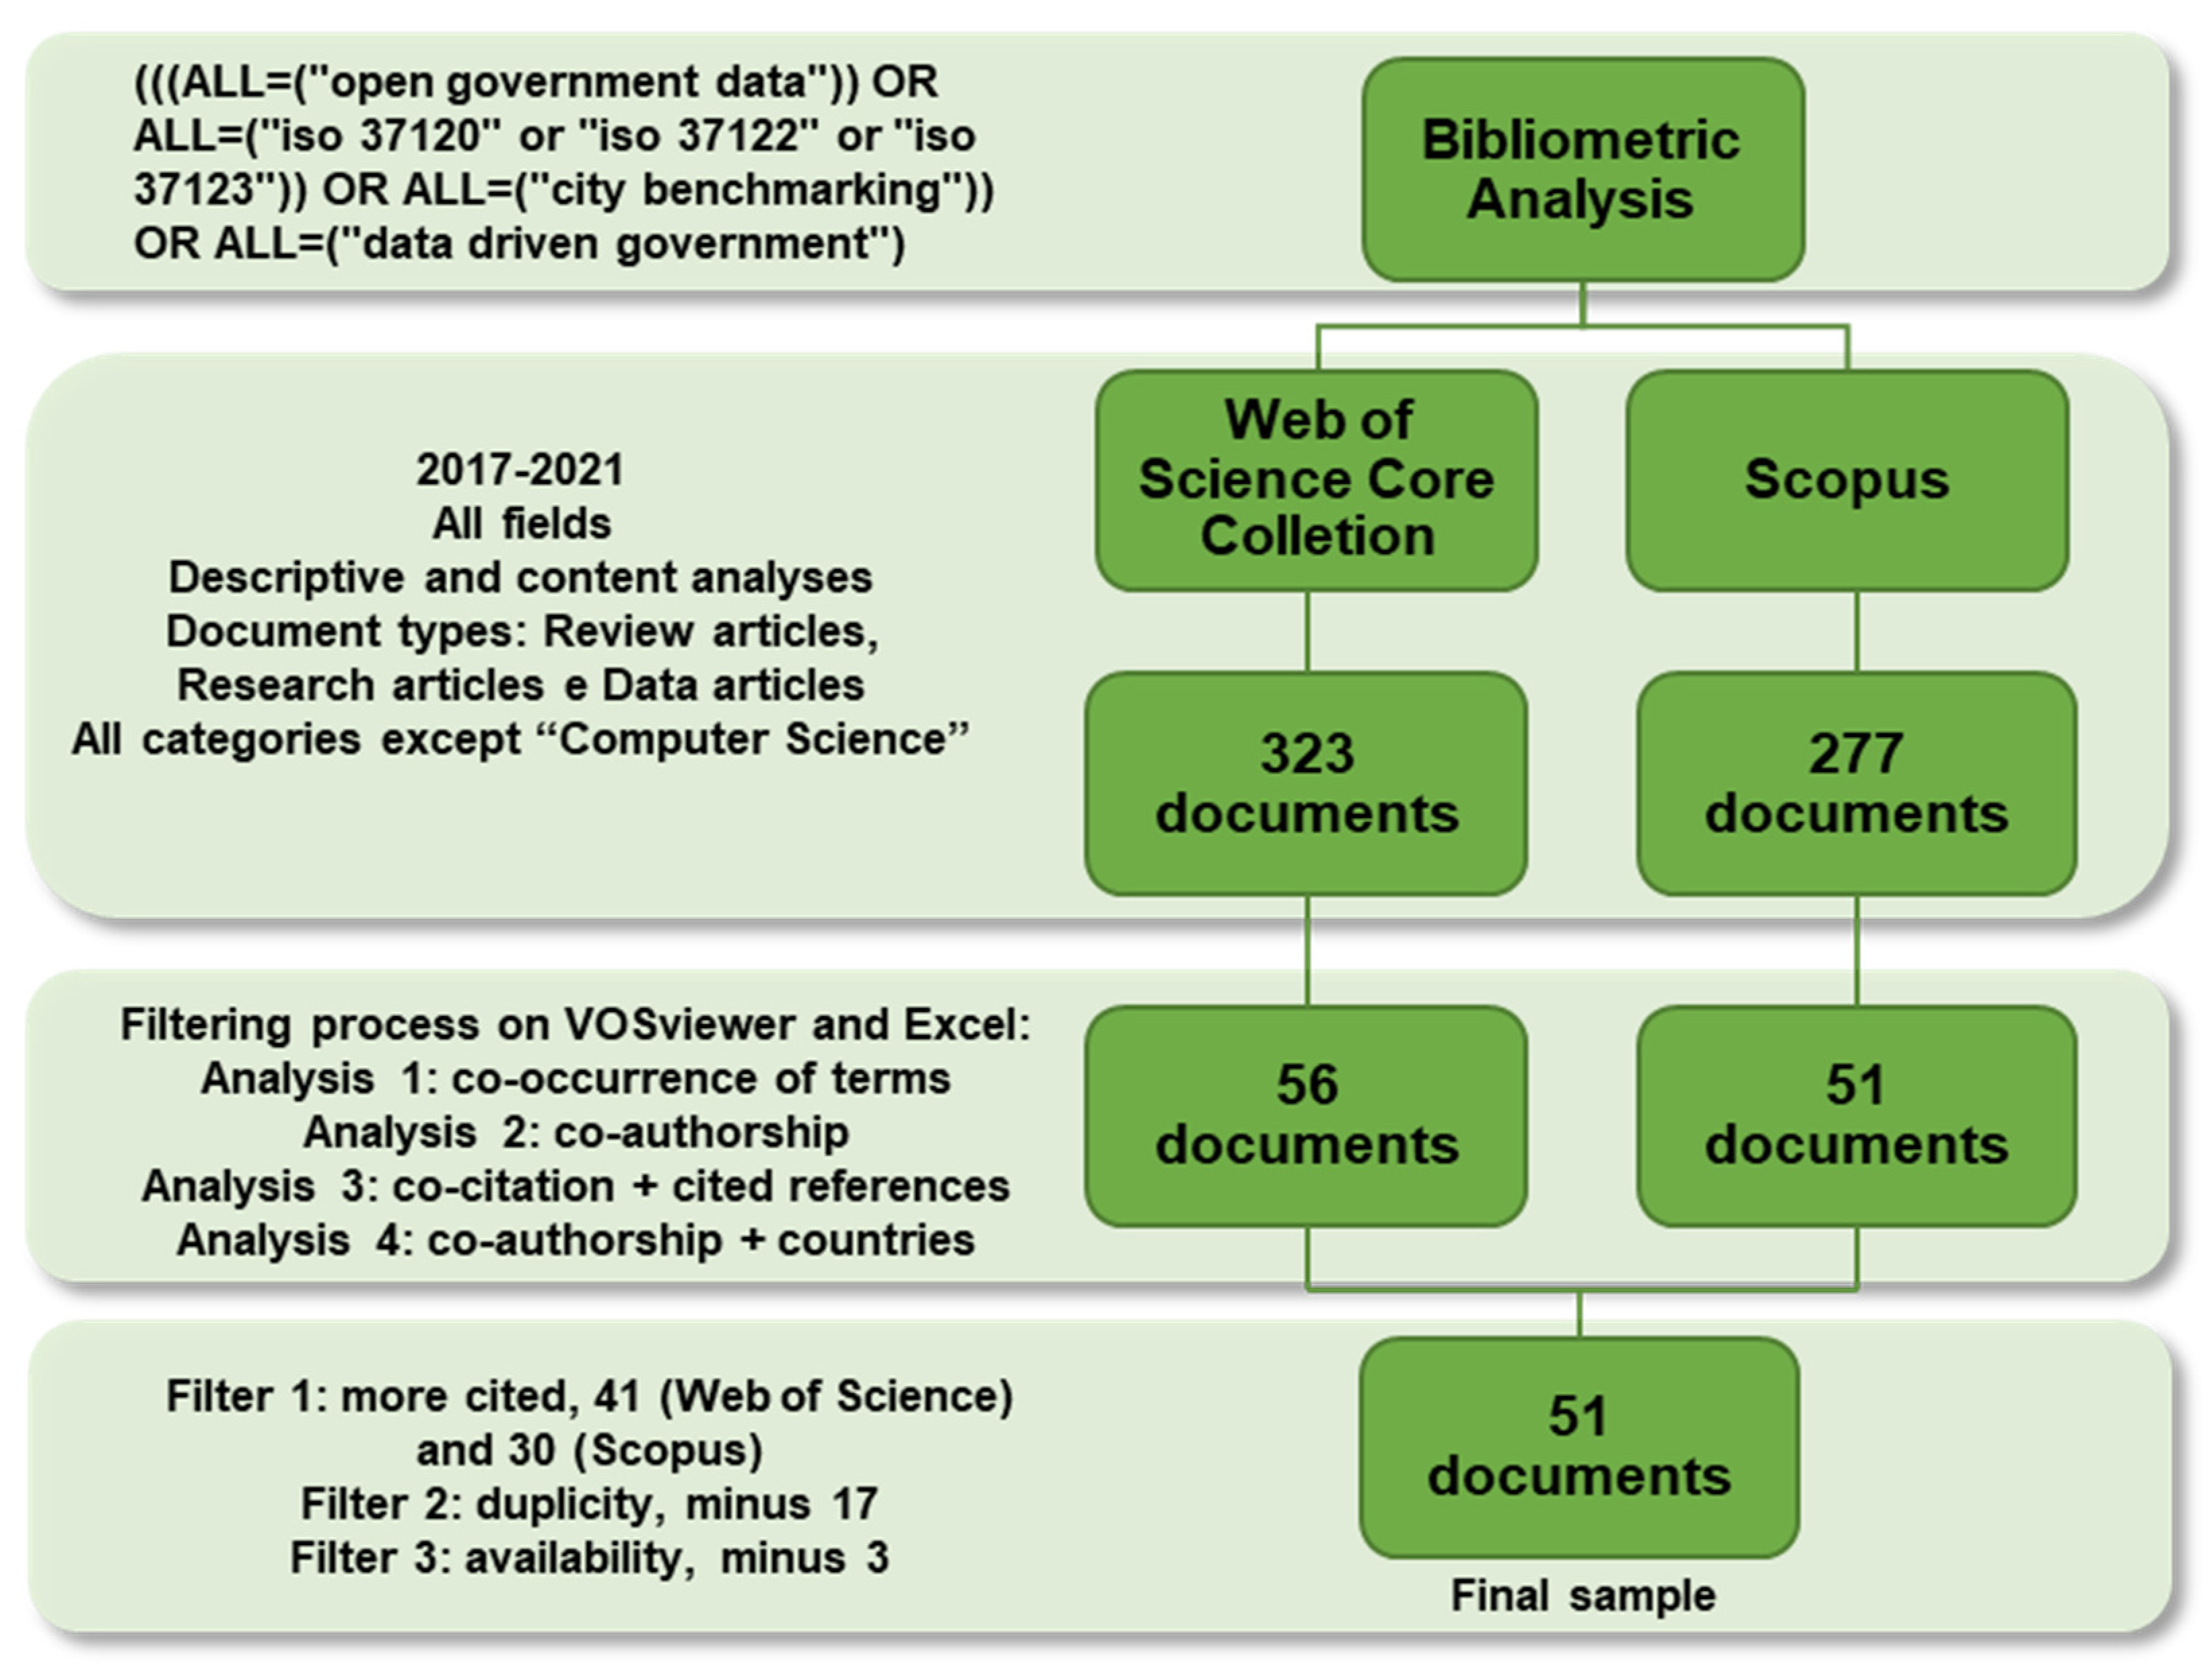
2.2.1. Bibliometric Analysis

The bibliometric analysis was performed to explore current research along two different but correlated research axes: “open government data” and “ISO urban indicators”. The literature review was supported by a bibliometric analysis to summarize existing research. Six-hundred papers were identified through keyword search, “open government data”, “ISO 37120”, “ISO 37122”, “ISO 37123”, “data driven government”, and “city benchmarking”, using Scopus and Web of Science. The VOSViewer® software was used to process the obtained searches and to make graphs. The final set contains 51 papers, as can be seen in the flowchart shown in Figure 3.

2.2.2. Comparative Analysis

Comparative studies have been used in several areas of science. The authors in [69,70] use a comparative analysis of urban indicators from five BRIC countries (Brazil, Russia, India, China, and South Africa), including indicators from the city of São Paulo.
In the present work, a comparative study between two sets of indicators was adopted. Set 1 consists of 276 indicators from the ISO 37120:2018, ISO 37122:2019, and ISO 37123:2019 standards, and set 2 is composed of 572 public indicators from ObservaSampa (October 2021 update). The calculation formula for each of the 276 indicators in the 19 ISO themes was compared with formulas and metadata from the 572 ObservaSampa indicators, to verify the correspondence among calculation formulas, adherence to indicator requirements, and data sources described in ISO standards (Table 1 and Table 2). Table 3 below exemplifies the comparative analysis conducted in this study.
We perform a comparison to evaluate the conformance of existing city indicators at ObservaSampa to the three ISO 3712x standards. In the process, we advance a scale of three ratings, “conforms”, “partially conforms,” and “fail to support”. “Conforms” is the top rating and means a city indicator reported in ObservaSampa Observatory is in full accordance with the standards. “Partially Conforms” means deficiencies in the city indicator calculation formula are noted, but these deficiencies can be addressed by mathematical correction in an acceptable manner, in accordance with the standards. “Fail To Support” means deficiencies are so significant that the indicator must be fully recalculated to be reported in accordance with the standards.
In the comparative analysis, several doubts regarding data collection and calculation of the ObservaSampa Observatory indicators were resolved and clarified in seven online technical meetings held with specialists, the ObservaSampa Coordination Office, and the Brazilian mirror committee ABNT/CEE-268 Coordination Office. The meetings took place between 30 September 2021 and 31 March 2022.

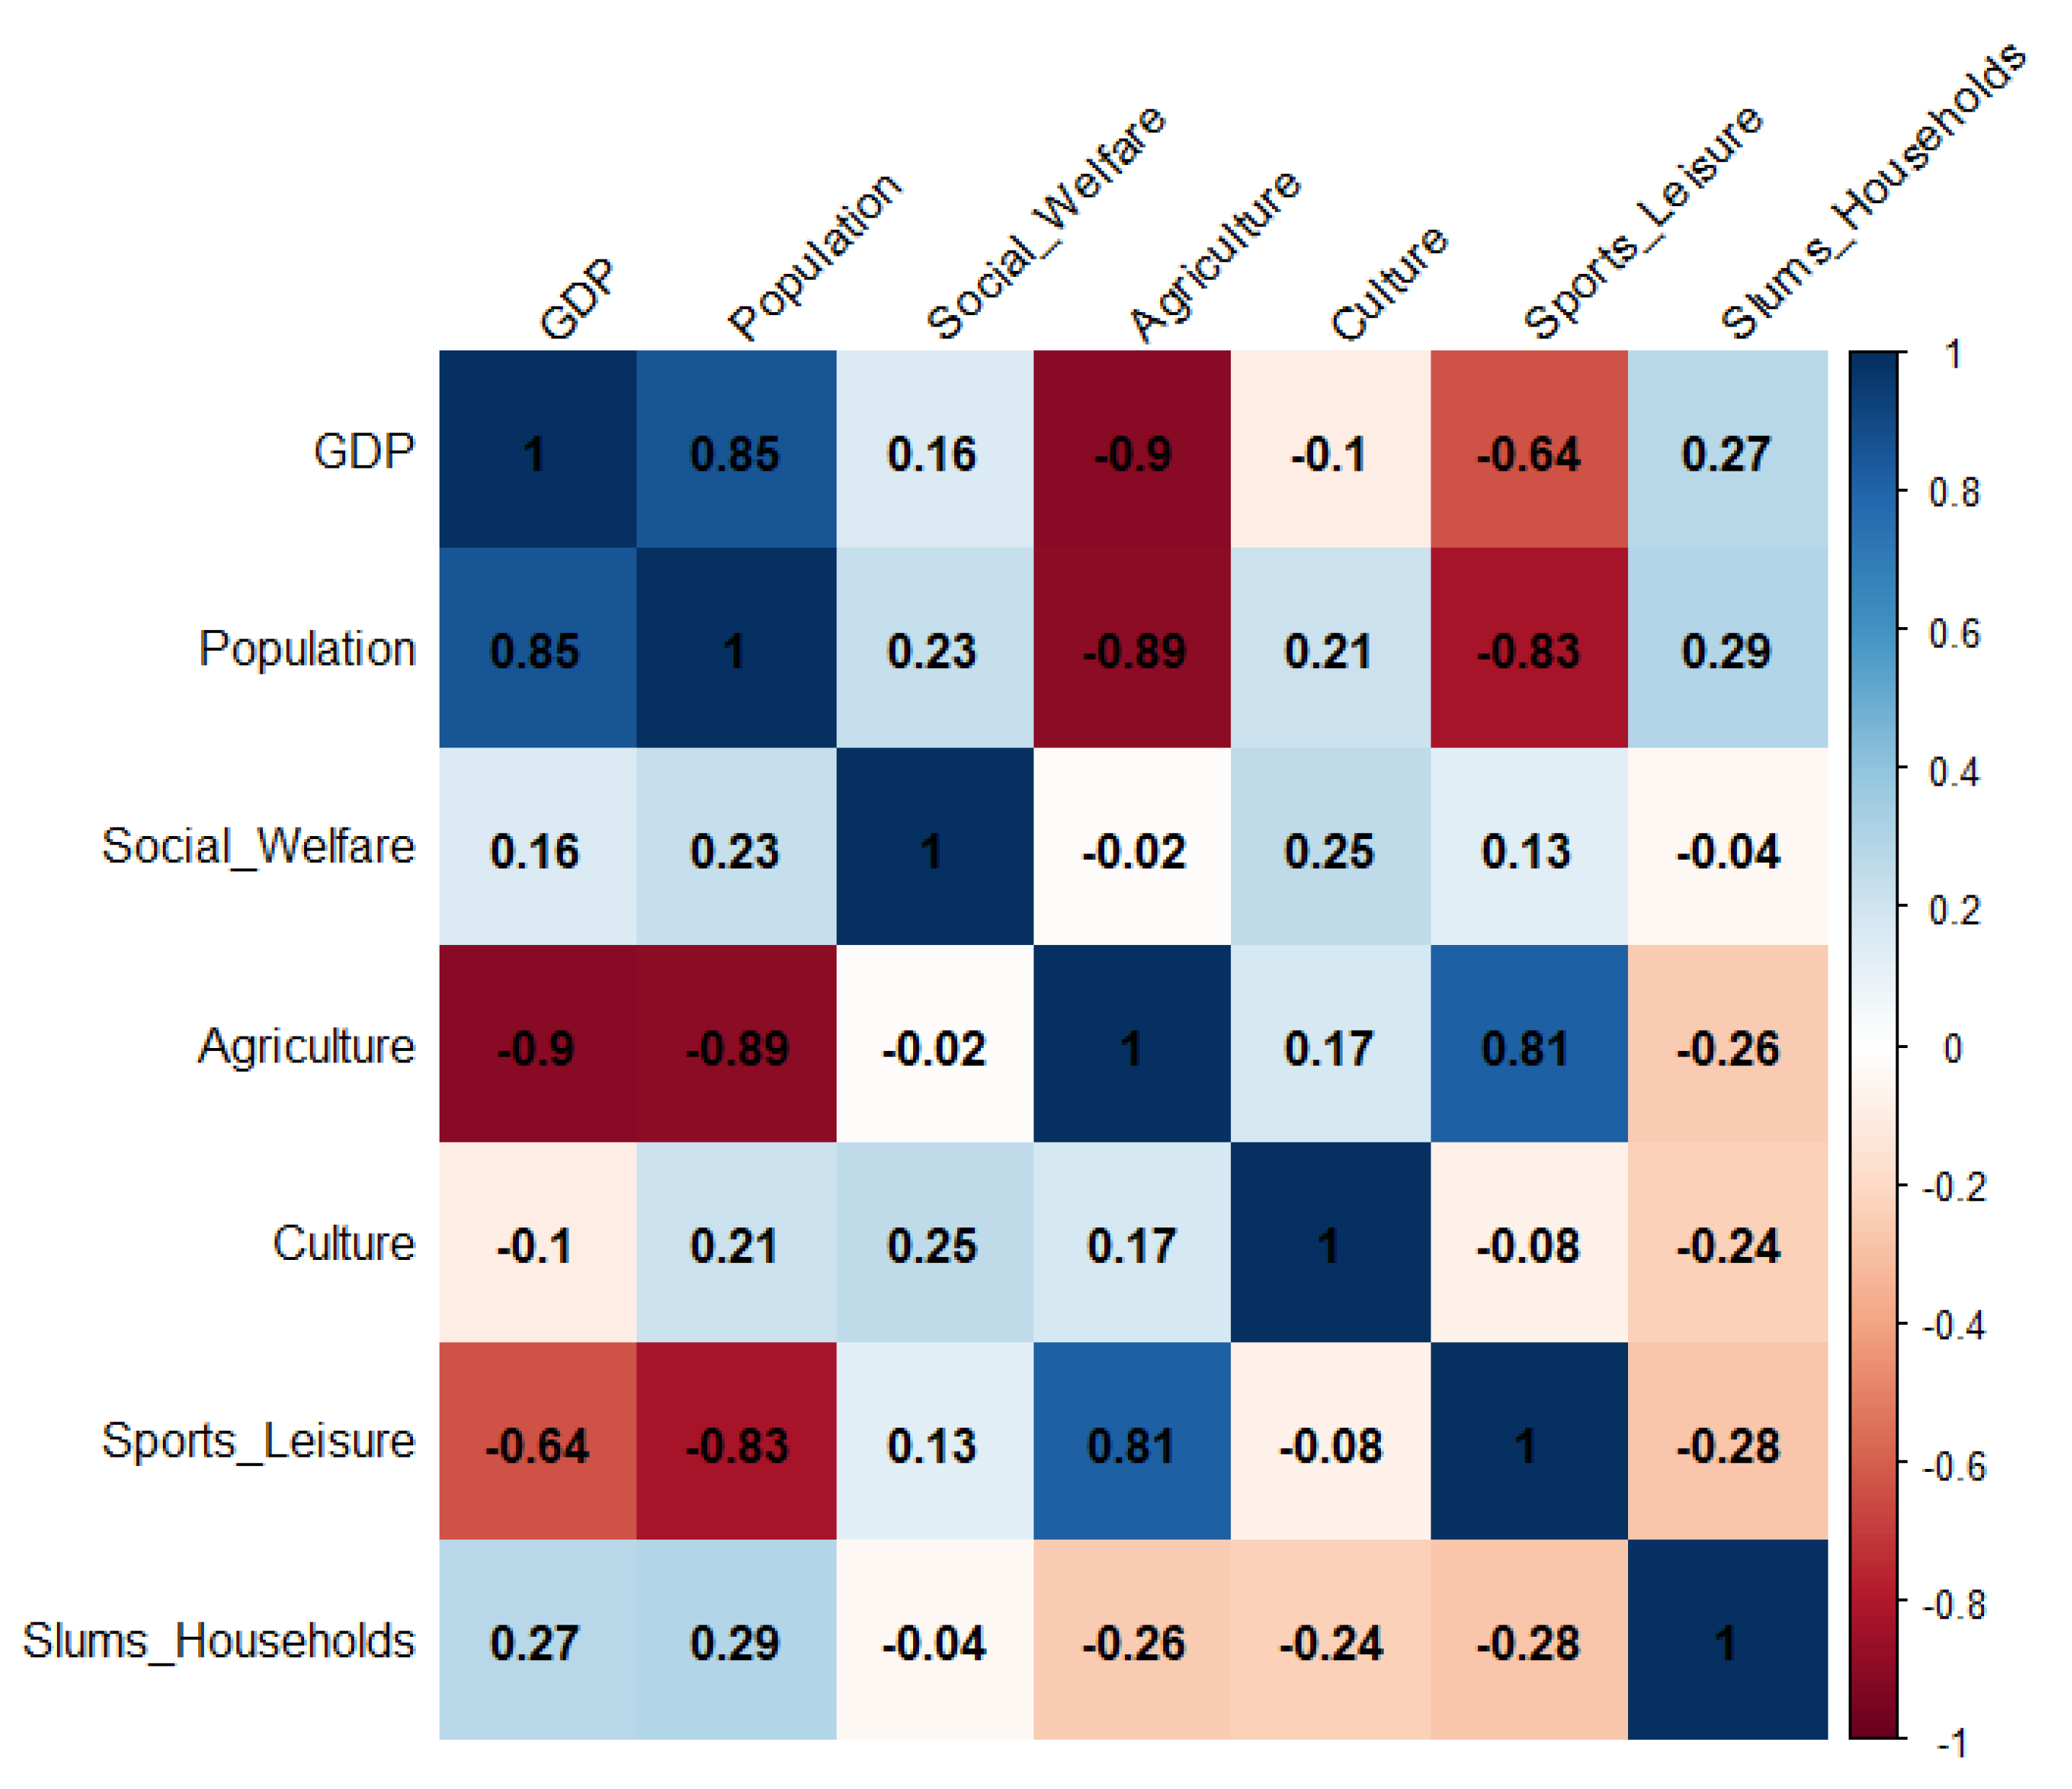
2.2.3. Multivariate Analysis

In this study, we used two methods of multivariate analysis, cluster analysis and principal component analysis, as presented below.
The period of analysis and indicators were selected according to data availability. For the PCA study, data from 2009 to 2020 on population demographics (population); city gross domestic product (GDP); population living in inadequate housing (slum_households); percentage of municipal budget allocated to cultural and sporting facilities (sports and leisure); annual percentage of municipal budget spent on urban agriculture initiatives (agriculture); and annual expenditure on social and community services as a percentage of total city budget (social_welfare) were considered as input variables.
The dataset used in both cluster analysis and principal component analysis (PCA) was processed in the following steps:
  • Variable normalization as the original data were presented in different scales.
  • Pearson’s correlation analysis, with the goal of eliminating variables with high coefficients of correlation. The variable “recycled waste collection” was eliminated because it had a high correlation with “population”. The latter was chosen due to its key relevance in the study.
  • A p-value was used to evaluate whether a correlation coefficient was significantly different from zero.
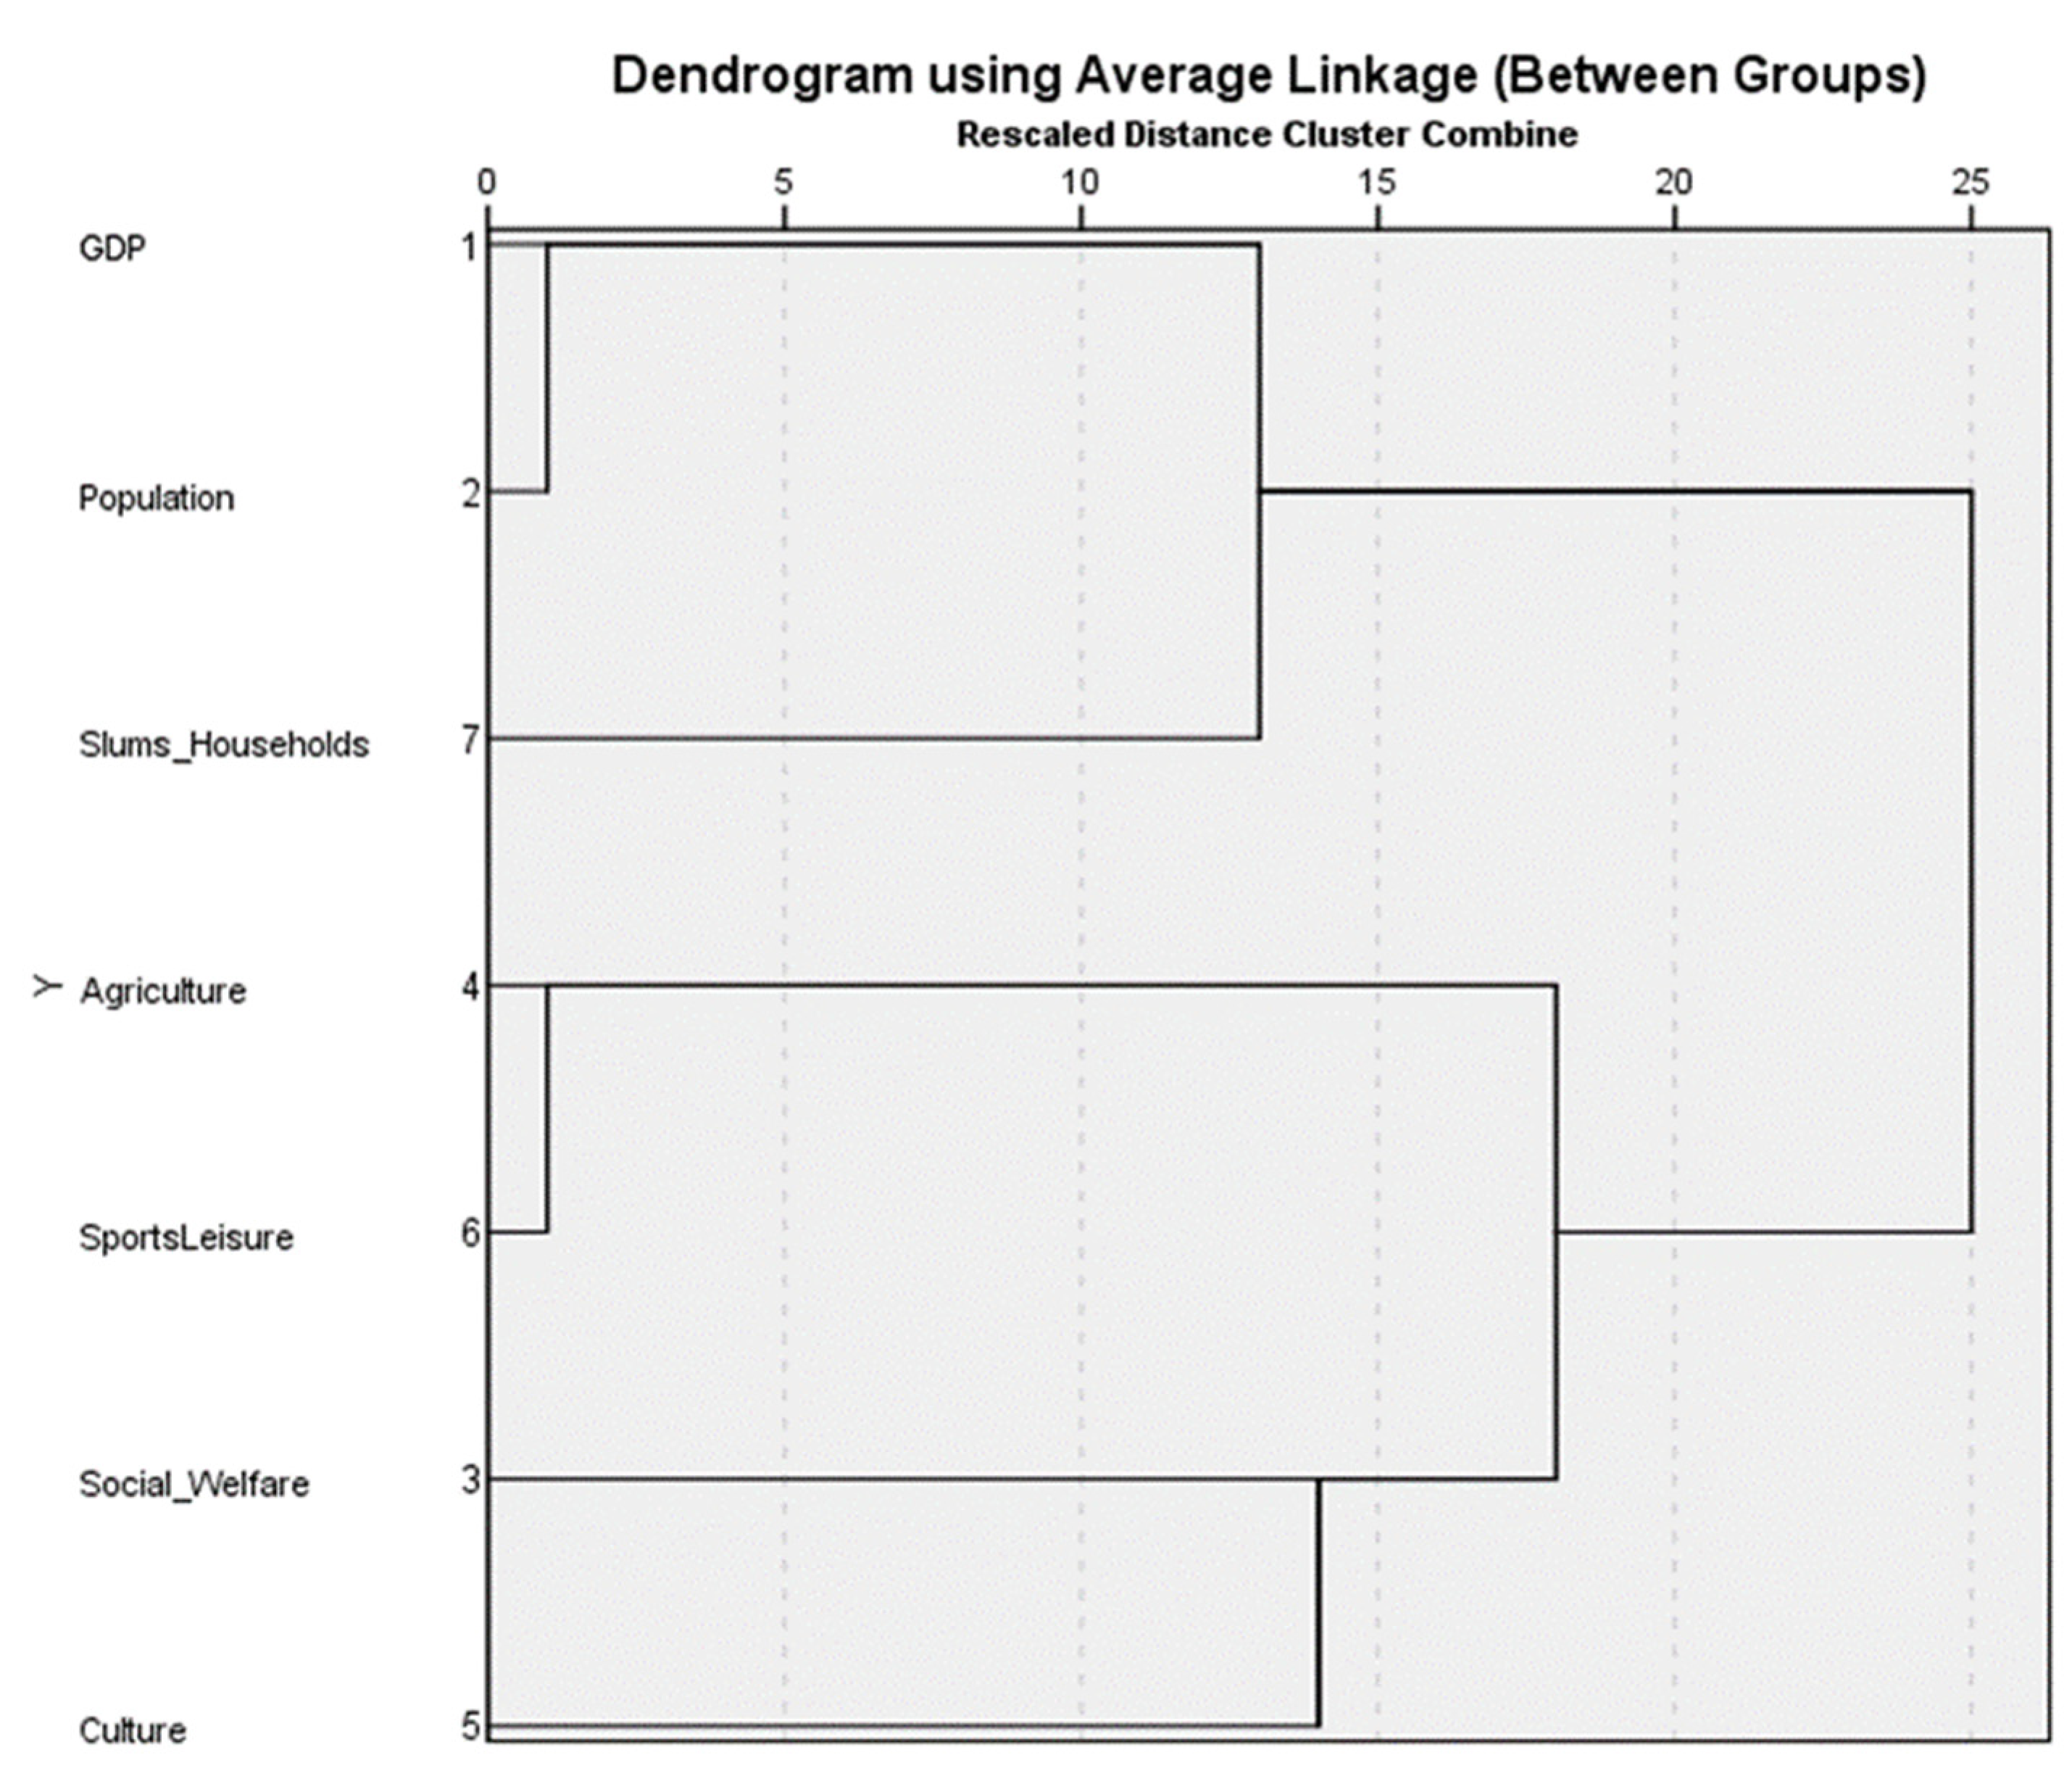
Cluster Analysis

Cluster analysis is a multivariate analysis method that compares different objects, grouping them into similarity classes or clusters. Cluster analysis has application in various fields of knowledge, such as data analysis, image processing, and market research [71]. We adopt hierarchical clustering in this study, as described by [71], who present a short but consistent literature review on the topic. Calculations, matrices design, and graphics drawing referring to the cluster analysis were executed using the IBM SPSS Statistics 25 software (Armonk, NY, USA).

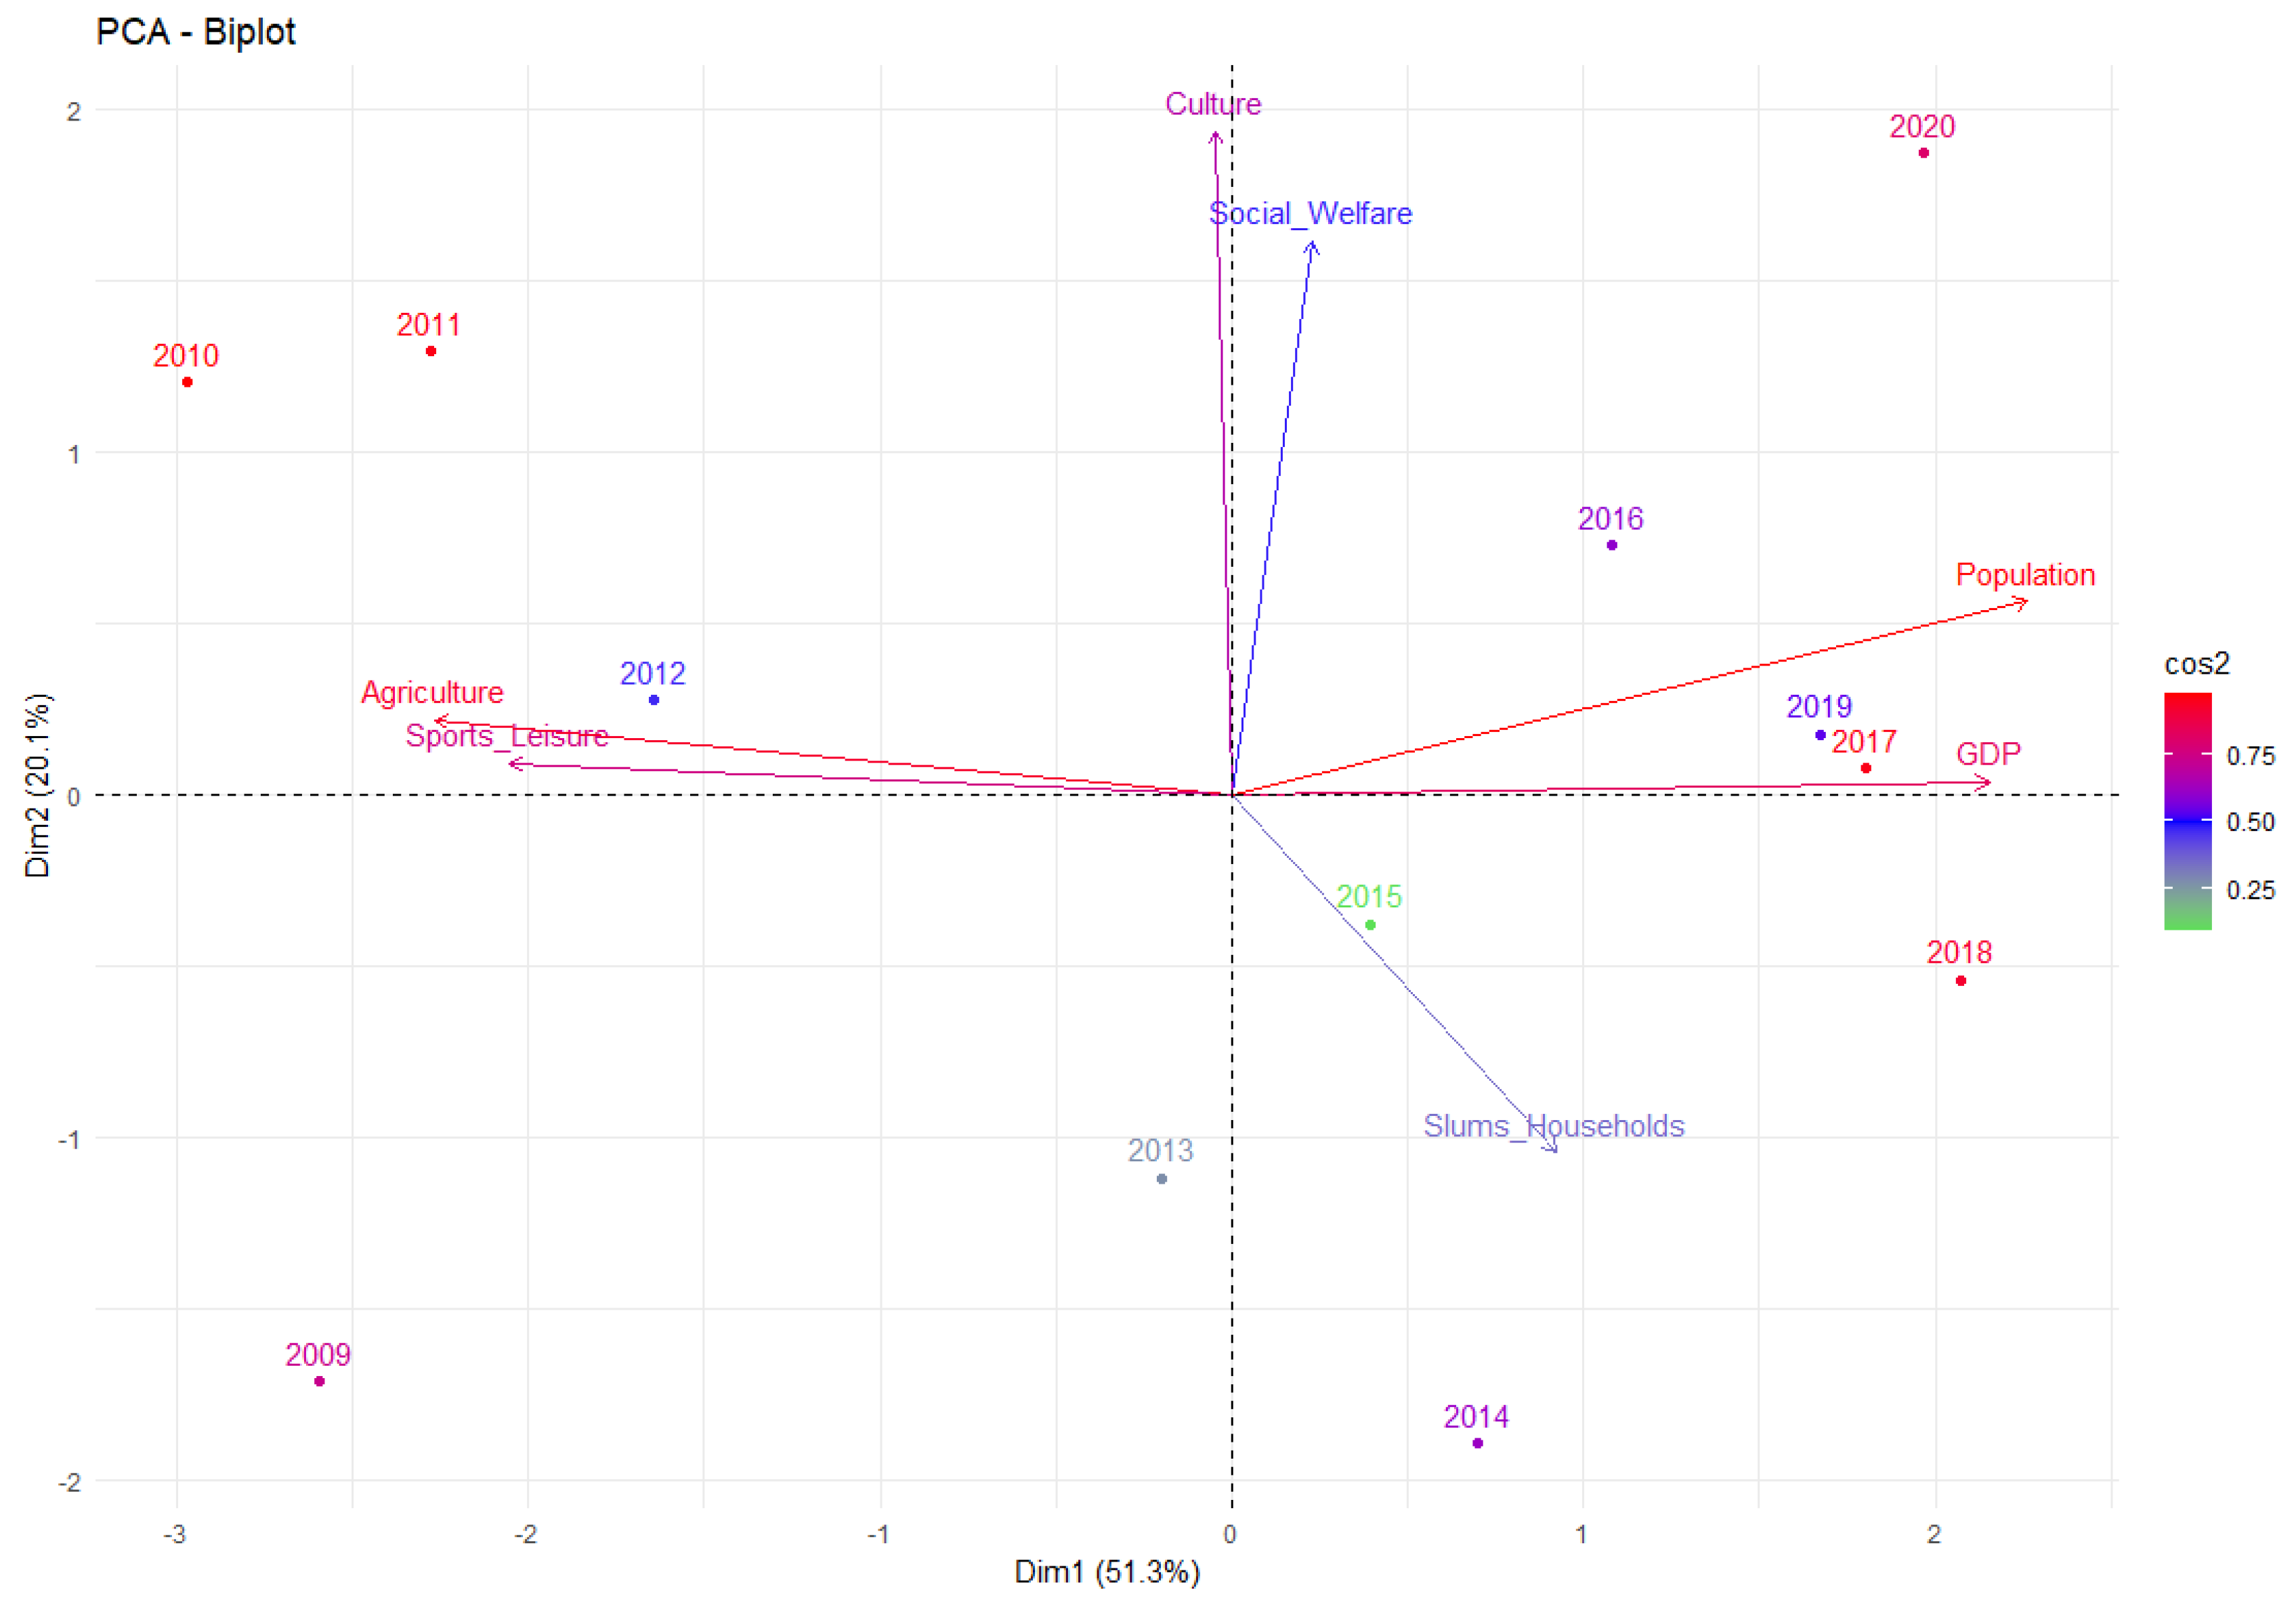
Principal Component Analysis (PCA)

The principal component analysis (PCA) statistical technique of multivariate analysis [72,73,74] was applied to analyze variable interrelationship, generate interpretability, and understand data structure, verifying linear independence among variables.
Similar to study [52], in which PCA was performed on ISO 37120:2014 in relation to data on essential transportation indicators of cities in Europe (available in open data platform), PCA was used on ObservaSampa indicators, conforming to ISO 3712x indicators. The free software RStudio 4.2.0 version was used to perform calculations and prepare the matrices, tables, and graphics referring to the principal component analysis.

2.2.4. Compliance with Open Government Data Principles

The compliance of ObservaSampa data to open data principles defined by the Open Knowledge Foundation [59] and by the Brazilian legislation [60] was analyzed, as in Table 4.

3. Results

The results obtained are presented below.

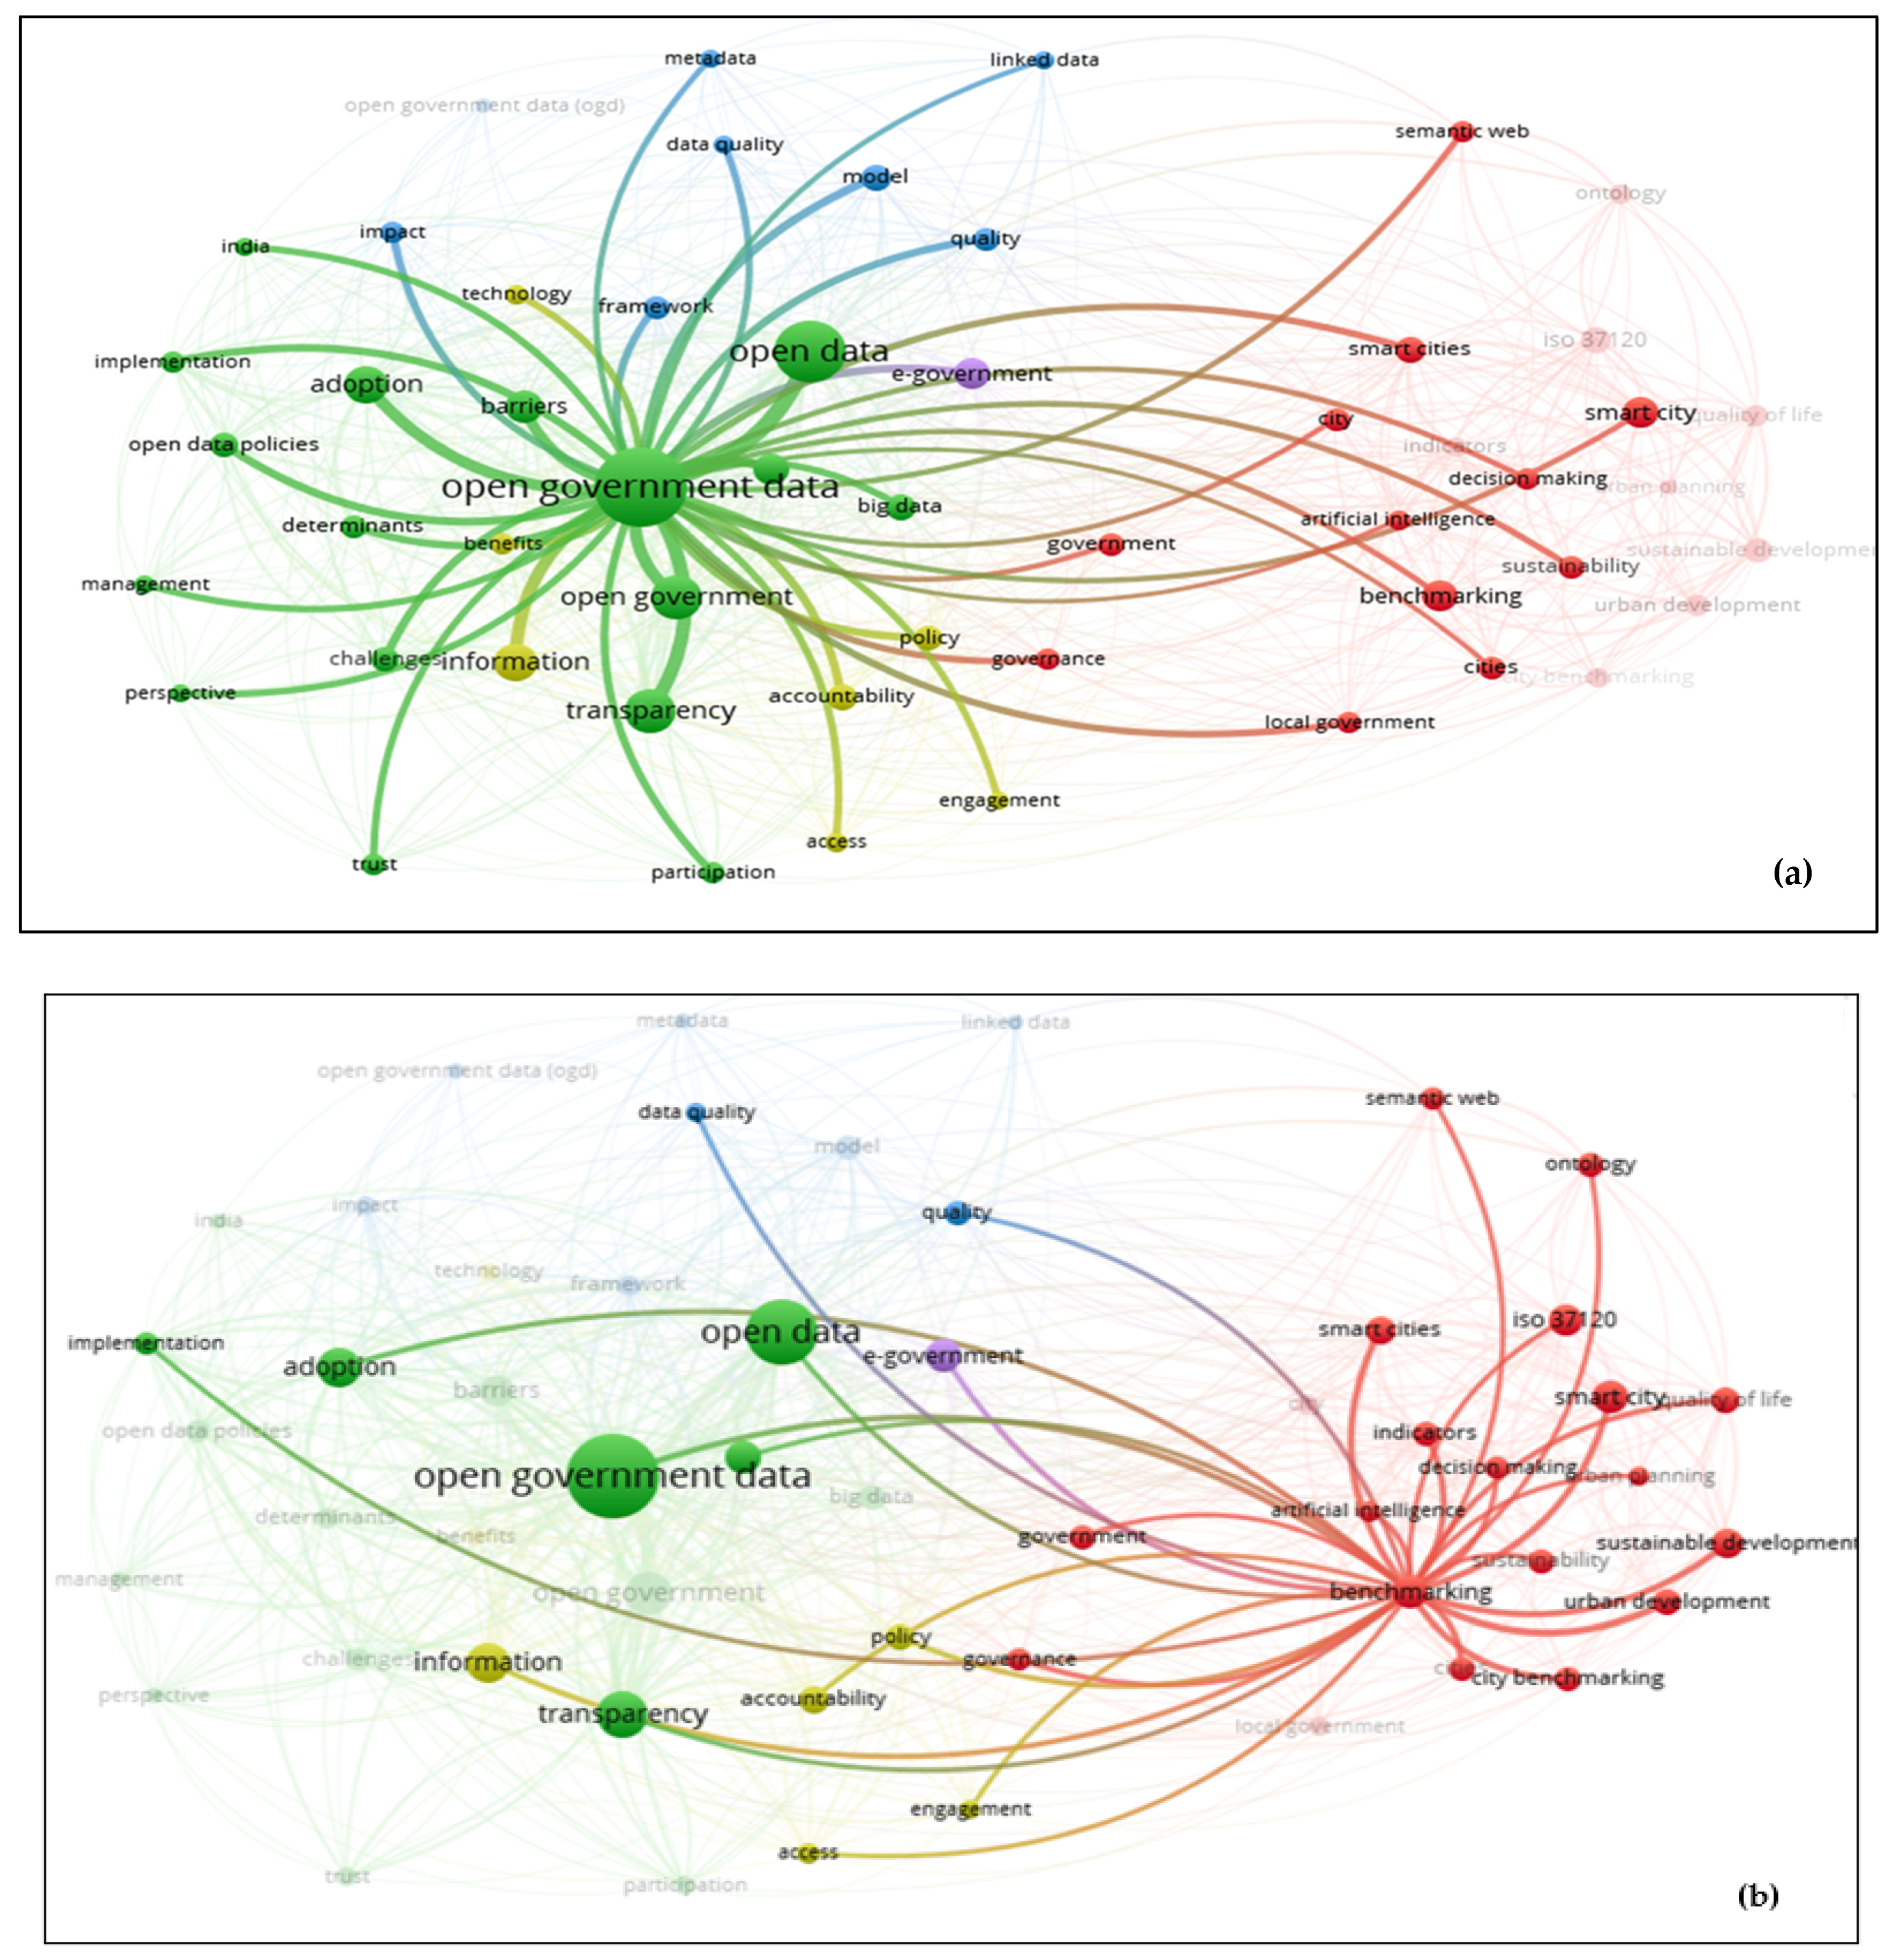
3.1. Bibliometric Analysis

This subsection presents a review of the related research based on the bibliometric analysis of publications in the Web of Science Core Collection and Scopus databases, mapping scientific research on the following topics:
  • “Open Government Data”.
  • “ISO 37120” or “ISO 37122” or “ISO 37123”.
  • “City benchmarking”.
  • “Data driven government”.
Review articles, research articles, conference papers, and data articles were selected as the main data sources. The search was carried out in “all fields”, with no limitations. The time spanned from 2017 to the end of 2021. The reasoning for choosing the period from 2017 to 2021 is two-fold: selecting the most updated and consolidated publications on the subject (last five years) and a surge in publications from 2017 [9]. The search produced 323 documents from the Web of Science database and 277 results in Scopus, 600 documents in total. Next, a new selection was performed considering an analysis by co-occurrence of terms, co-authorship, co-citation, and countries, resulting in 107 documents: 56 in Web of Science and 51 in Scopus. At last, the prioritization of the most cited documents, eliminating duplicates and unavailable documents, resulted in a final sample of 51 documents (Figure 3 and Appendix A).
The final sample of 51 documents comprises 10 documents related to the topic of standards (“ISO 37120” or “ISO 37122” or “ISO 37123”), 34 related to “open government data”, 1 related to “city benchmarking”, and 6 related to “data driven government”. All the documents found in this search were related to only one of four topics, except four papers, which were related to both “open government data” and “data driven government” [75,76,77,78]. Most papers (34 documents, 67%) were related to “open government data”, which can be explained by the fact that the other three topics are very recent in the selected period (2017–2021), in comparison to that topic.
To perform a quantified visualization of the bibliometric analysis, VOSViewer® was used to provide a comprehensive set of occurrences of terms, allowing the analysis of the most frequent terms contained in the 600 documents. Two clusters were identified:
  • Green: related to OGD—open government data.
  • Red: related to “benchmarking”, “indicator”, and standardization issues.
Figure 4a,b illustrate the graphs performed by the VOSViewer® software. Bigger network nodes mean more cited terms, and different colors represent different clusters generated automatically by VOSViewer®.
As expected, the papers focus on the two axes studied separately. However, the graph of the co-occurrence of terms indicates the purple cluster, related to the term “e-government”, makes a connection between the “OGD” and “indicator” axes. Similarly, “smart cities”, which is part of the red cluster, also indicates a connection to OGD. Agreeing with [26], the smarter a city becomes, the more data it collects on the quality of life.
VOSViewer® also provided a comprehensive net of co-authorship. The co-citation and cited references were analyzed through the VOSViewer® graph, and an Excel sheet was helpful to select the most cited authors and papers.
Related to the “ISO 37120” or “ISO 37122” or “ISO 37123” topics, the most cited paper in both databases had only 15 citations in the Web of Science and 19 in Scopus [25]. Both figures are much lower than in the most-cited papers for “open government data”: [79] 48 citations in the Web of Science and [80] 110 in Scopus. Some of the most-cited documents are also the oldest ones (2017 and 2018), and they are predominantly related to “open government data”.
The Excel sheet was helpful to eliminate duplicates. The titles and abstracts were read, eliminating those not aligned with the research topics. After reading the abstracts and fully analyzing the texts, 51 papers remained. The co-citation and cited references analysis were also important to prioritize and select new papers for future research, even those prior to the selected period (2017–2021), due to their historical importance, and citation from several other documents. However, the publications and authors with a higher number of citations and deemed important, such as [6,11,48,63,64,65], were included even if outside the mentioned period.
Several papers analyzed open data portals, focusing on user engagement. For example, Europe [81], United States [79], Health Data New York Portal [82], Bangladesh [83], Kazakhstan [84], Korea [85], Estonia [86], China [87], etc.
In [29], ISO 37120 was discussed on how urban benchmarks have specific and structural limitations, while [2] reviewed 66 research studies, some including ISO 37120, on the relevance of the impact assessment of open data initiatives in smart cities. In Brazil, there are some quantitative surveys of the ISO 37120 [54,55], ISO 37122 [56,57], and ISO 37123 [58] indicators. But, as shown in Appendix A, there are just four texts from Brazilian authors in the final sample (51 papers) [22,53,88,89].
Despite its importance, research about the impact of open government data on the quality-of-life improvement policy and decision making, in accordance with international measurement and benchmarking standards, is scarce.

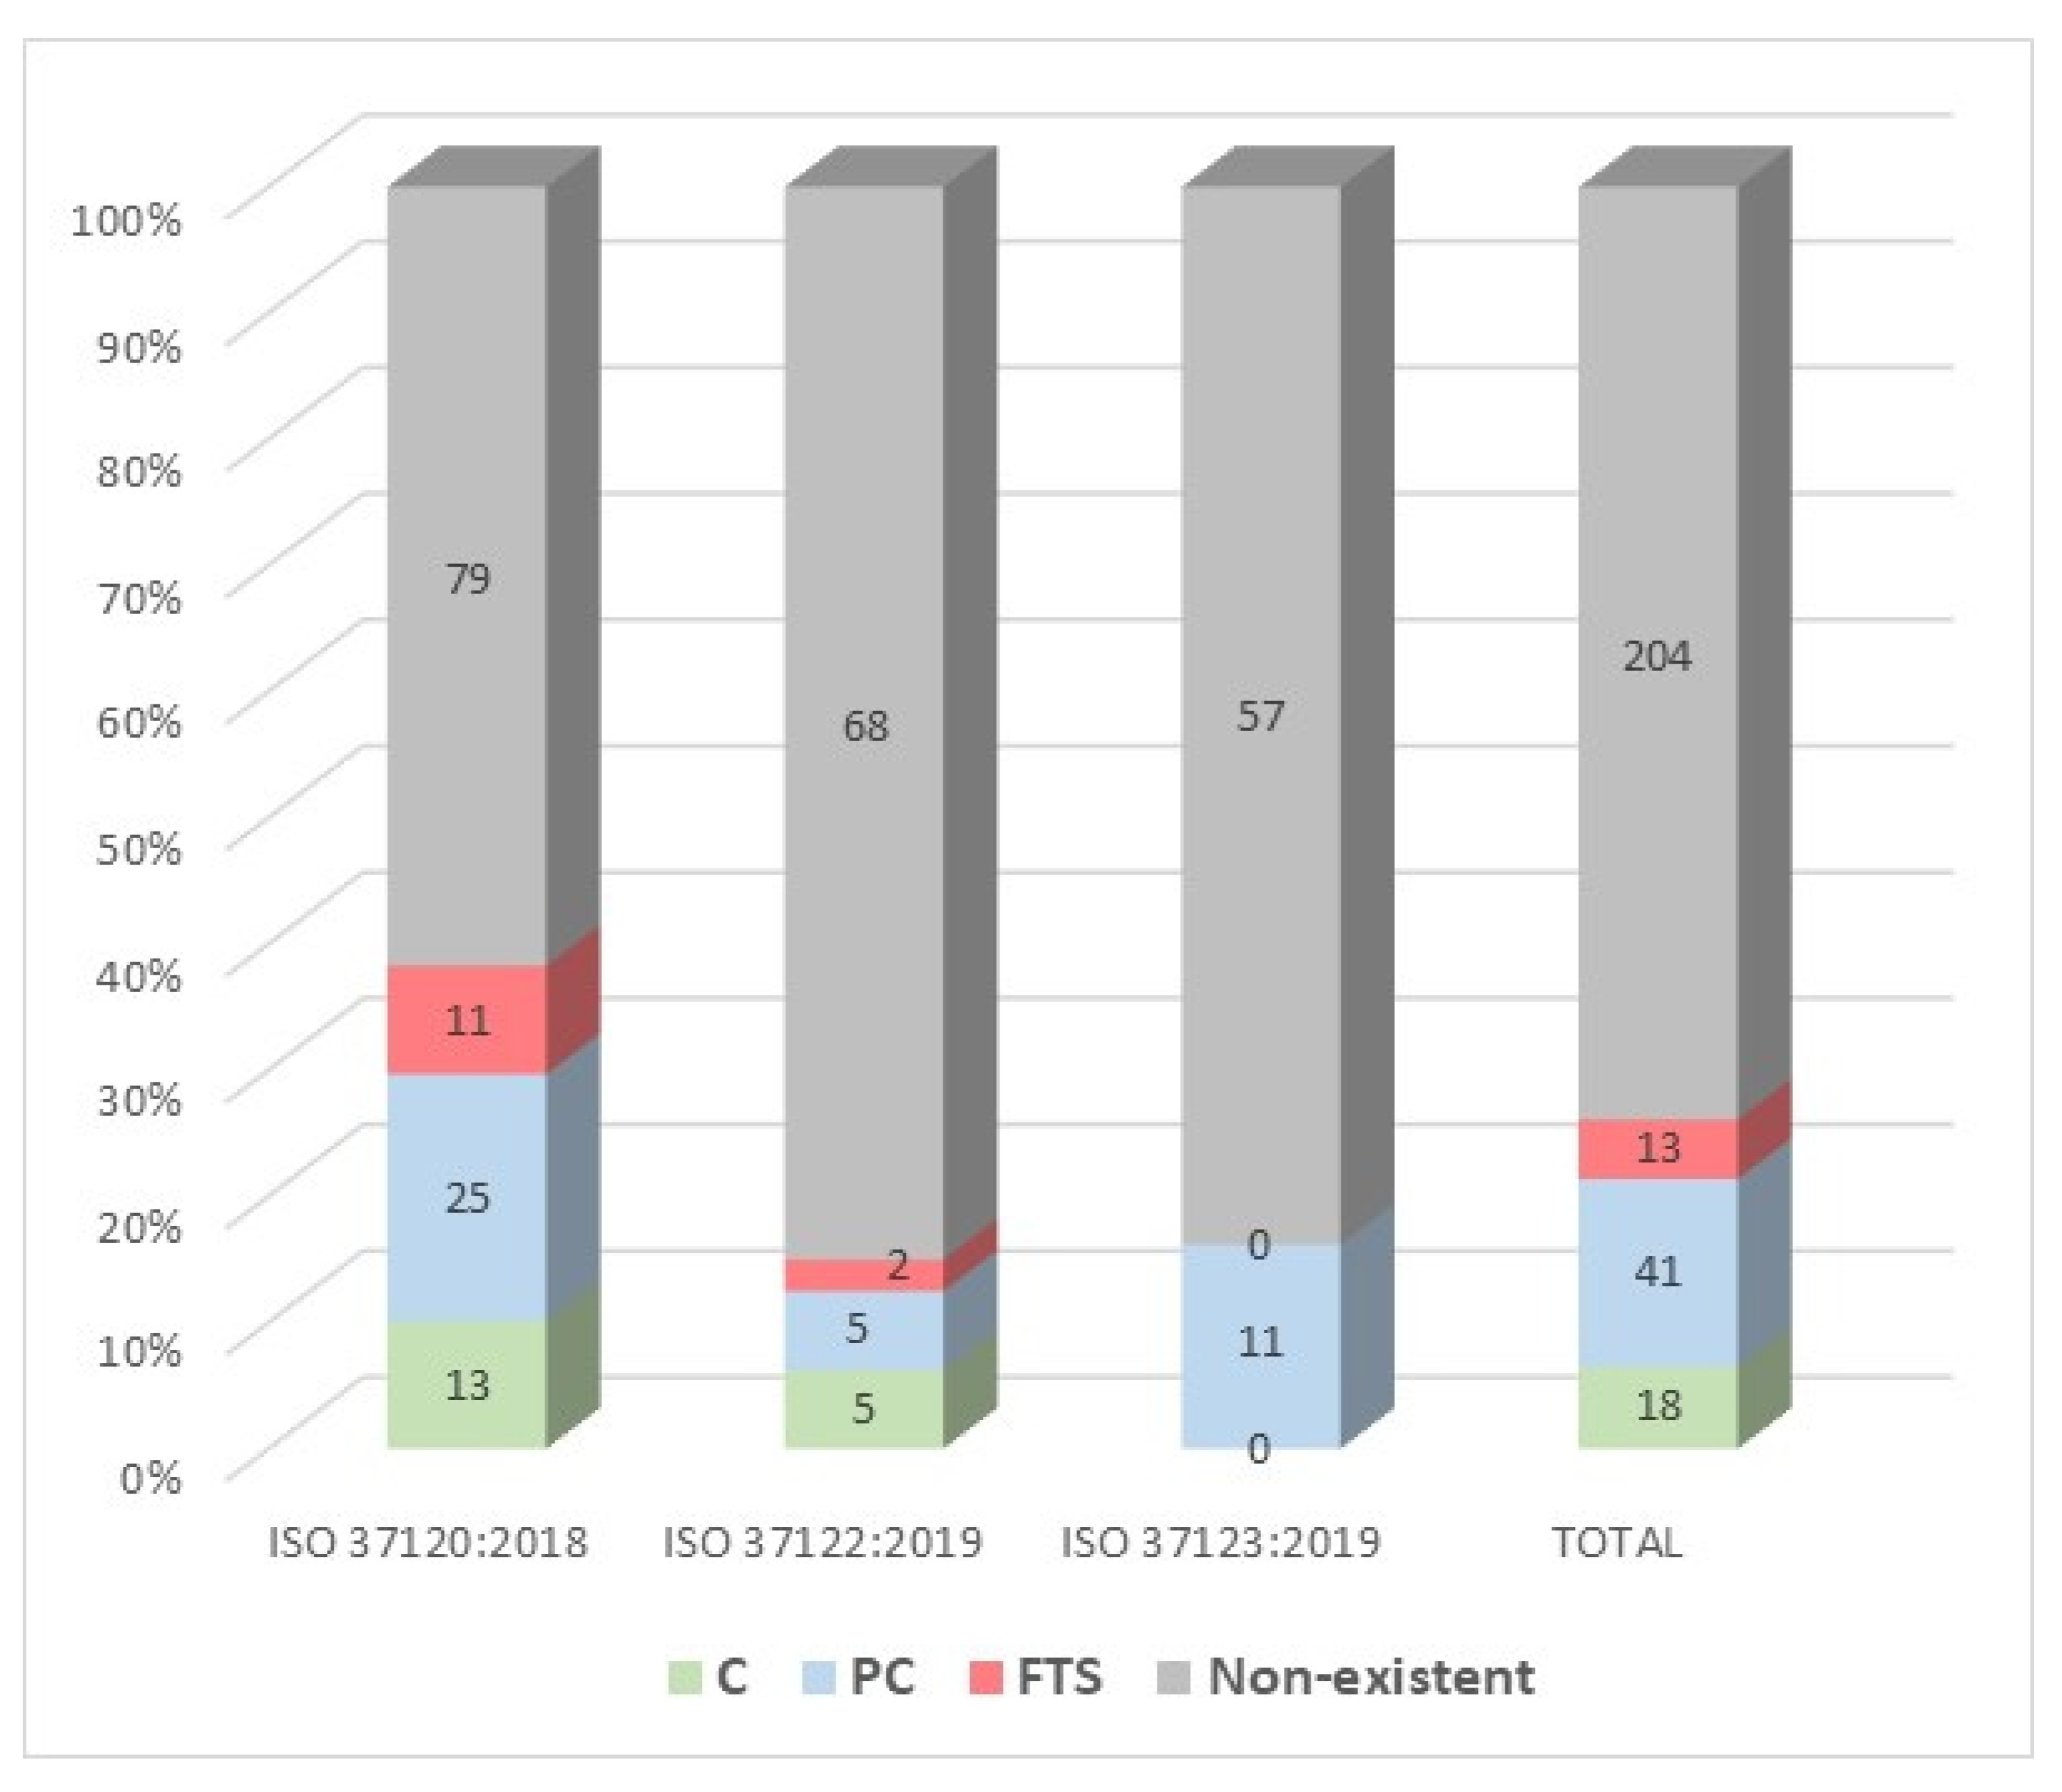
3.2. Comparative Analysis

From the comparative analysis, the conformance of the individual city indicators to the standards is illustrated by both Table 5 and Figure 5:
  • C: “Conforms” (green) means that a city indicator reported in the ObservaSampa is in full conformity with the standards. The calculation formula of the city indicator reported in the ObservaSampa also fully matches the standard requirements.
  • PC: “Partially Conforms” (blue) means deficiencies in the city indicator calculation formula are identified, but these deficiencies can be addressed by mathematical correction in an acceptable manner to be in conformity with the standards. Similarly, “Partially Conforms” means the numerator of the calculation formula is not fully matching, but the denominator is, or vice versa. These will usually represent significant opportunities for improvement in the application of the standards.
  • FTS: “Fail to Support” (red) means deficiencies in practice are judged to be so significant that the city indicator must be fully recalculated to be reported in conformity with the standards. On the other hand, the ObservaSampa reports the city indicator and monitors its performance on a topic related to an ISO theme, even though it does not follow its requirements and calculation formula.
In a complementary way, “non-existent” means that the ObservaSampa does not report a city indicator related to indicators in the ISO standards. Table 5 shows the ObservaSampa indicators, split into 18 themes, partially corresponding to the 19 themes in the standards.
Table 5. Results of the comparative analysis between city indicators reported in ObservaSampa and standards (ISO 37120, ISO 37122, and ISO 37123), with the number of city indicators at each rating and standard theme. Legend: C—“Conforms”, PC—“Partially Conforms”, FTS—“Fail to Support”. Source: the authors.
SectionThemeISO 37120: 2018ISO 37122: 2019ISO 37123: 2019TOTALObservaSampa Observatory
CPCFTSNon-ExistentThemeIndicators
5Economy11472246012Economy, Employment and Income
Tourism
71
6Education634130427Education42
7Energy91032212118Maintenance13
8Environment and climate change9392101020Environment33
9Finance6271502211Public Finances59
10Governance4461400113Public Management71
11Health6341302110Health89
12Housing10261814013Housing and Basic Sanitation17
13Population and social conditions945185427Population
Accessibility and people with disabilities
Social Welfare
Human Rights and Citizenship
82
14Recreation21030201--
15Safety10141504011Safety and Violence17
16Solid waste10611723012Housing and Basic Sanitation(above)
17Sport and culture34072212Sport and Leisure
Culture
17
18Telecommunication23160105Human Rights and Citizenship(above)
19Transportation91412411121Mobility and Traffic Safety55
20Urban/local agriculture and food security43292007Public Finances(above)
21Urban planning7461703014Urban Development6
22Wastewater45 90018Housing and Basic Sanitation(above)
23Water7421300112Housing and Basic Sanitation(above)
TOTAL19 Themes128806827618411320418 Themes572
100%6.5%14.9%4.7%73.9%
276
Figure 5. Results of the comparative analysis between city indicators reported in ObservaSampa and standards (ISO 37120, ISO 37122, and ISO 37123), with percentages of each rating and standard theme. C—“Conforms”, PC—“Partially Conforms”, FTS—“Fail to Support”. Source: the authors.
Sustainability 14 08802 g005
Table 6 and the corresponding graph in Figure 6 show the number and relative percentage of the conformance of the ObservaSampa indicators to the 3712x series standards.

3.3. Multivariate Analysis

The results of the cluster analysis and principal component analysis, on the conformed indicators, are shown in Figure 7, Figure 8, Figure 9, Figure 10 and Figure 11.
The graphic in Figure 7 shows the indicators with the highest correlation values are population and GDP, agriculture and GDP, agriculture and population, and population and sport and leisure, the last three sets with negative correlation. The p-value is a significance test that indicates whether a correlation coefficient is significantly different from zero. The most significant p-values (clearer in the graphic in Figure 8) are those that showed the lowest correlation: agriculture and social welfare and slums_households and social welfare.
Figure 7. Correlogram—heat map (correlation coefficients).
Sustainability 14 08802 g007
Figure 8 presents a dendrogram, resulting from the cluster analysis, showing two main clusters formed by the GDP (Gross Domestic Product) and population indicators, and agriculture and sport_leisure (the municipal resources destined to agriculture and resources destined to sport and leisure). Figure 9 shows clusters from the timeframe (2009 to 2020) analysis, which highlights 2017 and 2018, grouped with 2019, and 2015–2016 clustering with 2019, as the main clusters. Another significant cluster was composed by the years 2010 and 2011 (Figure 9).
Figure 8. Dendrogram Cluster Analysis—Variables.
Sustainability 14 08802 g008
Figure 9. Dendrogram Cluster Analysis—Years.
Sustainability 14 08802 g009
The principal component analysis showed the most important variables are population and GDP, which have the opposite behavior in relation to sport/leisure and agriculture. Spending on agriculture and sport/leisure may have not followed the population growth from 2009 to 2020.
The variable slums/households (households in slums) behave differently from the other variables in the principal components 1 and 2 (Figure 11). From the components matrix (Figure 10), an opposite behavior of the slums/households variable in relation to social assistance (the municipal resources destined to the social assistance function) can be observed in component 2. Culture and social welfare exhibit analogous behaviors (Figure 10 and Figure 11).
Figure 10. Principal Component Matrix.
Sustainability 14 08802 g010
Figure 11. Graphic representing the behavior of variables (indicators and years) according to principal component 1 (abscissa axis) and principal component 2 (ordinate axis).
Sustainability 14 08802 g011
In Figure 11, Cos2 indicates the contribution of a component to the square of the distance of an observation to the origin. The higher the value of Cos2 (red color intensity on the graph scale), the more important the variable.
Regarding the timeframe analysis, 2020 was the most expressive year in the analyzed period, as it was atypical due to the COVID-19 pandemic. Its impact on public spending should be considered (Figure 11).
A cluster of years, 2017–2019, was identified, referring to the same administrative management, possibly indicating a homogeneity in social policies and public spending. Along the same line of reasoning, one could mention clusters 2013–2015 and 2010–2012 (Figure 11), although they are more scattered.

4. Discussion

Regarding the “ISO 37120”, “ISO 37122”, or “ISO 37123” indicators, the bibliometric study shows some papers analyze the numerical data available in the open platform [23,52], while others evaluate the historical values of standardized indicators to assess a city’s performance and quality of life [24,26,27]. However, those studies do not check the adherence of indicator-calculating formulas to the ISO standards.
On the other hand, as discussed in Section 2.1.2, some authors present studies from quantitative indicator surveys, not necessarily of the entire ISO 3712x series, of Polish [26], Italian [27], European [50], and Artic [24] cities. Those authors elaborated on important critical analyses, such as in [23], on the insufficiency of data to cover the full range of activities in most cities. Another point raised by [23] is that the open data platforms in most cities contain archival data from other public or private organizations, updated monthly or annually. It is worth mentioning that although most of the dataset used in this work (from the ObservaSampa) is updated annually, not all indicators are updated, which can make it difficult to monitor public policies continuously, in addition to hampering statistical analyses with longer historical series.
The research by [52] studied the ISO 37120 transport indicators in several European cities, using principal component analysis—a method also used in this research. An important question is if the authors have used data from the World Council on City Data (WCCD) (https://www.dataforcities.org/, accessed on 3 July 2022), which certifies compliance to the ISO 3712x series. The indicator data on several world cities used to be in the platform, but, unfortunately, they are no longer available.
The bibliometric analysis of the period from 2017 to 2021 showed the vast majority of papers are about open government data (OGD). But the OGD subject itself is recent in the literature, with significant expression from 2012 [9], perhaps related to the implementation of the Open Government Partnership in 2011 [13]. That fact does not diminish the importance of the topic, because society increasingly demands participation in public policy definition, in addition to improvement in monitoring instruments, such as open data platforms and sites.
In turn, the ISO 3712x series indicators are even more recent, with the first version of ISO 37120 published in 2014 and standards ISO 37122 and 37123, both in 2019. The scientific production on both OGD and ISO 3712x is still scarce today, but it is expected to increase in the next few years.
The study of the co-occurrence of terms and grouping them has identified two important clusters. The first shows a strong cluster defined by the words OGD/transparency/open data/e-government that connects with smart city/benchmarking/sustainability. The OGD/transparency/open data cluster connects with benchmarking(core)/indicator/ISO 37120/urban development. This important finding points a dimension not captured by keyword searches. It shows that various authors in the initial universe of 600 publications have identified and analyzed the interrelations among the most cited terms, the topic of the present study, although not explicitly captured by the bibliometric analysis. It also suggests fields suitable for future scientific debate.
Regarding the comparative analysis between the ISO 3712x indicators and the Observatory of the City of São Paulo indicators, Figure 6 showed 18 indicators “Conform” (C) and 41 “Partially Conform” (PC), demonstrating 20% adherence. The “Conform” and “Partially Conform” indicators are present in almost all themes, and in all ISO standards, except for the governance theme, which is better represented in ISO 37120, revealing a last set of compliance indicators (C and PC) with representativeness and thematic diversity (Figure 5 and Figure 6, Table 6).
The calculation formulas of the 276 indicators in the 19 ISO themes were compared, with the formulas and metadata in the ObservaSampa indicators, to assess the correspondence between the formulas and the adherence to the indicator requirements and data sources described in the ISO standards. The aim was to identify indicators comparable to standardized indicators from other cities, allowing benchmarking on the same basis [20,23,28].
A cluster analysis and principal component analysis (PCA) were performed for the ObservaSampa variables that presented the ISO conformity. The most important variables identified by the PCA were the total population of the municipality and Gross Domestic Product (GDP), with the opposite behavior in relation to municipal resources destined to sport and leisure and agriculture, leading to the interpretation that while the population grew in the period from 2009 to 2020 (analyzed period), the municipal funding on those topics did not keep up (Figure 11).
It is important to point out that the cluster analysis corroborates the PCA results, as it indicated the two main clusters defined by the GDP and population and agriculture and sport_leisure variables (Figure 8).
The culture variable (the municipal resources destined to the culture function) and the social assistance variable (the municipal resources allocated to the social assistance function) had a corresponding behavior (stronger for the culture variable) in the graphic of principal components 1 and 2 (Figure 11), which leads to the interpretation that the resources in those areas are related and behaved similarly in the period from 2009 to 2020. The cluster analysis also showed a group of social_welfare and culture variables (Figure 8). In summary, component 1 expresses socioeconomic indicators, while component 2 is related to social policy indicators.
From the principal components analysis of the timeframe, components 1 and 2 (Figure 11) indicated that 2020—the first year of the COVID-19 pandemic—was the most salient year, which could reflect a greater impact on public spending.
Principal components 1 and 2 revealed a cluster composed of the years 2017, 2018, and 2019—also verified by the cluster analysis (Figure 10 and Figure 11)—referring to the management of the same mayor, which could indicate a homogeneity in social policies and public spending. Along the same line of reasoning, one could point out the clusters of the years 2013/2014/2015 and 2010/2011/2012, although they are more dispersed (Figure 10).
It is noteworthy that, in the principal component analysis, the historical series of the 12 years (2009 to 2020) used was sufficient for the analyses. The ObservaSampa contains data from 1996, but it has not always been updated. It could be improved if the information were made available at the City Hall department level, providing a more robust historical series for a broader analysis. That measure would be necessary for the definition of long-term public policies.
It should be mentioned that the investigation generated doubts regarding the definition of various indicators in the ObservaSampa, and technical meetings with the Observatory’s coordination were important to clarify those definitions and their importance for monitoring the municipality’s public policies.
For example, indicator ISO 37120:2018—5.9.1—“Average household income”—is not calculated in the ObservaSampa, which presents another social indicator, “average monthly income of the person responsible for the household”. The explanation given by the ObservaSampa coordinators was that the indicator is collected from the Brazilian demographic census, which considers the income of the head of the household.
Other São Paulo indicators different from the ISO standards are the 500 indicators not classified in the “conforming” and “partially conforming” categories, indicating that the socioeconomic, cultural, environmental, and urban–territorial realities of a megacity create the need to define its own indicators. This partly explains the low adherence (20%) of the ObservaSampa indicators to the ISO indicators. However, the large number of ObservaSampa indicators must be followed by the quality of the data. Some indicators refer to the average municipality area, which may not adequately represent the inequalities in its vast 1532 km2 territory.
On the other hand, some ISO standard indicators are difficult to calculate in São Paulo. For example, indicators ISO 37120:2018—8.8—“noise pollution”, that “shall be calculated by assessing the population exposed to noise pollution, divided by the total population of the city” [17] (p. 26), and ISO 37120:2018—8.9—“Percentage change in number of native species”, that “shall be calculated as the total net change in species divided by the total number of species from the five taxonomic groups from the most recent survey ” [17] (p. 27).
The comparative analysis of the indicator formulas refers to the existing city indicators, used in day-to-day monitoring and management. No additional costs are expected to turn them into ISO-based indicators, as mathematical adjustments on the existing indicators should be sufficient. Many indicators are not in full compliance to the standards due to minor differences in the calculation formulas, e.g., “green area per inhabitant” [17] (p. 74) in square meters (m2) and hectares (ha); and “number of public library book and e-book titles” [18] (p. 37) per 100,000 population or per 1000 population.
Among the advantages, the metrics standardization provides the possibility of comparing, benchmarking, and learning from good practices, regardless of size or locality, as long as a city follows data-driven policy and decision making to improve the citizens’ quality of life. It is worth mentioning that many cities do not know the ISO standards [26]. Such a lack of knowledge was also detected in the technical meetings held during the preparation of this work.
It is possible to propose changes to the coordination of the Brazilian ABNT/CEE 268 mirror committee; and there are open channels in the São Paulo City Hall for the improvement of information available to citizens, in compliance with the principles of government open data. In this sense, important steps can be taken in future partnerships, bringing together theory and practice.

5. Conclusions and Final Considerations

The main objective of this paper was to analyze the ISO 3712x series standardized indicators (on sustainable, smart, and resilient cities), in comparison with the Observatory of City of São Paulo indicators, verifying whether the latter meet the ISO requirements and formulas. Furthermore, our aims were to discuss the applicability of the standardized indicators in the megacity of São Paulo, as well as the characteristics of available open data.
The methods used were bibliometrics, a comparative analysis, a cluster analysis, and a principal component analysis (PCA). The research objectives were attained, and the conclusions are encapsulated below.
The bibliometric analysis showed the absence of studies that simultaneously relate the three ISO 3712x series standards—indicators of sustainable, smart, and resilient cities—with open government data, data-driven government, and city benchmarking. The scarcity of scientific production addressing OGD and ISO 3712x raises the expectation that scientific production on those important topics will increase in the next few years.
The ObservaSampa dataset used in this study meets principles defined by the Open Knowledge Foundation [59] and the Brazilian legislation, according to OGD prescriptions [60].
Regarding the comparative analysis of the ISO 3712x standards and ObservaSampa indicators, 18 indicators conform (C) to ISO and 41 partially conform (PC), with 20% adherence between them.
The principal component analysis was performed on the ObservaSampa variables conforming with the ISO, resulting in two principal components: component 1 refers to socioeconomic indicators, while component 2 was mainly related to social policy. The same findings were verified in the cluster analysis.
In accordance with the authors of [23,29,90], there are still challenges to be overcome before reaching a consensus on a common set of indicators, because historical and contextual peculiarities of cities are difficult to be accommodated in a single and universal standard. In addition, there are scaling effects of geography and territorial inequalities within and among cities that can be masked by calculation formulas involving averages. Moreover, there is still a lack of research on indicators for the qualitative assessment of factors such as place making, human capital, and historical heritage. However, open access to data may encourage urban actors and citizens to explore and become involved in city data analysis, fostering the development of innovative and smarter solutions that can contribute to city improvement.
Finally, it should be emphasized that the methodology applied here, a comparative analysis, can be replicated in cities that present quality urban indicators obtained from transparent, public, and reliable processes.

Future Research

Our study has identified a lack of studies about open government data, especially on urban indicators and standardized indicators, an important area for further investigation.
Future research could tackle a precise comparison of indicators from different cities, calculated from exactly the same formulas. More accurate data make the exchange of successful public policies more feasible. However, there are many challenges, such as obtaining quality historical series data and the fact that probably not all city indicators are comparable to standardized indicators (ISO series 3712x).
Another important and fertile field for further investigation is the discussion whether standardized indicators should be adjusted to cities’ demands and whether cities should invest in monitoring and providing quality open data with easy access.
The bibliometric study of the interrelations among the themes, as shown in the two clusters defined by the OGD/transparency/open data/e-government words that connect with smart city/benchmarking/sustainability, indicates fields of study suitable for future scientific debate.

Author Contributions

Conceptualization, H.T., I.N., C.L.K.Y., J.A.Q., C.A.S.M., A.A., M.S.d.P.P. and F.T.B.; methodology, H.T., I.N., J.A.Q., C.A.S.M., C.I.d.C. and F.T.B.; software, J.A.Q., C.A.S.M. and C.I.d.C.; validation, H.T., I.N., J.A.Q., C.A.S.M., C.I.d.C. and F.T.B.; formal analysis, H.T., I.N., J.A.Q., C.A.S.M., C.I.d.C. and F.T.B.; investigation, H.T., I.N. and C.A.S.M.; data curation H.T., I.N. and J.A.Q.; writing—original draft preparation, H.T. and I.N; writing—review and editing, H.T., I.N., C.L.K.Y., J.A.Q., C.A.S.M., A.A., C.I.d.C. and F.T.B.; visualization, I.N. and C.A.S.M.; supervision F.T.B. and J.A.Q.; project administration, H.T. and F.T.B. All authors have read and agreed to the published version of the manuscript.

Funding

Coordination of Superior Level Staff Improvement of the Brazilian Ministry of Education (CAPES), Finance code 001; Foundation for the Support of the University of São Paulo (FUSP), Project 3747/2021; and the Brazilian National Council for Scientific and Technological Development (CNPq), Financial Code: 305188/2020-8. Foundation for Technological Development in Engineering (FDTE), Project SGC 101.

Acknowledgments

The authors thank João Antonio da Silva Filho, Mauricio Faria, Angélica Fernandes, Antonio Carlos Alves Pinto Serrano, and Ricardo Ferreira Santos from the Court of Auditors of the City of São Paulo; the Department of Production Engineering, Polytechnic School; the Coordination of Production and Analysis of Information—GEOINFO, Municipal Department of Urban Development and Licensing; Silvio César Lima Ribeiro; Marilia Roggero; and the Brazilian Mirror Committee ABNT/CEE 268.

Conflicts of Interest

The authors declare no conflict of interest.

Appendix A

Table A1. Final sample of bibliometric analysis, in alphabetical order of authors. Source: the authors.
#AuthorsTitleYearResearched Topics
1Abella, A.; Ortiz-de-Urbina-Criado, M.; De-Pablos-Heredero, C. [80]A model for the analysis of data-driven innovation and value generation in smart cities’ ecosystems2017“Open Government Data”
2Bebber, S.; Libardi, B.; De Atayde Moschen S.; Correa da Silva, M.B.; Fachinelli, A.C., Nogueira M.L. [53]Sustainable mobility scale: A contribution for sustainability assessment systems in urban mobility2021“ISO 37120” or “ISO 37122” or “ISO 37123”
3Begany, G.M.; Martin, E.G.; Yuan, X. [82]Open government data portals: Predictors of site engagement among early users of Health Data NY2021“Open Government Data”
4Bencke, L.; Cechinel, C.; Munoz, R. [22]Automated classification of social network messages into Smart Cities dimensions2020“ISO 37120” or “ISO 37122” or “ISO 37123”
5Berman, M; Orttung, R.W. [24]Measuring Progress toward Urban Sustainability: Do Global Measures Work for Arctic Cities?2020“ISO 37120” or “ISO 37122” or “ISO 37123”
6Bunders, D.J.; Varró, K. [91]Problematizing data-driven urban practices: Insights from five Dutch ‘smart cities’2019“Open Government Data”
7Correa, A.S.; de Souza, R.M.; Silva F.S.C.D. [88]Towards an automated method to assess data portals in the deep web2019“Open Government Data”
8Cortada, J.W.; Aspray, W. [30]Gaining Historical Perspective on Political Fact-Checking: The Experience of the United States2020“Data driven government”
9Dall’O, G.; Bruni, E.; Panza, A.; Sarto, L.; Khayatian, F. [27]Evaluation of cities’ smartness by means of indicators for small and medium cities and communities: A methodology for Northern Italy2017“ISO 37120” or “ISO 37122” or “ISO 37123”
10Gao, Y.; Janssen, M.; Zhang, C. [92]Understanding the evolution of open government data research: towards open data sustainability and smartness2021“Open Government Data”
11Hajduk, S; Jelonek, D [51]A Decision-Making Approach Based on TOPSIS Method for Ranking Smart Cities in the Context of Urban Energy2021“ISO 37120” or “ISO 37122” or “ISO 37123”
12Islam, M.T.; Talukder, M.S.; Khayer, A.; Islam, A.K.M.N. [83]Exploring continuance usage intention toward open government data technologies: an integrated approach2021“Open Government Data”
13Janssen, M.; Hartog, M.; Matheus, R.; Yi Ding, A.; Kuk, G. [31]Will Algorithms Blind People? The Effect of Explainable AI and Decision-Makers’ Experience on AI-supported Decision-Making in Government2020“Data driven government”
14Janssen, M.; Attard, J.; Alexopoulos, C. [32]Data-driven government: Creating value from Big and Open Linked Data Track: E-government2019“Data driven government”
15Kassen M. [66]Understanding motivations of citizens to reuse open data: open government data as a philanthropic movement2021“Open Government Data”
16Kassen, M. [84]Open data in Kazakhstan: incentives, implementation and challenges2017“Open Government Data”
17Kassen, M. [86]Open data and e-government—related or competing ecosystems: a paradox of open government and promise of civic engagement in Estonia2019“Open Government Data”
18Kilkis, S. [28]Benchmarking South East European Cities with the Sustainable Development of Energy, Water and Environment Systems Index2018“City benchmarking”
19Lassinantti, J.; Stahlbrost, A.; Runardotter, M. [81]Relevant social groups for open data use and engagement2018“Open Government Data”
20Lee, T.; Lee-Geiller, S.; Lee, B.K. [85]Are pictures worth a thousand words? The effect of information presentation type on citizen perceptions of government websites2020“Open Government Data”
21Lehner, A.; Erlacher, C.; Schlogl, M.; Wegerer, J.; Blaschke, T.; Steinnocher, K. [25]Can ISO-Defined Urban Sustainability Indicators Be Derived from Remote Sensing: An Expert Weighting Approach2018“ISO 37120” or “ISO 37122” or “ISO 37123”
22Luthfi, A.; Janssen, M. [75]Open data for evidence-based decision-making: Data-driven government resulting in uncertainty and polarization2019“Data driven government”
23Matheus, R.; Janssen, M. [89]A Systematic Literature Study to Unravel Transparency Enabled by Open Government Data: The Window Theory2020“Open Government Data”
24Mensah, I.K.; Luo, C.Y.; Abu-Shanab, E. [87]Citizen Use of E-Government Services Websites: A Proposed E-Government Adoption Recommendation Model (EGARM)2021“Open Government Data”
25Moustaka, V.; Maitis, A.; Vakali, A.; Anthopoulos, L.G. [23]Urban Data Dynamics: A Systematic Benchmarking Framework to Integrate Crowdsourcing and Smart Cities’ Standardization2021“ISO 37120” or “ISO 37122” or “ISO 37123”
26Neves, F.T.; Neto, M.D.; Aparicio, M. [2]The impacts of open data initiatives on smart cities: A framework for evaluation and monitoring2020“Open Government Data”
27Pozen, D.E. [79]Transparency’s Ideological Drift2018“Open Government Data”
28Przybylowski, P.; Przybylowski, A.; Kalaska, A. [50]Utility Method as an Instrument of the Quality of Life Assessment Using the Examples of Selected European Cities2021“ISO 37120” or “ISO 37122” or “ISO 37123”
29Purwanto, A.; Zuiderwijk, A.; Janssen, M. [7]Citizen engagement with open government data Lessons learned from Indonesia’s presidential election2020“Open Government Data”
30Rathore, M.; Paul, A.; Hong, W.H.; HC.; Awan, I.; Saeed, S. [93]Exploiting IoT and big data analytics: Defining Smart Digital City using real-time urban data2018“Open Government Data”
31Ruijer, E.; Détienne, F.; Baker, M.; Groff, J.; Meijer, A.J. [4]The Politics of Open Government Data: Understanding Organizational Responses to Pressure for More Transparency2020“Open Government Data”
32Ruijer, E.; Dingelstad, J.; Meijer, A. [94]Studying complex systems through design interventions probing open government data ecosystems in the Netherlands2021“Open Government Data”
33Ruijer, E.; Grimmelikhuijsen, S.; Meijer, A. [95]Open data for democracy: Developing a theoretical framework for open data use2017“Open Government Data”
34Ruijer, E.; Grimmelikhuijsen, S.; van den Berg, J.; Meijer, A. [96]Open data work: understanding open data usage from a practice lens2020“Open Government Data”
35Ruijer, E.; Meijer, A. [3]Open Government Data as an Innovation Process: Lessons from a Living Lab Experiment2020“Open Government Data”
36Saxena, S. [97]Prospects of open government data (OGD) in facilitating the economic diversification of GCC region2017“Open Government Data”
37Saxena, S.; Janssen, M. [12]Examining open government data (OGD) usage in India through UTAUT framework2017“Open Government Data”
38Shah, S.I.H.; Peristeras, V.; Magnisalis, I. [76]DaLiF: a data lifecycle framework for data-driven governments2021“Data driven government”
39Sugg, Z. [98]Social barriers to open (water) data2021“Open Government Data”
40Tai, K.T. [9]Open government research over a decade: A systematic review2021“Open Government Data”
41van Donge, W.; Bharosa, N.; Janssen, M. [77]Data-driven government: Cross-case comparison of data stewardship in data ecosystems2021“Data driven government”
42Wang, H.J. [99]Adoption of open government data: Perspectives of user innovators2020“Open Government Data”
43Wang, H.J.; Lo, J. [100]Factors Influencing the Adoption of Open Government Data at the Firm Level2020“Open Government Data”
44White, J.M. [49]Standardising the city as an object of comparison: The promise, limits and perceived benefits of ISO 371202021“ISO 37120” or “ISO 37122” or “ISO 37123”
45Wolniak, R.; Jonek-Kowalska, I. [26]The level of the quality of life in the city and its monitoring2021“ISO 37120” or “ISO 37122” or “ISO 37123”
46Zhu, X.H. [67]The failure of an early episode in the open government data movement: A historical case study2017“Open Government Data”
47Zuffova, M. [101]Do FOI laws and open government data deliver as anti-corruption policies? Evidence from a cross-country study2020“Open Government Data”
48Zuiderwijk, A. [102]Analysing Open Data in Virtual Research Environments: New Collaboration Opportunities to Improve Policy Making2017“Open Government Data”
49Zuiderwijk, A.; de Reuver, M. [62]Why open government data initiatives fail to achieve their objectives: categorizing and prioritizing barriers through a global survey2021“Open Government Data”
50Zuiderwijk, A.; Pirannejad, A.; Susha, I. [103]Comparing open data benchmarks: Which metrics and methodologies determine countries’ positions in the ranking lists?2021“Open Government Data”
51Zuiderwijk, A.; Shinde, R.; Janssen, M. [78]Investigating the attainment of open government data objectives: is there a mismatch between objectives and results?2019“Open Government Data” and “Data driven government”

References

  1. Albino, V.; Berardi, U.; Dangelico, R.M. Smart cities: Definitions, dimensions, performance, and initiatives. J. Urban Technol. 2015, 22, 3–21. [Google Scholar] [CrossRef]
  2. Neves, F.T.; de Castro Neto, M.; Aparicio, M. The impacts of open data initiatives on smart cities: A framework for evaluation and monitoring. Cities 2020, 106, 102860. [Google Scholar] [CrossRef]
  3. Ruijer, E.; Meijer, A. Open Government Data as an Innovation Process: Lessons from a Living Lab Experiment. Public Perform. Manag. Rev. 2020, 43, 613–635. [Google Scholar] [CrossRef] [Green Version]
  4. Ruijer, E.; Détienne, F.; Baker, M.; Groff, J.; Meijer, A.J. The Politics of Open Government Data: Understanding Organizational Responses to Pressure for More Transparency. Am. Rev. Public Adm. 2020, 50, 260–274. [Google Scholar] [CrossRef] [Green Version]
  5. Wang, H.J.; Lo, J. Adoption of open government data among government agencies. Gov. Inf. Q. 2016, 33, 80–88. [Google Scholar] [CrossRef]
  6. Janssen, M.; Charalabidis, Y.; Zuiderwijk, A. Benefits, Adoption Barriers and Myths of Open Data and Open Government. Inf. Syst. Manag. 2012, 29, 258–268. [Google Scholar] [CrossRef] [Green Version]
  7. Purwanto, A.; Zuiderwijk, A.; Janssen, M. Citizen engagement with open government data: Lessons learned from Indonesia’s presidential election. Transform. Gov. People Process Policy 2020, 14, 1–30. [Google Scholar] [CrossRef]
  8. Attard, J.; Orlandi, F.; Auer, S. Value creation on open government data. Proc. Annu. Hawaii Int. Conf. Syst. Sci. 2016, 2016, 2605–2614. [Google Scholar] [CrossRef]
  9. Tai, K.T. Open government research over a decade: A systematic review. Gov. Inf. Q. 2021, 38, 101566. [Google Scholar] [CrossRef]
  10. Attard, J.; Orlandi, F.; Scerri, S.; Auer, S. A systematic review of open government data initiatives. Gov. Inf. Q. 2015, 32, 399–418. [Google Scholar] [CrossRef]
  11. Bates, J. The strategic importance of information policy for the contemporary neoliberal state: The case of Open Government Data in the United Kingdom. Gov. Inf. Q. 2014, 31, 388–395. [Google Scholar] [CrossRef]
  12. Saxena, S.; Janssen, M. Examining open government data (OGD) usage in India through UTAUT framework. Foresight 2017, 19, 421–436. [Google Scholar] [CrossRef]
  13. OGP—Open Government Partnership Declaração de Governo Aberto. Available online: https://www.gov.br/cgu/pt-br/governo-aberto/central-de-conteudo/documentos/arquivos/declaracao-governo-aberto.pdf (accessed on 15 April 2022).
  14. Araújo, A.C.; Reis, L.; Sampaio, R.C. Do transparency and open data walk together? An analysis of initiatives in five brazilian capitals. Medijske Stud. 2016, 7, 65–83. [Google Scholar] [CrossRef] [Green Version]
  15. Gonzalez-Zapata, F.; Heeks, R. The multiple meanings of open government data: Understanding different stakeholders and their perspectives. Gov. Inf. Q. 2015, 32, 441–452. [Google Scholar] [CrossRef]
  16. Gascó-Hernández, M.; Martin, E.G.; Reggi, L.; Pyo, S.; Luna-Reyes, L.F. Promoting the use of open government data: Cases of training and engagement. Gov. Inf. Q. 2018, 35, 233–242. [Google Scholar] [CrossRef]
  17. ISO—International Organization for Standardization ISO 37120:2018; Sustainable Cities and Communities—Indicators for City Services and Quality Of Life. ISO: Geneva, Switzerland, 2018.
  18. ISO—International Organization for Standardization ISO 37122:2019; Sustainable Cities and Communities—Indicators for Smart Cities. ISO: Geneva, Switzerland, 2019.
  19. ISO—International Organization for Standardization ISO 37123:2019; Sustainable Cities and Communities—Indicators for Resilient Cities. ISO: Geneva, Switzerland, 2019.
  20. ISO—International Organization for Standardization Business Plan ISO/TC 268; Sustainable Development in Communities. ISO: Geneva, Switzerland, 2013; pp. 1–16.
  21. ISO—International Organization for Standardization ISO/TC 268; Sustainable Cities and Communities. Available online: https://www.iso.org/committee/656906.html?view=participation (accessed on 10 April 2022).
  22. Bencke, L.; Cechinel, C.; Munoz, R. Automated classification of social network messages into Smart Cities dimensions. Futur. Gener. Comput. Syst. 2020, 109, 218–237. [Google Scholar] [CrossRef]
  23. Moustaka, V.; Maitis, A.; Vakali, A.; Anthopoulos, L.G. Urban data dynamics: A systematic benchmarking framework to integrate crowdsourcing and smart cities’ standardization. Sustainability 2021, 13, 8553. [Google Scholar] [CrossRef]
  24. Berman, M.; Orttung, R.W. Measuring progress toward urban sustainability: Do global measures work for arctic cities? Sustainability 2020, 12, 3708. [Google Scholar] [CrossRef]
  25. Lehner, A.; Erlacher, C.; Schlögl, M.; Wegerer, J.; Blaschke, T.; Steinnocher, K. Can ISO-defined urban sustainability indicators be derived from remote sensing: An expert weighting approach. Sustainability 2018, 10, 1268. [Google Scholar] [CrossRef] [Green Version]
  26. Wolniak, R.; Jonek-Kowalska, I. The level of the quality of life in the city and its monitoring. Innov. Eur. J. Soc. Sci. Res. 2021, 34, 376–398. [Google Scholar] [CrossRef]
  27. Dall’O, G.; Bruni, E.; Panza, A.; Sarto, L.; Khayatian, F. Evaluation of cities’ smartness by means of indicators for small and medium cities and communities: A methodology for Northern Italy. Sustain. Cities Soc. 2017, 34, 193–202. [Google Scholar] [CrossRef]
  28. Kılkış, Ş. Benchmarking south east european cities with the sustainable development of energy, water and environment systems index. J. Sustain. Dev. Energy, Water Environ. Syst. 2018, 6, 162–209. [Google Scholar] [CrossRef]
  29. White, J.M.; Kitchin, R. For or Against ‘The Business of Benchmarking’? Int. J. Urban Reg. Res. 2021, 45, 385–388. [Google Scholar] [CrossRef]
  30. Cortada, J.W.; Aspray, W. Gaining Historical Perspective on Political Fact-Checking: The Experience of the United States. Libres 2020, 30, 1–32. [Google Scholar] [CrossRef]
  31. Janssen, M.; Hartog, M.; Matheus, R.; Yi Ding, A.; Kuk, G. Will Algorithms Blind People? The Effect of Explainable AI and Decision-Makers’ Experience on AI-supported Decision-Making in Government. Soc. Sci. Comput. Rev. 2022, 40, 478–493. [Google Scholar] [CrossRef]
  32. Janssen, M.; Attard, J.; Alexopoulos, C. Data-driven government: Creating value from Big and Open Linked Data Track: E-government. Proc. Annu. Hawaii Int. Conf. Syst. Sci. 2019, 2019, 2890–2891. [Google Scholar]
  33. SEADE População 2022 (MSP)—Seade População. Available online: https://populacao.seade.gov.br/populacao-2022-msp/ (accessed on 23 April 2022).
  34. PMSP—PREFEITURA MUNICIPAL DE SÃO PAULO Observatório ObservaSampa. Available online: https://observasampa.prefeitura.sp.gov.br/ (accessed on 7 May 2022).
  35. United Nations Department of Economic and Social Affairs Population Division The World’s Cities in 2018—Data Booklet. 2018, p. 34. Available online: https://www.un.org/en/development/desa/population/publications/pdf/urbanization/the_worlds_cities_in_2018_data_booklet.pdf (accessed on 13 April 2022).
  36. United Nations Development Programme Human Development Index (HDI) | Human Development Reports. Available online: https://hdr.undp.org/en/content/human-development-index-hdi?utm_source=EN&utm_medium=GSR&utm_content=US_UNDP_PaidSearch_Brand_English&utm_campaign=CENTRAL&c_src=CENTRAL&c_src2=GSR&gclid=EAIaIQobChMIwp2znMSS-AIVNOVcCh070QEZEAAYASAAEgJ2ufD_BwE (accessed on 31 May 2022).
  37. United Nations Development Programme O que é o IDHM|PNUD Brasil. Available online: https://www.br.undp.org/content/brazil/pt/home/idh0/conceitos/o-que-e-o-idhm.html (accessed on 31 May 2022).
  38. United Nations Transforming Our World: The 2030 Agenda for Sustainable Development. 2015, p. 35. Available online: https://www.un.org/ga/search/view_doc.asp?symbol=A/RES/70/1&Lang=E (accessed on 13 April 2022).
  39. ABNT—Associação Brasileira de Normas Técnicas ABNT NBR ISO 37120:2021; Cidades e Comunidades Sustentáveis—Indicadores para Serviços Urbanos e Qualidade de Vida. ABNT: Rio de Janeiro, Brazil, 2021.
  40. ABNT—Associação Brasileira de Normas Técnicas ABNT NBR ISO 37122:2020; Cidades e Comunidades Sustentáveis—Indicadores para Cidades Inteligentes. ABNT: Rio de Janeiro, Brazil, 2020.
  41. ABNT—Associação Brasileira de Normas Técnicas ABNT NBR ISO 37123:2021; Cidades e Comunidades Sustentáveis—Indicadores para Cidades Resilientes. ABNT: Rio de Janeiro, Brazil, 2021.
  42. ISO—International Organization for Standardization ISO/FDIS 37110; Sustainable Cities and Communities—Management Requirements and Recommendations for Open Data for Smart Cities and Communities—Overview and General Principles. ISO: Geneva, Switzerland, 2022; p. 14.
  43. ISO—International Organization for Standardization ISO/TR 37150:2014; Smart Community Infrastructures—Review of Existing Activities Relevant to Metrics (Technical Report). ISO: Geneva, Switzerland, 2014.
  44. Arcadis The Arcadis Sustainable Cities Index 2022: Prosperity Beyond Profit. 2022. Available online: https://images.connect.arcadis.com/Web/Arcadis/%7Be08e5cda-768d-46a3-91ce-4efe16cbfc05%7D_The_Arcadis_Sustainable_Cities_Index_2022_Report.pdf?_gl=1*1762sld*_ga*MTc5MzUwMjA2MC4xNjU2NzYyMjg4*_ga_H7RF8YQXTC*MTY1Njc2MjI4NS4xLjEuMTY1Njc2MjMzMS4w (accessed on 11 January 2022).
  45. EIU—Economist Intelligence Unit The Global Liveability Index 2022: Recovery and Hardship. 2022. Available online: https://pages.eiu.com/rs/753-RIQ-438/images/liveability-index-2022.pdf?mkt_tok=NzUzLVJJUS00MzgAAAGFXbImgjLVksAetrnWRMG8H7WGDiY2pR6jF7EOmt3AX5I58Zc7DTKihIZXCAGZQS56cYHidBpZsB35Na6KO5ST5Ea0TZha14SWO87a6TvpSuFbYA (accessed on 11 January 2022).
  46. Berrone, P.; Ricart, J.E. IESE Cities in Motion Index 2020. 2020. Available online: https://media.iese.edu/research/pdfs/ST-0542-E.pdf (accessed on 11 January 2022).
  47. Urban Systems Ranking Connected Smart Cities (Edição 2021) 2021. Available online: https://d335luupugsy2.cloudfront.net/cms/files/48668/1636033080Relatorio_RCSC_21_RD.pdf (accessed on 11 January 2022).
  48. Kitchin, R.; Lauriault, T.P.; McArdle, G. Knowing and governing cities through urban indicators, city benchmarking and real-time dashboards. Reg. Stud. Reg. Sci. 2015, 2, 6–28. [Google Scholar] [CrossRef] [Green Version]
  49. White, J.M. Standardising the city as an object of comparison: The promise, limits and perceived benefits of ISO 37120. Telemat. Inform. 2021, 57, 101515. [Google Scholar] [CrossRef]
  50. Przybyłowski, P.; Przybyłowski, A.; Kałaska, A. Utility method as an instrument of the quality of life assessment using the examples of selected european cities. Energies 2021, 14, 2770. [Google Scholar] [CrossRef]
  51. Hajduk, S.; Jelonek, D. A decision-making approach based on topsis method for ranking smart cities in the context of urban energy. Energies 2021, 14, 2691. [Google Scholar] [CrossRef]
  52. Hajduk, S.; Litavniece, L. Dimensionality of an urban transport system based on ISO 37120 indicators for the case of selected European cities. Eng. Manag. Prod. Serv. 2019, 11, 80–91. [Google Scholar] [CrossRef] [Green Version]
  53. Bebber, S.; Libardi, B.; De Atayde Moschen, S.; Correa da Silva, M.B.; Cristina Fachinelli, A.; Nogueira, M.L. Sustainable mobility scale: A contribution for sustainability assessment systems in urban mobility. Clean. Eng. Technol. 2021, 5, 100271. [Google Scholar] [CrossRef]
  54. Couto, E.d.A. Aplicação dos Indicadores de Desenvolvimento Sustentável da Norma ABNT NBR ISO 37120:2017 para a Cidade do Rio de Janeiro e Análise Comparativa com Cidades da América Latina. Master’s Thesis, Universidade Federal do Rio de Janeiro, Rio de Janeiro, Brazil, 2018. Available online: http://repositorio.poli.ufrj.br/monografias/monopoli10024924.pdf (accessed on 21 August 2021).
  55. Negreiros, I. Retrofit Urbano: Uma Abordagem para Tomada de Decisão. Ph.D. Thesis, Escola Politécnica da Universidade de São Paulo, São Paulo, Brazil, 2018. Available online: https://teses.usp.br/teses/disponiveis/3/3146/tde-04022019-091230/en.php (accessed on 21 August 2021).
  56. Francisco, A.C. Modelo Matemático para Avaliação de Campus Sustentável e Inteligente. Ph.D. Thesis, Universidade Estadual Paulista (Unesp), Sorocaba, São Paulo, Brazil, 2022. Available online: https://repositorio.unesp.br/bitstream/handle/11449/217088/francisco_acc_dr_soro.pdf?sequence=5 (accessed on 21 August 2021).
  57. Negreiros, I.; Francisco, A.C.C.; Fengler, F.H.; Faria, G.; Pinto, L.G.P.; Tolotto, M.; Rogoschewski, R.B.; Romano, R.R.; Netto, R.S. Smart Campus® as a living lab on sustainability indicators monitoring. In Proceedings of the 2020 IEEE International Smart Cities Conference (ISC2), Rome, Italy, 19–21 October 2022; pp. 1–5. [Google Scholar]
  58. Sgarbi, A.C. Redução de Risco de Desastres: Uma Análise da Subprefeitura do Butantã SP pela perspectiva da ISO 37123—Desenvolvimento Sustentável de Comunidades—Indicadores de Cidades Resilientes. Master’s Thesis, Escola Politécnica da Universidade de São Paulo, São Paulo, Brazil, 2020. Available online: https://www.teses.usp.br/teses/disponiveis/3/3146/tde-20102020-125902/en.php (accessed on 21 August 2021).
  59. OKF. The Open Definition—Open Definition—Defining Open in Open Data, Open Content and Open Knowledge. Available online: http://opendefinition.org/ (accessed on 7 May 2022).
  60. Institui a Política de Dados Abertos do Poder Executivo Federal. BRASIL Decreto No. 8.777 de 11 de Maio de 2016; Diário Oficial da União: Brasília, Brazil, 2016. [Google Scholar]
  61. PMSP-CGM Controladoria Geral|CGM—Controladoria Geral do Município | Prefeitura da Cidade de São Paulo. Available online: https://www.prefeitura.sp.gov.br/cidade/secretarias/controladoria_geral/ (accessed on 14 May 2022).
  62. Zuiderwijk, A.; de Reuver, M. Why open government data initiatives fail to achieve their objectives: Categorizing and prioritizing barriers through a global survey. Transform. Gov. People Process Policy 2021, 15, 377–395. [Google Scholar] [CrossRef]
  63. Vetrò, A.; Canova, L.; Torchiano, M.; Minotas, C.O.; Iemma, R.; Morando, F. Open data quality measurement framework: Definition and application to Open Government Data. Gov. Inf. Q. 2016, 33, 325–337. [Google Scholar] [CrossRef] [Green Version]
  64. Meijer, R.; Conradie, P.; Choenni, S. Reconciling contradictions of open data regarding transparency, privacy, security and trust. J. Theor. Appl. Electron. Commer. Res. 2014, 9, 32–44. [Google Scholar] [CrossRef] [Green Version]
  65. Dawes, S.S.; Vidiasova, L.; Parkhimovich, O. Planning and designing open government data programs: An ecosystem approach. Gov. Inf. Q. 2016, 33, 15–27. [Google Scholar] [CrossRef]
  66. Kassen, M. Understanding motivations of citizens to reuse open data: Open government data as a philanthropic movement. Innov. Organ. Manag. 2021, 23, 44–70. [Google Scholar] [CrossRef]
  67. Zhu, X. The failure of an early episode in the open government data movement: A historical case study. Gov. Inf. Q. 2017, 34, 256–269. [Google Scholar] [CrossRef]
  68. Chan, C.M.L. From open data to open innovation strategies: Creating e-services using open government data. Proc. Annu. Hawaii Int. Conf. Syst. Sci. 2013, 1890–1899. [Google Scholar] [CrossRef]
  69. Altamirano-Santiago, M.; Martínez-Mendoza, A. El Método Comparado Como Componente Metodológico En Las Políticas Públicas. Rev. Investig. Univ. Quindío 2020, 32, 88–101. [Google Scholar] [CrossRef]
  70. Harrison, P. Sustainability in city-regionalism as emergent practice: The case of the brics. Sustainability 2021, 13, 4721. [Google Scholar] [CrossRef]
  71. Sharma, K.; Verma, H. A Recent Overview of Some Hierarchical Clustering Techniques. J. Eng. Res. Appl. 2018, 8, 47–50. [Google Scholar] [CrossRef]
  72. Jolliffe, I.T. Principal Component Analysis; Springer Series in Statistics; Springer: New York, NY, USA, 2002; ISBN 0-387-95442-2. [Google Scholar]
  73. Bouroche, J.-M.; Saporta, G. Análise de Dados; Zahar Editores: Rio de Janeiro, Brazil, 1982. [Google Scholar]
  74. Dunteman, G.H. Principal Components Analysis; SAGE Publications: Thousand Oaks, CA, USA, 1989; ISBN 9780803931046. [Google Scholar]
  75. Luthfi, A.; Janssen, M. Open data for evidence-based decision-making: Data-driven government resulting in uncertainty and polarization. Int. J. Adv. Sci. Eng. Inf. Technol. 2019, 9, 1071–1078. [Google Scholar] [CrossRef] [Green Version]
  76. Shah, S.I.H.; Peristeras, V.; Magnisalis, I. DaLiF: A Data Lifecycle Framework for Data-Driven Governments; Springer International Publishing: Berlin/Heidelberg, Germany, 2021; Volume 8, ISBN 4053702100. [Google Scholar]
  77. van Donge, W.; Bharosa, N.; Janssen, M.F.W.H.A. Data-driven government: Cross-case comparison of data stewardship in data ecosystems. Gov. Inf. Q. 2021, 39, 101642. [Google Scholar] [CrossRef]
  78. Zuiderwijk, A.; Shinde, R.; Janssen, M. Investigating the attainment of open government data objectives: Is there a mismatch between objectives and results? Int. Rev. Adm. Sci. 2019, 85, 645–672. [Google Scholar] [CrossRef] [Green Version]
  79. Pozen, D.E. Transparency’s Ideological Drift. Yale Law J. 2018, 128, 100–165. [Google Scholar]
  80. Abella, A.; Ortiz-de-Urbina-Criado, M.; De-Pablos-Heredero, C. A model for the analysis of data-driven innovation and value generation in smart cities’ ecosystems. Cities 2017, 64, 47–53. [Google Scholar] [CrossRef]
  81. Lassinantti, J.; Ståhlbröst, A.; Runardotter, M. Relevant social groups for open data use and engagement. Gov. Inf. Q. 2019, 36, 98–111. [Google Scholar] [CrossRef]
  82. Begany, G.M.; Martin, E.G.; Yuan, X. Open government data portals: Predictors of site engagement among early users of Health Data NY. Gov. Inf. Q. 2021, 38, 101614. [Google Scholar] [CrossRef]
  83. Islam, M.T.; Talukder, M.S.; Khayer, A.; Islam, A.K.M.N. Exploring continuance usage intention toward open government data technologies: An integrated approach. VINE J. Inf. Knowl. Manag. Syst. 2021, ahead-of-print. 1–23. [Google Scholar] [CrossRef]
  84. Kassen, M. Open data in Kazakhstan: Incentives, implementation and challenges. Inf. Technol. People 2017, 30, 301–323. [Google Scholar] [CrossRef]
  85. Lee, T.; Lee-Geiller, S.; Lee, B.K. Are pictures worth a thousand words? The effect of information presentation type on citizen perceptions of government websites. Gov. Inf. Q. 2020, 37, 101482. [Google Scholar] [CrossRef]
  86. Kassen, M. Open data and e-government–related or competing ecosystems: A paradox of open government and promise of civic engagement in Estonia. Inf. Technol. Dev. 2019, 25, 552–578. [Google Scholar] [CrossRef]
  87. Mensah, I.K.; Luo, C.; Abu-Shanab, E. Citizen use of e-government services websites: A proposed e-government adoption recommendation model (EGARM). Int. J. Electron. Gov. Res. 2021, 17, 19–42. [Google Scholar] [CrossRef]
  88. Correa, A.S.; de Souza, R.M.; da Silva, F.S.C. Towards an automated method to assess data portals in the deep web. Gov. Inf. Q. 2019, 36, 412–426. [Google Scholar] [CrossRef]
  89. Matheus, R.; Janssen, M. A Systematic Literature Study to Unravel Transparency Enabled by Open Government Data: The Window Theory. Public Perform. Manag. Rev. 2020, 43, 503–534. [Google Scholar] [CrossRef] [Green Version]
  90. Edvardsson, I.R.; Yigitcanlar, T.; Pancholi, S. Knowledge city research and practice under the microscope: A review of empirical findings. Knowl. Manag. Res. Pract. 2016, 14, 537–564. [Google Scholar] [CrossRef] [Green Version]
  91. Bunders, D.J.; Varró, K. Problematizing data-driven urban practices: Insights from five Dutch ‘smart cities’. Cities 2019, 93, 145–152. [Google Scholar] [CrossRef]
  92. Gao, Y.; Janssen, M.; Zhang, C. Understanding the evolution of open government data research: Towards open data sustainability and smartness. Int. Rev. Adm. Sci. 2021, 002085232110099. [Google Scholar] [CrossRef]
  93. Rathore, M.M.; Paul, A.; Hong, W.-H.; Seo, H.; Awan, I.; Saeed, S. Exploiting IoT and big data analytics: Defining Smart Digital City using real-time urban data. Sustain. Cities Soc. 2018, 40, 600–610. [Google Scholar] [CrossRef]
  94. Ruijer, E.; Dingelstad, J.; Meijer, A. Studying complex systems through design interventions probing open government data ecosystems in The Netherlands. Public Manag. Rev. 2021, ahead-of-print. 1–21. [Google Scholar] [CrossRef]
  95. Ruijer, E.; Grimmelikhuijsen, S.; Meijer, A. Open data for democracy: Developing a theoretical framework for open data use. Gov. Inf. Q. 2017, 34, 45–52. [Google Scholar] [CrossRef]
  96. Ruijer, E.; Grimmelikhuijsen, S.; van den Berg, J.; Meijer, A. Open data work: Understanding open data usage from a practice lens. Int. Rev. Adm. Sci. 2020, 86, 3–19. [Google Scholar] [CrossRef]
  97. Saxena, S. Prospects of open government data (OGD) in facilitating the economic diversification of GCC region. Inf. Learn. Sci. 2017, 118, 214–234. [Google Scholar] [CrossRef]
  98. Sugg, Z. Social barriers to open (water) data. Wiley Interdiscip. Rev. Water 2022, 9, e1564. [Google Scholar] [CrossRef]
  99. Wang, H.J. Adoption of open government data: Perspectives of user innovators. Inf. Res. 2020, 25, 849. [Google Scholar]
  100. Wang, H.J.; Lo, J. Factors Influencing the Adoption of Open Government Data at the Firm Level. IEEE Trans. Eng. Manag. 2020, 67, 670–682. [Google Scholar] [CrossRef]
  101. Žuffová, M. Do FOI laws and open government data deliver as anti-corruption policies? Evidence from a cross-country study. Gov. Inf. Q. 2020, 37, 101480. [Google Scholar] [CrossRef]
  102. Zuiderwijk, A. Analysing Open Data in Virtual Research Environments: New Collaboration Opportunities to Improve Policy Making. Int. J. Electron. Gov. Res. 2017, 13, 76–92. [Google Scholar] [CrossRef] [Green Version]
  103. Zuiderwijk, A.; Pirannejad, A.; Susha, I. Comparing open data benchmarks: Which metrics and methodologies determine countries’ positions in the ranking lists? Telemat. Inform. 2021, 62, 101634. [Google Scholar] [CrossRef]
Figure 1. Study Area. Sourde: the authors, ArcGis10.2.
Sustainability 14 08802 g001
Figure 2. Sustainable development of communities—relationship between the family of city indicators standards. Source: Reprinted with permission from Ref. [18] (p. 2), 2019, ISO—International Organization for Standardization.
Sustainability 14 08802 g002
Figure 3. Flowchart of the bibliometric study. Source: the authors.
Sustainability 14 08802 g003
Figure 4. VOSViewer® graphs of co-occurrence of terms, (a) highlighting cluster green (related to open government data) and (b) highlighting cluster red (related to indicator).
Sustainability 14 08802 g004
Figure 6. Results of the comparative analysis between city indicators reported in ObservaSampa and each standard (ISO 37120, ISO 37122, and ISO 37123), with percentages of each rating and standard theme. Legend: C—“Conforms”, PC—“Partially Conforms”, FTS—“Fail to Support”. Source: the authors.
Sustainability 14 08802 g006
Table 1. Themes and number of indicators of ISO 3712x series of standards. Source: adapted from [17,18,19].
SectionThemeISO
37120:2018
ISO
37122:2019
ISO
37123:2019
5Economy1147
6Education634
7Energy9103
8Environment and climate change939
9Finance627
10Governance446
11Health634
12Housing1026
13Population and social conditions945
14Recreation210
15Safety1014
16Solid waste1061
17Sport and culture340
18Telecommunication231
19Transportation9141
20Urban/local agriculture and food security432
21Urban planning746
22Wastewater45 0
23Water742
TOTAL19 Themes1288068
Table 2. Themes and number of indicators from ObservaSampa Observatory. Source: adapted from [34].
ThemeIndicators
Accessibility and people with disabilities25
Culture12
Economy, Employment, and Income61
Education42
Environment33
Health89
Housing and Basic Sanitation17
Human Rights and Citizenship34
Maintenance13
Mobility and Traffic Safety55
Population14
Public Finances59
Public Management71
Safety and Violence17
Social Welfare9
Sport and Leisure5
Tourism10
Urban Development6
TOTAL: 18 Themes572
Table 3. Example of comparative analysis performed for each standardized indicator. Sources: adapted from [18,34].
ISO 37122:2019ObservaSampa Observatory
Definition20.1. Annual percentage of municipal budget spent on urban agriculture initiativesAnnual expenditure of the São Paulo City Government on the budget function agriculture (%)
Requirements and formulaUrban agriculture makes an important contribution to household food security, especially in times of crisis or food shortages. Locally produced food requires shorter supply chains and less transportation and refrigeration, and can thus help to conserve energy, water, and other resources.
FORMULA: The annual percentage of municipal budget spent on urban agriculture initiatives shall be calculated as the total amount of the city budget spent on urban agriculture initiatives for a given year (numerator) divided by the city’s total municipal budget for the same year (denominator). The result shall then be multiplied by 100 and expressed as the annual percentage of municipal budget spent on urban agriculture initiatives.
Expresses the proportion of municipal public expenditure with a budget function associated with Agriculture activities in a given year. The higher this indicator is, the more representative the expenditure associated with agriculture activities in the expenditure made by the São Paulo City Hall in that year.
FORMULA: Amount paid in the budget of the City of Sao Paulo on the budget function “Agriculture” (numerator) divided by budget paid in City of Sao Paulo (denominator), multiplied by 100 and expressed as a percentage.
Periodicity: annual
Territorial Unit: municipality
Historical Series: 2003 to actual
Table 4. Open Data Principles. Sources: adapted from [59,60].
Open Knowledge Foundation
Definition 2.1
Anyone can readily access, use, modify, and share for any purpose. The work must be in the public domain or provided under an open license. The work must be provided in open format.
The work must be provided as a whole and at no more than a reasonable one-time reproduction cost and should be downloadable via the Internet without charge.
The work must be provided in a form readily processable by a computer and where the individual elements of the work can be easily accessed and modified.
Brazilian legislation
(Open Government Data)
Public data represented in digital form.
Structured in open format.
Processable by machine referenced in the World Wide Web.
Made available under an open license which allows its free use, consumption, or crossing, limited to crediting the authorship or source.
Table 6. Results of the comparative analysis between city indicators reported in ObservaSampa and each standard (ISO 37120, ISO 37122, and ISO 37123), with the number of city indicators at each rating and standard theme. Legend: C—“Conforms”, PC—“Partially Conforms”, FTS—“Fail to Support”. Source: the authors.
CPCFTSNon-ExistentTOTAL
ISO 37120:201813251179128
ISO 37122:20195526880
ISO 37123:201901105768
TOTAL184113204276
6.5%14.9%4.7%73.9%100.0%
Publisher’s Note: MDPI stays neutral with regard to jurisdictional claims in published maps and institutional affiliations.

