Abstract
The benefits of energy flexibility measures have not yet been conclusively assessed from an ecological, economic, and social perspective. Until now, analysis has focused on the influence of changes in the energy system and the ecological and economic benefits of these. Therefore, the objective of this study was to perform a life cycle sustainability assessment of energy flexibility measures on the use case of a bivalent crucible melting furnace in comparison with a monovalent one for aluminum light metal die casting. The system boundary was based on a cradle-to-gate approach in Germany and includes the production of the necessary process technologies and energy infrastructure and the utilization phase of the crucible melting furnaces in non-ferrous metallurgy. The LCSA is performed for different economic and environmental scenarios over a 25-year lifetime to account for potential adjustments in the energy system and volatile energy prices. In summary, it can be said that over the entire service life, no complete ecological, economic, and social advantage of energy flexibility measures through a bivalent system can be demonstrated. Only a temporarily better life cycle sustainability performance of the bivalent furnace can be shown. All results must be considered with the caveat that the bivalent crucible melting furnace has not yet been investigated in actual operation and the calculations of the utilization phase are based on the monovalent crucible melting furnace. To further sharpen the results, more research is needed and the use of actual data for bivalent operation.
1. Introduction
According to the latest findings in the sixth assessment report of the intergovernmental panel on climate change (IPCC), the 1.5 °C target is likely to be reached as early as 2021 to 2040, with the global surface temperature estimated to increase by 0.27 °C to 0.63 °C per 1000 Gt CO2 emitted [1]. To reduce emissions, there are numerous efforts, such as the EU Green Deal, to encourage EU member states to significantly reduce their emissions in order to make Europe the first climate-neutral continent by 2050 [2]. Especially emission-intensive processes in industry are considered one of the key levers to reduce greenhouse gas emissions, as industry is the third largest greenhouse gas emitter worldwide, with a share of 19% in 2018 [3]. In Germany, industry directly follows the energy sector, with 24% of greenhouse gas emissions in 2020 [4]. In addition to a more sustainable design of production systems as an essential prerequisite for the future viability of the economy, e.g., through biointelligent production [5,6,7], the progressive transformation towards renewable energy sources and sustainable converter and storage technologies is also considered a key objective for reducing greenhouse gas emissions. However, the widespread implementation of such future technologies faces various difficulties such as the use of critical and scarce materials such as platinum, lithium, or iridium [8,9,10]. Furthermore, the increasing share of renewable energy sources, e.g., photovoltaic or wind power plants, has an impact on grid stability and increases the difficulty of maintaining it. Energy flexibility is the ability to adjust to the changes in the energy market quickly and with few financial expenses [11]. In order to ensure a smooth supply of electricity, there must be a constant balance between electricity demand and generation. Demand side management or load management controls the demand for electricity through the targeted switching on and off of loads based on direct or indirect market signals. There are several types of measures available for companies. These energy flexibility measures can be implemented in the short, medium, or long term and activated more or less quickly and flexibly. This also results in a new target dimension in manufacturing system design and operation [12]. Examples are the storing of energy, adapting the process start or shift time, or changing the energy carrier [13,14]. Machines or processes with the ability of the latter are called bivalent or hybrid systems [15]. Hybrid and bivalent systems can face this challenge by changing the energy carrier. Furthermore, the ability to change the energy carrier can reduce the risk of choosing the more expensive energy carrier in the long term and reduce energy costs during the operating period [16,17].
One of the energy-intensive processes with high potential for energy flexibility and bivalent or hybrid systems is light metal die casting. Die casting is one of the permanent mold casting processes in which a melt is injected into a metallic mold under high pressure and at high speed. Depending on the process, product, alloy, and quality, the temperature of the melt is between 640 and 680 °C. The melting furnace has a high proportion in the total energy consumption of the die-casting process. In principle, such a furnace can be operated electrically or fuel-heated [18]. With a bivalent design, a dynamic switch between the energy sources electricity and natural gas during operation becomes possible, yielding a high flexibility potential [19]. A change depends on the energy prices and is possible within five minutes. In the technical implementation of a bivalent furnace, electric resistance heating elements can realize the electrical operation mode and a cold air burner the fuel-heated one. So far, the advantages of energy flexibility measures have not been conclusively clarified from an ecological, economic, and social point of view. To date, analysis has focused only on the impacts of changes in the energy system and the environmental and economic benefits of those changes [20,21]. A social sustainability assessment or a holistic sustainability assessment of energy flexibility measures has so far been lacking. For this reason, a life cycle sustainability assessment (LCSA) was carried out in this paper using the example of an innovative bivalent crucible melting furnace and the associated comparison with a monovalent electric crucible melting furnace according to the state of the art. This involves systematically investigating the ecological, economic, and social sustainability of energy flexibility measures in different economic and ecological scenarios in order to ensure that the analysis is as complete as possible. The following two questions are answered:
- How does the bivalent crucible furnace compare with the state of the art in terms of ecological, economic, and social impacts?
- How far do changes in the energy system and energy prices influence the ecological and economic evaluation of the bivalent furnace?
2. Materials and Methods
A comparative LCSA encompasses environmental, economic, and social aspects and provides a more holistic understanding of the sustainability of products and processes, leading to better support for decision makers [22,23,24]. The LCSA is performed using life cycle assessment (LCA), life cycle costing (LCC), and, in this case, a variation of social life cycle assessment (SLCA). This method is divided into four phases: (1) definition of goal and scope, (2) preparation of the life cycle inventory (LCI), (3) impact assessment, and (4) interpretation [25,26]. The system boundaries and goal and scope are described in more detail below.
2.1. Goal and Scope
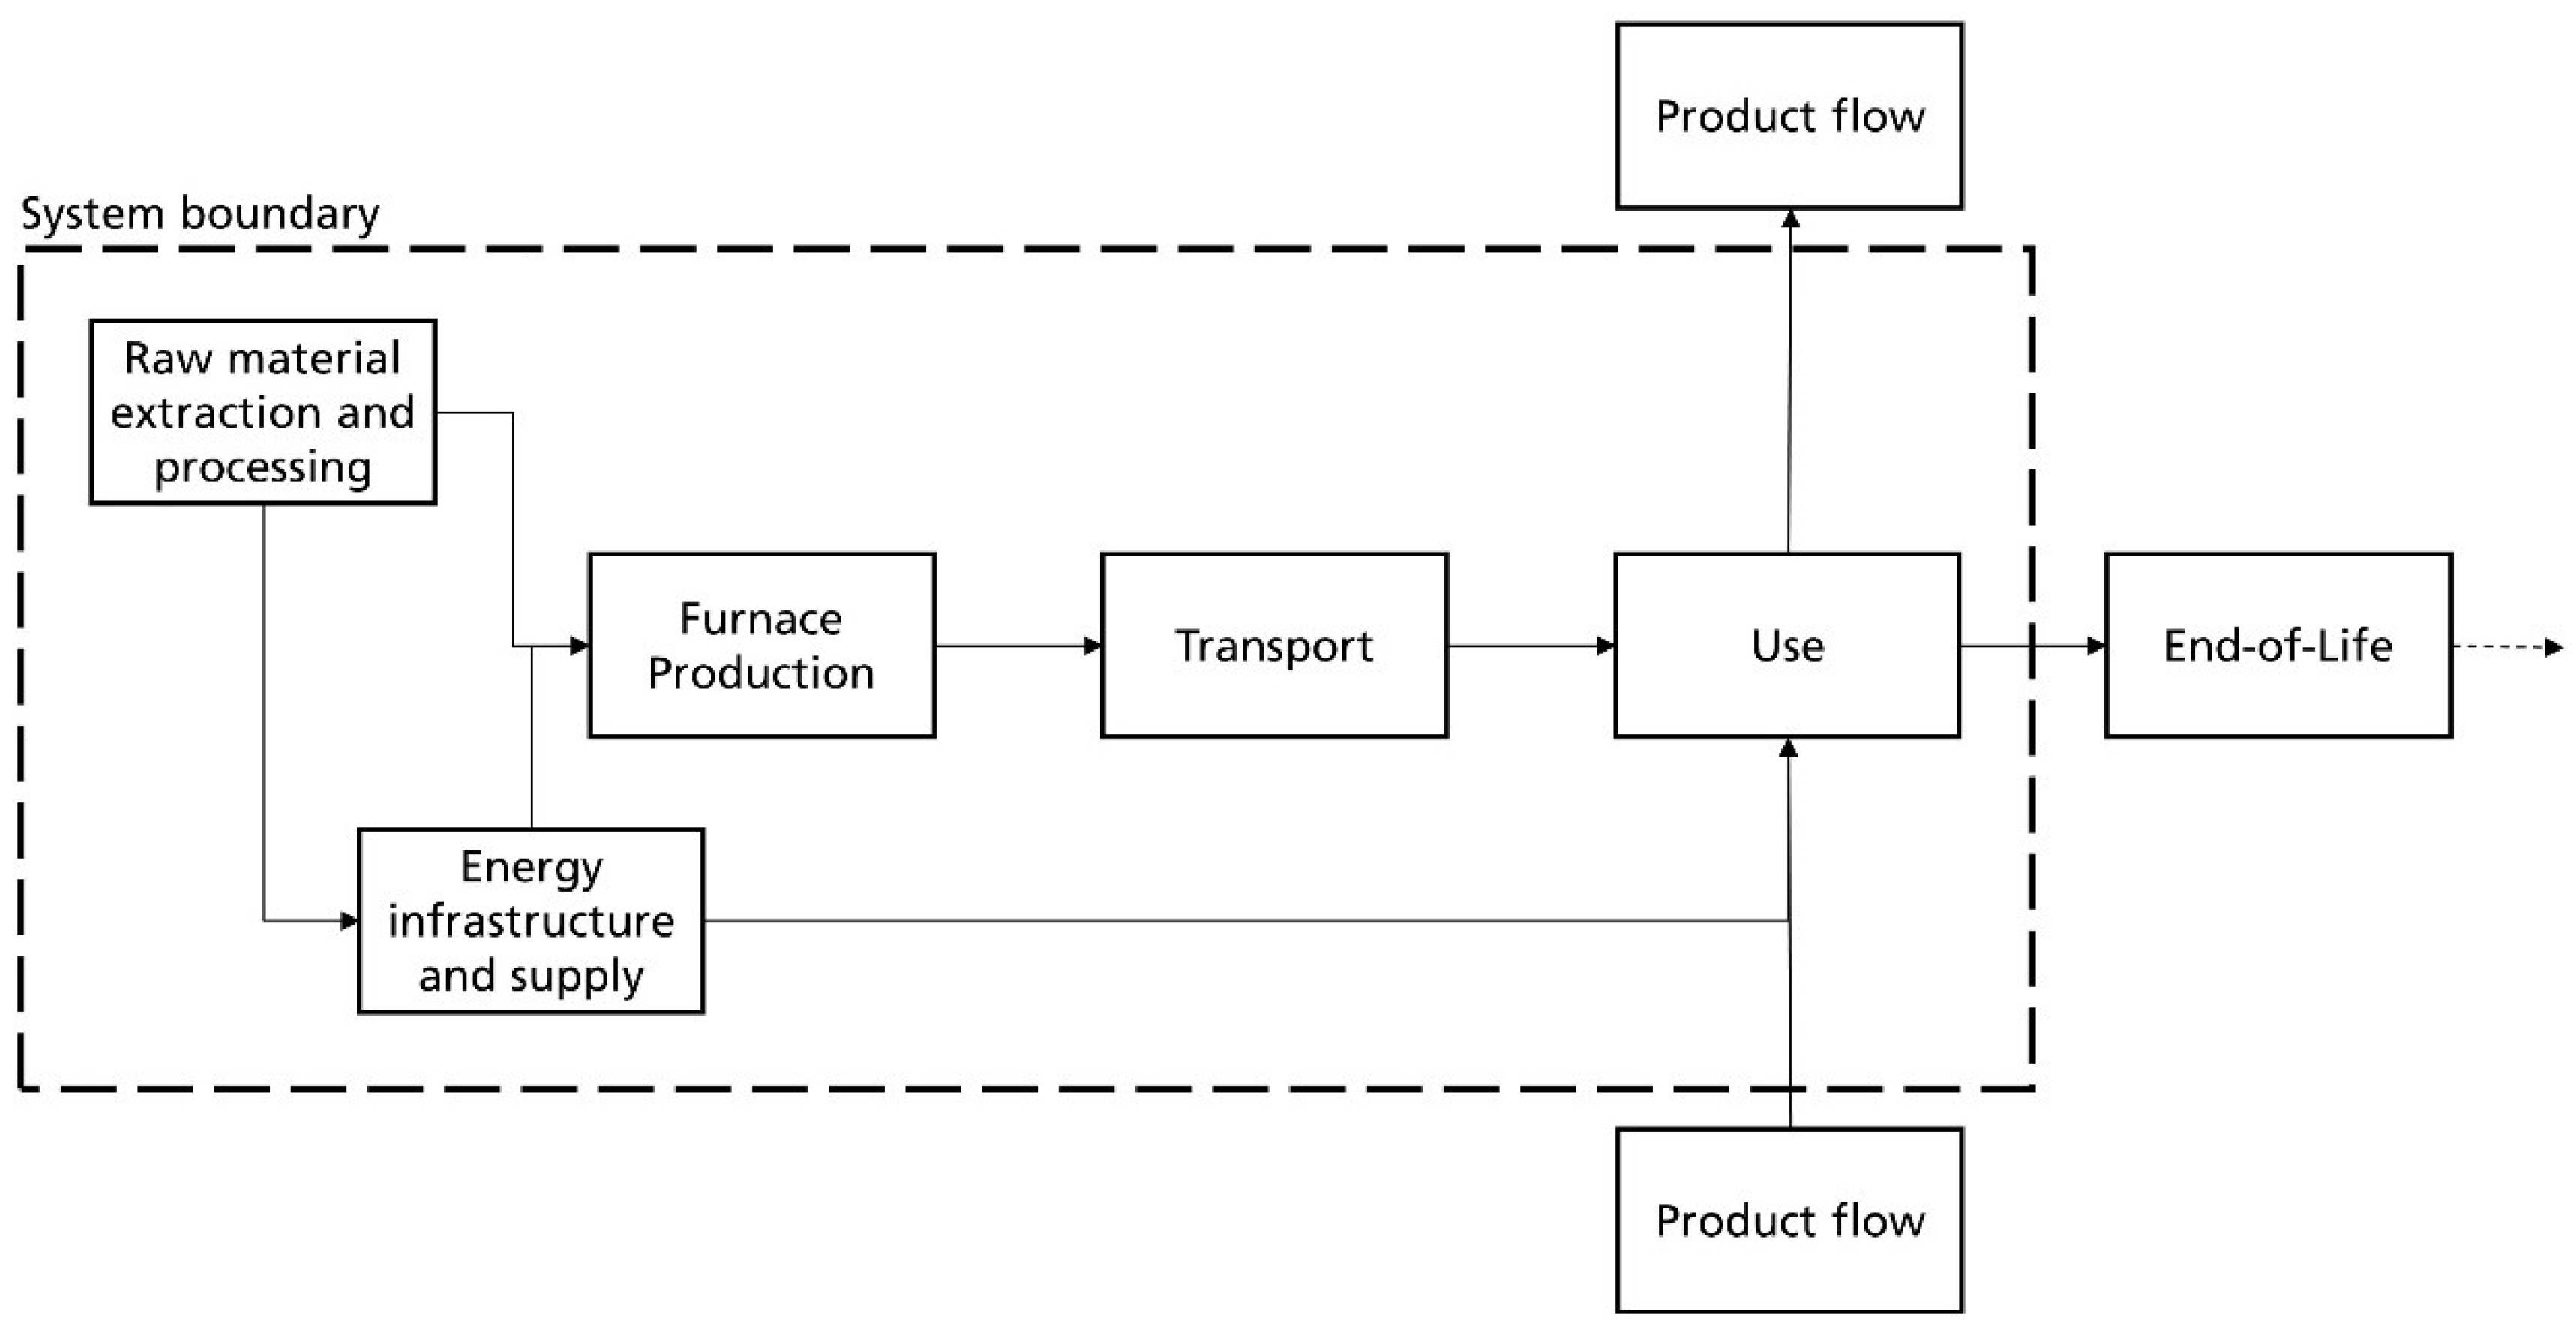
This study aimed to provide a well-founded basis for decision-making regarding the sustainability performance of the integration of energy flexibility measures in the aluminum die-casting industry based on the use case of a crucible melting. For this purpose, holistic comparison of the state of the art, i.e., an exclusively electrically heated (monovalent) crucible melting furnace, with a bivalent (electricity and natural gas) crucible melting furnace was conducted. The system boundary follows a cradle-to-gate approach and includes the production of the necessary process technologies and the energy infrastructure and the use phase. The geographic boundary was defined as the federal state of Baden-Württemberg in Germany. In addition, the transport of the crucible melting furnace from the manufacturer to the production site was considered. The end of life of the two technologies and the melting material for the light metal die casting, including the die-casting process, were not considered, as it was expected that there are no differences between the two furnaces.
Figure 1 provides a detailed overview of the system boundaries. In the ecological balancing of the technologies, only the utilized materials were regarded. The production of the furnaces could only be treated superficially since the respective processes were not sufficiently known and primary data (e.g., for energy demand) could not be obtained. The use phase was mapped using various ecological and economic scenarios to depict the future characteristics of the German electricity mix and potential trends in energy prices.

Figure 1.
System boundaries of the LCSA.
A suitable functional unit is key for a consistent comparison between different product systems. Therefore, the energy demand required to melt 60 t of AZ 91 (chemical composition: Mg-Al-Zn [27]) alloy was defined as the functional unit. Primary data concerning the energy demand of a monovalent crucible melting furnace and the materials used in the designs of the melting furnaces were provided first-hand by industrial partners.
For the LCA, environmental data from the LCI database ecoinvent v 3.8 under the allocation, cut off by the classification approach and the literature [28,29], was used. The assessment was carried out using umberto LCA+ life cycle assessment software. To reflect the material and production costs for the monovalent and bivalent furnace in the LCC, the purchase price per furnace was obtained. The annual energy prices and possible price developments were acquired from the literature. For SLCA, no distinction was made between the two furnaces. The database used for this purpose was the Social Hotspot Database [30].
The target audience includes researchers from academia, environmental and socioeconomic analysts, decision makers from the industry, and others interested in the sustainability of energy flexibility measures in energy-intensive industrial processes.
2.2. Life Cycle Sustainability Assessment
In the following sections, the three pillars of the LCSA are described separately. Each section includes an LCI. Furthermore, assumptions and constraints are mentioned, and the used life cycle impact assessment (LCIA) methodology is described.
2.2.1. Life Cycle Assessment
Life cycle assessment (LCA) is a comprehensive and internationally recognized methodology for assessing the potential environmental impact of products or processes (i.e., a good or service) over its (entire) life cycle. It is standardized by ISO standards 14040 and ISO 14044, and for the carbon footprint of products by ISO standard 14067 [25,26,31]. The objective of the present comparative LCA was to evaluate the environmental performance of a bivalent melting furnace compared to the state-of-the-art technology from a cradle-to-gate perspective. In addition to a uniform functional unit, the same system boundary and the same years were used. In addition, the furnaces were similar in size and the capacity of the crucibles was also the same.
Due to the complexity of the monovalent electric and bivalent crucible furnace, the assessment was largely based on their material compositions. This applies especially to the specific insulation materials of the combustion chamber of the bivalent furnace. The assessment was based on the chemical composition, since no primary and secondary data were available.
Within the system boundary, the connection of the furnace to the energy infrastructure in a production hall is also taken into account. This was considered according to the on-site conditions at an industrial partner. However, the environmental impacts associated with the installation of the furnaces were not included. Table 1 contains all the data required for the evaluation of the mono- and bivalent furnace but without reference to the functional unit. Due to the high number of components, the ones with a weight <0.1 kg were not included in the evaluation, following a cut-off criterion. Primary data was collected with an industry partner while secondary data was taken from the literature.

Table 1.
Life cycle inventory for the assessment of the examined melting furnaces.
Concerning the use phase of the furnaces, two scenarios were defined to examine future changes in the German energy system and the associated adjustments in energy prices. These were based on the expansion targets for renewable energies set by the German government.
Scenario 1 (S1) assumes a nearly greenhouse-neutral electricity mix by 2050. For this, an approximation of the possible German electricity mix between the years 2020 was made by a linear regression until the year 2050, based on the forecast of Kemmler et al. [32]. Political goals such as the phase-out of coal and nuclear power in Germany or the expansion targets for renewable energies in the EU were not considered.
Scenario 2 (S2) is also based on the forecast by Kemmler et al. [32] but assumes an almost greenhouse-neutral electricity mix by 2035 following the German government’s package of emergency energy measures in 2022 [33]. For this purpose, the forecasted electricity mix in the year 2050 was transferred to the year 2035 and the development was estimated using linear regression. Between the years 2035 and 2045, the electricity mix was assumed to be constant. Thus, political goals such as the coal phase-out were taken into account in this scenario. For both scenarios, no transformation and transport losses within the power system were considered [34]. The detailed LCI of the respective annual approximation of the electricity mix can be found in the Supplementary Materials S1.
The ecological and economic implications were examined over an assumed lifetime of 25 years. Consequently, the period considered ranges from 2020 to 2045. For 2020, the German electricity mix according to the Arbeitsgemeinschaft Energiebilanzen e.V. [35] was applied. For an accurate representation of the described development of the electricity mix, the energy carriers and converters were specifically modeled in umberto LCA+ for each year under consideration. The data sets used to model the electricity mix per energy source can be found in the Supplementary Materials S1.
To illustrate the bivalent and monovalent operation of the crucible melting furnaces, the shares of electricity and natural gas demand over the entire lifetime were classified according to Table 2. The scenarios were named according to the furnace (monovalent (M) or bivalent (B)) and the energy source shares of electricity and natural gas. The designation is, e.g., B 75/25, which corresponds to a bivalent operation with 75% electricity and 25% natural gas. The energy demand of 86,060 kWh per FU in the use phase was determined on the basis of the actual industrial operation of a monovalent electric crucible melting furnace. Since no actual data for the bivalent furnace was available, the same energy demand for melting the FU was assumed. The mentioned energy demand includes downtimes due to production breaks or mold changes, heating-up processes, shift changes, start-up and shutdown processes, and preheating processes. The energy efficiency of the furnaces was based on expert interviews and is 0.4 for electric operation and 0.25 for gas-fired operation. The conversion of (electric) work from kWh to, respectively, required Nm3 of natural gas was calculated using the lower heating value (10.28 kWh/Nm3) of natural gas in the Baden-Württemberg natural gas supply system in 2019 [36].
Table 2.
Data sets used by energy source for modeling the electricity mix.
Various assumptions were made in the different phases of the LCA. The concept of the heat exchanger of the bivalent furnace had not yet been completed in detail. According to feedback from the industry partner, the design of the bivalent furnace assumes a heat exchanger with a weight of 1000 kg. For the assessment, the material fractions from the publication by Cerrillo [29] were used. In the utilization phase, only the energy consumption is addressed, i.e., the required auxiliary inputs (e.g., SO2) and processes in work preparation (e.g., preheating of the alloying constituents) were not taken into account, as no valid statement could be made for the bivalent melting furnace. In addition, the maintenance and servicing of the furnaces were not considered, as consulted experts estimated the respective effort to be comparable to the monovalent furnace. The modeling and assessment of the combustion of natural gas was carried out for the climate gases CO2, N2O, CH4, fluorinated and polyfluorinated hydrocarbons, and SF6 as defined in the Kyoto Protocol [37]. In addition, VOC and CO emissions were modeled. The emission factors for these were obtained from the environmental protection agency [38] and Gomez and Watterson [39] and do not refer specifically to the state of Baden-Württemberg in Germany. ReCiPe 2008 was used for the LCIA [40].
2.2.2. Life Cycle Costing
Life cycle costing (LCC) is a method that summarizes all costs associated with the life cycle of a product (or service) that are contributed directly by one or more of the actors involved in the product life cycle (e.g., supplier, manufacturer, user/consumer, and end-of-life actor) [41].
As with the LCA, the primary data for the LCC was collected from an industrial partner while the secondary data was mainly from the literature. The investment and acquisition costs of the monovalent and bivalent furnaces amounted to €50,000 and €75,000, respectively. Personnel, maintenance, insurance, and development costs were not considered, as they can be assumed to be equal. Material and production costs are covered by the purchase price of the furnaces.
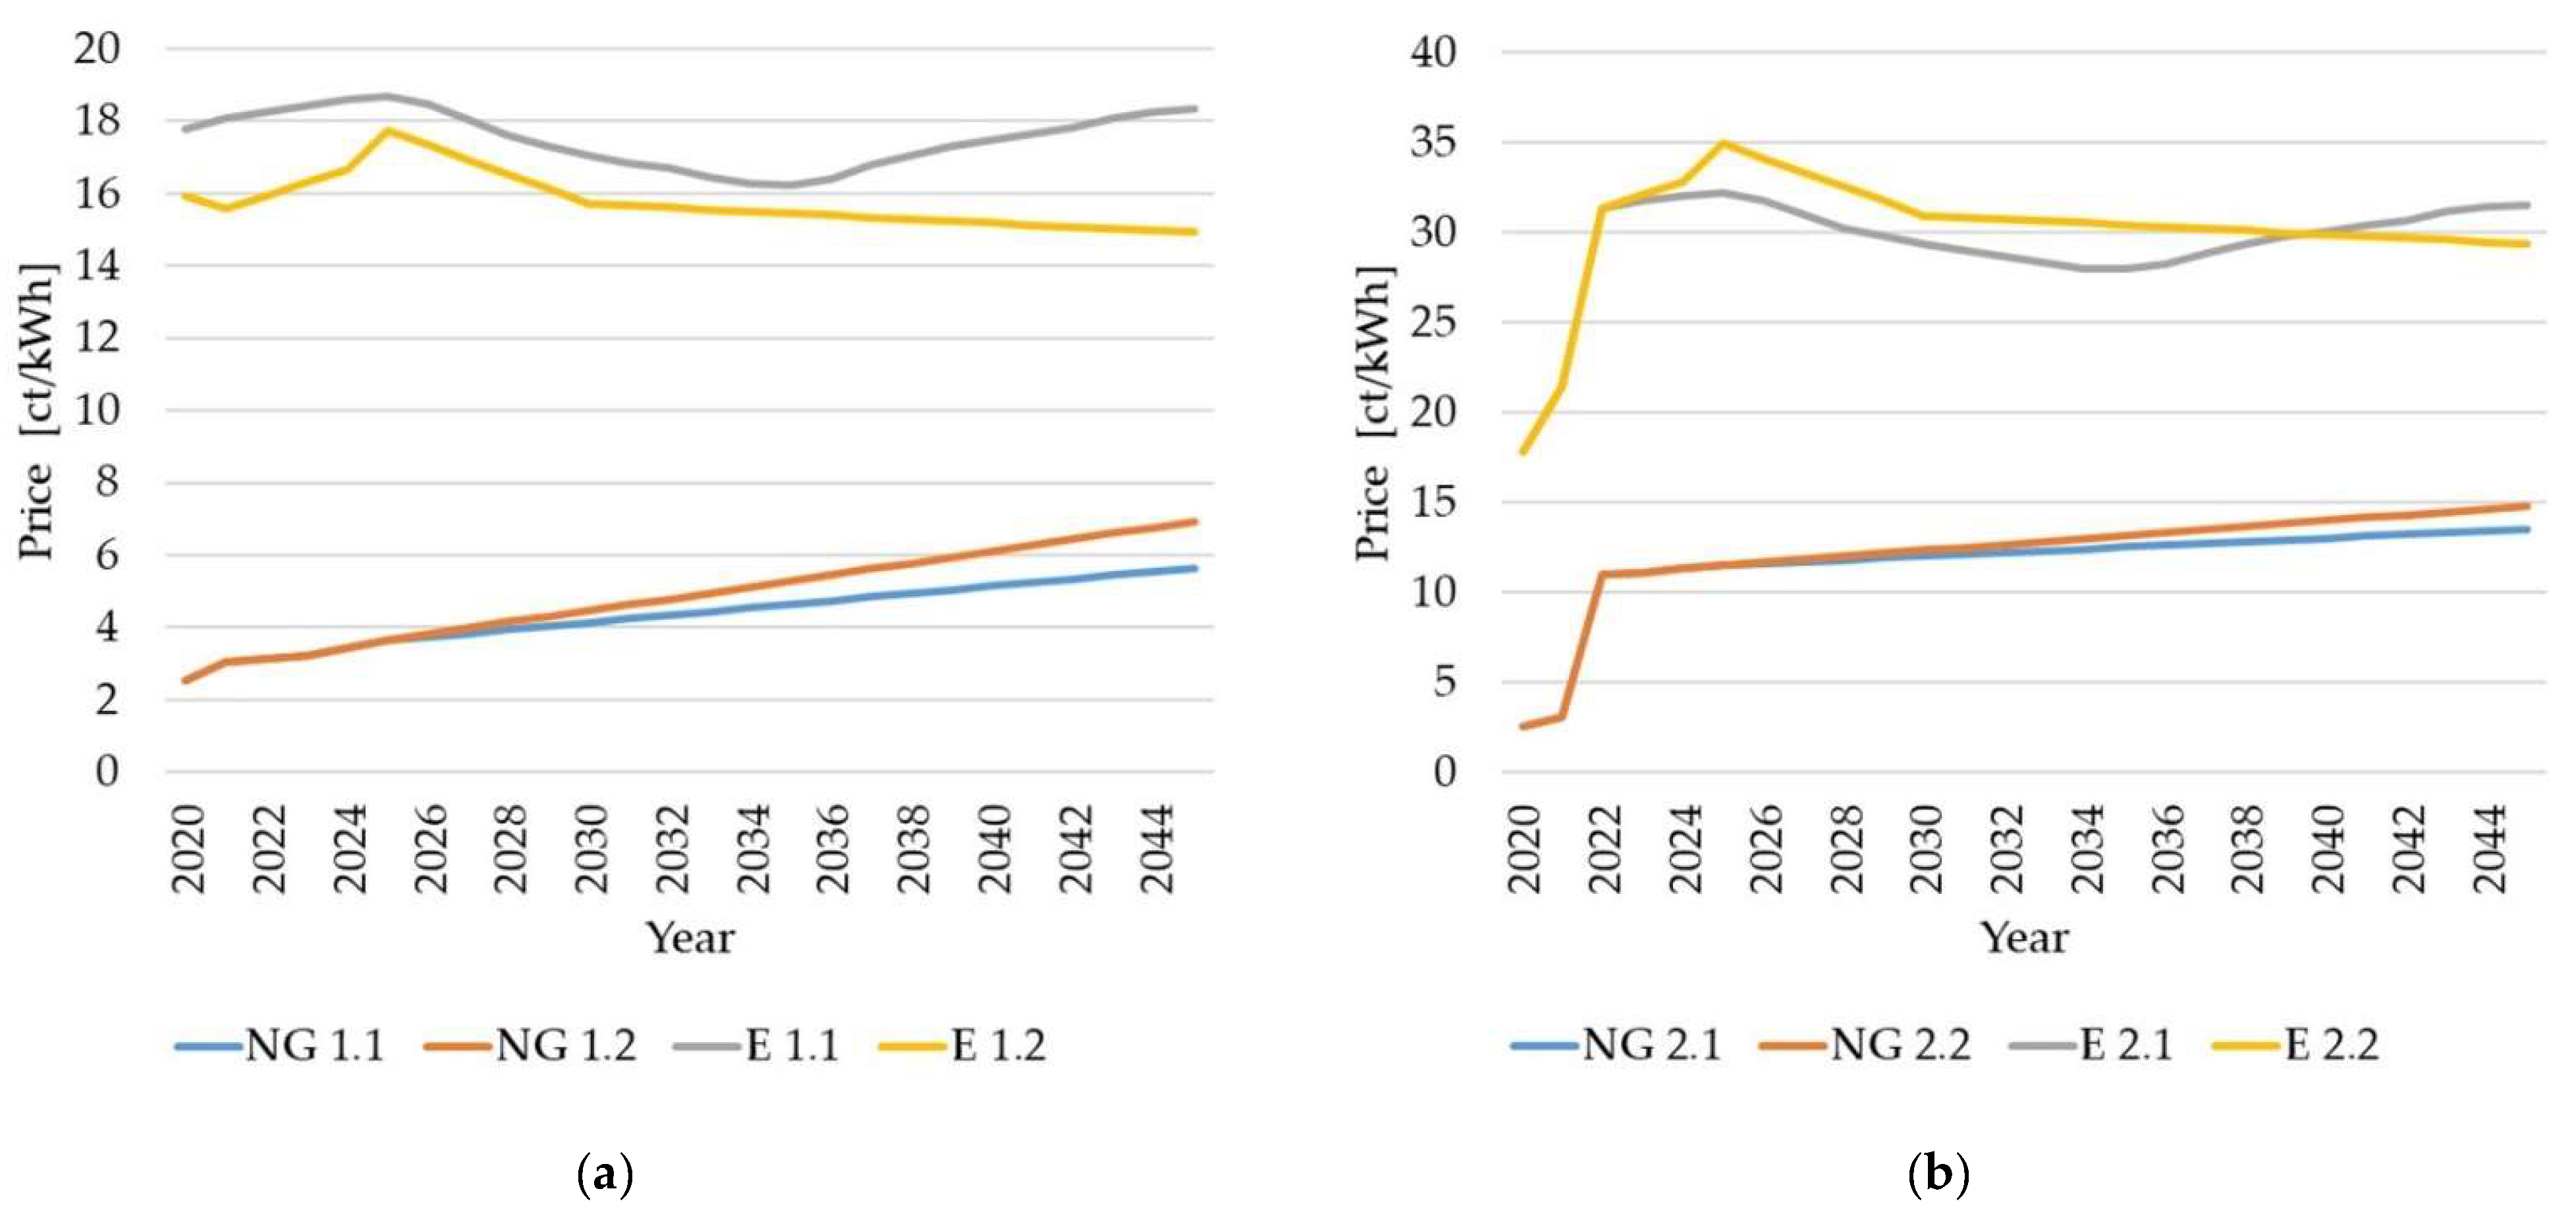
The focus of this LCC was primarily on analyzing the effects of possible price developments for the price of electricity and natural gas. In order to represent the use phase of the bivalent and electric monovalent furnace, two scenarios, each with two possible developments of the electricity price (E) and the natural gas price (NG), were examined. Price scenario 1 considers current energy prices. Price scenario 2 describes a possible energy price development in the event of an electricity shortage or natural gas availability. The possible developments in electricity prices were taken from the “reference scenario 2” by Kemmler et al. [32] and from the scenario from Knaut et al. [42]. The natural gas prices were calculated via a linear regression from two development paths of the national emissions trading scheme (nEHS) according to Wagner et al. [43]. No further price fluctuations due to market mechanisms were taken into account. A natural gas price of 2.34 ct/kWh in 2020 and an emission factor for the combustion of natural gas of 0.0201 t/kWh were assumed as a starting point [44]. This increased to 10.39 ct/kWh in price scenario 2 from 2022, as a lower availability of natural gas was assumed from here onwards due to supply bottlenecks, e.g., as a result of the situation in Ukraine and Russia [45]. For the forecast of electricity prices in price scenario 2, the percentage electricity price fluctuations from the scenarios described by [32,42] were transferred to the sharply increased electricity prices in 2022 onwards (31.36 ct/kWh) [46]. Figure 2 shows the scenarios and their underlying pricing.
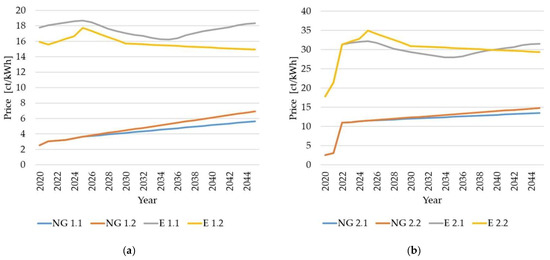
Figure 2.
(a) Energy price progression for price scenario 1 and development path 1.1 and 1.2 for NG and E [32,42,43,47]; (b) energy price progression for price scenario 2 and development path 2.1 and 2.2 for NG and E [45,46].
To calculate the life cycle costs of a bivalent operation, each price development of the energy carriers per price scenario was combined with the energy demands from Table 2. This denotation is based on the energy carriers, the number of the price scenarios, the number of the development path, and the energy carrier shares. For example, natural gas (NG) and electricity (E) in price scenario 1, for development path 1, in the scenario 50% natural gas 50% electricity results in NG 1.1. + E1.1 50/50. This results in four possible combinations of the energy prices per scenario. The respective definition of the scenarios NG 1.1 + E 1.1 to NG 2.2 + E 2.2 is shown in the Supplementary Materials S1.
During the period from 2020 to 2045, the costs were discounted to 2020 using an internal rate of return of 2% p.a. This ensured the comparability of the results in the LCC at the actual time. The assumptions and estimates introduced for the LCA also apply to the LCC (e.g., only consideration of energy consumption, no maintenance).
2.2.3. Social Life Cycle Assessment
Social life cycle assessment (SLCA) is a social impact assessment technique that aims to evaluate the social and socio-economic impacts of products/services during their life cycle [48]. The social pillar of sustainability was assessed here using 18 indicators. The set of indicators applied in each case for a category provides a comprehensive overview of potential social problems in the upstream supply chain. The assessment followed the methodology described by Kolotzek et al. [49] and the applied indicators for a “social risk” in material criticality analysis. Hence, no classical SLCA was performed in this case but a variation of it. The categories and indicators considered for the dimension “social risk” are listed in Table 3. For a brief description of each used indicator, and detailed information on the selection process of the dimensions and indicators and other methodological aspects, please see the publication by Kolotzek et al. [49].
Table 3.
S-LCA indicators and their weighting according to Kolotzek et al. [49].
The evaluation was carried out for the mineral and metallic raw materials required for the construction of the two crucible melting furnaces with a weight above 10 kg based on the LCI of the LCA. The cut-off criterion was significantly increased compared to the LCA to include only the most intensively used raw materials: iron, chromium, aluminum, nickel, magnesium, sodium chloride, titanium, copper, and sulfur. The social impact assessment was based on the Social Hotspots Database (SHDB) [30]. The SHDB contains country-specific indicators for numerous raw materials, which means that the respective mining countries with the mined volumes, resources, and reserves must be included in the assessment for each raw material. This information was obtained from the USGS Mineral Yearbook [50]. The underlying base year of the identified data for each indicator was 2019.
The result of the used social impact assessment methodology was not considered over the entire lifetime, as no changes were made to the technical design of the furnaces and infrastructure and the SHDB was adjusted every year. This also applies to possible adjustments due to repairs and maintenance measures.
3. Results
The following section shows the absolute results for the LCA, the LCC, and the SLCA per considered scenario to compare the bivalent crucible furnace with the monovalent electric one.
3.1. Life Cycle Assessment Results
To assess the environmental impacts, the midpoints climate change (GWP), fossil depletion (FDP), freshwater eutrophication (FEP), human toxicity (HTPinf), marine eutrophication (MEP), metal depletion (MDP), ozone depletion (MDP), and terrestrial acidification (TAP) were analyzed. In addition, the endpoints ecosystem quality, total (EQ, total), human health, total (HH, total), and resources, total (R, total) were taken into account.
Table 4 compares the environmental impact of the production and transport of the bivalent crucible melting furnace with the monovalent one. The production of the bivalent furnace shows a significantly higher result in every impact category. The reasons are complex. In addition to the higher mass and more versatile insulation materials, the results for the industrial gas burner and the associated heat exchanger and the other additional peripherals are significant. The impact of transport from the manufacturer to the place of use is minimal. The contribution of transport to the environmental impact of the bivalent furnace is below or just slightly above 1% for each midpoint. For the monovalent furnace, the contribution is similar for FEP and MDP. The contribution to total ODP is particularly high at 10.03% (2.14 × 10⁻⁵ kg CFC-11 eq.) and to total FDP at 22.11 kg oil eq. (4.90%). In the following, the evaluation focuses on the GWP over the entire lifetime. Further detailed evaluations concerning the other considered impact categories are available in the Supplementary Materials S2.
Table 4.
Environmental impact of the manufacture and transport of a monovalent and bivalent melting furnace.
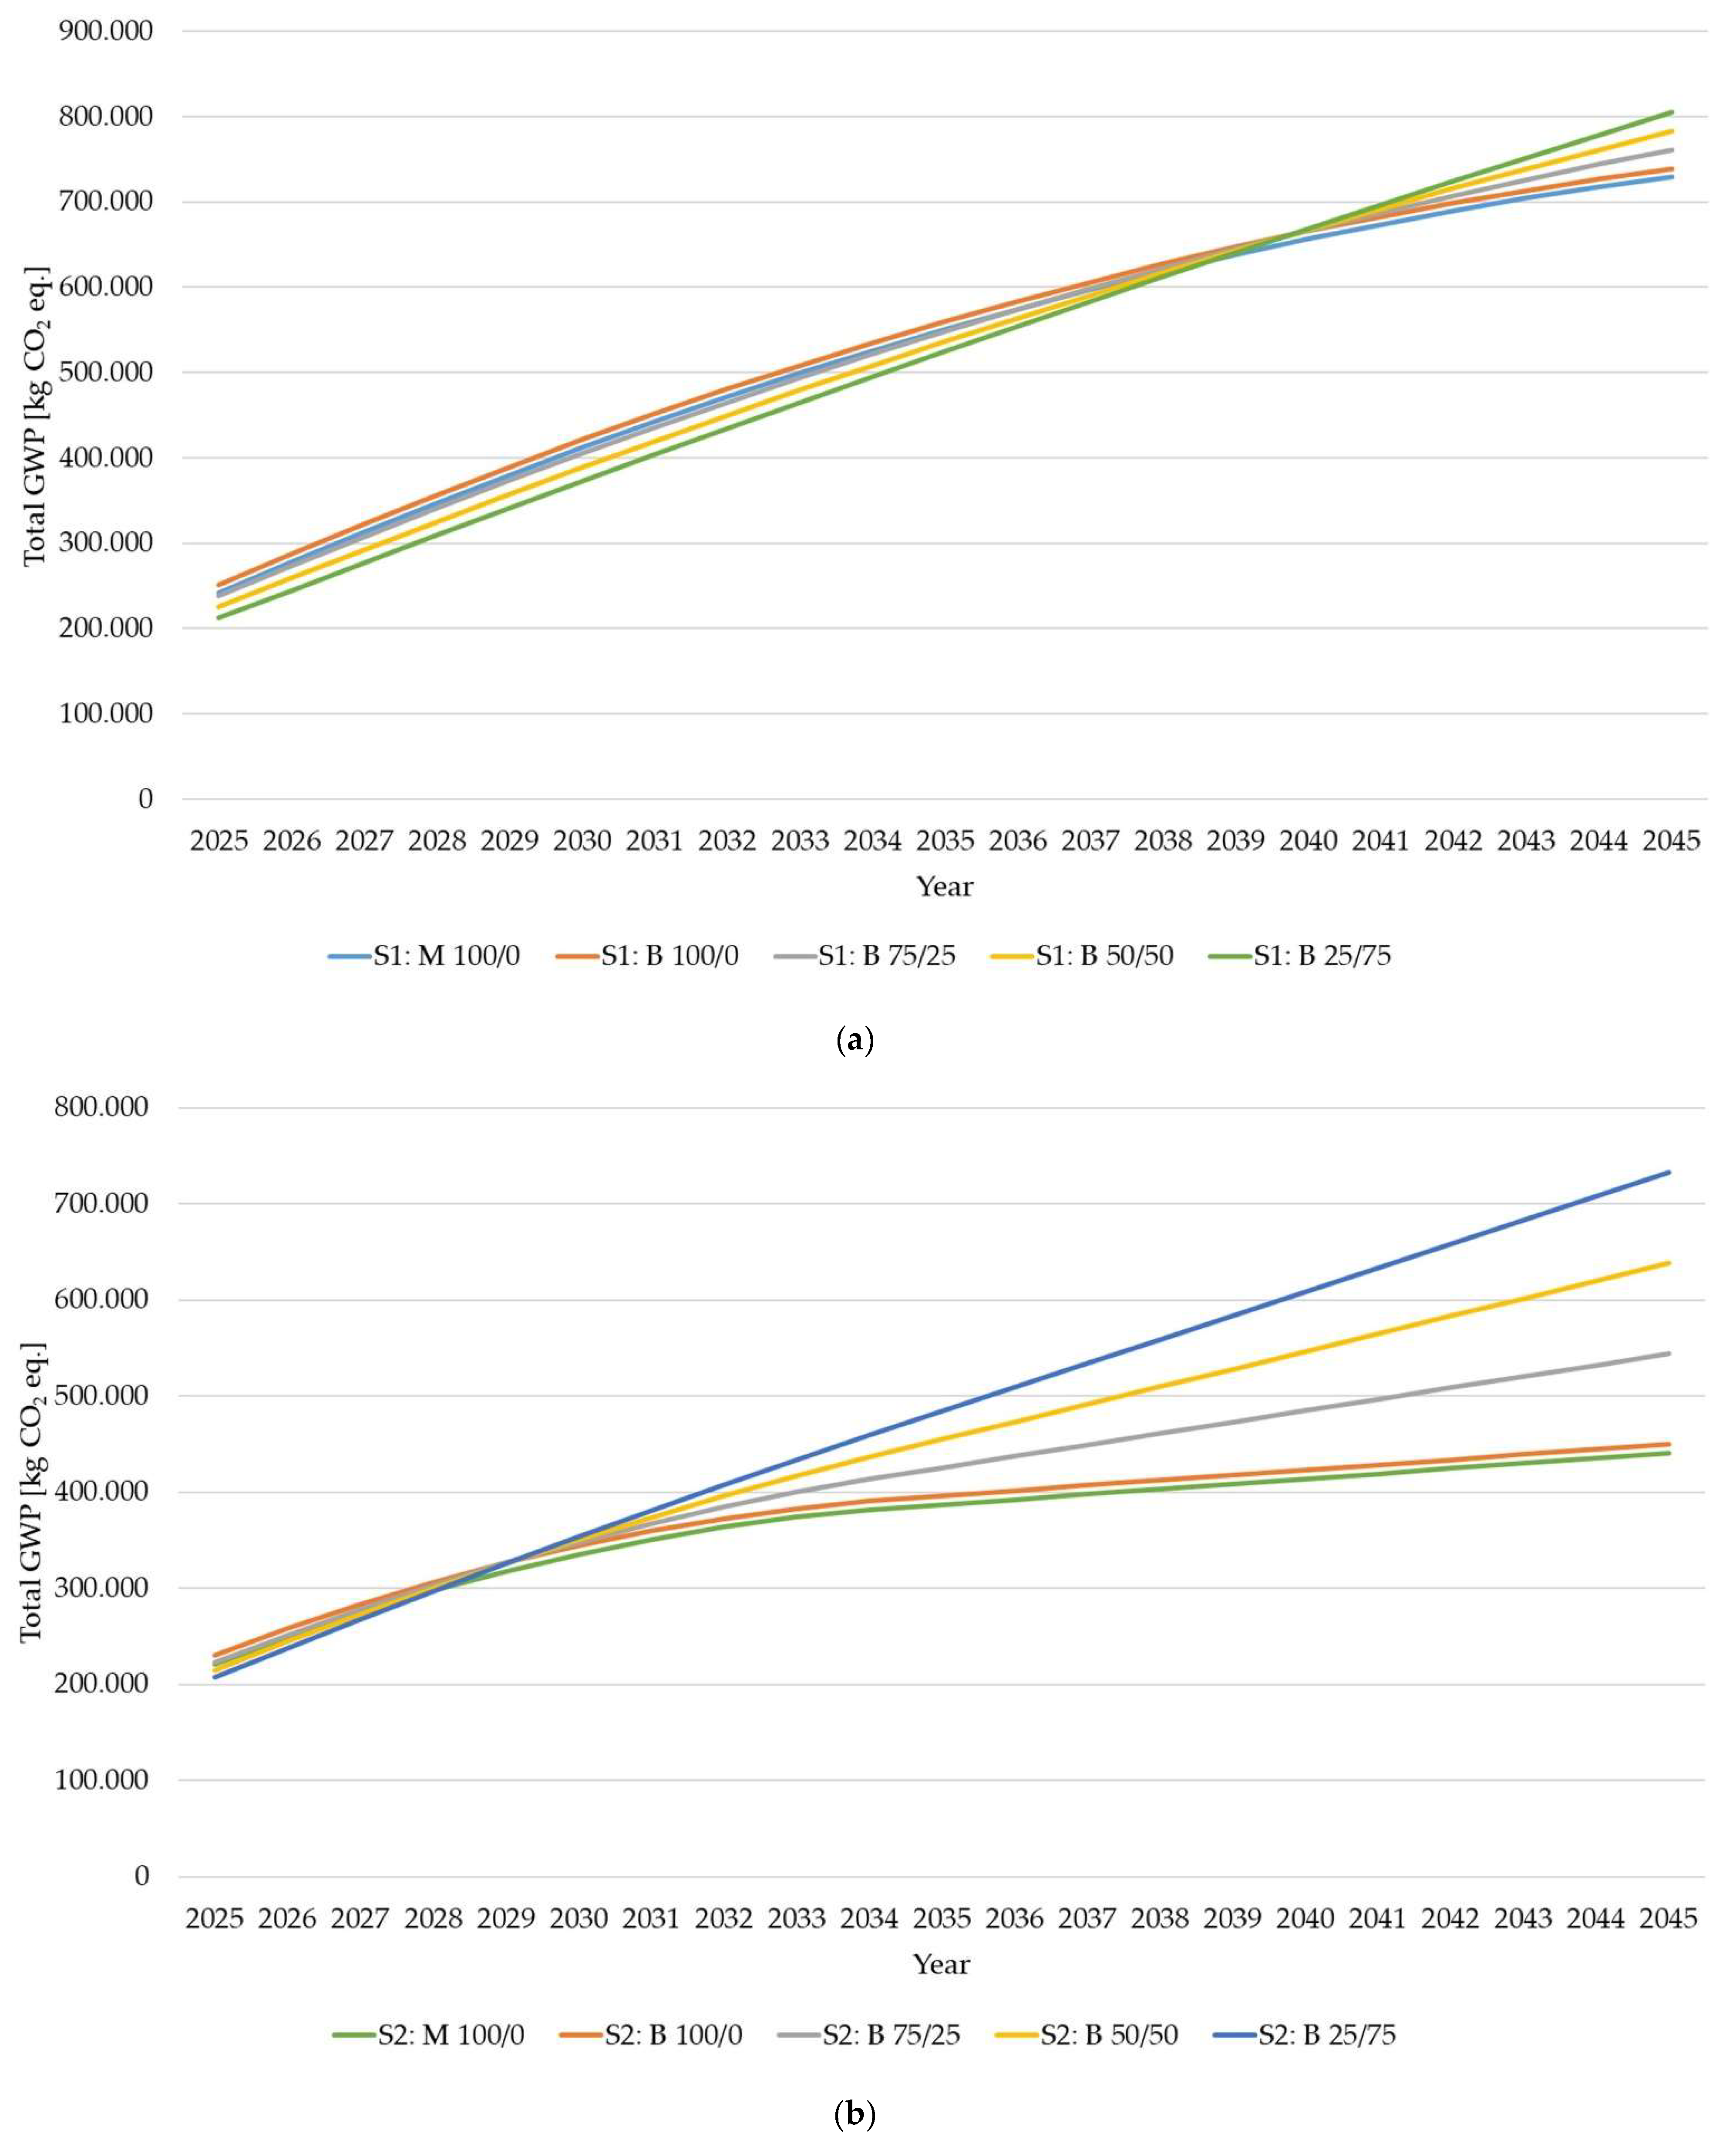
Except for the MDP category, at least 91% of the environmental impacts per impact category originate from the use phase. For GWP, the impact accounts for 98%. This is due to the expected lifetime of the melting furnaces of 25 years. Figure 3 shows the sum of the GWP of the monovalent and bivalent crucible melting furnace within the considered system boundary between the years 2025 and 2040 for scenario 1 (Figure 3a) compared to S2 (Figure 3b). By 2038, the sum of GWP in S1 of bivalent operation is lower than that of a monovalent electric one. Especially in the case of increased energy supply via natural gas, the bivalent furnace performs significantly better. The reason for this is the significantly higher emission intensity of the electricity mix compared to burning natural gas at the beginning of the lifetime (factor electricity in 2020: 0.487 g/kWh vs. factor natural gas in 2020: 0.201 g/kWh) and the slower expansion of the renewable energy share in S1. When aggregating kg CO2 eq. emissions over the entire lifetime, monovalent operation is shown to be beneficial. When considering a rapid expansion of renewable energy by 2035 in scenario 2, monovalent electric operation is already associated with a decreased sum of kg CO2 eq. emissions from 2028 onwards. It is also particularly evident that an almost greenhouse-neutral electricity mix in 2035 has a significant impact on the environmental impacts of the melting furnaces.
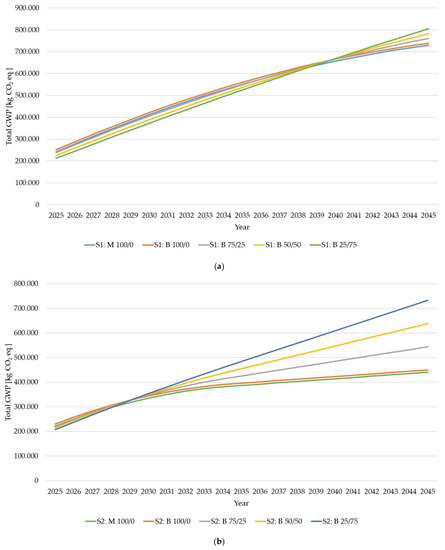
Figure 3.
(a) Total GWP from 2025 to 2040 in S1; (b) total GWP from 2025 to 2040 in S2.
For the impact categories FDP and ODP, a similar behavior can be observed across both scenarios. As the share of natural gas increases, the use of fossil resources increases and the potential for ozone depletion. The opposite is true for FEP, HTP, MEP, MDP, and TAP. These are reduced as the natural gas share increases. This is also due to the higher renewable energy share in the assumed electricity mix. Table 5 summarizes the environmental impacts per scenario, furnace, and shares of the energy carriers. The evaluation per year of the other environmental impacts is shown in the Supplementary Materials S2.
Table 5.
LCA results per scenario per energy share.
3.2. Life Cycle Costing Results
As described in Section 2.2.2., two price scenarios with four characteristics each were investigated for the bivalent furnace and two for the monovalent electric furnace. The considered temporal horizon ranges from 2020 to 2045. The results are presented for the total of the discounted energy and investment costs. Due to the large number of scenarios, only selected ones are presented here in detail, with reference to the respective optima in the evaluation. A detailed evaluation of the results per scenario can be found in the Supplementary Materials S2.
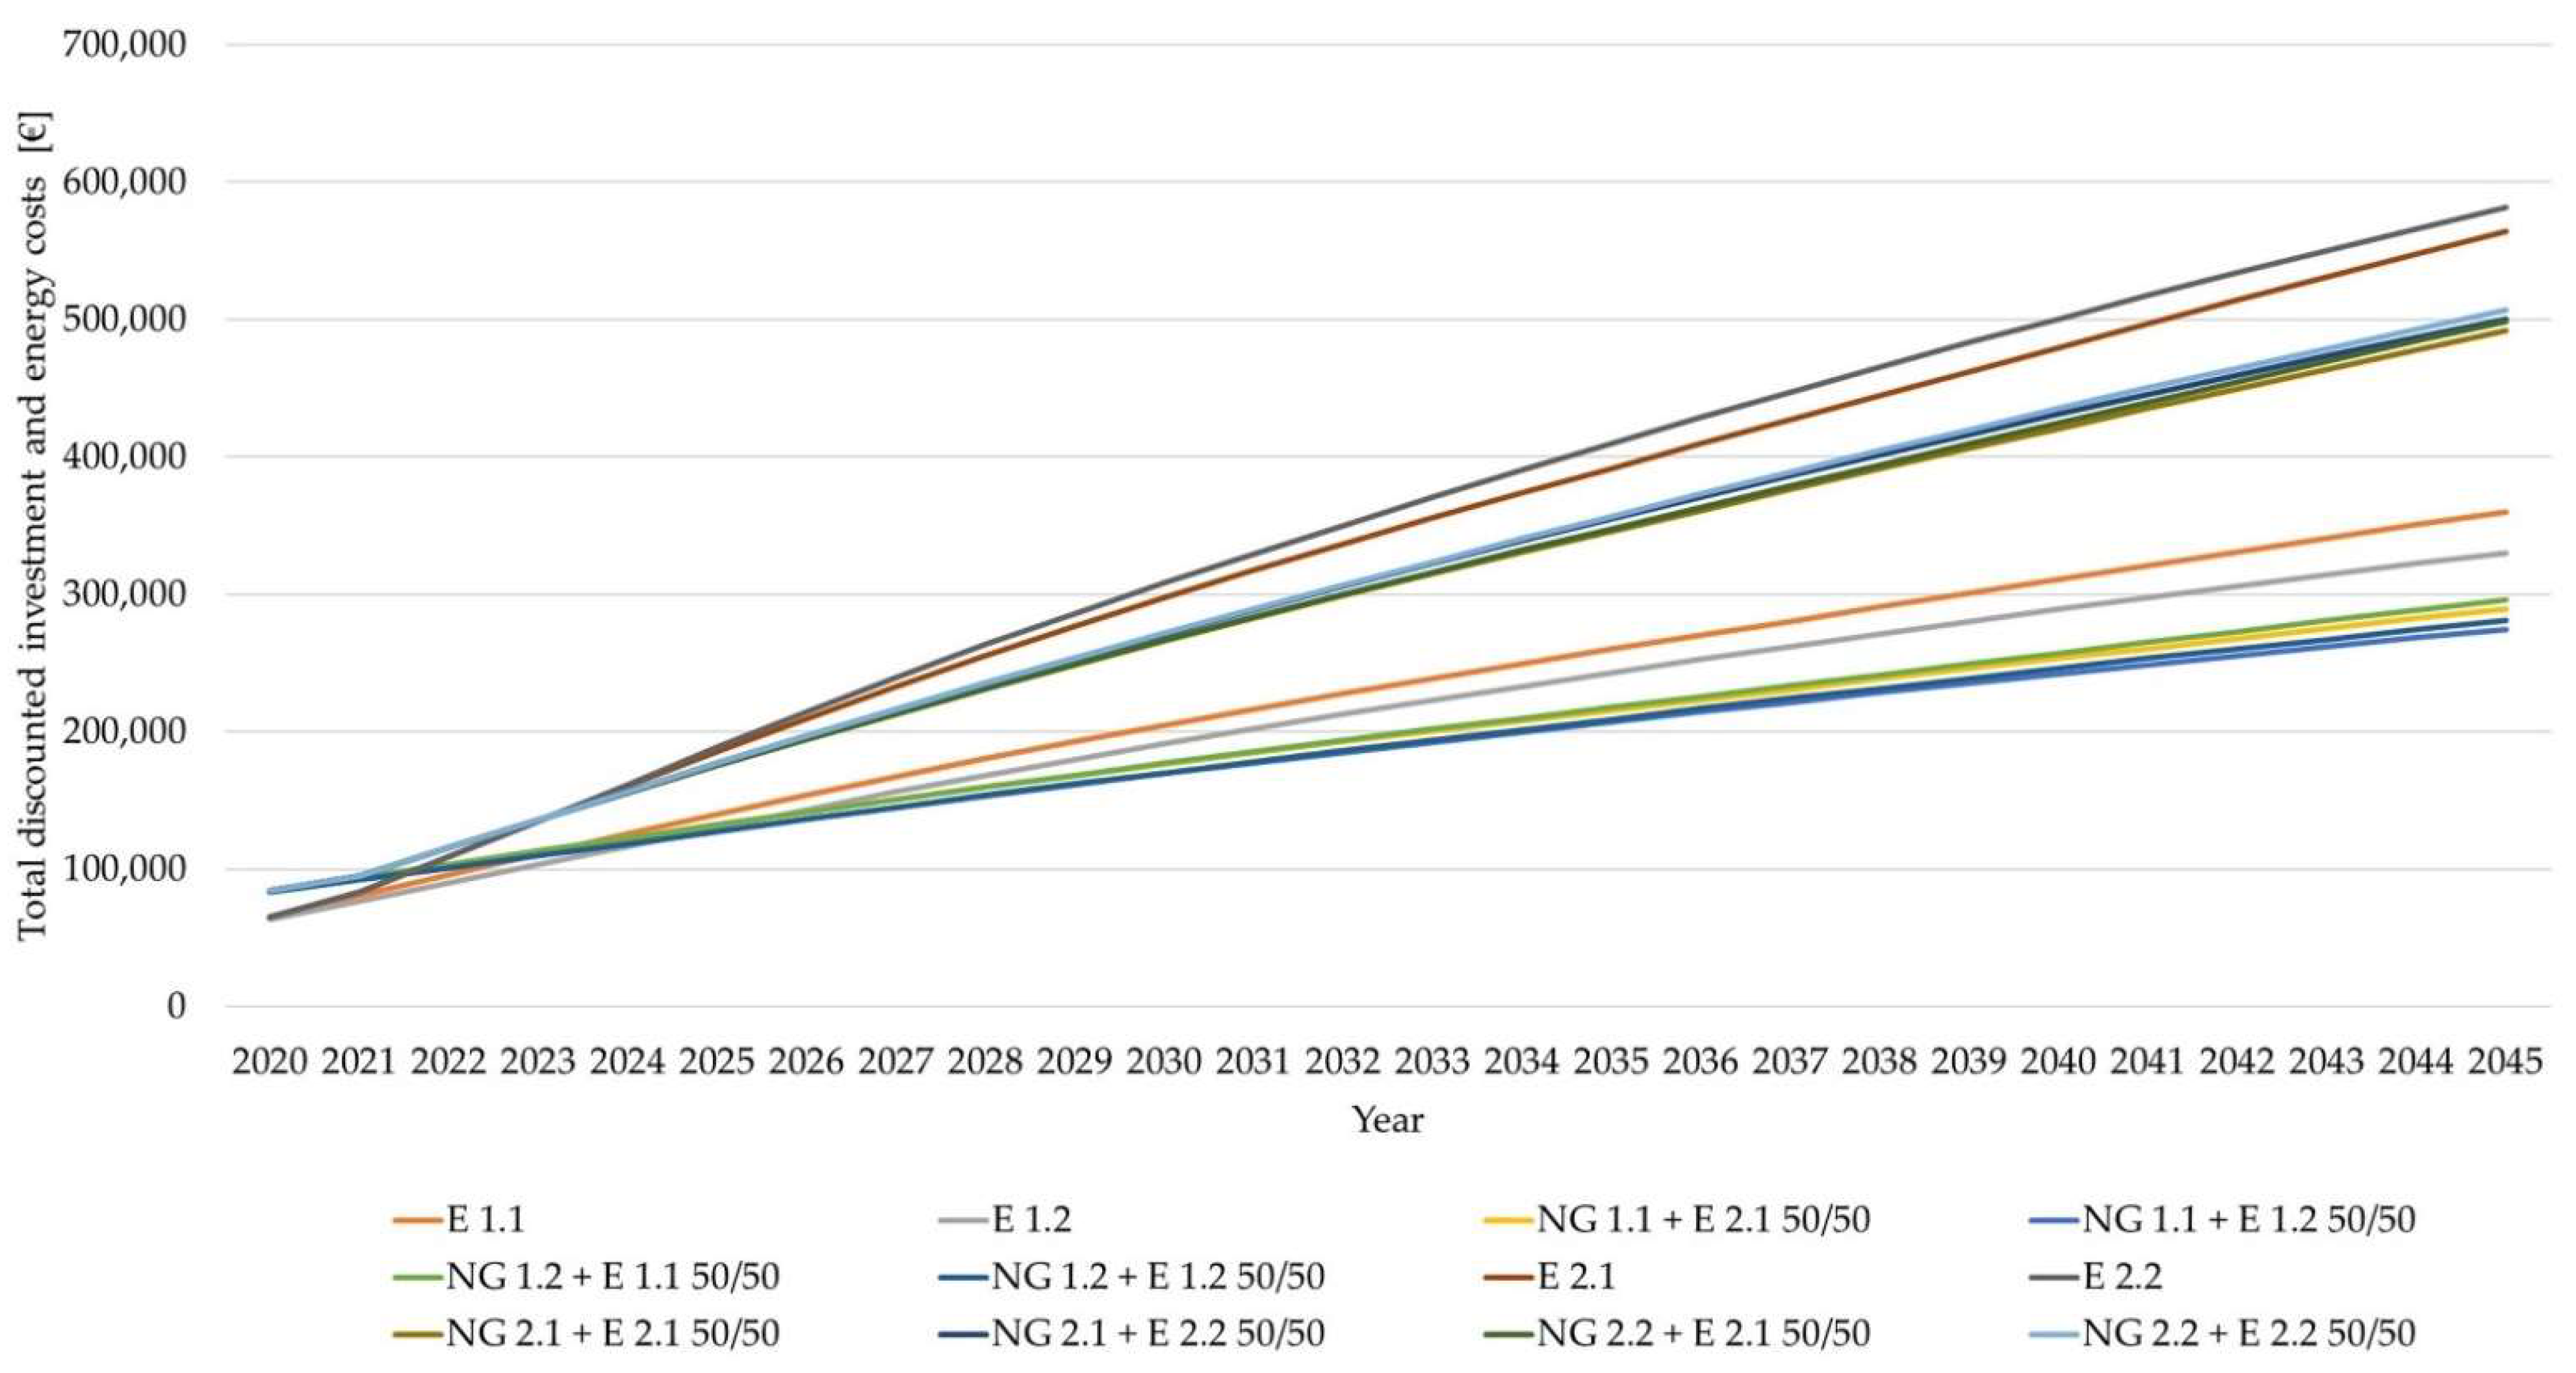
Figure 4 shows the discounted cost development between the years 2020 and 2040 for an electricity/natural gas share of B 50/50 and M 100/0 per price scenario. Despite higher investment costs at the beginning of the lifetime, a bivalent operation with a 50% natural gas share shows, depending on the price development in price scenario 1, lower total costs from 2025 onwards compared to a monovalent electric operation. With the assumed strong increase in the energy costs in price scenario 2, the bivalent furnace is in total already cheaper by 2023. Consequently, the LCC strongly depends on the assumed energy prices, since these account for more than 80% of the discounted costs.
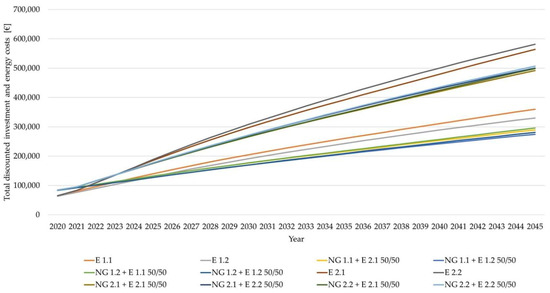
Figure 4.
Evaluation of LCC for S1 and S2 with an energy share of 50/50.
Table 6 summarizes the discounted investment and energy costs for all scenarios and energy shares over the assumed lifetime. An increase in the share of natural gas increases the economic savings over the system’s lifetime. This can also be observed in the other price scenarios. The underlying reason is the large discrepancy in energy source prices. The lowest total costs in price scenario 1 are found in scenario NG 1.1 + E 1.2 with an energy source split of 25/75. The significant increase in energy prices due to a shortage of electricity or natural gas for price scenario 2 is also clearly reflected in the total prices. Here, the lowest costs are expected in scenario NG 2.1 + E 2.1 for an energy share of 25/75.
Table 6.
Summary of discounted investment and energy costs for all scenarios and energy carrier shares over the assumed lifetime combined.
3.3. Social Life Cycle Assessment results
The social assessment was conducted according to the methodology of Kolotzek et al. [49] and is expressed as social risk. Each indicator was normalized on a scale from 0 to 100, with zero corresponding to the best and 100 to the worst performance. The scale in Figure 5 visualizes this.

Figure 5.
Applied color-coded scale according to Kolotzek et al. [49].
Table 7 shows the results of the social evaluation for the elements iron, chromium, aluminum, nickel, magnesium, sodium chloride, titanium, copper, and sulfur. The lowest social risk is shown by Fe followed by NaCl, S, Cu, Al, Ti, Ni, Mg, and Cr.
Table 7.
Evaluation SLCA for the mono- and bivalent furnace.
In general, it should be noted that the social indicators respect of indigenous rights and freedom of association and bargaining are rated as very critical for all elements. Further research must clarify whether this is a coincidence or whether the transformation rule identified by Kolotzek et al. [49] needs to be revised. The elements chromium, nickel, and magnesium particularly stand out from the analysis due to a social risk above 60.
In total, 37% of nickel is mined in Indonesia and 20% in the Philippines. This has a particular impact on the freedom of association and bargaining indicator. The risks of non-enforcement of collective bargaining rights, enforcement of the right to strike, and the risk of serious injury during mining operations are rated particularly high in these countries. The same applies to the indicators child labor and working hours. In the case of Mg, the score can be attributed to the strong concentration of mining in China of 70%. This has a significant negative impact on the social indicators child labor, cultural heritage, and working hours. Similar findings can be made for chromium, where the strong country concentration also has a negative impact on the social indicators. Most of the chromium production takes place in South Africa with 42.5%, Turkey with 25%, and Kazakhstan with 17% [30,50]. Therefore, these three countries determine the evaluation of the indicators working conditions, society, and local community.
4. Discussion
To answer the question of how far changes in the energy system and energy prices influence the ecological and economic benefits of the bivalent furnace, the relationship between the LCA and LCC results was examined.
A complete ecological and economic advantage of the energy flexibility measures via a bivalent crucible furnace over the entire lifetime of 25 years compared to a monovalent electric furnace cannot be demonstrated under the assumptions in the LCSA performed here. However, economic and ecological advantages of the bivalent melting furnace can be identified in the first years of the lifetime. For example, this applies in the period between the years 2023 and 2038 for the LCA scenario S1 and the price scenarios NG 1.x + E.1.x 50/50. Figure 6 illustrates the difference in the total GWPs (bars) and the sum of the discounted investment and energy costs per year (lines) compared to a monovalent operation (M 100/0 E 1.1) for the different energy shares.
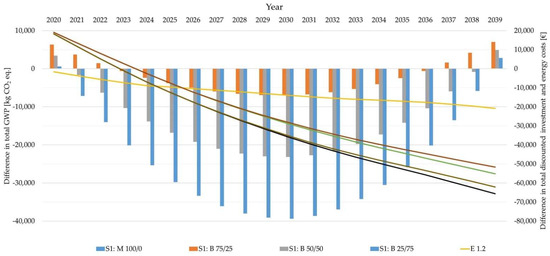
Figure 6.
Difference in the summed GWP and the sum of the discounted investment and energy costs per year compared to a monovalent electric operation (M 100/0 E 1.1) for the different energy shares for S1 NG 1.x + E.1.x 50/50.
A bivalent operation of the furnace can lead to a reduction in potential GHG emissions of up to −16,891 kg CO2 eq. in the period shown, plus economic savings in the amount of −62,284 € in S1 B 25/75 and NG 1.x + E.1.x 50/50. For S2 and the price scenarios B50/50 NG 2.x + E.2.x, it is only 5 years from 2023 to 2028. In these periods, the average energy costs for a bivalent operation in the forecasts are lower than the electricity price and the emission intensity of the underlying electricity mix is higher than that of the combustion of natural gas in the bivalent operation. Table 8 shows the maximum ecological and economic savings in the mentioned time periods for all scenario combinations with a 50/50 energy supply.
Table 8.
Environmental impact of the manufacture and transport of a monovalent and bivalent melting furnace.
Up to now, the evaluation has always assumed a constant ratio of energy purchase over the entire service life, as shown in Table 3.
This assumption is contrary to the realistic use of a bivalent production system, since only a theoretical adjustment of the energy purchase to the energy prices in a given ratio over the lifetime is taken into account and not a possible five-minute-by-minute adjustment.
Since a possible change in the energy source within five minutes in bivalent operation cannot be depicted in this paper and would be associated with high uncertainties, an annual adjustment of the ratio of the electricity and natural gas shares in the energy demand is assumed in the following detailed analysis. Here, the minimization of the accumulated and discounted investment and energy costs according to the intended use of a bivalent plant is aimed at objective Function (1):
with t: lifetime where t = [2020; 2045]; CI investment costs in t = 0; CEt energy costs in year t; and i: internal rate of return of 2%.
When optimizing the bivalent operation according to (1), the optimal economic result of the bivalent crucible melting furnace corresponds to the absolute LCC results, i.e., in the scenario S1 25/75 of the corresponding price development NG 1.1 + E 1.2 with costs above €234,353 (respectively €443,470 for NG 2.1 + E2.1) and 804,885 kg CO2 eq. Compared to the monovalent furnace with €330,007 (E 1.2) and €564,404 (E 2.1) investment and energy costs, the bivalent furnace performs significantly better. From an ecological point of view, however, the monovalent furnace is considerably better with 729,465.83 kg CO2 eq. The same can be seen for S2.
Since the ecological results with (1) are not optimal, further investigations are performed to determine how a bivalent system can be operated in an ecologically optimal way. In this context, the minimization of the GWP over the lifetime of 25 years is examined in objective Function (2):
with t: lifetime where t = [2020; 2045]; GWPt: GWP in year t.
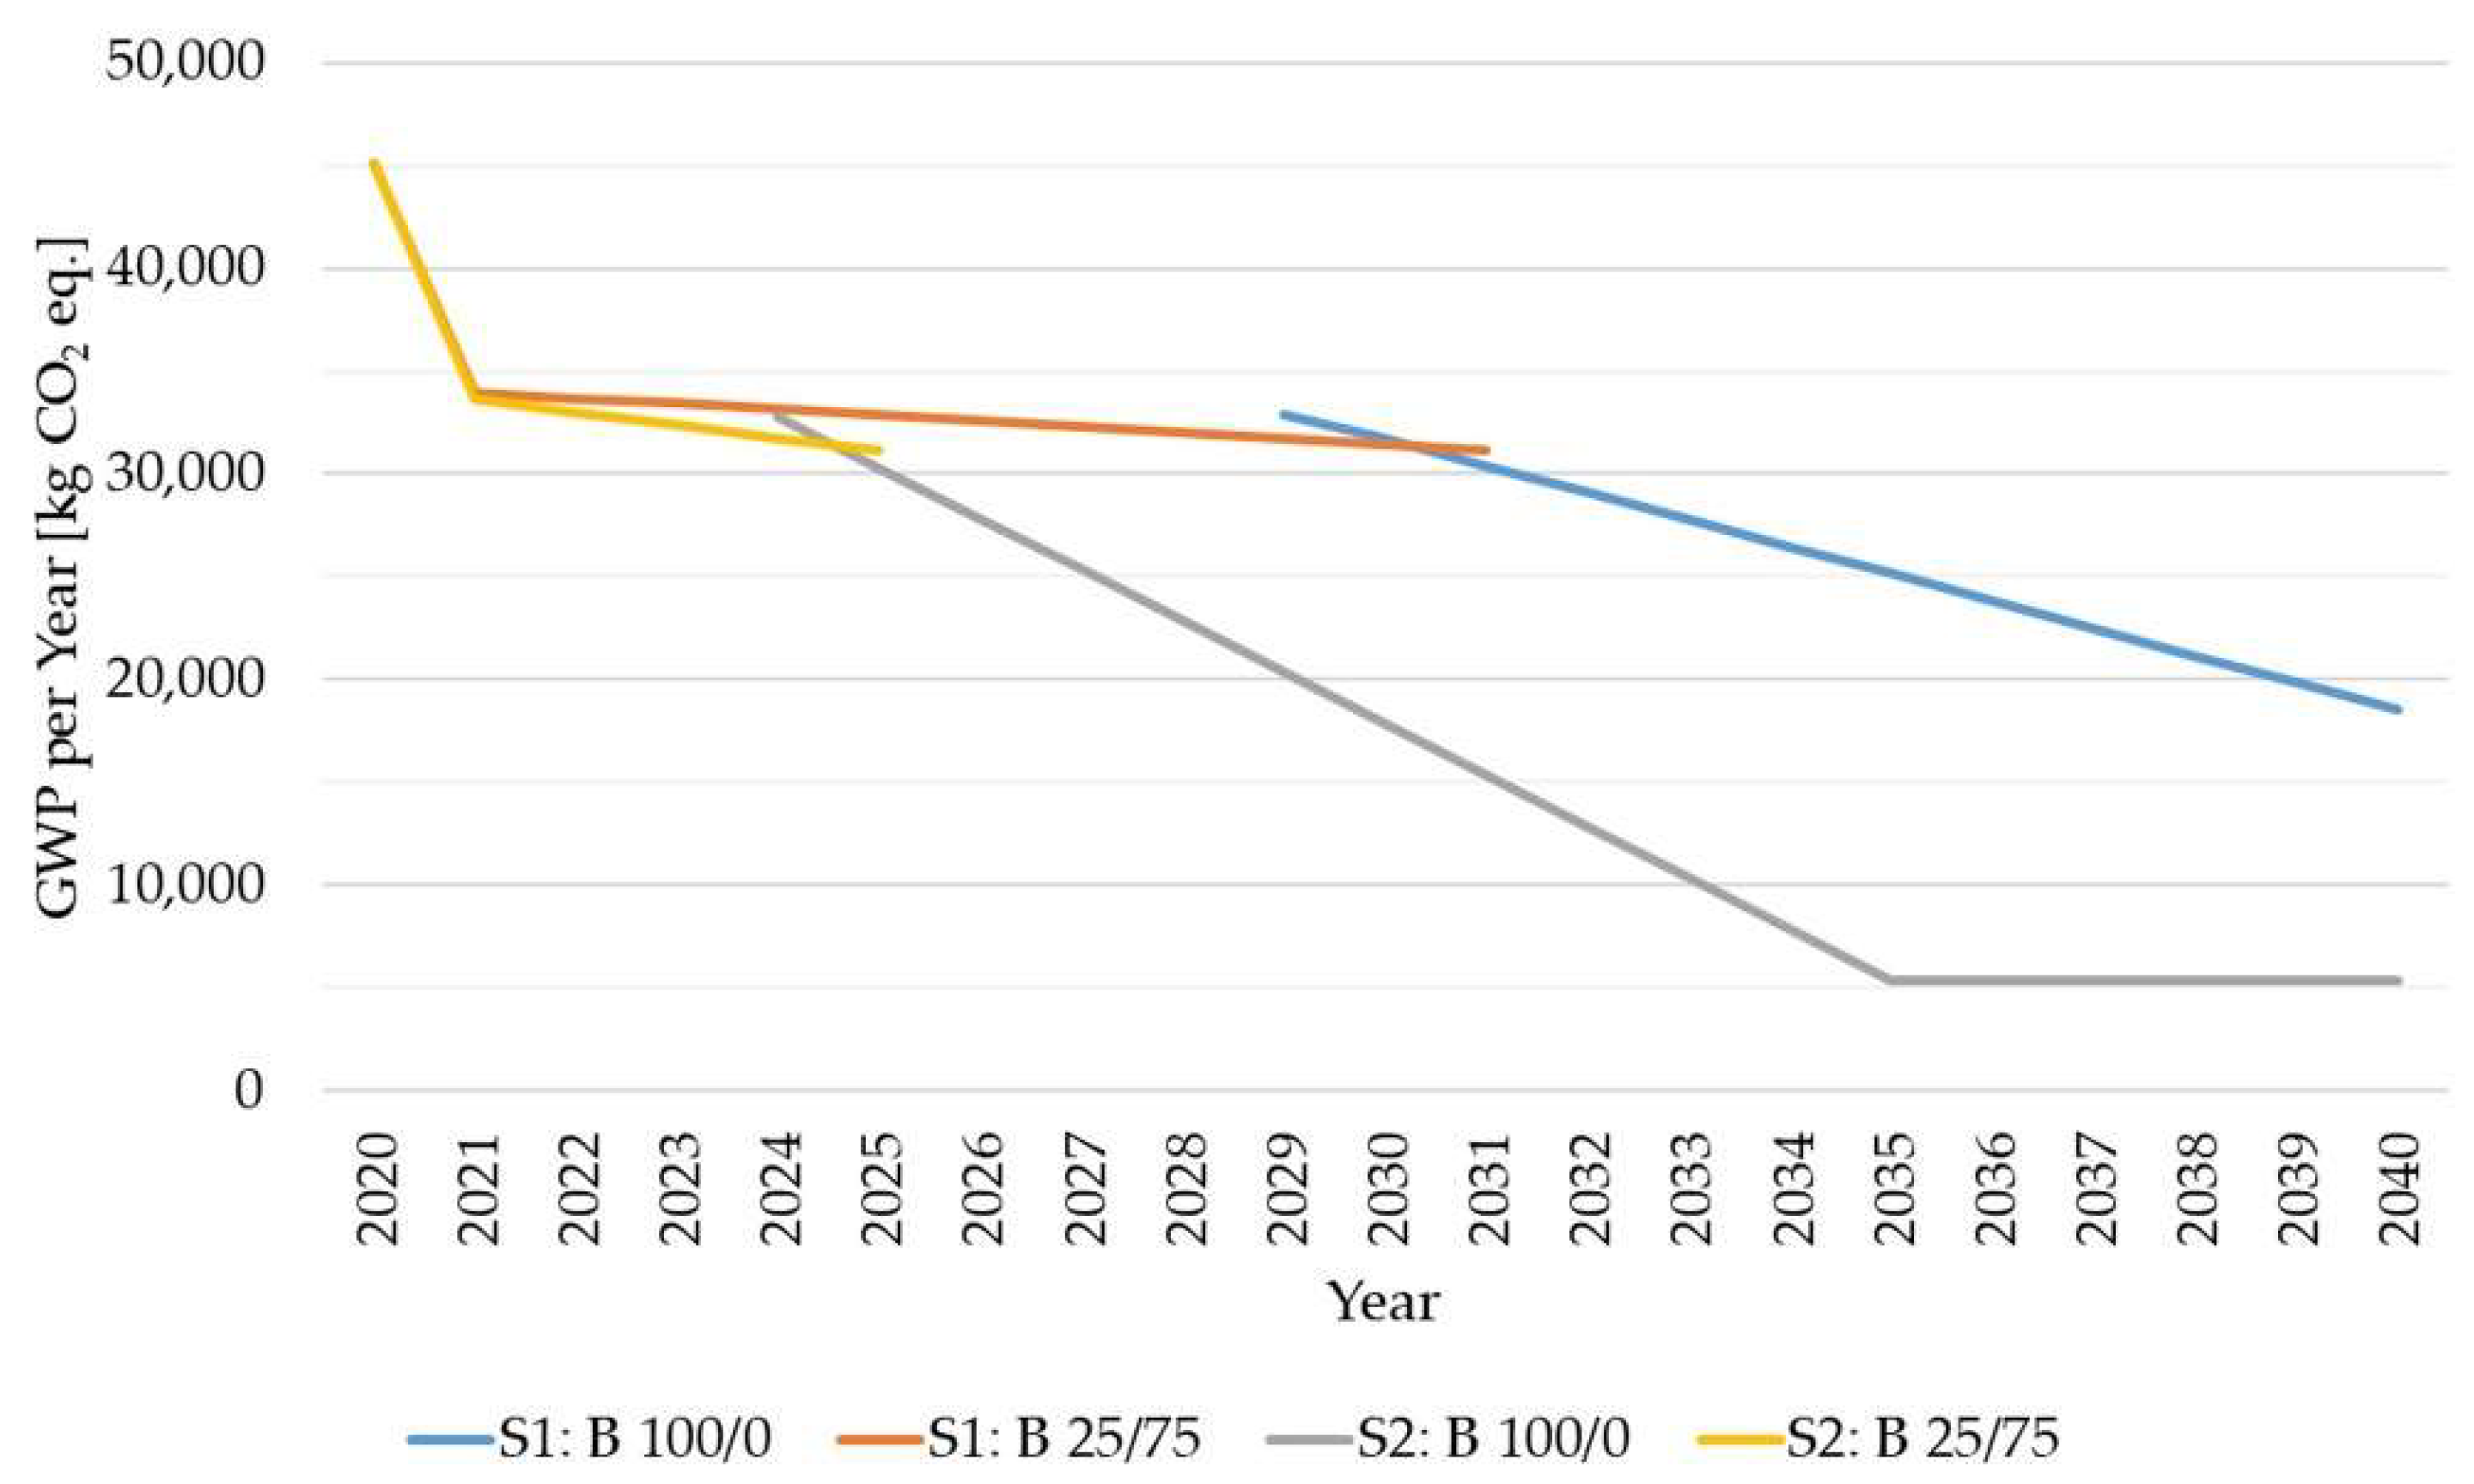
To determine the optimal ecological solution according to (2), the intersection of the respective energy demand shares with the lowest kg CO2 eq. emissions per year is determined for S1 and S2. This corresponds to the energy splits 25/75 and 100/0 for S1 and S2, respectively. For S1, a bivalent furnace operation over 25/75 until 2030 is associated with the lowest kg CO2 eq. emissions while for S2, this is already the case in 2025. From 2030 and 2025, respectively, a monovalent electric operation is ecologically more reasonable. Figure 7 presents the yearly kg CO2 eq. emissions for each optimal ecological strategy.

Figure 7.
Illustration of the optimal ecological strategy for heating the bivalent crucible melting furnace in comparison with a monovalent furnace for S1 and S2.
The optimal ecological use of the bivalent crucible melting furnace for S1 results in a GWP of 69,010 kg CO2 eq. This is associated with investment and energy costs of €285,120 for the scenario NG 1.2+ E 1.2 and €505,748 (NG 2.1 + E2.1), respectively. Compared to a monovalent electric operation, this equals 39,066 kg CO2 eq. less GHG emissions, and a cost saving of €44,886 (E 1.2) or €56,656 (E2.1). When minimizing the GWP for scenario 2, the potential kg CO2 eq. emissions for the described utilization scenario are 426,451 kg CO2 eq., which is equally lower than for a monovalent operation (440,573 kg CO2 eq.). The advantages are also evident from an economic point of view. In this context, costs of €313,368 (B) and €330,007 (M) for NG 2.1 + E2.1 and €536,726 (B) and €564,404 (M) for NG 2.1 + E2.1 are compared.
Consequently, under a primarily economic optimization (1), the bivalent furnace has the lowest cost over all LCC scenarios but is worse than a monovalent electric furnace in any LCA scenario. Minimizing the ecological implications according to (2), the bivalent crucible melting furnace is ecologically and economically advantageous over its entire lifetime in S1 under the assumptions made if it is heated primarily with natural gas until 2030 (25/75) and runs in monovalent electric mode from 2031 (B100/0). In S2, this is already true from 2026, with the lowest kg CO2 eq. across all LCA scenarios. Economically, the bivalent crucible furnace is also paired with lower costs than the state of the art. However, these are higher than those from (1). Nevertheless, a minimization of the environmental impact, and a cost saving compared to monovalent operation over the entire lifetime, can be verified.
All results should be interpreted with the proviso that the bivalent crucible melting furnace has not yet been investigated in actual operation, and the calculations for the utilization phase were based on the energy demand of the monovalent crucible melting furnace. Furthermore, higher maintenance and servicing costs and higher wear and tear of the heating technology can considerably impact the result. In addition, the LCC was based only on forecast values for potential energy price developments, and the LCA results were based on various assumptions.
5. Conclusions
The benefits of energy flexibility measures have not yet been conclusively clarified from an ecological, economic, and social perspective. The analysis focused on evaluating ecological, economic, and social impacts of the bivalent and monovalent crucible furnace and the investigation of the influence of changes in the energy system and price on the ecological and economic benefits.
Therefore, the objective of this study was to perform a life cycle sustainability assessment of energy flexibility measures on the use case of a bivalent crucible melting furnace compared with a monovalent one for light metal die casting. The system boundary was based on a cradle-to-gate approach and included the production of the necessary process technologies and energy infrastructure and the utilization phase of the crucible melting furnaces themselves. The analysis was carried out for the state of Baden-Württemberg in Germany. The LCSA was performed for different economic and environmental scenarios over a 25-year lifetime to account for potential adjustments in the energy system and energy price fluctuations.
The results of the LCA indicate that monovalent electric operation leads to lower environmental impacts over the lifetime than bivalent operation. However, by 2038, the GWP in scenario 1 and 2025 for scenario 2 of bivalent operation of a crucible furnace is lower than that of electric monovalent, especially with increased energy supply via natural gas. This can also be observed in the LCC results due to the large price gap between the two energy sources electric power and natural gas. From a purely economic point of view, the leading natural gas operation is always more advantageous for the bivalent furnace over all scenarios. In order to classify the social sustainability of the furnaces, an indicator analysis was carried out using 18 social indicators. Due to the similar material use in the mono- and bivalent furnace, no advantageousness of one of the furnaces was shown here.
In summary, with a fixed distribution of energy sources over the entire lifetime of 25 years, no complete ecological, economic, and social advantageousness of energy flexibility measures through a bivalent system could be demonstrated. Only a temporarily better sustainability performance of the bivalent furnace could be verified.
However, if an annual adjustment of the ratio of electricity and natural gas shares in the energy demand is assumed, a better sustainability performance was shown by incorporating energy flexibility measures. If the GWP is minimized, the bivalent crucible melting furnace is ecologically and economically advantageous over its entire lifetime in scenario 1 if it is heated primarily with natural gas (25/75) until 2030 and operates in monovalent electric mode from 2031 (B100/0). In scenario 2, this is true as early as 2026, and the cost of purchase and operation is also lower than for a monovalent furnace.
Nevertheless, all results must be seen with the reservation that the bivalent crucible melting furnace has not yet been investigated in actual operation. In addition, the calculations for the utilization phase were based on the energy demand of the monovalent crucible furnace and the LCC on purely forecast values. Furthermore, other assumptions were made during the LCSA performed here. To further sharpen the results, more research is needed and the use of actual data for bivalent operation.
Supplementary Materials
The following supporting information can be downloaded at: https://www.mdpi.com/article/10.3390/su14148826/s1, Supplementary Material S1: Description of the LCA and LCC scenarios and their data basis; Supplementary Material S2: Result preparation per LCA and LCC scenario.
Author Contributions
Conceptualization, M.S. and S.K.; methodology, M.S. and S.K.; software, M.S.; validation, M.S. and S.K.; data curation, M.S. and A.M.; writing—original draft preparation, M.S., E.K. and A.M.; writing—review and editing, S.K., R.M., A.S., A.M. and M.S.; visualization, M.S. and S.K.; supervision, R.M., A.S. and A.M.; project administration, A.S. and A.M.; funding acquisition, A.S. All authors have read and agreed to the published version of the manuscript.
Funding
This research was funded by German Federal Ministry of Education and Research (BMBF), grant number 03SFK3K1-2.
Institutional Review Board Statement
Not applicable.
Informed Consent Statement
Not applicable.
Data Availability Statement
All data were taken from publicly available literature sources and databases. The corresponding references are given in the article. The only exceptions are selected indicators from the S-LCA and the LCA. These were taken from the “Social Hotspots Database” and “ecoinvent v3.8”.
Conflicts of Interest
The authors declare no conflict of interest. The funders had no role in the design of the study; in the collection, analyses, or interpretation of data; in the writing of the manuscript, or in the decision to publish the results.
References
- IPCC. Climate Change 2021: The Physical Science Basis. Contribution of Working Group I to the Sixth Assessment Report of the Intergovernmental Panel on Climate Change; IPCC, Ed.; Cambridge University: Cambridge, UK, 2021. [Google Scholar]
- European Commission. Delivering the European Green Deal. Available online: https://ec.europa.eu/info/strategy/priorities-2019-2024/european-green-deal/delivering-european-green-deal_en (accessed on 24 May 2022).
- Crippa, M.; Guizzardi, D.; Solazzo, E.; Muntean, M.; Schaaf, E.; Monforti-Ferrario, F.; Banja, M.; Olivier, J.; Grassi, G.; Rossi, S.; et al. Emissions Database for Global Atmospheric Research, Version v6.0_FT_2020 (GHG Time-Series). 2021. Available online: http://data.europa.eu/89h/2f134209-21d9-4b42-871c-58c3bdcfb549 (accessed on 22 June 2022).
- Bundesministerium für Umwelt, Naturschutz, Nukleare Sicherheit und Verbraucherschutz BMVU. Greenhouse Gas Emissions to Fall by 8.7 Percent in 2020-BMUV Press Release. Available online: https://www.bmuv.de/en/pressrelease/greenhouse-gas-emissions-fell-87-percent-in-2020 (accessed on 5 May 2022).
- Bauernhansl, T.; Beckett, M.; Brecher, C.; Demmer, A.; Drossel, W.-G.; Elfert, P.; Full, J.; Hellmich, A.; Hien, K.; Hinxlage, J.; et al. Biointelligenz: Eine neue Perspektive für Nachhaltige Industrielle Wertschöpfung: Ergebnisse der Voruntersuchung zur Biologischen Transformation der Industriellen Wertschöpfung (BIOTRAIN); Fraunhofer Verlag: Stuttgart, Germany, 2019. [Google Scholar]
- Miehe, R.; Buckreus, L.; Kiemel, S.; Sauer, A.; Bauernhansl, T. A Conceptual Framework for Biointelligent Production—Calling for Systemic Life Cycle Thinking in Cellular Units. Clean Technol. 2021, 3, 844–857. [Google Scholar] [CrossRef]
- Miehe, R.; Bauernhansl, T.; Schwarz, O.; Traube, A.; Lorenzoni, A.; Waltersmann, L.; Full, J.; Horbelt, J.; Sauer, A. The biological transformation of the manufacturing industry–Envisioning biointelligent value adding. Procedia CIRP 2018, 72, 739–743. [Google Scholar] [CrossRef]
- Marscheider-Weidemann, F. Rohstoffe für Zukunftstechnologien 2021: Auftragsstudie; Datenstand: Mai 2021. Aktualisierung im August 2021; DERA: Berlin, Germany, 2021; ISBN 9783948532475. [Google Scholar]
- Kiemel, S.; Glöser-Chahoud, S.; Waltersmann, L.; Schutzbach, M.; Sauer, A.; Miehe, R. Assessing the Application-Specific Substitutability of Lithium-Ion Battery Cathode Chemistries Based on Material Criticality, Performance, and Price. Resources 2021, 10, 87. [Google Scholar] [CrossRef]
- Kiemel, S.; Smolinka, T.; Lehner, F.; Full, J.; Sauer, A.; Miehe, R. Critical materials for water electrolysers at the example of the energy transition in Germany. Int. J. Energy Res. 2021, 45, 9914–9935. [Google Scholar] [CrossRef]
- Graßl, M.; Reinhart, G. Evaluating Measures for Adapting the Energy Demand of a Production System to Volatile Energy Prices. Procedia CIRP 2014, 15, 129–134. [Google Scholar] [CrossRef]
- Pfeilsticker, L.; Colangelo, E.; Sauer, A. Energy Flexibility–A new Target Dimension in Manufacturing System Design and Operation. Procedia Manuf. 2019, 33, 51–58. [Google Scholar] [CrossRef]
- Köse, E.; Sauer, A. Reduction of energy costs and grid instability with energy flexible furnaces. Procedia CIRP 2018, 72, 832–838. [Google Scholar] [CrossRef]
- Palensky, P.; Dietrich, D. Demand Side Management: Demand Response, Intelligent Energy Systems, and Smart Loads. IEEE Trans. Ind. Inf. 2011, 7, 381–388. [Google Scholar] [CrossRef] [Green Version]
- Wosnitza, F. Energieeffizienz und Energiemanagement: Ein Überblick Heutiger Möglichkeiten und Notwendigkeiten; Vieweg+Teubner Verlag: Wiesbaden, Germany, 2012; ISBN 9783834886712. [Google Scholar]
- Graichen, P.; Sakhel, A.; Podewils, C. The Energy Transition in the Power Sector: State of Affairs in 2017. 2017. Available online: https://www.agora-energiewende.de/fileadmin/Projekte/2018/Jahresauswertung_2017/Energiewende_2017_-_State_of_Affairs.pdf (accessed on 9 June 2022).
- Köse, E.; Sauer, A.; Pelzel, C. Energieflexibel durch bivalente Produktionsanlagen. Werkstatttechnik Online 2017, 5, 366–372. [Google Scholar] [CrossRef]
- Stephan, W.; Zitzmann, K.; Pröbstle, G.; Kapischke, J. Effiziente Energieverwendung in der Industrie–Teilprojekt Metallschmelzbetriebe–Effiziente Energienutzung in Nicht-Eisen-Metall-Schmelzbetrieben; Bayerisches Landesamt für Umweltschutz: Augsburg, Germany, 2005. [Google Scholar]
- Sauer, A.; Abele, E.; Buhl, U. (Eds.) Energieflexibilität in der Deutschen Industrie: Ergebnisse aus dem Kopernikus-Projekt-Synchronisierte und Energieadaptive Produktionstechnik zur Flexibeln Ausrichtung von Industrieprozessen auf eine Fluktuierende Energieversorgung SynErgie; Fraunhofer IRB Verlag: Stuttgart, Germany, 2019; ISBN 978-3-8396-1479-2. [Google Scholar]
- Köse, E.; Sauer, A. Evaluation model for multi-energy carrier facilities within the control energy market. Procedia CIRP 2021, 99, 537–542. [Google Scholar] [CrossRef]
- Köse, E.; Sauer, A. Ökonomische Bewertung hybrider Anlagen mithilfe von Lastprognosen. In Proceedings of the 16. Symposium Energieinnovation, Graz, Austria, 12–14 February 2020. [Google Scholar]
- Finkbeiner, M.; Schau, E.M.; Lehmann, A.; Traverso, M. Towards Life Cycle Sustainability Assessment. Sustainability 2010, 2, 3309–3322. [Google Scholar] [CrossRef] [Green Version]
- United Nations Environment Programme. Towards a Life Cycle Sustainability Assessment: Making Informed Choices on Products; United Nations Environment Programme: Nairobi, Kenya, 2011; ISBN 9789280731750. [Google Scholar]
- Costa, D.; Quinteiro, P.; Dias, A.C. A systematic review of life cycle sustainability assessment: Current state, methodological challenges, and implementation issues. Sci. Total Environ. 2019, 686, 774–787. [Google Scholar] [CrossRef] [PubMed]
- DIN EN ISO 14040:2021-02; Environmental Management-Life Cycle Assessment-Principles and Framework (ISO 14040:2006 + Amd 1:2020). German Version EN ISO 14040:2006 + A1:2020; Beuth Verlag GmbH: Berlin, Germany, 2020.
- DIN EN ISO 14044:2018-05; Environmental Management-Life Cycle Assessment-Requirements and Guidelines (ISO 14044:2006 + Amd 1:2017 + Amd 2:2020). German Version EN ISO 14044:2006 + A1:2018 + A2:2020; Beuth Verlag GmbH: Berlin, Germany, 2018.
- Tan, M.; Liu, Z.; Quan, G. Effects of Hot Extrusion and Heat Treatment on Mechanical Properties and Microstructures of AZ91 Magnesium Alloy. Energy Procedia 2012, 16, 457–460. [Google Scholar] [CrossRef] [Green Version]
- Wernet, G.; Bauer, C.; Steubing, B.; Reinhard, J.; Moreno-Ruiz, E.; Weidema, B. The ecoinvent database version 3 (part I): Overview and methodology. Int. J. Life Cycle Assess 2016, 21, 1218–1230. [Google Scholar] [CrossRef]
- Cerrillo, C. SusPIRE: Sustainable Production of Industrial Recovered Energy Using Energy Dissipative and Storage Technologies: D6.4: Lifecycle Assessment Report (LCA). Available online: https://cordis.europa.eu/project/id/680169/results/de (accessed on 22 June 2022).
- New Earth/Social Hotspots Database Project. Available online: http://www.socialhotspot.org/ (accessed on 11 November 2021).
- DIN EN ISO 14067:2019-02; Greenhouse Gases-Carbon Footprint of Products-Requirements and Guidelines for Quantification (ISO 14067:2018). German and English Version EN ISO 14067:2018; Beuth Verlag GmbH: Berlin, Germany, 2018.
- Kemmler, A.; Kirchner, A.; auf der Maur, A.; Ess, F.; Kreidelmeyer, S.; Piégsa, A.; Spillmann, T.; Straßburg, S.; Wünsch, M.; Ziegenhagen, I.; et al. Energiewirtschaftliche Projektionen und Folgeabschätzungen 2030/2050-Gesamtdokumentation der Szenarien: Bericht im Auftrag des Bundesministeriums für Wirtschaft und Energie; Prognos AG: Basel, Switzerland, 2021. [Google Scholar]
- Deutsche Bundesregierung. Renewables Legislation Updated: Cabinet Approves Accelerated Development of Renewable Energies. Available online: https://www.bundesregierung.de/breg-de/themen/klimaschutz/novellierung-des-eeg-gesetzes-2023972 (accessed on 18 May 2022).
- Treyer, K.; Bauer, C. Life cycle inventories of electricity generation and power supply in version 3 of the ecoinvent database—part II: Electricity markets. Int. J. Life Cycle Assess 2016, 21, 1255–1268. [Google Scholar] [CrossRef]
- Arbeitsgemeinschaft Energiebilanzen e.V. Energieverbrauch in Deutschland im Jahr 2020. Available online: https://ag-energiebilanzen.de/bericht-zum-energieverbrauch-2020/#:~:text=Berlin%2FBergheim%20%E2%80%93%20Der%20Energieverbrauch%20in,unter%20dem%20Wert%20von%202019 (accessed on 18 May 2022).
- bnNETZE GmbH. Erdgasqualität-alle Wichtigen Eigenschaften. 2019. Available online: https://bnnetze.de/downloads/netz-dokumente/erdgasnetz/netzdaten/brennwerte/erdgasqualitaet-wichtige-kennwerte.pdf (accessed on 18 May 2021).
- Kyoto Protocol to the United Nations Framework Convention on Climate Change. In International Law Documents; Klabbers, J. (Ed.) Cambridge University Press: Cambridge, UK, 2018; pp. 491–508. ISBN 9781316577226. [Google Scholar]
- US Environmental Protection Agency. Chapter 1.4: Natural Gas Combustion. In Compilation of Air Pollutant Emission Factors, 5th ed.; US Environmental Protection Agency: Washington, DC, USA, 1995. [Google Scholar]
- Gómez, D.R.; Watterson, J.D. Chapter 2: Stationary Combustion. In 2006 IPCC Guidelines for National Greenhouse Gas Inventories; IPCC, Ed.; Institute for Global Environmental Strategie: Kanagawa, Japan, 2006; pp. 2.1–2.47. [Google Scholar]
- Goedkoop, M.; Heijungs, R.; Huijbregts, M.; Schryver, A.; Struijs, J.; Zelm, R. ReCiPE 2008: A Life Cycle Impact Assessment Method Which Comprises Harmonised Category Indicators at the Midpoint and the Endpoint Level. 2008. Available online: https://web.universiteitleiden.nl/cml/ssp/publications/recipe_characterisation.pdf (accessed on 18 July 2021).
- Sherif, Y.S.; Kolarik, W.J. Life cycle costing: Concept and practice. Omega 1981, 9, 287–296. [Google Scholar] [CrossRef]
- Knaut, A.; Tode, C.; Lindenberger, D.; Malischek, R.; Paulus, S.; Wagner, J. The reference forecast of the German energy transition—An outlook on electricity markets. Energy Policy 2016, 92, 477–491. [Google Scholar] [CrossRef]
- Wagner, J.; Hennes, O.; Zink, J.; Jeddi, S.; Madlener, R.; Schmitz, H.; Wolff, S. Auswirkungen von CO2-Preisen auf den Gebäude-, Verkehrs- und Energiesektor. Available online: https://www.ewi.uni-koeln.de/cms/wp-content/uploads/2019/11/Auswirkungen-von-CO2-Preisen_Executive-Summary.pdf (accessed on 8 October 2021).
- Bundesamt für Wirtschaft und Ausfuhrkontrolle. Informationsblatt CO2-Faktoren: Bundesförderung für Energie- und Ressourceneffizienz in der Wirtschaft-Zuschuss. 2021. Available online: https://www.bafa.de/SharedDocs/Downloads/DE/Energie/eew_infoblatt_co2_faktoren_2021.pdf (accessed on 3 June 2022).
- EEX Natural Gas Market Operations; European Energy Exchange AG. EEX Gas Price Reference EGIX (Germany). 2022. Available online: https://www.eex.com/en/market-data/natural-gas/egix-index (accessed on 10 May 2022).
- Bantle, C.; Tilman, S.; Bundesverband der Energie- und Wasserwirtschaft e.V. BDEW-Strompreisanalyse April 2022. Available online: https://www.bdew.de/service/daten-und-grafiken/bdew-strompreisanalyse/ (accessed on 10 May 2022).
- Bundeskartellamt. Bundesnetzagentur für Elektrizität, Gas, Telekommunikation, Post und Eisenbahn. In Bericht: Monitoringbericht 2021; Bundeskartellamt: Bonn, Germany, 2021. [Google Scholar]
- United Nations Environment Programme/Society of Environmental Toxicology and Chemistry. Guidelines for Social Life Cycle Assessment of Products; United Nations Environment Programme/Society of Environmental Toxicology and Chemistry: Nairobi, Kenya, 2009; ISBN 978-92-807-3021-0. [Google Scholar]
- Kolotzek, C.; Helbig, C.; Thorenz, A.; Reller, A.; Tuma, A. A company-oriented model for the assessment of raw material supply risks, environmental impact and social implications. J. Clean. Prod. 2018, 176, 566–580. [Google Scholar] [CrossRef]
- USGS National Minerals Information Center. Mineral Commodity Summaries 2020; U.S. Geological Survey: Reston, VA, USA, 2020. [Google Scholar]


Publisher’s Note: MDPI stays neutral with regard to jurisdictional claims in published maps and institutional affiliations. |
© 2022 by the authors. Licensee MDPI, Basel, Switzerland. This article is an open access article distributed under the terms and conditions of the Creative Commons Attribution (CC BY) license (https://creativecommons.org/licenses/by/4.0/).