Article

Mode Choice Modeling for Sustainable Last-Mile Delivery: The Greek Perspective

Department of Shipping, Trade and Transport, University of the Aegean, 82100 Chios, Greece
*
Author to whom correspondence should be addressed.
Sustainability 2022, 14(15), 8976; https://doi.org/10.3390/su14158976
Submission received: 27 May 2022 / Revised: 9 July 2022 / Accepted: 20 July 2022 / Published: 22 July 2022
(This article belongs to the Special Issue Sustainable Economy and Green Logistics)

Abstract

:
As the private sector is under heavy pressure to serve the ever-growing e-commerce market, the potential of implementing new disruptive mobility/logistics services for increasing the level of the current last-mile delivery (LMD) services, is emerging. Vehicle automation technology, characterized by high-capacity utilization and asset intensity, appears to be a prominent response to easing this pressure, while contributing to mitigation of the adverse effects associated with the deployment of LMD activities. This research studied the perceptions of Greek end-users/consumers, regarding the introduction of autonomous/automated/driverless vehicles (AVs) in innovative delivery services. To achieve this, a mixed logit model was developed, based on a Stated Preferences (SP) experiment, designed to capture the demand of alternative last-mile delivery modes/services, such as drones, pods, and autonomous vans, compared to traditional delivery services. The results show that the traditional delivery, i.e., having a dedicated delivery person who picks up the parcels at a consolidation point and delivers them directly to the recipients while driving a non-autonomous vehicle—conventional van, bike, e-bike, e-scooter—remains the most acceptable delivery method. Moreover, the analysis indicated that there is no interest yet in deploying home deliveries with drones or AVs, and that participants are unwilling to pay extra charges for having access to more advanced last-mile delivery modes/services. Thus, it is important to promote the benefits of innovative modes and services for LMD, in order to increase public awareness and receptivity in Greece.

1. Introduction

E-commerce statistics show a steep increase in trading goods and services over computer networks in the last decade. The results of the 2020 survey on ICT usage and e-commerce in enterprises, released in February 2021 by Eurostat [1], showed that the enterprise turnover generated from e-sales for the period 2010–2019 increased from 13% to 20%. Yet, this was only the beginning. The COVID-19 crisis created an additional vast growth in e-commerce, which no one could have foreseen. In 2020, 73% of internet users in the European Union—which corresponds to 290.53 million people [2]—shopped online, while 127.03 million people bought or ordered goods or services between 100–500 Euros between March to May 2021 [3]. This new reality created demand-shocks on the economy’s infrastructure, influencing multiple sectors related to transport and logistics, i.e., food, groceries, and parcel deliveries.
The rise of e-commerce is a major factor in growing commercial vehicle movements, particularly in urban areas [4]. Considering that last-mile delivery (LMD) is recognized as the worst-performing part of the supply chain [5], one should expect excessive burdening of the urban environment, increased costs, and low efficiency as regards the delivery process. And while the private sector is striving to serve this growing market, a significant increase in on-demand deliveries, employing the existing traditional physical means of transport, will lead to increased traffic, emissions, and collisions. To appropriately address the challenges, new delivery methods and business models need to be introduced, and they require the creation of new, shared, interconnected logistics networks that uphold the dogma of zero emissions in transport. The advancements of the emerging vehicle automation technology, and the pervasive use of mobile technology, seem to be heading in the right direction, while maintaining a high level of living quality for citizens. Vehicle automation—in the form of drones, autonomous trucks/vans, autonomous/driverless pods—as new disruptive technology, is expected to bring many benefits in urban congestion, air quality, and transport safety, and thus to strengthen overall sustainability [6]; however, in the literature, there seems to be a gap in identifying policy and governance frameworks to foster its implementation. Despite the high number of potential applications, and the recognizable indirect social, economic, and environmental benefits, the success of vehicle automation remains strongly dependent on public acceptance and willingness to use new technologies in their everyday delivery experience.
The objective of this paper was therefore to study the perceptions of Greek end-users/consumers regarding the introduction of autonomous/automated/driverless vehicles (AVs) in innovative delivery services. The study employed a mixed logit model, which was developed based on a Stated Preferences (SP) experiment, designed to capture the demand of alternative last-mile delivery modes/services, such as drones, pods, and autonomous vans, compared to traditional delivery services. To enable customization of the SP experiments, a questionnaire survey was developed, covering personality traits, attitudes towards the adoption of new technologies and perceptions about trust [7,8,9,10,11,12,13], ease of use [14], the perceived usefulness of AVs [14], and respondents’ prior experiences with online shopping. Six main attributes characterizing each alternative were considered: 1. delivery time after product order; 2. delivery cost; 3. pick-up location (specific city location or smart point, drop at the balcony, sidewalk curb, home); 4. time to pick up the product; 5. security—probability of vandalism or theft; and 6. parcel tracking.
The rest of the paper is structured as follows: Section 2 reviews previous research, with respect to methodological frameworks developed to study the acceptance of new disruptive technologies; Section 3 describes the modeling framework; Section 4 elaborates on the research approach; Section 5 presents the results; Section 6 concludes the paper and suggests future research.

2. State of the Art

There are several ongoing and recently completed projects aiming at analyzing and modeling Autonomous Vehicles (AVs). The U.S. Federal Highway Administration Office [15] formulated research teams to work on a series of projects in the areas of connected automation, congestion management/mitigation, and analysis modeling and simulation state of the practice. The UK Department for Transport [16] studied the impact of AVs on traffic flow safety, travel demand, car ownership, emissions, route planning, accessibility, provision of data for network operations and strategic planning, and network service level. Moreover, there are several ongoing European Horizon projects, which aim to increase: (i) the acceptance/use of connected, cooperative, and automated transport modes by travelers and public authorities; and (ii) understanding and meeting the needs of vehicle operators and industry. To achieve these goals, the Drive2theFuture project [17] develops training, human-machine interface concepts, and incentives policies, to promote use cases for all transport modes, in synergy with urban transport key stakeholders. The Avenue project [18] focuses on public transport services and the way public transport users can benefit from the deployment of AVs. The PAsCAL project [19] investigates the perceptions and expectations of citizens regarding new autonomous and connected driving technologies, and develops solutions that will bridge the emotional and cultural gaps emerging upon actual implementation. The SUaaVE project [20] focuses on the human side, by leaning on a human-driven design approach that encourages the user to actively contribute to the definition of several aspects of connected autonomy, such as safety perception, attitudes, emotional appraisal, etc. The Trustonomy [21] and CoExist [22] projects assess the impacts of connected AV technologies through pilots and full-scale demonstrations. Trustonomy investigates, tests, and assesses, in terms of performance, scenarios with different levels of automation, types of users, driving conditions, etc. CoExist focuses on the preparation of urban road infrastructure for the introduction of AVs; in this context, the project increases the capacity of road authorities and other urban mobility stakeholders to get ready for the AV transition. CoExist, inter alia, deploys AV-ready transport modeling tools.
There has been a handful of studies focusing on LMD, dealing mostly with the impacts of AVs on the environment, and the transport and mobility of the urban network, as well as with its implementation drivers: solution maturity, social acceptance, and user uptake; as regards the latter, the research of Marsden, et al. [23], was among the first that attempted to measure the perceptions and attitudes of customers. This was achieved through a series of analyses of variance (ANOVAs), using gender as an independent variable. The respondents supported the idea of self-driving vehicles for delivering mail, parcels, and other supplies, concluding that the acceptance of the new technologies in LMD required a participative implementation through a human-centered approach. Under the same approach, Pani, et al. [24], examined the public acceptance of autonomous delivery robot technology for LMD during the COVID-19 pandemic. A sample of 483 consumers in Portland was used, to analyze their preferences. The latent class analysis approach which was adopted took account of the fact that there are multiple types of consumers, who differ in their attitudes and motivations towards purchasing goods. Other studies, such as [25,26,27,28,29,30,31,32], were mostly descriptive, as they did not model the actual intentions/choices of the individuals to be serviced by AVs, nor accept them as part of their delivery experience. Exceptions to this were the studies of Kapser and Abdelrahman [25], and Kim [27]. Kapser and Abdelrahman [25] investigated the behavioral components of the users’ intentions (i.e., user acceptance) in the context of Autonomous Delivery Vehicles (ADVs) in last-mile delivery, using the extended Unified Theory of Acceptance and Use of Technology. The model, however, underwent certain modifications to capture the specific context of ADVs and the cultural context of Germany. Kim [27] investigated consumer preferences, between drone delivery service and traditional delivery service by truck or motorcycle, using discrete choice modeling. The results showed that price and type of commodity influence consumer preferences, which are also affected by socio-demographic characteristics, such as gender, age, and household income.
Ignat and Chankov [33] explored e-commerce customers’ attitudes towards their preferred last-mile delivery, and changes to those attitudes when they were provided with information on the environmental and social sustainability impact of the available last-mile delivery options. The results showed that information sharing—based not only on economic factors—has the potential to change customers’ behaviors towards more sustainable deliveries. Wang, et al. [34], in their study, encouraged the co-creation of e-commerce last-mile logistics directly with consumers. Their analysis showed that consumers were empowered to influence changes in the service offerings, while logistics service providers accrued benefits by transferring part of the service obligations to the consumers. Moreover, Mangiaracina, et al. [35], performed a systematic literature review, examining specifically, inter alia, the overall logistics costs and their role with respect to the economic sustainability of a B2C e-commerce initiative. Their review highlighted that factors such as the probability of failed deliveries, customer density in the delivery areas, and the degree of automation of the process, were among the main factors affecting the cost of the delivery service.
This study developed an innovative Stated Preferences experiment, for capturing the choice among drones, droids, Avs, and traditional courier, and estimated advanced discrete choice models to identify the factors affecting the choices of the consumers.

3. Modeling Framework

To understand the choice behavior of individuals with regards to emerging last-mile delivery services, a discrete choice model was developed. The decision rule applied in this modeling framework was based on the random utility theory, where the decision maker’s choice depends on utility maximization [36,37]. The utility for each mode alternative, and subsequently the probability of choosing it, was assumed to be affected by mode-related (delivery-service-related) attributes, such as delivery time, delivery cost, tracking, and type of commodity being transported, as well as from individuals’ socioeconomic characteristics.
The model developed was a mixed multinomial logit, capturing the correlation between alternatives with common characteristics and taste heterogeneity, and the correlations among observations of the same individual. Concerning the latter, this specification was required, as the sample included three observations per individual, that corresponded to the three scenarios that each respondent replied to as part of the hypothetical (stated preference) delivery service scenarios. These correlations, as well as taste heterogeneity, were captured through the inclusion of appropriate random terms in the utility function.
In the mixed logit model, the utility Uin of an individual n choosing alternative i was given by Equation (1):
U i n = β n X i n + ξ i n + λ i + v i n
where X i n was a vector of observed explanatory variables; β n was a vector of unobserved coefficients for each individual (n), that varied randomly over individuals representing taste heterogeneity; the coefficients β n varied in the population, and could be expressed as the sum of the population mean, b, and individual deviation η, which represented the individual’s taste relative to the average tastes in the sample respondents; the unobserved portion of the utility was η 1 n X i + ξ i n + λ i + v i n ; to capture correlations among the observations of the same individual, a vector of random terms with zero mean, ξ i n , was introduced; to capture correlations among alternatives, a vector of random terms with zero mean, λ i , was introduced; and v i n was i.i.d Extreme Value.

4. Research Approach

An online survey was created in Sawtooth to investigate the perceptions of Greek customers regarding innovative means of transport for last-mile delivery. In the context of the survey, the term “innovative means of transport” was used to describe Autonomous Ground Vehicles (AGVs, which are also referred to in the literature as sidewalk robots, delivery droids, or bots), Unmanned Aerial Vehicles (UAVs, i.e., drones), and self-driving vehicles (cars, minivans, vans, small trucks) with little or zero human interaction, but with human couriers on board who can exploit driving time for small administrative tasks, including preparation of the paperwork for the next delivery, sorting the parcels, and delivering the parcel to the final recipient. The latter assumed the vehicles to have autonomy level 4 or higher, in accordance with SAE International [38]. The above vehicles are expected to secure sustainable last-mile delivery systems in the future by reducing cost externalities, tackling climate change, and improving the efficiency of operations. In an attempt to project sustainability into the impact areas of Economy & Energy, the Environment, and Transport & Mobility, innovative means of transport will offer services at lower costs, with a reduced environmental footprint, and with higher degrees of operations’ flexibility and reliability. As regards the costs, estimations in the US [39] and the Netherlands [40] show that labor costs account for 60–80% of the total cost per delivery—including on-demand deliveries. While some new expenditures will emerge for the logistics companies upon uptake of innovative means of transport usage—i.e., software that utilizes a plethora of integrated tools, procurement of the new vehicles, other costs that may appear until their scale up and wide user uptake, etc.—the ratio of total cost per delivery is expected to significantly reduce. As regards emissions, most of these new means are 100% electric powered, and thus no emissions are produced, in compliance with the scope that the EU has imposed for the future. Lastly, as regards the operations’ reliability, and their impact on the local Transport & Mobility system, there are several reasons why the authors tend to believe that they will positively contribute: some of these reasons are that they will be able to span their operations over 24 h; they will increase safety on the streets; and they may catalyze more fundamental changes in transport systems and also in overall urban infrastructure design.
The questionnaire consisted of five parts. The first part recorded participants’ preferences regarding their e-shopping activities, e.g., frequency of home/workplace deliveries, types of products, considered criteria before placing an order, etc. The second part referred to participants’ personalities and perceptions regarding the future delivery of goods with AVs. Specifically, this part explored potential correlations between participants’ personality characteristics and the adoption of new technologies or the purchase of new technological products. The third part focused on participants’ latest e-shopping experience, i.e., what was purchased, frequency of purchasing this specific product, and information about the delivery, e.g., delivery location, delivery time after the purchase, price, mode of delivery, manner of parcel reception, return options, etc., in order to customize the Stated Preference experiment that followed. The fourth part constituted the core part of the survey, highlighting sustainable delivery methods—other than traditional delivery—that were based on the advancements of the emerging vehicle automation technology, and on how the participants would prefer to receive their parcels. Four different delivery methods were given as alternatives in the SP experiment [6,30]:
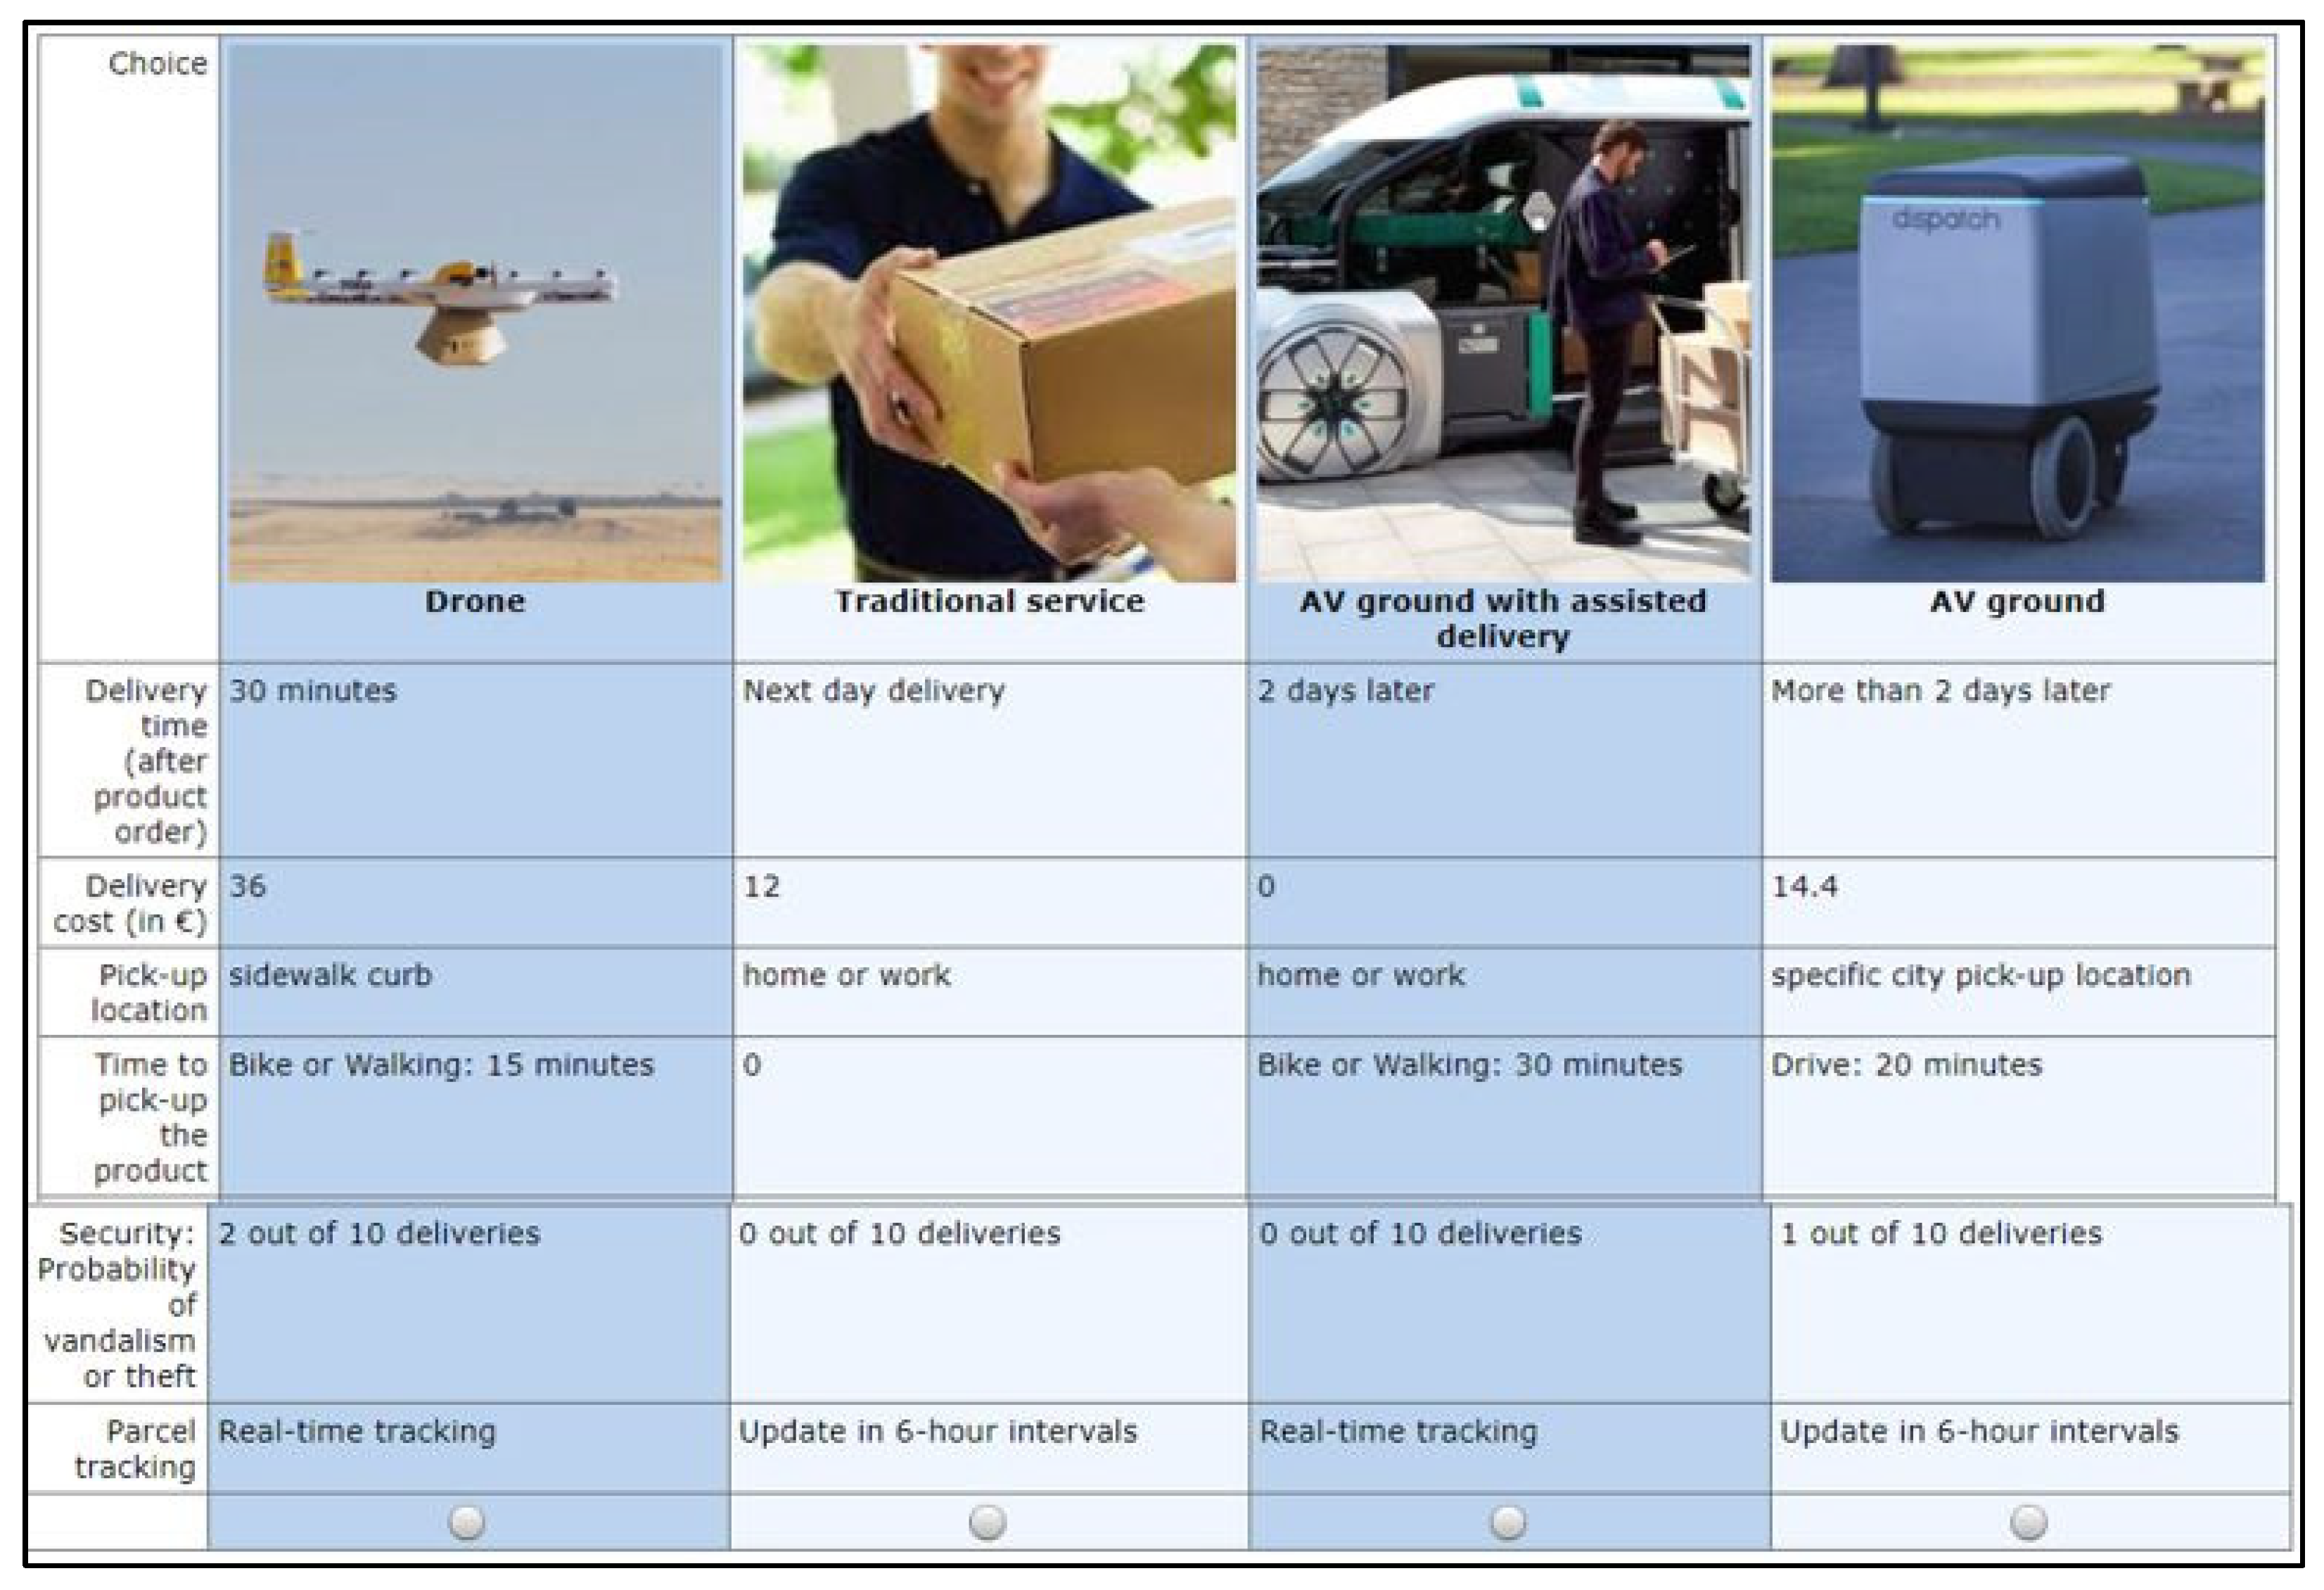
  • Traditional delivery: a dedicated delivery person employed by the parcel delivery service provider picks up the parcels at a consolidation point and delivers them directly to the recipients. Large vans are typically used as delivery vehicles. Point-to-point deliveries can be conducted by bike, e-bike, or e-scooter, especially for B2B documents and prepared food, as well as deliveries within city centers where the circulation of cars is not permitted.
  • Ground AVs (with assisted delivery): deliver parcels without any human intervention. Customers are notified of the arrival time and, upon arrival, the parcel is picked up from the specified locker mounted on the van. Advantages include fast and flexible delivery, low operating cost, environmental friendliness, and reaching remote locations cost-efficiently. Limitations include strict regulatory restrictions and the high cost of driverless vehicles, while many technological challenges still exist.
  • Ground AVs (pods/robots): deliver parcels to the doorstep or at the curb. These pods are relatively slow, at 5 to 10 km/h, and use the sidewalk rather than the street to reach their destination. Fast, cheap, flexible, and environmentally friendly delivery, with fewer safety and privacy issues, as well as higher capacity compared to drones. Limitations include delivery distance and speed limitations, not being able to operate in crowded areas, theft issues, and limited ability to overcome obstacles on their way.
  • Drones: autonomous aircrafts carrying parcels to their destination along the most direct route and at relatively high average speed. Fast, flexible, and environmentally friendly delivery option that can reach remote or hard-to-reach locations in an easier and cheaper way. Drone delivery has the potential to reduce traffic, or at least not add more traffic to the road network. On the other hand, there are regulatory restrictions, safety and privacy issues, capacity limitations, delivery distance limitations, and a plethora of remaining technological challenges to be addressed.
Table 1 presents the considered set of SP experiment attributes and their levels [41], while Figure 1 presents a screen of the actual experiment.
Finally, the last part recorded the socio-economic characteristics of the respondents, by collecting personal information, including: type of current area of residence; type of apartment; car ownership in the household; car fuel type; gender; age; education level; and employment status.
The online survey was targeted at all internet users who performed online purchases, however, the analysis in section five refers to participants whose country of origin was Greece. The participants were reached by a two-step procedure. Firstly, the survey link was posted on the social media accounts of the Transportation and Decision-Making Laboratory (TRANSDEM) of the Department of Shipping, Trade and Transport of the University of the Aegean, on LinkedIn Transportation-related forums, and it was also sent to the laboratory’s stakeholders’ mailing list. Then, based on the first step respondents’ characteristics, targeted emails to specific misrepresented categories were sent, to reduce sampling bias and compose a neutral sample of e-buyers.

5. Analysis

5.1. Descriptive Statistics

Descriptive statistics were used to demonstrate the sociodemographic and general characteristics of the 336 respondents (Table 2). Specifically, 58% of them were women, and 41% of them were men. Most of the respondents belonged to the age groups 18–25 years old (30%) and >45 years old (27%). A Master’s degree or Doctorate was held by 43%, while over half of the respondents (51%) had a full-time job. Focusing on the employed participants, 25% and 21% of them were occupied in higher and intermediate, respectively, managerial, administrative, and professional work. Moreover, the majority of the respondents used mobile applications, e.g., texting (72%) and social network websites (75%), on a daily basis, while using their smartphones (86%) and computer (71%). Interestingly, 40% of the respondents had never used a conventional phone in their life, while 61% had never used an MP3 player.

5.2. Preferences and Attitudes

This section aims to present insightful information about participants’ preferences and attitudes in regard to e-shopping. The way the average customer buys something today has profoundly changed, as compared to some years ago. E-shopping is preferred to shopping in physical stores, due to better prices, greater variety of products, and richer information about the products to be purchased, e.g., analytic descriptions, comparison prices among vendors, etc. However, in addition to the products themselves, businesses often take on another liability, which has to do with the fulfillment of orders, meaning assuring the delivery of the product without issues, i.e., loss of packages, theft, delays, etc. Analytically, companies and shipping providers develop methods and work on ideas that mainly have to do with creating additional choices for customers, with regard to how they can accept their deliveries in a more convenient, secure, and reliable way. To better understand how this can be achieved, and what it actually means in practice for LMD modes—as part of an innovative delivery service system—the exploration of the preferences and attitudes of customers in regard to e-shopping, were explored.
Table 3 indicates how often the participants used home deliveries when shopping online. Of the participants: 43% had purchased small-size products (e.g., books, electronics, toys, gym instruments, CDs) only a few times in a year; 42% purchased no large-size products (e.g., TV, furnishing, washing machine) per year, while 45% did so less than once per year; 44% purchased clothes or shoes a few times per year; while 74% and 14% had never, or fewer than once per year, respectively, purchased high-value products (e.g., jewels, luxury products). 48% of the participants had never ordered food from a restaurant online, while 32% and 23% had purchased food from a supermarket only a few times per year and a few times per month, respectively.
A generic observation is that there is still room for increasing the frequency of home deliveries when shopping online. This shows the potential, but also the pressure which will be put on courier companies, considering that e-shopping accounted for nearly 20% of the total retail sales in 2021, while in 2024 the figure is expected to reach 21.8% [42].
Large-size and high-value products set a strong example that consumers still prefer to shop in-store, or at least to pick up their products from physical stores, no matter the convenience of having these products delivered to their doorsteps. This, of course, cannot be attributed solely to potential concerns about the logistics; however, questions such as who is going to deliver and actually give the product to the final recipient, or how the product can be returned, seem to affect their decisions. In this respect, Figure 2 provides insights into the most recent online shopping experiences of respondents, as was recorded in the analysis of the responses.
According to Figure 2 (above): 61% of the respondents were given the product by the delivery vehicle driver; 13% by the postman; 12% picked their products up from a pick-up point (smart lockers, micro hub, etc.); while 6% were given the product by the porter. Furthermore, 5% of the respondents stated that their product was given to them by a neighbor, and 3% by a drone—however, it is not known whether this percentage regarded attended deliveries or unattended (for instance a drop-off on the balcony). Furthermore, almost one out of three respondents (31%) did not know how to return the product, if necessary. Returning the product was a process which was considered by many online customers to be too complex or time consuming [43]; see Figure 2 (above).
As regards the respondents’ perceptions of importance when buying a product online (Table 4), 65% (27% + 38%) perceived quality to be at least a very important aspect, while equal shares of respondents—41% (6% + 23% + 12%) and 40% (18% + 14% + 8%)—perceived geography (e.g., local products) to be at least a slightly important and a moderately important aspect, respectively. This contrasted with the general consumer trend towards preferring local products over non-local alternatives, as reported in Zeugner-Roth, et al. [44].

5.3. Model Estimation Results

This section presents the model estimation results (see Table 5 below). The model was estimated using Python Biogeme [45]. The presented model was a mixed multinomial logit that captured taste heterogeneity, correlation among alternatives, and correlation from repeated observations from the same individuals in the data set. Several other model specifications were investigated, but the presented model was selected based on goodness-of-fit and cost-efficiency.
From the Alternative Specific Coefficients (ASC), it can be deduced that, overall, the Traditional Courier option was a priori preferred. This meant that the respondents were still reluctant to use the emerging delivery services. The coefficients associated with the delivery cost were negative and significant, as expected, meaning that the higher the cost, the less attractive was the alternative. The cost coefficient associated with the drone alternative did not vary across the population, as indicated by the non-significant coefficient of the respective standard deviation, while the cost associated with droids, autonomous vans, and traditional courier services, showed evidence of taste variation among the population.
The sign of the delivery time coefficients was also negative and significant, as expected. Furthermore, those individuals that waited for more than two days to acquire their online orders, as well as those that usually purchased online food and food-related products, were more likely to use traditional courier services. In addition, when the probability of product damage during transport increased, the likelihood of an individual choosing droid delivery decreased.
The only socio-economic characteristic that affected the decision-making was gender (Female), which was specific to the Traditional Courier service. The sign of the estimated coefficient was positive, indicating that females were less likely to adopt one of the emerging delivery services.
The estimated value of the error component (σclassic) was significant, and thus captured the correlation between the autonomous-van-assisted and the traditional courier services. Moreover, the agent effect was significant for the Drone and Courier alternatives, capturing the intrinsic correlations between observations of the same individual.
Many of the attributes included in the design of the SP experiment were not found to be statistically significant. It is expected that, with an increased sample size, some of these parameters could prove to be significant.

6. Concluding Discussion

This paper focuses on consumers’ e-commerce behavior and the adoption of alternative AV modes for last-mile delivery services. Such services include drones, autonomous trucks/vans, and autonomous/driverless pods. The respondents showed: (i) no particular interest in deliveries with AVs as an alternative delivery method; (ii) a preference for traditional delivery over new mobility concepts; and (iii) a reluctance to pay for access to more advanced last-mile delivery modes/services. These findings are in line with the conclusions stemming from similar recent studies [46], and can be attributed mainly to the following reasons: (1) new technological solutions require many changes across the supply chain for their deployment, which are—more often than not—regarded with skepticism by all stakeholders [47]; and (2) this technology is at an early stage, and thus the public has still to form an opinion [48]. Focusing on the Greek context, the development of fully autonomous ground vehicles on city roads, for LMD purposes, requires a harmonious smart city environment that enables cooperative intelligent systems that support the concept of vehicle automation. However, the establishment of such systems requires a minimum level of elements—sensors, actuators, telematics—that are rare in Greek cities. Thus, a more mature system, with regard to the concept of automation—i.e., embedded centralized systems with highly distributed systems, which are visible and are applied to aid peoples’ everyday commute—could potentially strengthen interest in AV deliveries [49]. Moreover, large scale implementation issues, such as drone traffic management, and a series of other obstacles, i.e., theft, weather impact, drone abuse, range, power lines, etc., hamper progress towards the implementation of such solutions [50].
From a different perspective, the conclusions show how crucial is customer feedback at an early stage, so as to inform improvements to the design of the services before wider adoption. Furthermore, it is important to promote the benefits of innovative modes and services for LMD, in order to increase public awareness and receptivity in Greece.
Interesting conclusions can be drawn from the study, about the modern-day consumers and their characteristics. The statistical analysis showed that there is a trend towards balancing between digital and physical shopping experiences. However, for specific types of products, this trend moves at a slower pace. Analytically, the products with the highest online shopping frequency—2–3 times a week—were small-size products, while 3% of the respondents ordered online food from a restaurant every day. On the contrary, the products with the least frequency were high-value products, denoting respondents’ hesitance to replace the physical shopping experience with online shopping, at least for certain types of products.

6.1. Limitations

The dissemination of the SP questionnaire and the collection of the data was completed only a few days after the beginning of the COVID-19 crisis, which created additional growth in e-commerce and respective demand growth for faster at-home deliveries. Thus, the data did not fully capture the recent shift in the market, brought about by COVID-19. According to UNCTAD [51], COVID-19 has radically changed online shopping, and it is believed that these observed demand shifts are likely to have long-lasting effects on e-commerce [52]. The period in which the data was collected clearly impacted also on the familiarization of the respondents with the more recent delivery technologies and, thus, on accepting or choosing them. In the first months of 2020 in Greece, such solutions might have been perceived as futuristic solutions, with no real application in the following decade as, except for two pilot programs that were using drones for delivering pharmaceutical products to remote areas (islands), to the best of our knowledge such solutions remained unknown to the wider audience.
Another limitation of the survey has to do with the participants. The presented analysis was based only on a subset of the participants that responded to the survey—Greeks. Specifically, this subset refers to people whose country of origin is Greece (“Country of origin” is the first question in the SP questionnaire’s last part). This selection, however, included people that may have been living outwith Greece, but who were Greek. Thus, there may have been a number of participants whose last delivery (see Figure 2) was performed by drones or other delivery methods, even though these methods are not yet deployed in Greece (at least for commercial use).

6.2. Future Research

Future research could be directed into transforming the knowledge collection into business models for innovative last-mile delivery service provision. Another future direction would be to translate, and slightly amend, a few parts of the SP questionnaire to allow a more universal and up-to-date data collection.
The next step of this research is to produce comparative results among all participants of the questionnaire, e.g., by country of origin, which will allow cross-analysis of the different discrete choice models as regards the acceptability of, and willingness to pay for, innovative delivery services, as well as interpretation of the results with respect to the different logistics profiles and sociodemographic characteristics.

Author Contributions

Conceptualization, A.P.; methodology, A.P., A.T. and I.K.; software, A.T. and I.T.; validation, A.P., A.T. and I.K.; formal analysis, A.P.; investigation, A.P. and I.T.; resources, A.P.; data curation, A.T. and I.K.; writing—original draft preparation, A.T. and I.K.; writing—review and editing, A.P.; visualization, I.K.; supervision, A.P.; project administration, A.P. and I.P.; funding acquisition, A.P., A.T., I.T. and I.P. All authors have read and agreed to the published version of the manuscript.

Funding

This research is co-financed by Greece and the European Union through the operational programme “Competitiveness, Entrepreneurship and Innovation” in the context of the project “Intelligent Research Infrastructure for Shipping, Supply Chain, Transport and Logistics (ENIRISST+)” (MIS-5047041).

Institutional Review Board Statement

Ethics approval was not sought for the present study as the questionnaire was designed and disseminated before the appoitment of the Research Ethics Committee at the University of the Aegean on 26 March 2019 (https://www.ru.aegean.gr/elke_website/ehde/ehde) accessed on 31 March 2022.

Informed Consent Statement

Informed consent was obtained from all subjects involved in the study.

Conflicts of Interest

The authors declare no conflict of interest.

References

  1. Eurostat. E-Sales and Turnover from E-Sales, EU-27, 2010 to 2019. Available online: https://ec.europa.eu/eurostat/statistics-explained/index.php?title=E-commerce_statistics#Web_sales_dominant_in_all_EU_countries (accessed on 18 July 2021).
  2. Statista. Number of Internet Users in EU Countries as of December 2020. Available online: https://www.statista.com/statistics/252753/number-of-internet-users-eu-countries/ (accessed on 18 July 2021).
  3. Eurostat. E-Commerce Statistics for Individuals. Available online: https://ec.europa.eu/eurostat/statistics-explained/index.php?title=E-commerce_statistics_for_individuals (accessed on 18 July 2021).
  4. Iwan, S.; Kijewska, K.; Lemke, J. Analysis of parcel lockers’ efficiency as the last mile delivery solution–the results of the research in Poland. Transp. Res. Procedia 2016, 12, 644–655. [Google Scholar] [CrossRef] [Green Version]
  5. Russo, F.; Comi, A. Urban Freight Transport Planning towards Green Goals: Synthetic Environmental Evidence from Tested Results. Sustainability 2016, 8, 381. [Google Scholar] [CrossRef] [Green Version]
  6. Paddeu, D.; Calvert, T.; Clark, B.; Parkhurst, G. New Technology and Automation in Freight Transport and Handling Systems. 2019. Available online: https://assets.publishing.service.gov.uk/government/uploads/system/uploads/attachment_data/file/781295/automation_in_freight.pdf (accessed on 19 June 2019).
  7. Choi, J.K.; Ji, Y.G. Investigating the importance of trust on adopting an autonomous vehicle. Int. J. Hum. Comput. Interact. 2015, 31, 692–702. [Google Scholar] [CrossRef]
  8. Körber, M.; Baseler, E.; Bengler, K. Introduction matters: Manipulating trust in automation and reliance in automated driving. Appl. Ergon. 2018, 66, 18–31. [Google Scholar] [CrossRef] [PubMed] [Green Version]
  9. Lee, J.D.; See, K.A. Trust in automation: Designing for appropriate reliance. Hum. Factors 2004, 46, 50–80. [Google Scholar] [CrossRef] [PubMed]
  10. Noy, I.Y.; Shinar, D.; Horrey, W.J. Automated driving: Safety blind spots. Saf. Sci. 2018, 102, 68–78. [Google Scholar] [CrossRef]
  11. Pavlou, P.A. Consumer acceptance of electronic commerce: Integrating trust and risk with the technology acceptance model. Int. J. Electron. Commer. 2003, 7, 101–134. [Google Scholar]
  12. Shariff, A.; Bonnefon, J.F.; Rahwan, I. Psychological roadblocks to the adoption of self-driving vehicles. Nat. Hum. Behav. 2017, 1, 694. [Google Scholar] [CrossRef] [PubMed]
  13. Siebert, F.W.; Oehl, M.; Höger, R.; Pfister, H.-R. Discomfort in automated driving: The disco-scale. In Communications in Computer and Information Science; Springer: Berlin, Germany, 2013; Volume 374, pp. 337–341. [Google Scholar] [CrossRef]
  14. Xu, Z.; Zhang, K.; Min, H.; Wang, Z.; Zhao, X.; Liu, P. What drives people to accept automated vehicles? Findings from a field experiment. Transp. Res. Part C Emerg. Technol. 2018, 95, 320–334. [Google Scholar] [CrossRef]
  15. U.S. Federal Highway Administration Office. Analysis Modeling and Simulation Project. 2019. Available online: https://highways.dot.gov/research/operations/analysis-modeling-simulation/ams-projects (accessed on 15 January 2021).
  16. UK Department for Transport. Research on the Impacts of Connected and Autonomous Vehicles (CAVs) on Traffic Flow. 2016. Available online: https://assets.publishing.service.gov.uk/government/uploads/system/uploads/attachment_data/file/530093/im-698pacts-of-connected-and-autonomous-vehicles-on-traffic-flow-technical-report.pdf (accessed on 15 January 2021).
  17. Drive2theFuture. Needs, Wants and Behaviour of “Drivers” and Automated Vehicle Users Today and into the Future. 2019. Available online: http://www.drive2thefuture.eu/ (accessed on 20 December 2020).
  18. Avenues. The Use of Autonomous Vehicles in Public Transport has the Potential to Revolutionise the Complete Landscape of Public Transport. 2019. Available online: https://h2020-avenue.eu/ (accessed on 17 December 2020).
  19. PAsCAL. Enhance Driver Behaviour and Public Acceptance of Connected and Autonomous Vehicles. 2019. Available online: https://www.pascal-project.eu/project (accessed on 15 December 2020).
  20. SUaaVE. Supporting Acceptance of Automated Vehicle. 2019. Available online: https://www.suaave.eu/ (accessed on 15 December 2020).
  21. Trustonomy. Raise the Trust of Automated Vehicles. 2019. Available online: https://h2020-trustonomy.eu/ (accessed on 16 December 2020).
  22. Co-Exist. Working towards a Shared Road Network. Enabling Cities to Get “Automation-Ready”. 2019. Available online: https://www.h2020-coexist.eu/ (accessed on 18 December 2020).
  23. Marsden, N.; Bernecker, T.; Zöllner, R.; Sußmann, N.; Kapser, S. BUGA:Log—A real-world laboratory approach to designing an automated transport system for goods in Urban Areas. In Proceedings of the IEEE International Conference on Engineering, Technology and Innovation (ICE/ITMC), Stuttgart, Germany, 17–20 June 2018; pp. 1–9. [Google Scholar]
  24. Pani, A.; Mishra, S.; Golias, M.M.; Figliozzi, M. Evaluating public acceptance of autonomous delivery robots during COVID-19 pandemic. Transp. Res. Part D Transp. Environ. 2020, 89, 102600. [Google Scholar] [CrossRef]
  25. Kapser, S.; Abdelrahman, M. Acceptance of autonomous delivery vehicles for last-mile delivery in Germany–Extending UTAUT2 with risk perceptions. Transp. Res. Part C Emerg. Technol. 2020, 111, 210–225. [Google Scholar] [CrossRef]
  26. Paddeu, D.; Parkhurst, G. Chapter Twelve—The potential for automation to transform urban deliveries: Drivers, barriers and policy priorities. In Advances in Transport Policy and Planning; Milakis, D., Thomopoulos, N., van Wee, B., Eds.; Academic Press: Cambridge, MA, USA, 2020; Volume 5, pp. 291–314. [Google Scholar]
  27. Kim, S.H. Choice model-based analysis of consumer preference for drone delivery service. J. Air Transp. Manag. 2020, 84, 101785. [Google Scholar] [CrossRef]
  28. Van Meldert, B.; De Boeck, L. Introducing Autonomous Vehicles in Logistics: A Review from a Broad Perspective; Research Report; KU Leuven: Leuven, Belgium, 2016. [Google Scholar]
  29. Rohleder, B. From E-Commerce to M-Commerce. 2016. Available online: https://www.bitkom.org/Presse/Anhaenge-an-PIs/2016/Oktober/Bitkom-Pressekonferenz-E-Commerce-06102016-Praesentation-FINAL-OHNE.pdf (accessed on 3 July 2021).
  30. Joerss, M.; Scroeder, J.; Neuhaus, F.; Klink, C.; Mann, F. Parcel Delivery. The Future of Last Mile. Travel, Transport and Logistics, McKinsey & Company. 2016. Available online: https://www.mckinsey.com/~/media/mckinsey/industries/travel%20transport%20and%20logistics/our%20insights/how%20customer%20demands%20are%20reshaping%20last%20mile%20delivery/parcel_delivery_the_fu-625ture_of_last_mile.ashx (accessed on 2 July 2021).
  31. Eurobarometer. Attitudes towards the Impact of Digitalisation and Automation on Daily Life. Special Eurobarometer 460. 2017. Available online: https://ec.europa.eu/digital-single-market/en/news/attitudes-towards-impact-digitisation-and-automation-daily-life (accessed on 1 September 2020).
  32. Prümm, D.; Kauschle, P.; Peiseler, H. Avant-Garde in Last Mile—New Ways of Urban Logistics. 2017. Available online: https://www.pwc.de/de/transport-und-logistik/pwc-studie-aufbruch-auf-der-letzten-meile.pdf (accessed on 4 July 2018).
  33. Ignat, B.; Chankov, S. Do e-commerce customers change their preferred last-mile delivery based on its sustainability impact? Int. J. Logist. Manag. 2020, 31, 521–548. [Google Scholar] [CrossRef]
  34. Wang, X.; Yuen, K.-F.; Wong, Y.D.; Li, K.X.; Tran, T.M. Co-creating E-commerce Last-mile Logistics with Consumers: A Conceptual Framework and Future Research Agenda. In Key Challenges and Opportunities for Quality, Sustainability and Innovation in the Fourth Industrial Revolution; World Scientific: Singapore, 2021; pp. 177–202. [Google Scholar]
  35. Mangiaracina, R.; Perego, A.; Seghezzi, A.; Tumino, A. Innovative solutions to increase last-mile delivery efficiency in B2C e-commerce: A literature review. Int. J. Phys. Distrib. Logist. Manag. 2019, 49, 901–920. [Google Scholar] [CrossRef]
  36. Ben-Akiva, M.; Bierlaire, M. Discrete choice models with applications to departure time and route choice. In Handbook of Transportation Science. International Series in Operations Research & Management Science, 2nd ed.; Hall, R.W., Ed.; Springer: Boston, MA, 2013; Volume 56, pp. 7–38. [Google Scholar] [CrossRef]
  37. Train, K.E. Discrete Choice Methods with Simulation, 1st ed.; Cambridge University Press: Cambridge, UK, 2013. [Google Scholar]
  38. SAE International. Taxonomy and Definitions for Terms Related to Driving Automation Systems for on-Road Motor Vehicles. Available online: https://www.sae.org/standards/content/j3016_201806/ (accessed on 27 March 2021).
  39. M3Consultancy. Not Drones, but AGVs Will Forever Change Last-Mile Parcel Delivery. Available online: https://www.m3consultancy.nl/blog/not-drones-but-agvs-will-forever-change-last-mile-parcel-delivery (accessed on 20 May 2022).
  40. OptimoRoute. What Is Last Mile Delivery? Costs & How to Optimize. Available online: https://optimoroute.com/last-mile-delivery/ (accessed on 27 May 2022).
  41. Reis, V.; Macário, R. Intermodal Freight Transportation; Elsevier: Amsterdam, The Netherlands, 2019. [Google Scholar]
  42. Statista. E-Commerce Share of Total Global Retail Sales from 2015 to 2024. Available online: https://www.statista.com/statistics/534123/e-commerce-share-of-retail-sales-worldwide/ (accessed on 30 November 2021).
  43. Rintamäki, T.; Spence, M.T.; Saarijärvi, H.; Joensuu, J.; Yrjölä, M. Customers’ Perceptions of returning items purchased online: Planned versus unplanned product returners. Int. J. Phys. Distrib. Logist. Manag. 2021, 51, 403–422. [Google Scholar] [CrossRef]
  44. Zeugner-Roth, K.P.; Žabkar, V.; Diamantopoulos, A. Consumer ethnocentrism, national identity, and consumer cosmopolitanism as drivers of consumer behavior: A social identity theory perspective. J. Int. Mark. 2015, 23, 25–54. [Google Scholar] [CrossRef]
  45. Bierlaire, M. PythonBiogeme: A short introduction. Report TRANSP-OR 160706, Series on Biogeme. In Transport and Mobility Laboratory, School of Architecture, Civil and Environmental Engineering, Ecole Polytechnique Fédérale de Lausanne; Switzerland; 2016; Available online: https://transp-or.epfl.ch/documents/technicalReports/Bier16a.pdf (accessed on 11 April 2022).
  46. Karakikes, I.; Nathanail, E. Using the Delphi Method to Evaluate the Appropriateness of Urban Freight Transport Solutions. Smart Cities 2020, 3, 1428–1447. [Google Scholar] [CrossRef]
  47. World Economic Forum. The Delivery Revolution: Are People Ready to Embrace Drones and Robots? 2021. Available online: https://www.weforum.org/agenda/2021/11/future-tech-delivery-logistics-drone-robots/ (accessed on 8 July 2022).
  48. Liu, H.; Yang, R.; Wang, L.; Liu, P. Evaluating initial public acceptance of highly and fully autonomous vehicles. Int. J. Hum. Comp. Inter. 2019, 35, 919–931. [Google Scholar] [CrossRef]
  49. Kuru, K.; Khan, W. A Framework for the Synergistic Integration of Fully Autonomous Ground Vehicles with Smart City. IEEE Access 2021, 9, 923–948. [Google Scholar] [CrossRef]
  50. Palmer, A. Amazon Wins FAA Approval for Prime Air Drone Delivery Fleet. 2020. Available online: https://www.cnbc.com/2020/08/31/amazon-prime-now-drone-delivery-fleet-gets-faa-approval.html (accessed on 14 October 2020).
  51. UNCTAD. COVID-19 Has Changed Online Shopping Forever, Survey Shows. 2020. Available online: https://unctad.org/news/covid-19-has-changed-online-shopping-forever-survey-shows (accessed on 22 January 2021).
  52. Organisation for Economic Co-Operation and Development. E-Commerce in the Times of COVID-19. 2021. Available online: https://read.oecd-ilibrary.org/view/?ref=137_137212-t0fjgnerdb&title=E-commerce-in-the-time-of-COVID-19 (accessed on 22 January 2021).
Figure 1. SP experiment for future last-mile delivery logistics services.
Sustainability 14 08976 g001
Figure 2. (a) Who gave you the product? (b) How were you able to return the product?
Sustainability 14 08976 g002
Table 1. Attributes and Levels of the SP Experiment.
AttributeAlternatives’ Attribute Levels
Traditional ServiceGround AVs (with Assisted Delivery)Ground AVs (Pods/Robots)Drones
Delivery time (after product order)
  • Next day delivery
  • >2 days later
  • Same day
  • 2 days later
  • 2 days later
  • >2 days later
  • 30 min
  • 2 h
  • 4 h
Delivery cost (in €)
  • 0
  • 12
  • 0
  • 12
  • 14.4
  • 18
  • 36
Pick-up location
  • Home
  • Work
  • Home
  • Work
  • Specific city pick-up location
  • Sidewalk curb
  • Drop at the balcony
  • Sidewalk curb
Time to pick up the product
  • 0
  • Bike/walking: 5 min
  • Bike/walking: 15 min
  • Drive: 10 min
  • Bike/walking: 30 min
  • Drive: 20 min
  • Bike/walking: 5 min
  • Bike/walking: 15 min
  • Drive: 30 min
  • Bike/walking: 15 min
  • Bike/walking: 30 min
Security: Probability of vandalism or theft
  • 0/10 deliveries
  • 1/10 deliveries
  • 2/10 deliveries
  • 0/10 deliveries
  • 1/10 deliveries
  • 2/10 deliveries
  • 0/10 deliveries
  • 1/10 deliveries
  • 2/10 deliveries
  • 0/10 deliveries
  • 1/10 deliveries
  • 2/10 deliveries
Parcel tracking
  • Real-time tracking
  • Update in 6-h intervals
  • Real-time tracking
  • Update in 6-h intervals
  • Real-time tracking
  • Update in 6-h intervals
  • Real-time tracking
  • Update in 6-h intervals
Table 2. Sample Characteristics.
VariablesLevel%
Age<183
18–2530
26–3518
36–4622
>4527
GenderFemale58
Male41
I prefer not to say1
Employment statusEmployed full time51
Employed part-time16
Unemployed, Retired,5
Student, Housewife/Houseman23
Other5
Education levelLess than high school3
High school graduate17
Vocational training college9
Bachelor’s degree28
Master’s degree or Doctorate43
Table 3. Frequency of e-shopping home delivery use.
NeverFewer than Once per YearA Few Times per YearA few Times per MonthOnce a Week2–3 Times a WeekEveryday
Small-size products 19%19%43%22%4%3%0%
Large-size products 242%45%10%1%1%0%0%
Clothes or shoes21%22%44%10%3%0%0%
High-value products 374%14%9%3%0%0%0%
Food (supermarket)13%12%32%23%16%3%1%
Food (restaurant)48%17%16%12%6%1%0%
1 books, electronics, toys, gym instruments, CDs, etc. 2 TV, furnishing, washing machine, etc. 3 Jewels, luxury products.
Table 4. Importance in regard to online shopping home delivery use.
Quality/Price RatioGeography 1Low Delivery Time 2Customer CareBrandGreen Production 3Green LogisticsGreen Packaging 4
Not at all4%6%3%3%8%5%8%6%
Low0%23%6%1%10%17%14%16%
Slightly3%12%8%3%12%14%14%12%
Neutral8%18%18%22%25%14%26%22%
Moderately21%18%30%32%27%30%19%23%
Very27%14%29%30%17%12%9%10%
Extremely38%8%6%9%1%8%9%10%
1 local products; 2 1–2 days; 3 manufacturing, organic food; 4 recyclable/reusable.
Table 5. Choice Model Estimation Results.
Variable NameSpecific to UtilityCoef.t-Test
Alternative-specific constants
ASC_Drone DeliveryDrone−1.580−1.93
ASC_Droid Delivery Droid−1.420−2.36
ASC_Traditional Courier Traditional Courier0.3760.63
Delivery Cost
Cost1_mean Drones−0.060−1.94
Cost1_stdDrones−0.023−0.61
Cost2_meanDroid, Autonomous Van, Traditional Courier −0.152−2.75
Cost2_stdDroid, Autonomous Van, Traditional Courier0.1992.76
Delivery Time
Delivery Time1Traditional Courier−0.032−3.77
Delivery Time2Drones, Droid, Autonomous Van −0.015−2.81
Additional Variables
Usual Delivery Time: More than 2 daysTraditional Courier0.8051.54
Type of Commodity: FoodDrones, Droid, Autonomous Van−16.7−6.68
Gender: FemaleTraditional Courier0.7911.58
Probability of product damage during transport (continuous)Droid−5.55−1.71
σclassicAutonomous Van, Traditional Courier1.883.35
σpanel1Drone2.343.32
σpanel2Traditional Courier1.503.98
Summary Statistics
Draws10,000
Initial Log-Likelihood−429.052
Final Log-Likelihood−341.873
Publisher’s Note: MDPI stays neutral with regard to jurisdictional claims in published maps and institutional affiliations.

