Abstract
International diversification has become a crucial measure for firms to realize sustainable development. However, previous studies have drawn inconsistent conclusions on the sustainable performance impact of international expansion. This paper examines the relationships among international diversification, capabilities, and sustainable performance. We provide a theoretical perspective of dynamic capabilities to uncover the impact mechanism of international diversification on firms’ economic and environmental performance. Based on data from Chinese listed manufacturing firms operating overseas, the findings show that international diversification is significant for firms’ sustainable development, and its effect on economic performance and environmental performance is mediated by adaptive capability and innovation capability. The implications for theoretical development and operating practice are discussed.
1. Introduction
The rapid development of the past few decades tells us that firms greatly destroy the environment in which we live while obtaining great economic benefits [1]. Therefore, people from all walks of life have reached a consensus that firms should not only ensure their current interests, but also attach importance to the impact of their own development on society and the environment, so as to achieve the goal of sustainable development [2]. Scholars have carried out a heated discussion on sustainable development in the last decades [3]. The research focus has changed from responding to the question of “why firms achieve sustainability” to “how firms achieve sustainability”. Early studies have uncovered the underlying logic of why firms implement sustainable strategy from the perspectives of environmental push and corporate pull. External environmental factors mainly include government regulatory power, industrial policy, and consumer demand [4,5,6], while internal pull factors are mainly concentrated at the level of top management teams and CEOs [7,8]. Recently, scholars have further turned their attention to the inside of the firm and tried to analyze how to realize sustainable development from the strategic level.
International diversification has started to attract the attention of scholars in the field of strategic management and international business [9,10,11]. Through international diversification, firms can make up for their shortcomings and break through resource and capability bottlenecks. However, the empirical research exploring the impact of international expansion on firms’ sustainable performance does not arrive at the same conclusion. Bojnec and Tomic [1] and Melane-Lavado et al. [12] argue that international expansion can positively contribute to firm’s sustainable performance. They contend that entering into international market helps firms achieve economies of scale, provides learning opportunities and access to resources which can finally improve financial returns and help design environmentally friendly new products. In contrast, some researchers document a negative effect of international expansion on firms’ sustainable development. Li and Niu [13] highlight how international expansion may diminish managers’ attention to long-term investments, which finally jeopardizes firms’ sustainable development. Park [14] presents that institutional distance may easily decouple the subsidiaries of multinational companies from the headquarters’ sustainable development policies and finally hinder the sustainable development of the entire firm group.
In this research, we are committed to reconciling the contradictory thoughts of international diversification on firms’ sustainable performance in two ways. On the one hand, we divide sustainable performance from the economic and environmental aspects [15], and test the impact of international diversification on both the environment and the economy. Existing research in the field of international diversification treats sustainable performance as a whole, ignoring to uncover the separate impact of international diversification on economic and environmental dimensions, so it is difficult to reveal the full picture of the sustainable impact of international expansion. On the other hand, we uncover the mediating mechanism by which international diversification affects sustainable performance from the capability perspective. Existing research explains the sustainable effect of international diversification mainly based on the resource-based view [1,12]. However, resources are clearly distinguishable from capabilities [16]. Grant [17] proposes that resources whether tangible or intangible are inputs used in the production process to convert into products or services. Merely owning resources does not ensure the obtainment of sustainable development because resources can be traded and transferred among different firms. The capability school believes that it is the capabilities that convert firms’ resources into competitive advantages, which in turn help firms to achieve sustainable development goals [18]. However, it is worth noting that ordinary capabilities can become outdated and firms may fall into a ‘competency trap’ if and when the external environment changes drastically. Wang and Ahmed [19] further highlight the importance of dynamic capabilities, which emphasize a firm’s unflagging effort to reconfigure resources and capabilities to adapt to the environmental change. Therefore, this study attempts to explain the mediating mechanism of international diversification affecting sustainable performance from the perspective of dynamic capabilities.
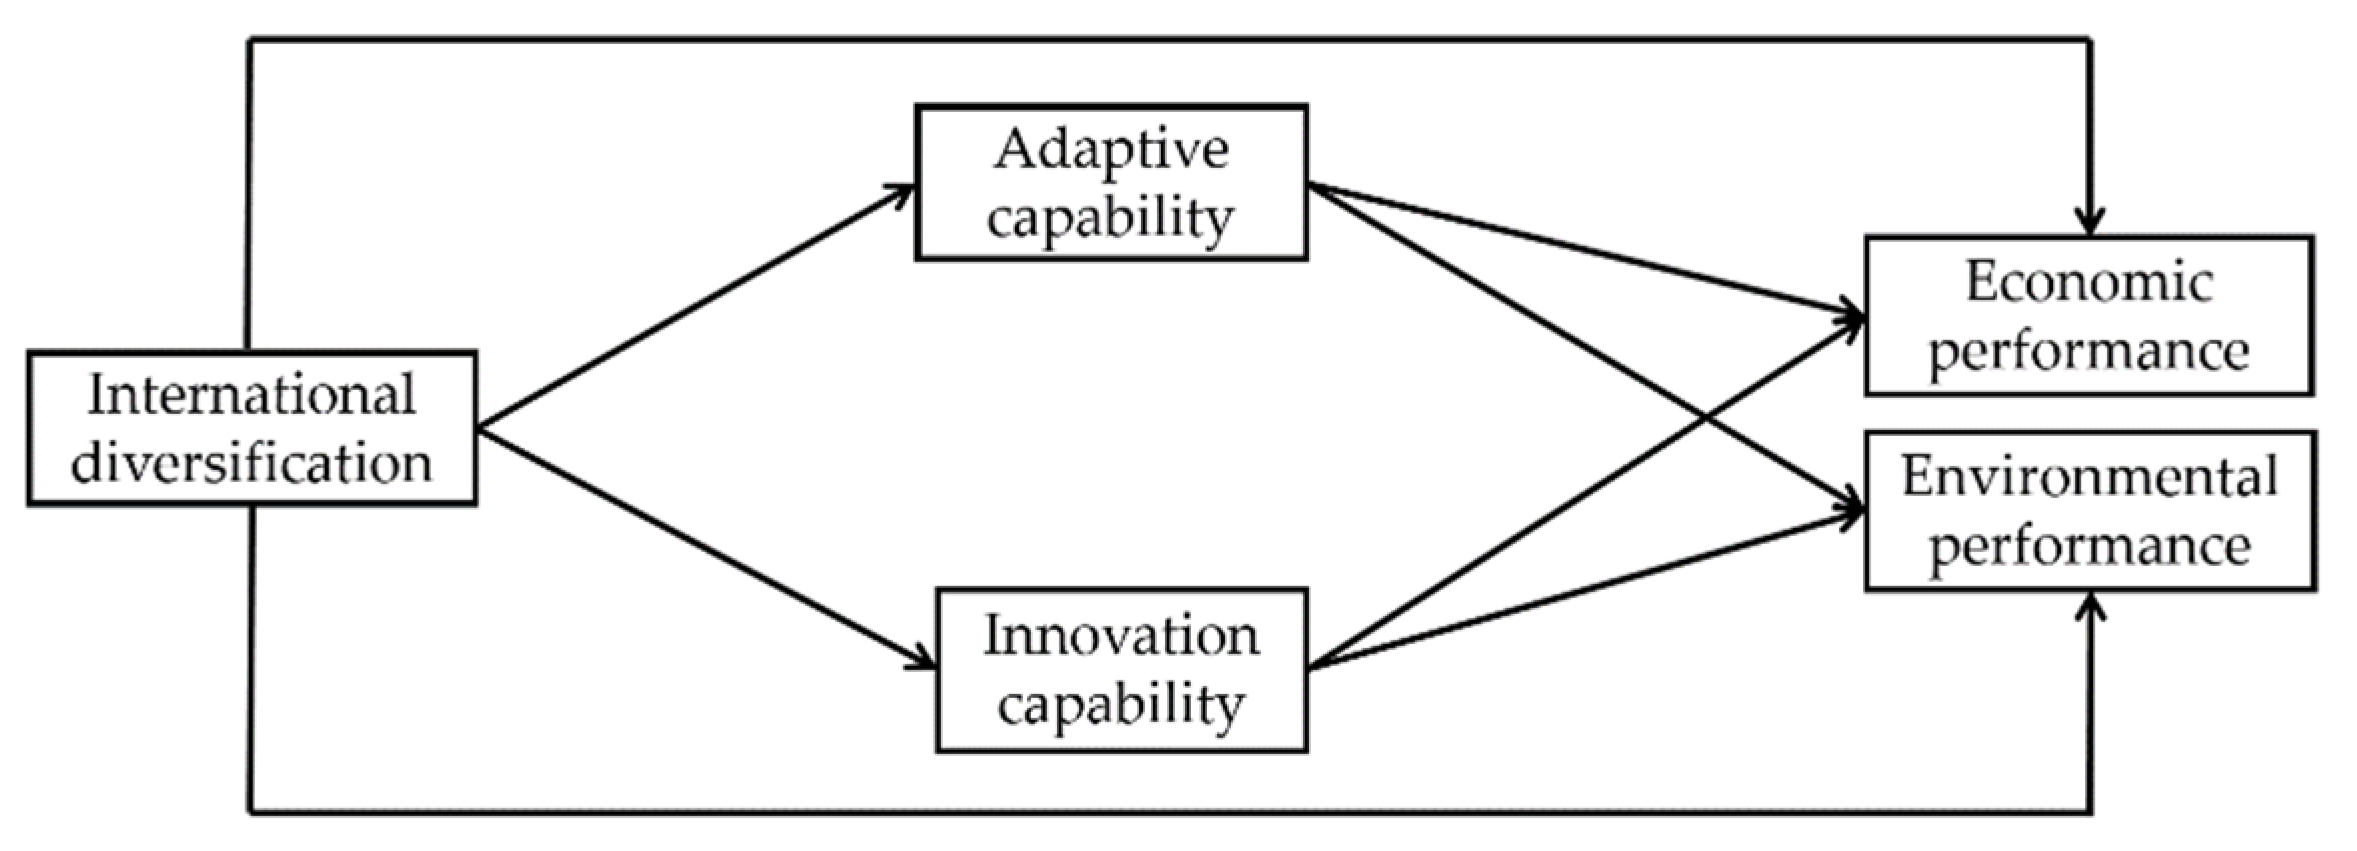
Based on the above view, this paper empirically tests the influence of international diversification on sustainable performance [15], and uses the dynamic capabilities perspective [19,20] to disclose the intervening mechanism of international diversification on sustainable performance. Based on the data of Chinese listed manufacturing firms entering into the international markets, we pay attention to two specific dynamic capabilities (adaptive capability and innovative capability), and their relationships to international diversification and sustainable performance (economic performance and environmental performance). Figure 1 presents our theoretical model of international diversification, dynamic capabilities and sustainable development.
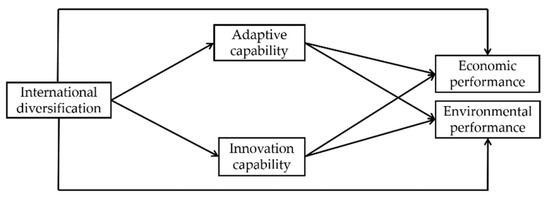
Figure 1.
Theoretical model.
2. Theory and Hypotheses
2.1. Two Component Factors of Dynamic Capabilities
Teece et al. [20] first proposes the concept of dynamic capabilities, and defines dynamic capabilities as a firm’s responding ability to deal with rapidly changing environments through integration of internal and external resources. Firms owning dynamic capabilities are capable of breaking through path dependence and dynamically adapting to external changes [21]. As an intangible asset, dynamic capabilities help organizations recombine resources repeatedly to form new resource combinations, and promote the renewal of organizational strategies [22]. Therefore, in the turbulent and changing international market environment, dynamic capabilities can facilitate enterprises to obtain sustainable competitive advantage [23]. According to the previous research results [19], this study believes that dynamic capabilities are high-order capabilities emphasizing a firm’s unflagging effort to renew, reconfigure and re-create resources and capabilities, which include two component factors: adaptive capability and innovation capability. Adaptive capability refers to the ability to identify and exploit market opportunities, identify and avoid risks [24]. Adaptive capability is external oriented dynamic capabilities, which stresses a firm’s ability to adapt itself in a timely fashion through flexibility of resources and aligning resources and capabilities with external environmental changes. Firms with high adaptability can quickly identify and elucidate opportunities and risks, and reallocate corporate resources to exploit the opportunity, avoid risks, and even turn crisis into opportunities. Innovation capability reflects firms’ new products and markets’ development ability, through aligning strategic innovation orientation with innovative behaviors and processes [19]. Innovation capability is internal oriented dynamic capabilities, which stresses the ability to transform internal resources and capabilities into new products through the creative combination of new and old knowledge components. Firms with high innovation capability are more willing and able to develop new products to meet customer needs. Therefore, dynamic capabilities play a vital role in the integration and reconfiguration of resources and abilities for firms to achieve sustainable development.
2.2. International Diversification and Sustainable Performance
2.2.1. International Diversification and Economic Performance
International diversification positively affects economic performance in three aspects. First, international diversification helps firms achieve economies of scale and scope [9]. Entering into the diversified international market means that firms can sell their own products in a number of different overseas markets and further expand their market space, integrate foreign companies in a wide geographical range to expand their product lines, which to a large extent can help firms achieve economies of scale and scope and finally recover innovation costs. Second, international diversification is beneficial for firms to obtain the proprietary hidden assets of foreign peers from multiple market and cultural background [25], such as advanced international management experience, technical know-how and technical knowledge, to improve their innovation efficiency and product competitiveness, and thus improve financial performance. Prior studies have revealed that companies with international diversification strategy can take advantage of resource differences and learning opportunities within the country to gain core strengths through interacting with diverse foreign firms [9]. Third, getting into international markets can diversify market risks, thus raising its economic performance levels [26]. Only selling in the domestic market is difficult to guarantee the stable growth of financial income, and entering the multi-country market can increase the sales space and minimize sales risk. Therefore, we propose the following hypothesis:
Hypothesis 1 (H1).
International diversification is positively correlated with economic performance.
2.2.2. International Diversification and Environmental Performance
International diversification positively affects the environmental performance of firms in three aspects. First, internationally diversified stakeholders can enhance firm’s environmental awareness [14]. Firms involved in diversified international market are more concerned with global stakeholders owning differentiated preference, and global stakeholders put more emphasis on sustainability than stakeholders within a narrow geographical range. This will raise the firms’ awareness of sustainable development. Second, the demonstration effect of internationally diversified counterparts can also remind firms to start paying attention to the development of environmentally friendly products [27]. International counterparts especially in developed countries start earlier in environmental protection and have built competitive advantages in sustainable development, which provides reference significance for firms to implement environment-friendly strategies. Third, complex supervision pressure from multiple countries overseas forces firms to pay attention to environmental issues [28]. Internationally diversified firms will face the supervision and attention of multi-supervision agencies in the broad international arena, such as well-known environmental organizations and media from different countries. This puts enormous pressure on and forces international firms to launch new environmentally friendly products and gain a reputation as an eco-friendly business. Therefore, we propose the following hypothesis:
Hypothesis 2 (H2).
International diversification is positively correlated with environmental performance.
2.3. The Mediating Role of Adaptive Capability
2.3.1. International Diversification and Adaptive Capability
Adaptive capability is defined as a firm’s ability to recombine new and original resources, which can be used to avoid risks and identify opportunities in a timely manner [19]. For one thing, international diversification can enhance environmental sensing capability [23]. Operating in multiple overseas markets brings a series of uncertainties, including not only heterogeneous customers, but also fierce conflicts caused by diverse institutional friction, horizontal competition and liability of foreignness [29]. This forces international firms to establish appropriate routines and procedures on opportunity identification and risk avoidance, thereby enhancing the ability to perceive opportunities and risks from the surrounding environment [30]. For another, a firm’s ability to allocate resources can be facilitated by international diversification [23]. After identifying opportunities and risks in multinational markets, firms need to allocate resources to take advantage of these opportunities or resolve these risks [31]. Repeated resource allocation behaviors will inevitably help firms establish proper routines and procedures in seizing and capitalizing on useful information, thereby improving their adaptive capabilities. We propose the hypothesis:
Hypothesis 3 (H3).
International diversification is positively correlated with adaptive capability.
2.3.2. Adaptive Capability and Sustainable Performance
(1) Adaptive capability and economic performance
When a firm has strong adaptive capability, it can accurately identify and seize opportunities in the drastic changes, and at the same time quickly adjust strategic decisions to solve crises when risks come, finally improving financial performance. On the one hand, adaptive capability helps firms perceive opportunities and threats in the international market, laying the foundation for taking advantage of international opportunities and avoiding heavy losses [30]. Firms with stronger adaptive capability tend to be active listener and are more capable of scanning the environment. The information gathered during the search process can help companies develop more alternative options for identifying changes in the competitive environment [25]. Strong adaptive capability can help internationally diversified firms predict the future market and achieve financial performance that exceeds that of competitors [24]. On the other hand, strong adaptive capability is beneficial for firms to regularly upgrade and rebuild their original basic capabilities, and to reconfigure and update new and old resources, so that they can respond quickly to environmental changes in a timely manner [19]. Strong adaptability is helpful for firms to respond quickly when they perceive international opportunities and risks, and to grasp market development opportunities or avoid risks in a timely manner, thereby improving financial performance [31]. Therefore, this study proposes the following hypothesis:
Hypothesis 4 (H4).
Adaptive capability is positively correlated with economic performance.
(2) Adaptive capability and environmental performance
Adaptive capability affects environmental performance from the following two aspects. On the one hand, strong adaptive capability guarantees that firms can use various search tools to scan information and knowledge on the international stage which provides better chance for firms to engage in environmental innovation. Strong adaptive capability means that a firm has a high level of environmental awareness, can quickly perceive the preferences of environmentally friendly consumers in different countries, and can obtain continuous feedback from leading customers to update technology and develop environmentally friendly products [32]. On the other hand, firms with strong adaptive capability can easily adapt to the laws and regulations of the international market, especially strict environmental regulations, so as to improve their environmental performance [33]. Strong adaptability make firms pay more attention to the regulatory requirements of the host country market [24], and have the ability and willingness to understand the corresponding international standards as soon as possible, carry out green production, and reduce the discharge of pollutants such as waste water and waste gas in production, so as to obtain the recognition of local consumers and government departments [19]. We put forward the hypothesis:
Hypothesis 5 (H5).
Adaptive capability is positively correlated with environmental performance.
2.4. The Mediating Role of Innovation Capability
2.4.1. International Diversification and Innovation Capability
International diversification positively affects firms’ innovation capability in three aspects. First, international diversification is beneficial to enhance innovation motivation [34]. Complex and changeable international environment with different cultures and systems reminds internationally diversified firms to pay more attention to market and product innovation. Second, international diversification brings diverse complementary innovation resources to firms [14], which stimulates firms to build new knowledge using procedures and new products development routines helpful for innovation capability enhancement. Chinese firms lag behind developed fellows in the reserves of innovation technologies and resources, and entering into diversified international markets provides a channel for them to search for novel knowledge and technologies from multiple market and cultural perspectives. Third, international diversification can provide learning opportunities for the development of new products [31]. Suppliers, consumers, government departments, and competitors in the vast international market can provide innovation sources for firms to introduce the best production methods, improve energy efficiency, optimize innovation process and develop innovative products [35]. We put forward the hypothesis.
Hypothesis 6 (H6).
International diversification is positively correlated with innovation capability.
2.4.2. International Diversification and Sustainable Performance
(1) Innovation capability and economic performance
Innovation capability not only helps firms improve resource utilization efficiency, but also brings environmental premiums and obtains various tax incentives, thereby improving economic performance. First, firms with strong innovation capability are capable of thinking of new ways to utilize new ideas and new knowledge gained from broad international markets, beneficial for new product launch and profit improvement. New technologies absorbed through diversified international market can also be effectively used to enhance resource utilization efficiency, save production costs, and thus increase profits [36]. Second, innovation will bring an environmental premium to firms [37]. Firms with strong innovation capability can produce environmentally friendly products according to consumers’ green needs, meet consumers’ green requirements, and then increase product prices and improve financial performance. Third, firms with strong innovation capability can obtain national tax incentives and improve financial performance [24]. Innovation can help firms reduce the discharge of pollutants such as waste gas and waste water in the production process, and obtain preferential policy support such as government subsidies or tax cuts, thereby increasing financial revenue [38]. Therefore, this paper proposes the following hypothesis:
Hypothesis 7 (H7).
Innovation capability is positively correlated with economic performance.
(2) Innovation capability and environmental performance
Innovation capability affects environmental performance in two ways. On the one hand, innovation capability is beneficial for firms to reduce pollutant emissions [39]. Firms with strong innovation capabilities are more capable of enhancing resource utilization through alternative energy and process innovation, improving environmental governance by adopting advanced production technologies, establishing more complete waste recycling and treatment systems, and ultimately improving environmental performance [40]. On the other hand, innovation capability is helpful for firms to establish a good green image and improve consumer satisfaction. Consumers generally believe that the products produced by companies with strong innovation capability are of higher quality conforming to environmental protection standards, so they will give more trust and recognition to highly innovative companies [41]. At the same time, it is easier for firms to complete the sustainable development goals of environmental protection, reduce the negative environmental reports in the media, and establish a greener image. We put forward the following assumptions:
Hypothesis 8 (H8).
Innovation capability is positively correlated with environmental performance.
3. Methodology
3.1. Sample
The samples selected for this study come from international manufacturing firms listed on the Shanghai and Shenzhen Stock Exchange. The reasons for selecting listed manufacturing firms are manifested in two ways. On the one hand, listed firms disclose more comprehensive information, and its data is easier to acquire. On the other hand, the degree of internationalization of Chinese manufacturing firms is generally higher than that of other firms, and they are also high energy consumption and high carbon emission firms, thereby show stronger demand for sustainable development. Under the policy orientation of carbon peaking and carbon neutrality, manufacturing firms urgently need to achieve sustainable development through internationalization. The sample data in this study mainly comes from the Wind database and the corporate social responsibility report disclosed in Hexun.com, with a time span of 6 consecutive years from 2015 to 2020, and is mainly screened according to the following methods. First, a list with a total of 2667 listed manufacturing firms from the Wind database can be obtained according to the manufacturing classification standards of Chinese Securities Regulatory Commission. Second, we delete the 2015–2020 ST and ST* listed firms. Third, we delete the firm with zero overseas operating income because the core explanatory variable in this paper is the degree of internationalization, and delete the firm lacking the total score of corporate social responsibility which is a measure of environmental performance. Finally, we obtain balanced panel data of 727 listed firms.
3.2. Measures
3.2.1. Dependent Variable
Referring to the research of Illias et al. [15] and Xie and Zhu [42], we divide sustainable performance into two dimensions from the economic and environmental aspects. Economic performance (EcoP) is measured by the return on total assets (ROA), and the environmental performance (EnvP) is measured by the total score of the corporate social responsibility rating published by Hexun.com.
3.2.2. Independent Variable
Consistent with previous studies [43], we use the ratio of foreign sales to total sales (FSTS) to measure international diversification (ID). Although there have been many criticisms of this indicator in recent years, some researchers believe that the measure should include the number of foreign countries [44] and the proportion of foreign assets to total assets [45]. However, the limitation of data availability and purposes of comparing to prior research make us use the FSTS ratio in this study.
3.2.3. Mediating Variables
Most of the literature uses the questionnaire survey to measure dynamic capabilities, but the cross-sectional data can not reflect the continuous evolution process of firm’s dynamic capabilities during the sample period. Therefore, according to the measurement method of Yang et al. [46], this paper uses second-hand data to measure the two dimensions of dynamic capabilities. Adaptive capability (AC) is measured by the variation coefficient of annual R&D, capital, and advertising expenditures. The variation coefficient can well reflect the flexibility of resource allocation. The smaller the coefficient, the more uniform the resource allocation and the stronger the adaptive capability. In order to ensure that the variation direction of the coefficient and adaptive capability are consistent, this paper takes a negative value for the variation coefficient. Two indicators of the annual R&D investment intensity (RD) and the proportion of technical personnel (TP) are used to sum up the evaluation value of innovation capability (IC). The data of these two indicators are standardized respectively, and then the comprehensive value of innovation capability is obtained by adding up. The formula is as follows:
3.2.4. Control Variables
Several control measures are included. First, firm size (FS) refers to the natural log of the firm’s total assets. Firm size is generally controlled in studies associated with performance improvement and capability development [14], as large firms possess more R&D and financial resources than do small firms, which is helpful for capability building and sustainable development. Second, listed year (LY) is the number of years since the firm has been listed to the reporting year of the corporate social responsibility report. Since listed firms often need steady growth to maintain a stable share price and protect shareholders’ income, older firms often encounter difficulties in keeping up with external environmental change, so we argue older listed firms tend to be more conservative, and encounter difficulties in exploring new opportunities in risky and sustainable innovation which finally imposes restrictions on capability building and sustainable development. Third, we use asset-liability ratio to measure financial leverage (FL) which could affect corporate investment behavior in environmental aspects. Higher asset-liability ratio means heavier financial burden, which will limit the firm’s investment in risky innovation and environmental response behavior requiring large capital input and a long time to get returns. Fourth, we adopt the research of Shao and Lv [47] and use the year-on-year growth rate of total operating income to measure firm growth (FG). We argue that better growth rate will increase firms’ confidence in future development, and make firms more willing to conduct both short-term and long-term investment for capability building and sustainable development. Fifth, we also control firm ownership (FO) measured by dummy variables as non-state-owned firms are more competitive than state-owned firms. It is set to 1 for state-owned firms and 0 for non-state-owned firms. Finally, all of the estimation equations included year, province dummies to control for unobserved heterogeneity such as year effects and geographical effects, but we did not report them in the resulting tables.
4. Results
4.1. Hypothesis Testing
Table 1 is the descriptive statistical analysis results. Hierarchical regression analysis is used to test all hypotheses about the relations among international diversification, dynamic capabilities, and sustainable performance. As for the regression model, we first conduct regression analysis of fixed effect model and random effect model respectively, and then conduct Hausman test to decide on which model should be chosen. Results show that prob > chi2 = 0.0000 in model 1 to model 8, indicating that fixed effect model should be used in all the regression analyses.

Table 1.
Descriptive statistical analysis.
As shown in Table 2, model 1 shows that the international diversification has a significantly positive impact on economic performance (β = 0.129, p < 0.001), model 2 shows that international diversification is also positively and significantly associated with environmental performance (β = 0.749, p < 0.001). Thus hypothesis 1 and 2 are both supported. Model 3 shows that international diversification is positively related to adaptive capability (β = 0.190, p < 0.001). Hypotheses 3 is supported. Hypothesis 4 and 5 respectively proposes that adaptive capability is positively associated with economic performance and environmental performance. Model 4 shows that there is a positive relationship between adaptive capability and economic performance (β = 0.084, p < 0.001), which supports hypothesis 4. Model 5 shows that adaptive capability has a significantly positive impact on environmental performance (β = 0.405, p < 0.001), which supports hypothesis 5. Model 6 shows that international diversification is positively associated with innovation capability (β = 0.188, p < 0.001). Hypotheses 6 is supported. Hypothesis 7 and 8 respectively put forward that innovation capability is positively related to economic performance and environmental performance. In model 7, the coefficient between innovation capability and economic performance (β = 0.155, p < 0.001) supports hypothesis 7. In model 8, the coefficient between innovation capability and environmental performance (β = 0.411, p < 0.001) supports hypothesis 8.
Table 2.
Results of regression analysis.
4.2. Robustness Analyses
First, this study uses ambidextrous performance (AmbP) as a surrogate variable for sustainable performance to test the robustness. According to the organizational ambidextrous theory, the ambidextrous performance of this paper means that firms can achieve an effective balance and combination of economic performance and environmental performance under the condition of limited resources. Referring to the study of Zang and Li [48], the specific measurement steps are as follows: 0–1 standardization is carried out on the index of economic performance and environmental performance, and then the standardized economic performance and environmental performance are transformed into ambidextrous performance by referring to the existing formula: AmbP = . Regression results in Table 3 show that international diversification is positively related to ambidextrous performance (β = 0.167, p < 0.001), and adaptive capability and innovation capability play a partial mediating role in the relationship between international diversification and ambidextrous performance.
Table 3.
Robustness analyses: Replacing dependent variables.
Second, we include geographic categorical variables to test the robustness of the results in different regions. We divide the samples into eastern firms, central firms, and western firms according to their geographic locations, and test the relationship between international diversification, dynamic capabilities, and sustainable performance in different geographic regions. The study finds consistent results, as shown in Table 4, Table 5 and Table 6.
Table 4.
Results of regression analysis in eastern firms.
Table 5.
Results of regression analysis in central firms.
Table 6.
Results of regression analysis in western firms.
4.3. Endogeneity
An endogenous test is conducted for three reasons. First, although this study has incorporated many control variables into the research model, in order to further solve the potential endogeneity problem caused by missing variables from model 1 to model 8, this paper uses dependent variable lagging one period to carry out dynamic model estimation, taking the first-order and second-order lag terms of endogenous variables as instrumental variables, and use two-step SYS-GMM to alleviate the endogeneity problem of the model. The regression analysis results are still consistent with the above research conclusions (as shown in Table 7). In addition, Hansen’s test results prove that the SYS-GMM estimation is valid.
Table 7.
Endogenous test: SYS-GMM estimation.
Second, we establish simultaneous formulas and use three-stage least squares (3SLS) to test the potential endogeneity problem caused by bidirectional causality. There is such a possibility that firms with better economic and environmental performance are inclined to place more emphasis on international diversification, which in turn improves dynamic capabilities. Regression results of 3SLS show that the path coefficient of reverse causal formula is not significant (p = 0.234 > 0.05) when we take economic performance as independent variable and internatioal diversification as dependent variable. Regression results of 3SLS also show that the path coefficient of the impact of environmental performance on international diversification is not significant (p = 0.189 > 0.05). Another possibility is that firms with better economic and environmental performance are inclined to own stronger dynamic capabilities which help firms expand into international markets. Regression results of 3SLS show that all the main effect coefficient of reverse causal formulas are not significant. Therefore, endogeneity problem originating from reverse causal relationship is not a serious problem in our study.
Third, there may be an endogeneity problem arising from the selection bias. This paper uses propensity score matching (PSM) to further assess whether the degree of international diversification has an impact on firm performance. Considering that international diversification is a continuous variable, this paper assigns a value of 1 to those above the median and 0 to those below the median for their high and low groupings. Table 8 shows a good matching result of international diversification on economic performance and environmental performance. The results of the regression based on the paired subsamples are presented in Table 9, suggesting that international diversification is significantly positively related to economic performance (β = 0.240, p < 0.001) and environmental performance (β = 1.054, p < 0.001). Therefore, endogeneity problem originating from selection bias is not a serious problem in our study.
Table 8.
PSM results.
Table 9.
Regression results of the main effect based on PSM.
5. Conclusions and Discussion
Extant research interests have changed from “why firms achieve sustainability” to “how firms achieve sustainability”, and have been aware of the significance role of international diversification for firms to achieve sustainability, but not reached consistent conclusions [1,12,14]. According to the theoretical perspective of dynamic capabilities, this paper examines the mediating role of adaptive capability and innovation capability played in the relationship between international diversification and sustainable performance. The empirical results reveal that international diversification positively influence both economic performance and environmental performance, and adaptive capability and innovation capability partially mediate the relations of international diversification and sustainable performance.
Our research contributes to existing literature on two aspects. First, we have empirically explored and found that international diversification is positively related to economic performance and environmental performance respectively. Although international expansion has attracted the attention of researchers on the underlying benefit for sustainable development, existing research treats sustainable development as a whole and does not uncover the respective influence of internationalization on economic performance and environmental performance. This paper contributes at this point through clearly disclosing whether and how international diversification affect firms’ sustainable performance from the economic and environmental way.
Second, the finding expands our understanding of the influencing mechanism of international diversification by highlighting the intervening role of adaptive capability and innovation capability in enhancing firms’ sustainable performance. Existing theoretical explanation about international diversification mainly employs the logic of resources-based view to interpret the impacting mechanism of international diversification on sustainable performance [1,12,14]. However, this study puts forward that international diversification not only offers novel valuable strategic resources as inputs important for firms’ economic and environmental oriented development but also act as intermediate mechanisms through which international firms operating in host markets with local partners learn and build routines that finally promote the establishment of dynamic capabilities. The results provide proof to the capability view, which emphasizes the significance of resource integration and capability upgrading to improve other resources’ productivity [16,19]. Thus, we extend the theoretical foundation of firms’ sustainable development from the perspective of international diversification.
This research also has some practical implications. Driven by sustainable development needs and limited by internal resource bottlenecks, most firms need to think about how to obtain resources from outside to promote sustainable development. Our research results signify that business managers in international firms should be conscious of the important role of foreign markets in the improvement of firm’s economic performance and environmental performance. Otherwise, firm’s managers need to be more aware that global markets not only provide the source to seek novel resources, but also offer the channel to develop adaptive capability and innovation capability which help firms achieve sustainable development under dynamic conditions. Therefore, our results also imply that, in the process of internationalization, international firms should build adaptive capability and innovation capability to respond to their economic and environmental development demand.
For policy makers, our study recommends that government department should develop encouraging policies that promote firms to go internationalization which in turn helps them establish adaptive capability and innovation capability. Due to lack of international development experience and encountering some difficult international obstacles, many firms in our country have shown a certain degree of fear of international market. Therefore, on the one hand, government agencies should promote firms’ internationalization through incentive policies, and on the other hand, they should build a platform for domestic firms to connect with the international market, so as to reduce the cost and difficulty of internationalization.
There are some limitations in this study, providing space for further exploration in the future. First, we select international diversification as an indicator to characterize internationalization strategies, ignoring such other features of internationalization as entry mode and speed. However, existing research has uncovered that different entry modes and international speed may bring about different resources and learning effect [49,50]. Future endeavors may explore how differentiated entry modes and speed of internationalization can exert influence on dynamic capabilities and sustainable performance. Second, this study mainly uses Wang and Ahmed’s [19] division of dynamic capabilities. However, the definition and dimension division of dynamic capabilities are far from consensus in the theoretical circles, so future research is necessary to continue by examining other scholars’ interpretations, division and measurement indices of dynamic capabilities. Third, the research sample is limited to listed manufacturing companies in China, which hinders the finding’s generalizability. Therefore, future research can further compare the relationship between international diversification, dynamic capabilities and sustainable performance of service firms, firms in other emerging or developed countries. Fourth, this study only explores the mediating mechanism by which international diversification affects sustainable performance, and does not reveal contextual mechanisms. In fact, the contradictory relationship between international diversification and sustainable performance indicates that future research may consider revealing the conditions under which international diversification is beneficial and detrimental to sustainable performance.
Author Contributions
Conceptualization, H.W., Y.Y. and Y.Q.; methodology, H.W.; formal analysis, H.W.; investigation, Y.Y.; writing—original draft preparation, H.W.; writing—review and editing, Y.Q.; funding acquisition, Y.Y. All authors have read and agreed to the published version of the manuscript.
Funding
This research was funded by National Natural Science Foundation, grant number 71972075.
Institutional Review Board Statement
Not applicable.
Informed Consent Statement
Not applicable.
Data Availability Statement
The data that support the findings of this study are available from the authors upon reasonable request.
Conflicts of Interest
The authors declare no conflict of interest.
References
- Bojnec, T.; Tomic, N. Corporate sustainability and enterprise performance: The mediating effects of internationalization and networks. Int. J. Prod. Perform. Manag. 2020, 70, 21–39. [Google Scholar] [CrossRef]
- Abbas, J.; Sagsan, M. Impact of knowledge management practices on green innovation and corporate sustainable development: A structural analysis. J. Clean. Prod. 2019, 229, 611–620. [Google Scholar] [CrossRef]
- Cubas-Díaz, M.; Martínez-Sedano, M.Á. Measures for sustainable investment decisions and business strategy: A triple bottom line approach. Bus. Strateg. Environ. 2018, 27, 16–38. [Google Scholar] [CrossRef]
- Bansal, P. Evolving sustainably: A longitudinal study of corporate sustainable development. Strateg. Manag. J. 2005, 26, 197–218. [Google Scholar] [CrossRef]
- Law, K.; Gunasekaran, A. Sustainability development in high-tech manufacturing firms in Hong Kong: Motivators and readiness. Int. J. Prod. Econ. 2012, 137, 116–125. [Google Scholar] [CrossRef]
- Wolf, Z. The relationship between sustainable supply chain management, stakeholder pressure, and financial performance. J Bus Ethics 2014, 119, 317–328. [Google Scholar] [CrossRef]
- Hockerts, K. A cognitive perspective on the business case for corporate sustainability. Bus. Strateg. Environ. 2015, 24, 102–122. [Google Scholar] [CrossRef]
- Gröschl, S.; Gabaldón, P.; Hahn, T. The co-evolution of leaders’ cognitive complexity and corporate sustainability: The case of the CEO of puma. J. Bus. Ethics 2019, 155, 741–762. [Google Scholar] [CrossRef]
- Hitt, M.A.; Hoskisson, R.E.; Kim, H. International diversification: Effects on innovation and firm performance in product-diversified firms. Acad. Manag. J. 1997, 40, 767–798. [Google Scholar] [CrossRef] [Green Version]
- Geleilate, J.M.G.; Magnusson, P.; Parente, R.C.; Alvarado-Vargas, M.J. Home country institutional effects on the multinationality-performance relationship: A comparison between emerging and developed market multinationals. J. Int. Manag. 2016, 22, 380–402. [Google Scholar] [CrossRef]
- Marano, V.; Arregle, J.L.; Hitt, M.A.; Spadafora, E.; van Essen, M. Home country institutions and the internationalization-performance relationship: A meta-analytic review. J. Manag. 2016, 42, 1075–1110. [Google Scholar] [CrossRef]
- Melane-Lavado, A.; Alvarez-Herranz, A.; Gonzalez-Gonzalez, I. Foreign direct investment as a way to guide the innovative process towards sustainability. J. Clean. Prod. 2018, 172, 3578–3590. [Google Scholar] [CrossRef]
- Li, X.; Niu, X. Internationalization path, technological innovation and regional SME growth: Empirical test based on provincial panel data. Technol. Econ. 2017, 36, 24–31. [Google Scholar]
- Park, S.B. Multinationals and sustainable development: Does internationalization develop corporate sustainability of emerging market multinationals? Strateg. Environ. 2018, 27, 1514–1524. [Google Scholar] [CrossRef]
- Ilias, A.; Kostas, K.; Dimitris, T. Environmental and financial performance. Is there a win-win or a win-loss situation? Evidence from the greek manufacturing. J. Clean. Prod. 2018, 197, 1275–1283. [Google Scholar] [CrossRef] [Green Version]
- Amit, R.; Schoemaker, P. Strategic assets and organizational rent. Strateg. Manag. J. 1993, 14, 33–46. [Google Scholar] [CrossRef]
- Grant, R.M. The resource-based theory of competitive advantage: Implications for strategy formulation. Calif. Manag. Rev. 1991, 33, 114–135. [Google Scholar] [CrossRef] [Green Version]
- Makadok, R. Toward a synthesis of the resource-based and dynamic-capability views of rent creation. Strateg. Manag. J. 2001, 22, 387–401. [Google Scholar] [CrossRef]
- Wang, C.L.; Ahmed, P.K. Dynamic capabilities: A review and research agenda. Int. J. Manag. Rev. 2007, 9, 31–51. [Google Scholar] [CrossRef]
- Teece, D.J.; Pisano, G.; Shuen, A. Dynamic capabilities and strategic management. Strateg. Manag. J. 1997, 18, 509–533. [Google Scholar] [CrossRef]
- Eisenhardt, K.M.; Martin, J.A. Dynamic capabilities: What are they? Strateg. Manag. J. 2000, 21, 1105–1121. [Google Scholar] [CrossRef]
- Teece, D.J. Explicating dynamic capabilities: The nature and microfoundations of (sustainable) enterprise performance. Strateg. Manag. J. 2007, 28, 1319–1350. [Google Scholar] [CrossRef] [Green Version]
- Wu, H.; Chen, J.; Jiao, H. Dynamic capabilities as a mediator linking international diversification and innovation performance of firms in an emerging economy. J. Bus. Res. 2016, 69, 2678–2686. [Google Scholar] [CrossRef]
- Wang, C.L.; Ahmed, P.K. The development and validation of the organisational innovativeness construct using confirmatory factor analysis. Eur. J. Innov. Manag. 2004, 7, 303–313. [Google Scholar] [CrossRef] [Green Version]
- Wu, H.; Chen, J. International ambidexterity in firms’ innovation of multinational enterprises from emerging economies: An investigation of TMT attributes. Balt. J. Manag. 2020, 15, 431–451. [Google Scholar] [CrossRef]
- Hsu, C.-W.; Lien, Y.-C.; Chen, H. International ambidexterity and firm performance in small emerging economies. J. World Bus. 2013, 48, 58–67. [Google Scholar] [CrossRef]
- Cuerva, M.C.; Triguero-Cano, Á.; Córcoles, D. Drivers of green and non-green innovation: Empirical evidence in Low-Tech SMEs. J. Clean. Prod. 2014, 68, 104–113. [Google Scholar] [CrossRef]
- Albort-Morant, G.; Leal-Millan, A.; Cepeda-Carrion, G. The antecedents of green innovation performance: A model of learning and capabilities. J. Bus. Res. 2016, 69, 4912–4917. [Google Scholar] [CrossRef]
- Child, J.; Rodrigues, S.B. The internationalization of Chinese firms: A case for theoretical extension? Manag. Organ. Rev. 2005, 1, 381–410. [Google Scholar] [CrossRef] [Green Version]
- Liao, J.J.; Kickul, J.R.; Ma, H. Organizational dynamic capability and innovation: An empirical examination of internet firms. J. Small Bus. Manag. 2009, 47, 263–286. [Google Scholar] [CrossRef]
- Lu, Y.; Zhou, L.; Bruton, G.; Li, W. Capabilities as a mediator linking resources and the international performance of entrepreneurial firms in an emerging economy. J. Int. Bus. Stud. 2010, 41, 419–436. [Google Scholar] [CrossRef]
- Tsai, K.; Liao, Y. Sustainability strategy and eco-innovation: A moderation model. Bus. Strateg. Environ. 2017, 26, 426–437. [Google Scholar] [CrossRef]
- Alegre, J.; Chiva, R. Assessing the impact of organizational learning capability on product innovation performance: An empirical test. Technovation 2008, 28, 315–326. [Google Scholar] [CrossRef]
- Wu, H.; Chen, J.; Liu, Y. The impact of OFDI on firm innovation in an emerging country. Intl. J. Tech. Manag. 2017, 74, 167–184. [Google Scholar] [CrossRef]
- Romijn, H.; Albaladejo, M. Determinants of innovation capability in small electronics and software firms in southeast England. Res. Policy 2002, 31, 1053–1067. [Google Scholar] [CrossRef]
- Calantone, R.J.; Cavusgil, S.T.; Zhao, Y. Learning orientation, firm innovation capability, and firm performance. Ind. Market. Manag. 2002, 31, 515–524. [Google Scholar] [CrossRef]
- Anning-Dorson, T. Customer involvement capability and service firm performance: The mediating role of innovation. J. Bus. Res. 2018, 86, 269–280. [Google Scholar] [CrossRef]
- Al-Kalouti, J.; Kumar, V.; Zwiegelaar, J.B.; Kumar, N.; Garza-Reyes, J.A.; Upadhyay, A. Investigating innovation capability and organizational performance in service firms. Strateg. Change 2020, 29, 103–113. [Google Scholar] [CrossRef]
- Boons, F.; Montalvo, C.; Quist, J.; Wagner, M. Sustainable innovation, business models and economic performance: An overview. J. Clean. Prod. 2013, 45, 1–8. [Google Scholar] [CrossRef]
- Bi, K.; Huang, P.; Wang, X. Innovation performance and influencing factors of low-carbon technological innovation under the global value chain: A case of the Chinese manufacturing industry. Technol. Forecast. Soc. Change 2016, 111, 275–284. [Google Scholar] [CrossRef]
- Demirel, P.; Kesidou, E. Sustainability-oriented capabilities for eco-innovation: Meeting the regulatory, technology, and market demands. Bus. Strateg. Environ. 2019, 28, 847–857. [Google Scholar] [CrossRef]
- Xie, X.; Zhu, Q. How can green innovation solve the dilemmas of “harmonious coexistence”. J. Manag. World 2021, 37, 128–149. [Google Scholar] [CrossRef]
- Capar, N.; Kotabe, M. The relationship between international diversification and performance in service firms. J. Int. Bus. Stud. 2003, 34, 345–355. [Google Scholar] [CrossRef]
- Tallman, S.; Li, J.T. Effects of international diversity and product diversity on the performance of multinational firms. Acad. Manag. J. 1996, 39, 179–196. [Google Scholar]
- Gomes, L.; Ramaswamy, K. An empirical examination of the form of the relationship between multinationality and performance. J. Int. Bus. Stud. 1999, 30, 173–188. [Google Scholar] [CrossRef]
- Yang, L.; He, X.; Gu, H. Top management team’s experiences, dynamic capabilities and firm’s strategy mutation: Moderating effect of managerial discretion. J. Manag. World 2020, 36, 168–188. [Google Scholar] [CrossRef]
- Shao, S.; Lv, C. Can the actual controllers’ directly holding stocks increase the company’s value? A study from the evidence of China’s private listed companies. J. Manag. World 2015, 5, 134–146. [Google Scholar] [CrossRef]
- Zang, J.; Li, Y. Technology capabilities, marketing capabilities and innovation ambidexterity. Technol. Anal. Strateg. Manag. 2017, 29, 23–37. [Google Scholar] [CrossRef]
- Zahra, S.A.; Ireland, R.D.; Hitt, M.A. International expansion by new venture firms: International diversity, mode of market entry, technological learning and performance. Acad. Manag. J. 2000, 43, 925–950. [Google Scholar] [CrossRef]
- Prashantham, S.; Young, S. Post-entry speed of international new ventures. Entrep. Theory Pract. 2011, 35, 275–292. [Google Scholar] [CrossRef]
Publisher’s Note: MDPI stays neutral with regard to jurisdictional claims in published maps and institutional affiliations. |
© 2022 by the authors. Licensee MDPI, Basel, Switzerland. This article is an open access article distributed under the terms and conditions of the Creative Commons Attribution (CC BY) license (https://creativecommons.org/licenses/by/4.0/).