Article

Solar Typologies: A Comparative Analysis of Urban Form and Solar Potential

1
Politecnico di Milano, Department of Architecture and Urban Studies, Via Bonardi 3, 20133 Milan, Italy
2
Politecnico di Milano, Department of Architecture, Built Environment and Construction Engineering, Via Ponzio 31, 20133 Milan, Italy
*
Author to whom correspondence should be addressed.
Sustainability 2022, 14(15), 9023; https://doi.org/10.3390/su14159023
Submission received: 13 June 2022 / Revised: 18 July 2022 / Accepted: 19 July 2022 / Published: 22 July 2022

Abstract

:
Efficient use of energy in the construction sector is a pillar of the European Union’s 2050 climate protection goals, yet legislation makes no explicit reference to urban morphology or building form, which are recognized as key to energy performance in buildings. Rapidly changing energy standards and new requirements for on-site energy production demand a vigorous scrutiny of established urban typologies that are largely the product of an older energy regime. The research explores a set of 312 building shapes with floor-to-area ratio (FAR) of 3 within a given plot to identify emerging trends, ranges, and correlations between geometric variables, visual comfort, and energy indicators. Cases are grouped and evaluated in relation to three main urban typologies to highlight unique features related to each typology. The paper also compares two groups of results related to passive and active solar potential, respectively, to identify formal traits that are specific to each of these two design strategies. Finally, the research ranks design options based on total energy use taking into account the energy need for artificial lighting as well as contributions from both passive energy savings and active energy production. Results show that energy demand across cases varies by a factor 2 for passive strategies and a factor 5 when active potential is considered based on shape alone. Best results are clearly positioned at the two extremes of the geometric and proportional range. On the one hand, low-rise compact bar and courtyard buildings that are perhaps most prevalent in our cities today may be effectively retrofitted to meet active energy targets. On the other hand, extremely tall and slim towers appear to be the only typology in the study with the potential to achieve zero-energy status by virtue of their form alone. The work sheds light on the formal implications of EU energy mandates and offers a glimpse of how buildings may adapt to the combined selective pressures of high on-site energy fraction and low energy use to shape our future cities.

1. Introduction

1.1. Energy Legislation and the Role of Urban Form

Buildings are responsible for approximately 40% of the energy consumption and 36% of the CO2 emissions of the EU [1]. The reduction of GHG emissions and energy use in the construction sector is one of the pillars of the EU’s legislation to achieve carbon neutrality by 2050 [1], as proposed by the European Green Deal [2] and enshrined in the recent European Climate Law [3]. The Directive on the Energy Performance of Buildings [4] sets the legislative framework for European countries to achieve energy efficiency targets through a combination of energy saving measures and renewable energy production, with the two components seen as mutually supportive. Although the Directive leaves to individual member states the definition of specific performance requirements, most of the national implementations include a threshold for maximum energy demand as well as a minimum share of renewable energy.
Since the legislation is typically oriented towards the achievement of global performance targets in buildings, sometimes coupled with prescriptive indications on building components and systems, it lacks any reference to urban morphology and building form.
In contrast, building codes, zoning regulations, and other planning instruments often define morphological guidelines, for instance, by specifying building height, width, floor-to-area ratio (FAR), or setbacks from property lines. However, they do so with little consideration for solar access and other energy performance implications. As a result, current regulation in some jurisdictions may represent an obstacle to achieving the energy targets that European legislation demands and that the very same planning instruments are supposed to enforce.
EU legislation appears to imply that energy targets can be achieved irrespective of urban form and building shape. In fact, active energy systems, such as solar thermal and photovoltaic panels or even glazing and envelope upgrades, as well as passive strategies, such as solar gains or natural ventilation, heavily depend on urban formal and spatial settings. This correlation is particularly relevant for architects, who have a crucial role to play in order to achieve these objectives at all levels and scales of design and construction.

1.2. Energy Considerations in Early-Stage Design

The notion that environmental performance in buildings is largely determined at the conceptual stage of design is well-established in the literature, for instance, in Baker and Steemers [5], suggesting that design considerations could account for variations in energy demand by a factor 2.5; a study by Salat [6] for Paris found that morphology could account for up to a factor 1.8. Similarly, Ratti et al. [7] postulated that urban geometry might be the missing factor to account for up to a twenty-fold variation in the energy demand in buildings. In yet another study [8] comparing the heat energy efficiency of 100 sample cities, the authors found a variation of up to a factor 6 for the heating energy demands of different urban morphologies. According to Lechner [9], proper design decisions, particularly at the early design stages, can lead to energy savings reaching up to 80%. A recent cost reduction for systems producing renewable energy integrated in building envelopes sparked additional interest in the availability of solar radiation in urban environments, as highlighted by Brozovsky, Gustavsen, and Gaitani [10]. Oh and Kim [11] discussed the energy performance of real urban forms, providing guidance for U-values and PV installations in similar settings. Savvides, Vassiliades et al. [12] proposed some indications to support early-design decisions at the urban scale and promote the integration of solar active systems in buildings. Natanian, Aleksandrowicz, and Auer [13] suggested that courtyard blocks present advantages over other typologies in terms of total energy balance, with Vartholomaios [14] indicating that they are effective also in Mediterranean cities. De Luca, Naboni, and Lobaccaro [15] highlighted the significant effects that the urban arrangement can also have on both indoor and outdoor comfort.
Accordingly, a central premise of the research is that potential for passive and active strategies at the individual building scale is heavily affected by design decisions at the urban scale. Morphology factors such as density or distance between buildings can determine the upper limit for the solar potential of any subsequent design alternative. Overshadowing, excessive building depth, or unsuitable orientation, for example, can have adverse consequences that hardly any “local” design strategy at a later stage can offset or reverse.

1.3. Urban Typologies as Analytical Models

Urban typologies are formal and functional models bearing a relationship to climate, culture, local materials, and available technologies. The gradual, spontaneous development of typologies across regions and over millennia have been compared to an evolutionary process that selects the urban species best adapted to changing environmental pressures. Implicit to this notion is that urban form is well-adjusted to its surroundings, including in terms of energy efficiency and comfort [16].
Despite their origin in pre-modern societies, typologies remain a strong reference in architecture and urban planning, as they provide organizational principles at the early design stage that guarantee compliance to basic requirements for safety and comfort, such as vertical and horizontal continuity for structure and circulation, and access to natural daylight and ventilation. This knowledge is deeply embedded in architectural education and practice, and it remains central to urban planning and architecture to this day—even when architects do not acknowledge it [17].
For most of the 20th century, these models were deeply affected by the use of cheap, abundant fossil fuels for heating and cooling in buildings [18]. Floor plates have grown generally deeper, building mass less articulated, and envelopes more impervious to the outside since daylighting and natural ventilation were supplanted at least in part by electrical and mechanical systems. Today, rapidly changing energy performance standards and new requirements for on-site energy production demand a vigorous scrutiny of established urban typologies that are largely the product of an older energy regime, as Thomas Herzog et al. [19] first pointed out in the late 1990s. The research adopts urban typologies as models to examine and arrange simple building shapes, based on their most elementary formal and organizational traits, in order to explore their relationship to daylighting and energy performance.

1.4. Research Objectives

The research sets out to explore the design space of three main typologies—bar, courtyard, and tower—evaluating a complete set of 312 urban forms with FAR 3 within a given plot, with the goal of identifying emergent trends, ranges, and correlations between geometric variables and energy performance indicators. In order to overcome some of the limitations highlighted in the Background section, the research adopts a multi-step approach to the performance-based selection of the most promising forms while also preserving the central role of the designer’s value judgement along the process. Results are assessed in relation to prior work and serve as confirmation that energy performance in buildings is unequivocally form-dependent. Cases are grouped and evaluated in relation to typologies so as to identify unique traits related to each group. Results should highlight any specific energy-related propensity intrinsic to each typology; in addition, they might shed light on long-held beliefs regarding the emergence of traditional urban forms. Far from advocating a return to historical models of the city, the research takes typologies as point of departure with the intent to resume and expedite the evolutionary process interrupted by “cheap oil”. Furthermore, the work compares two sets of results related to passive (daylighting, energy use) and active solar potential (total radiation for energy production) as performance indicators in order to identify any formal trait that may be specific to each of the two design strategies. Results should highlight the formal implications of the impending energy transition and the effects of “cheap PVs” in buildings. Additionally, they might help identify potential inconsistencies between current planning prescriptions and new EU active energy mandates.
Finally, the work evaluates a group of iterations, which were selected based on new and stringent energy requirements, using a synthetic indicator for total energy demand to arrive at a final ranking of design options, including passive and active solar potential. This should serve to identify any urban form that has, under certain conditions, the lowest energy use overall. Ultimately, the work attempts to shed light on the formal implications of EU energy mandates also in relation to the question of “solar rights” that could lead to new urban solar zoning guidelines. These results should prove useful as design guidelines to urban planners and architects, at least until the computational costs of fully automated, energy-based, form-finding protocols become viable in the near future.

2. Background

2.1. Energy Evaluation of Urban Typologies

There are numerous studies evaluating the energy performance of urban typologies, starting with Martin and March [20] using early computers to test a variety of building forms for solar potential. More recently, Gupta [21] assessed the thermal behavior of three base typologies, which were later extended to six generic urban forms by Steemers, Baker et al. [22]. Okeil [23] developed a Residential Solar Block combining courtyard and bar to maximize solar radiation on facades and away from roofs and ground; others arrived at different conclusions, asserting that pavilions are the urban form best-suited for reducing solar incidence on roofs in summer and increase vertical incidence in winter [24]. Compagnon [25] showed that solar and daylight availability in dense urban areas is significant even without special planning measures, with the possibility of using different active solar systems on facades based on specific irradiation thresholds.
Because of growing interest in active energy systems and nZEB building concepts in recent years, active solar potential has been added to the range of passive energy indicators in several studies, including by Kanters and Horvat [26], focusing on solar energy as a design parameter in urban form. According to Hachem, Athienitis and Fazio [27], different arrangements of housing units can lead to a 33% increase in energy generation from building-integrated photovoltaic systems (BIPV) compared to baseline for two-story single-family units, with neighborhood configurations producing between 65 and 85% of their total energy demand. In the Mediterranean climate, the possibility to reach the net zero energy target at district level has been proven by Guarino, Tumminia et al. [28], with a difference of up to 20% in cooling loads under different configurations of volumes. Lobaccaro, Carlucci et al. [29] discussed how, even in a Nordic climate, appropriate urban design measures can increase solar potential by up to 25%, while the energy yield from the integrated solar active systems can provide up to 55% of the total primary energy demand of an entire urban district.
In buildings with reduced footprint, it may be necessary to use vertical facades besides roofs to install enough solar active systems. Mohajeri, Upadhyay et al. [30] showed how, switching from dispersed to compact neighborhoods, the solar potential (i.e., areas where the installation of either PV or solar thermal is advisable) is much less affected in roofs than in facades; however, Lobaccaro, Fiorito et al. [31] also discussed how, in dense urban contexts, radiation falling on the facades is strongly influenced by diffuse and reflected radiation from surrounding buildings, sometimes to the point of offsetting the overshadowing effects. Indeed, according to Zhang, Xu et al. [32], in tropical high-density cities, differences in urban block typology could lead to up to 200% increase in solar energy harvesting potential and electricity generated from rooftop PV and 25% lower building net energy use intensity, with courtyard and hybrid urban block typologies consistently outperforming other typologies. Blumberga, Vanaga et al. [33] showed that even traditional courtyard blocks in the Northern European climate can achieve the net positive energy target if they are retrofitted to very ambitious energy efficiency targets.
These studies identify clear trends for energy performance related to urban form and its potential for on-site energy generation under certain conditions; collectively, however, they do not arrive to specific and reliable typologies with a decisive advantage in terms of total energy use.

2.2. Geometry-Based Indicators

Geometry factors such as compactness, aspect ratio, and orientation have been used as energy performance indicators in urban and building design. For over a century (see, for instance, William Atkinson, 1894, cited by Harzallah and Hégron, 2007 [34]), they provided architects and urban planners with easy-to-apply rules-of-thumb on which to rely in early-stage design. These geometry-based indicators, however, have only a loose correlation to energy use in buildings, as they often produce contrasting effects on multiple response variables at once. Increasing surface-to-volume (compactness) and window-to-wall ratio, for instance, can have beneficial effects on energy use by increasing daylight availability, heat gains in the winter, and natural ventilation in the summer. However, the same factors can have adverse effects by increasing unwanted heat losses in the winter and heat gains in the summer as well as increasing glare risk. Climate adds a degree of complexity to the overall balance of shifting effects, heavily affecting which aspect has a larger impact on energy use overall. In part because of elusive or conflicting results, there is still no consensus on which, if any, geometric configuration would produce the most desirable outcome within a given set of assumptions. Sanaeian et al. [35] highlighted the difficulty of describing simultaneously all indicators relevant to the thermal behavior of buildings. Nault, Peronato et al. [36] also discussed the limitations of using any single early-design phase metric as a reliable indicator of the solar potential of urban districts. Morganti, Salvati et al. [37] suggested that a combination of gross space index, façade-to-site ratio, and sky factor show instead very good correlation with solar availability on facades; however, this approach does not take into account other energy performance targets.

2.3. Building Energy Modelling and Urban Form

In recent years, technological advances have led to the adoption of digital tools in architecture that allow for rapidly generating and testing several design options for environmental performance. Despite these advances, however, most digital design tools available today are still geared toward detailed building modeling and tend to specialize on a narrow range of design criteria; additionally, they are too complex and time-consuming to be deployed in early-stage design. These and other restrictions, such as the computational load required to explore in detail a large pool of alternatives, are still responsible for a very low adoption rate—22% by some account—of design support tools by architects [38]. Nault et al. [39] attempted to overcome these barriers by proposing a predictive modelling approach as an alternative to running detail simulations, with promising results within certain boundaries. Collectively, these tools are seldom used to test and compare design alternatives at the urban scale in the early-stage design phase when the designer has the greatest decisional freedom over the final shape of the building.
The interrelated nature of multiple factors contributing to energy performance in buildings naturally leads to adopting a multi-criteria evaluation method. The resulting range of optimal or concurrent solutions (Pareto front) requires value judgment on the part of the designer to choose between local optimal solutions. A study of block typologies comparing solar gain, daylight, and energy performance by Sattrup and Strømann-Andersen [40], for example, shows the positive correlation between energy use and daylight and the consequent need for a trade-off between these competing objective criteria.
Evolutionary algorithms have been used to generate and evaluate design iterations based on multiple objective functions. Kämpf and Robinson [41], for example, used a multi-objective evolutionary algorithm applied to three base urban forms to minimize energy consumption in relation to FAR. These methods hold the greatest promise to advancing energy-based form-finding protocols; at present, they also face significant limitations due to high computational cost, which limits the number of design iterations, design variables, or number and complexity of performance indicators. A review of performative computational architecture using evolutionary optimization [42] found that only about 15% of reviewed publications include building form as an objective variable in the optimization process, with a large majority focusing on issues related to envelope design, such as window-to-wall ratio and shading mechanisms, or interior layout. The same review also concurs that due to expensive computation, only a handful of studies consider several variables at once. Moreover, a form-finding algorithm effectively works as a “black box” with very limited involvement of the user; it produces a significant amount of data, and it does not support the exploration of trends and correlations between performance criteria and objective variables [43], as cited by Nault [44].
As a result, in common practice, designers continue relying on readily available, rudimentary design guidelines and/or experience to make decisions at the early stage of design; additionally, they are bound to follow prescriptions by planning instruments that often fail to acknowledge the deep correlation between urban form and energy performance.

3. Methodology

3.1. Design Constants

The research focuses on formal and spatial aspects of buildings rather than on materials, components, or systems. Accordingly, all variables that are not related to building form, such as insulation values of walls and windows, climatic conditions and latitude, and heating and cooling systems, are fixed. The simulated cases are located in New York City, with its mixed-humid climate classified as “Cfa” (cool and wet winters and hot and humid summers) in the Köppen–Geiger climate classification system. A building density of FAR 3 was chosen as constant for all design variants based on average density for urban residential areas in New York City. The value also reflects previous studies, starting with March and Trace [45], that identify a maximum of FAR 4 for unobstructed daylighting penetration and a minimum at around FAR 1.5 for heat energy demands significantly below 100 kWh [8]. Compact urban forms resulting from a relatively high FAR also carry additional ecological benefits, such as reduced urbanized land use, transportation needs, and associated fuel consumption [46]. The building is simulated on a 100 × 100 m plot, surrounded by eight blocks separated by a 20 m street, and having the same shape as the design iteration being evaluated so as to account for the shading effect of the context (Figure 1). The glazing ratio is fixed at 0.3, as this is typical for residential buildings; the thermal characteristics are in accordance with Energy Modelling Standards and are based on recommendations in ASHRAE 90.1-2004, according to climate zone, building program (residential), and surface type (Table 1).

3.2. Design Variables

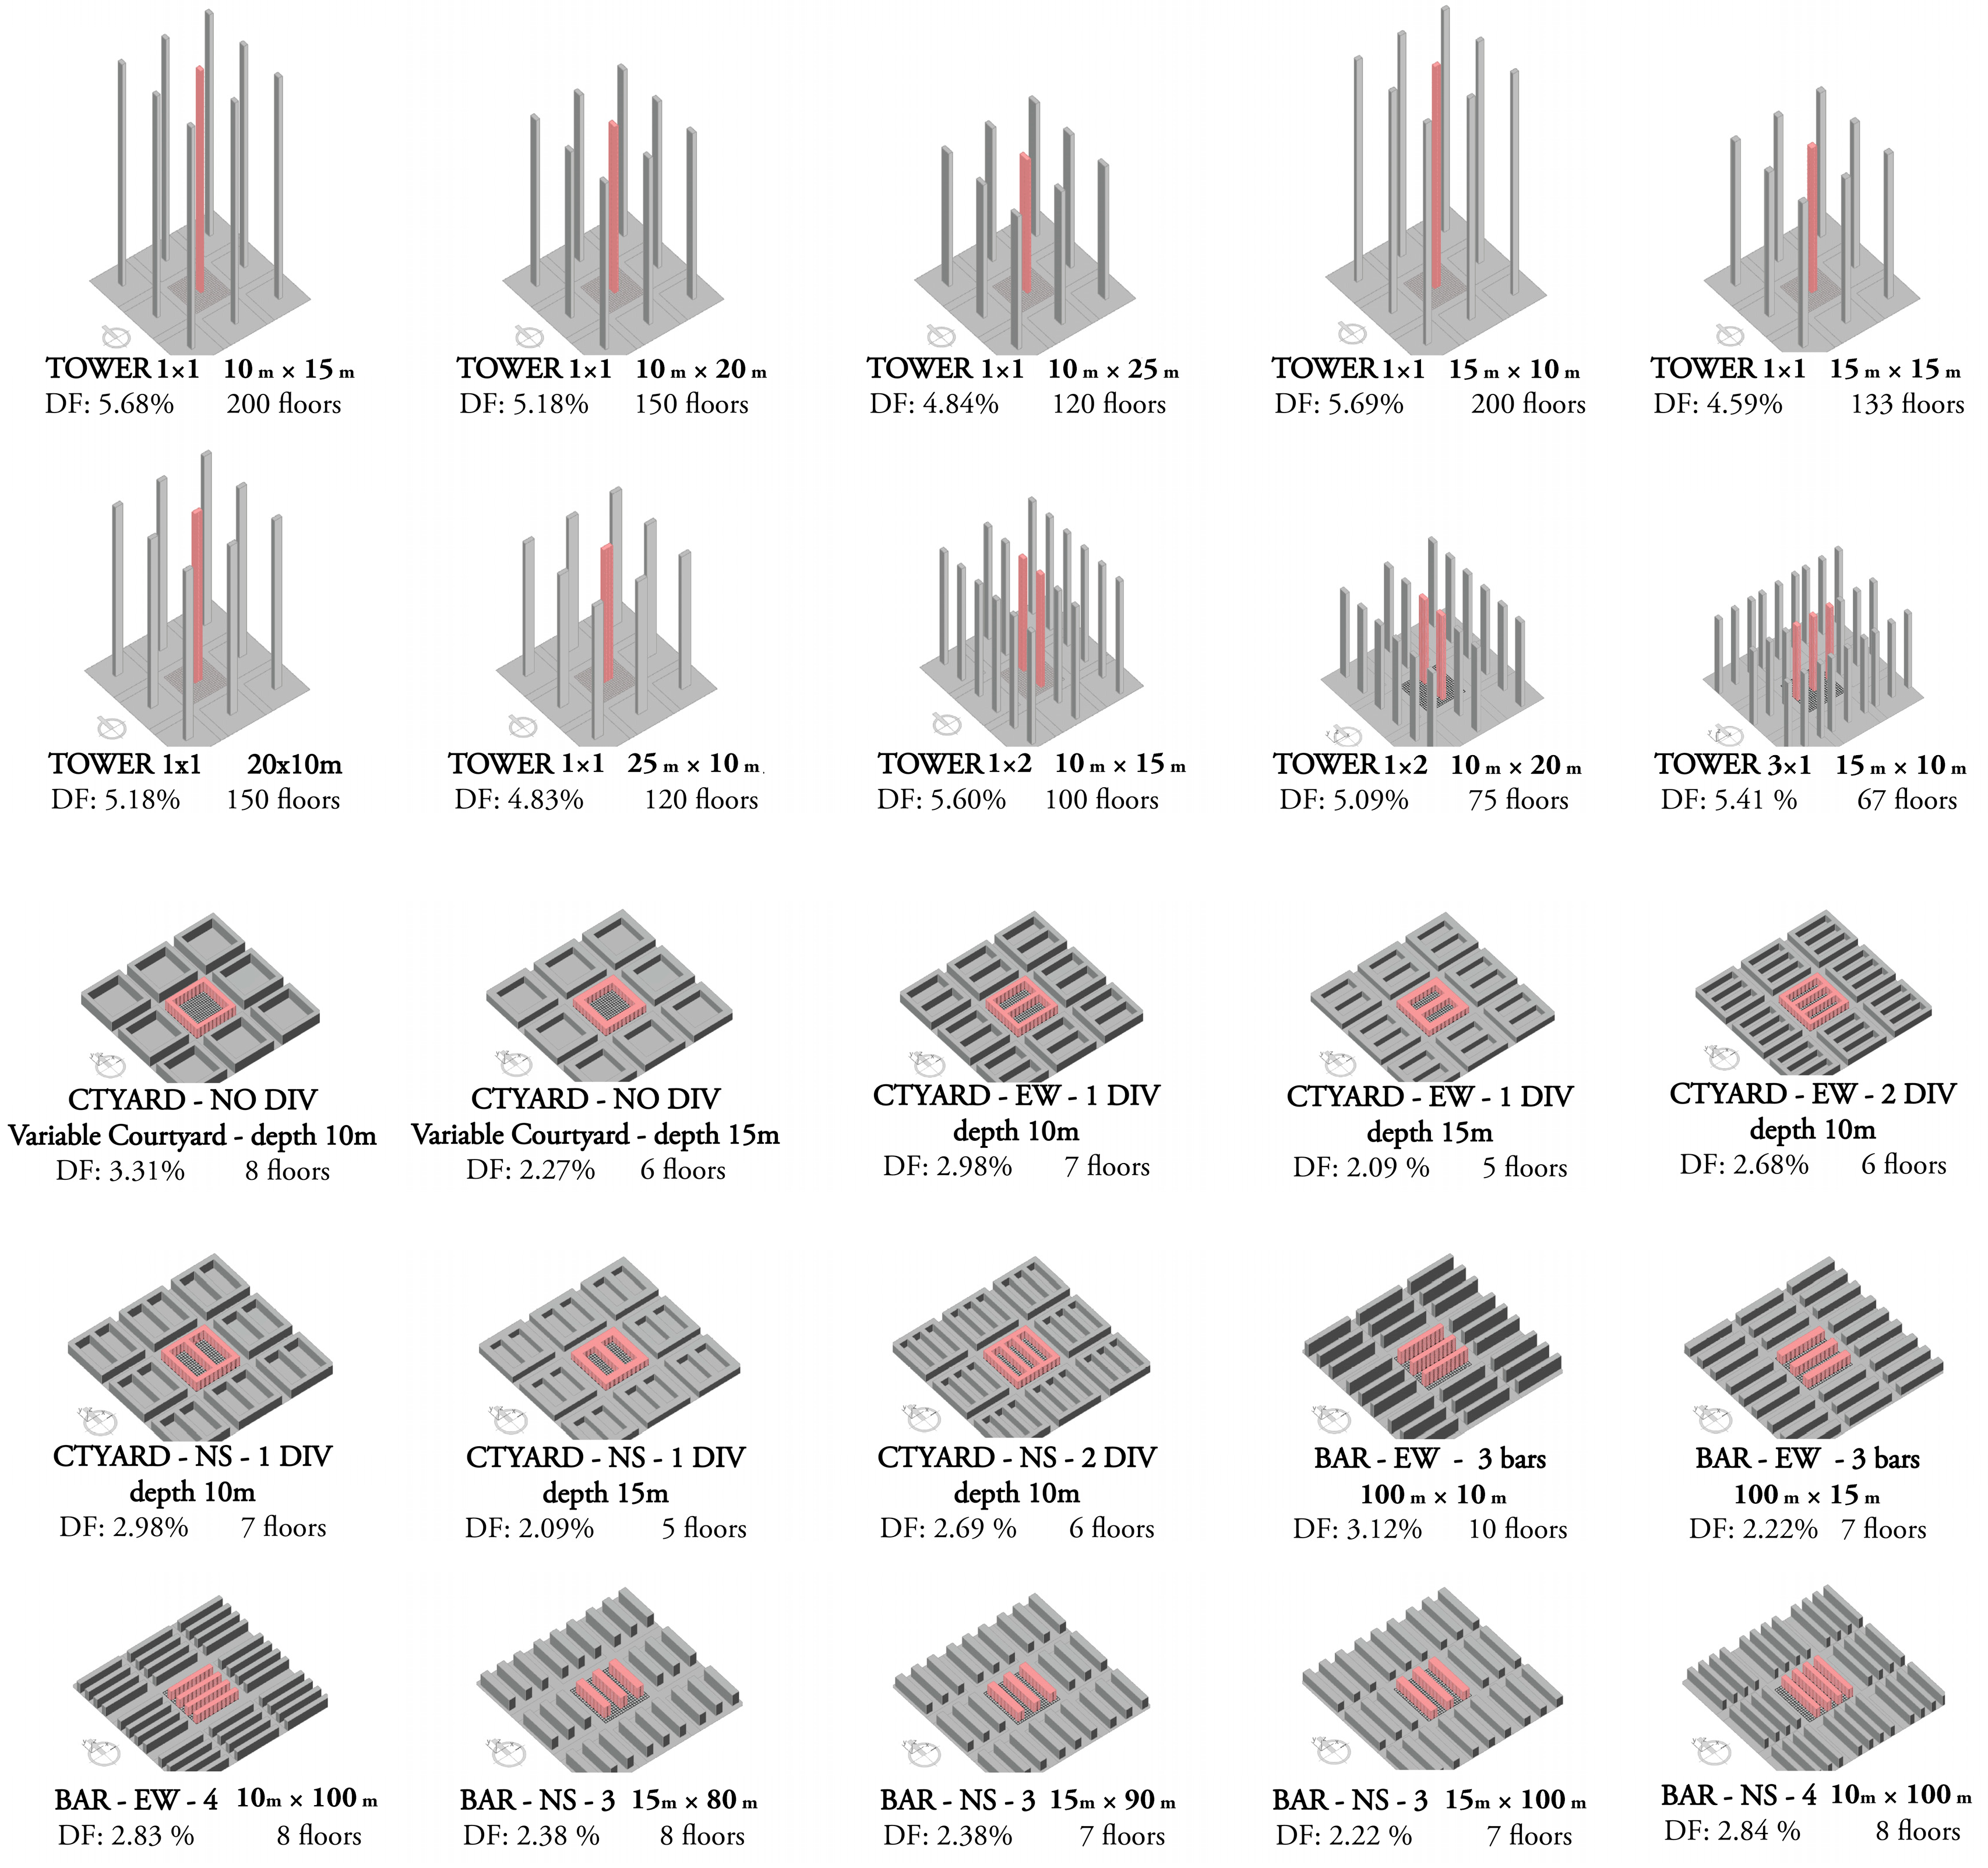
The study includes all possible design variants for a building of FAR 3, using geometric variables that designers most commonly iterate in the early-design stage at the neighborhood scale, for a total of 312 cases. Building width and length vary with a 5 m step interval and a 3 m floor height; distance between buildings and size of inner courtyards also follow a 5 m step interval with a minimum of 15 m. Depth of residential units is set at either 5 m or 10 m; building layout includes single- and double-loaded corridors, plus a nominal 5 m service corridor for circulation and mechanical space, resulting in a total building depth that ranges between 10 m (single 5 m unit plus service core) and 25 m (double 10 m units plus service core).
Design variants include schemes with one to twelve buildings each, with variations applied to all buildings equally. Shapes are limited to orthogonal, four-sided footprints to allow for a complete set of iterations that covers all possible combinations yet is small enough to process with available computational power. Building orientation is identified throughout the study as N/S or E/W based on the longest axis being oriented north-south or east-west, respectively (Figure 1).

3.3. Modeling and Simulations

The design space sampling was populated by using a parametric routine that systematically iterates geometric variables related to building form and layout, starting from three base case typologies: tower, bar, and courtyard (Figure 2). Rhinoceros was used for 3D modeling and visualization of results, while the parametric modeling was done with Grasshopper, a visual scripting program that allows to iterate geometric changes to the model. Building performance analyses have been modeled using the climatic conditions of New York, defined by ASHRAE as Climate Zone 4A [47] and were done via Ladybug and Honeybee plugins [48].
Radiation analysis uses a cumulative sky method to compute annual diffuse and direct irradiation levels; reflection of sunlight is not included at this stage. The local weather data file for New York City shows high global horizontal radiation levels, with 224 sunny days per year, according to the German Weather Service (DWD) accounting method.
Energy need simulations were EnergyPlus-based, and the parameters were modeled in accordance with the adaptive comfort normative (ISO 17772:2017) using a setpoint temperature of 20 °C for heating and 26 °C for cooling. The occupancy schedule reflects the changing lifestyle related to the COVID-19 pandemic occurring at the time of research, which is likely to affect the lifestyle for the years to come; it assumes that 100% of occupants are at home from 6 pm to 9 am and 50% from 9 am to 6 pm on working days, while 100% of the occupants are at home on weekends. Daylight saving time was also considered. Daylighting analysis was performed using Radiance- and Daysim-based simulations. The urban context was accounted for with 0.2 reflectance value; the analysis grid is set at the work plane height of 0.8 m. The Radiance parameters are responsible for distributing the light and its reflections according to the rendering options and were applied as: ab 2; ad 32; as 32; ar 32; and aa 0.2. The selection of Radiance parameters balances accuracy and simulation time.

3.4. Performance Assessment and Metrics

Two broad strategies can be adopted for the analysis of building variations, with each one presenting some limitation imposed by computational load:
(a)
Using easier-to-compute radiation-based simulations, such as solar exposure on external surfaces expressed as irradiation or illuminance, on a large pool of iterations, often generated by an algorithm; simpler metrics, however, carry limitations of their own, as they often lack sensitivity to the very geometric variables that they are meant to assess;
(b)
Using whole-building energy analysis, such as total energy need and spatial daylight autonomy, on only a limited number of design options; full-climate analyses are computationally expensive and require input data that are typically not available at the early stage of design. In addition, design options are generated by using traditional heuristics, such as rules-of-thumb or designer’s knowledge and intuition, severely limiting the design space.
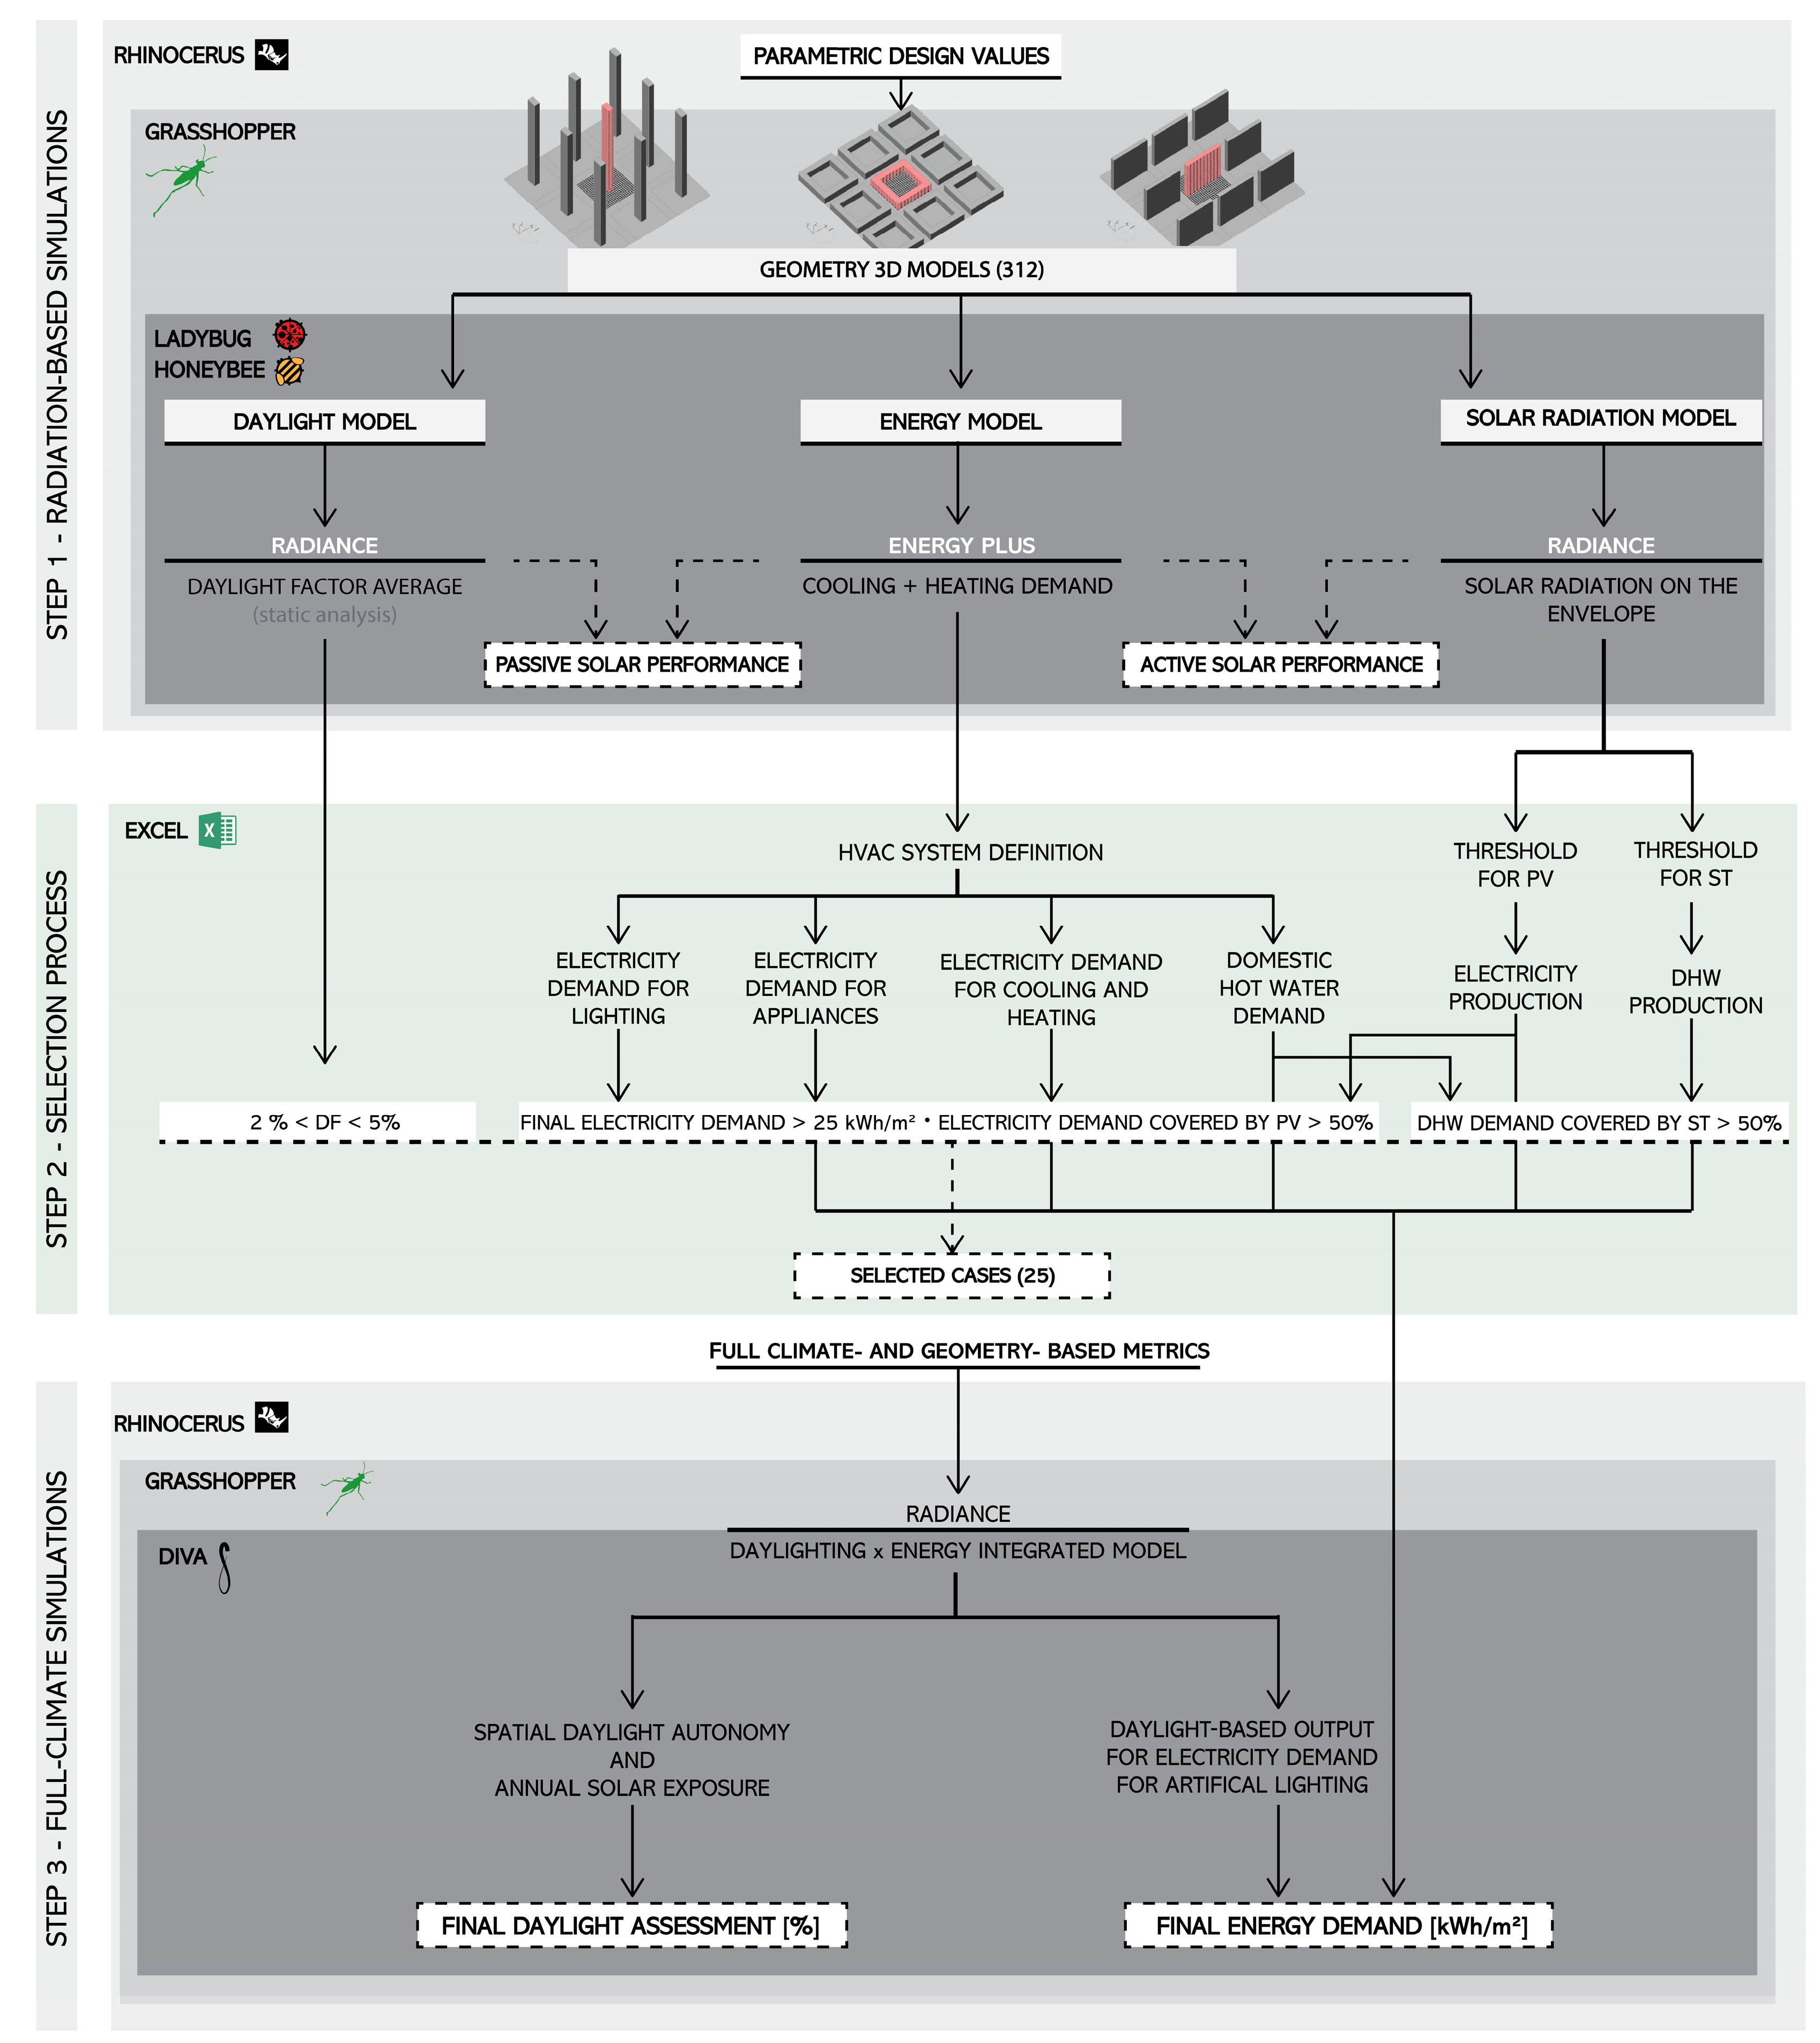
The present research attempts to overcome some of these limitations by combining the two methods in a three-step approach:
  • Step 1—Radiation-based simulations: the first step uses computationally friendly metrics on the entire set of iterations, with the intent to identify general patterns and correlations between geometric variables and building performance.
  • Step 2—Selection process: simulations in Step 3 are computationally expensive, so the process requires to narrow down the pool of design iterations by using performance thresholds compatible with current energy regulation trends.
  • Step 3—Full-climate simulations: the last step evaluates a pool of selected configurations using full-climate simulations and a synthetic indicator to arrive at a final ranking based on total energy needs.

3.5. Step 1: Trends and Correlations

3.5.1. Metrics

The first step uses the following radiation-based metrics:
  • Annual energy demand (kWh/m2), accounting for the thermal load for heating and cooling required to achieve the comfort set-points temperature indoors, normalized by total floor area; this metric provides a measure of passive solar heating and the risk of overheating.
  • Daylight factor average (%), defined as the ratio between indoor illuminance at a point in a building and the outdoor horizontal illuminance under a CIE overcast sky; this metric expresses the potential benefits of natural daylight in lowering energy consumption.
  • Solar potential (kWh), evaluated as the total annual radiation falling over the envelope, both vertical and horizontal; this metric measures solar availability, and in this first step, it is used as an indicator of potential energy production by active solar systems (PV and ST).

3.5.2. Correlation Studies

Results are presented through scatter plots pairing indicators as related to either passive or active performance; the intent is to identify formal traits associated to positive or conflicting (i.e., multi-objective) correlations in each of these two energy regimes:
  • Step 1a—Passive solar performance: Daylight factor Average vs. annual energy demand: These metrics are conventional passive energy indicators; results should help identify buildings with low energy needs as a result of shape alone.
  • Step 1b—Active solar performance: Solar potential vs. Annual energy demand: Solar potential is a well-acknowledged criterion for active energy, while energy demand provides context also in relation to the notion of solar fraction; results should help identify building shapes with the ability to collect the most irradiation for conversion into electricity or domestic hot water (DHW).

3.6. Step 2: Selection Process

3.6.1. Metrics

Iterations are selected using the following metrics based on further processing of irradiation-based data previously obtained:
  • Electricity demand (kWh) for heating and cooling is calculated by converting the annual energy demand from Step 1 into electricity requirement by approximating the behavior of a realistic HVAC system with high-efficiency characteristics, defined as a heat pump operating for heating, cooling, and DHW, with COP = 3.7 and EER = 3.4.
  • Domestic hot water demand is calculated based on the annual consumption for activities such as showering, hand washing, and laundry for the occupancy of one person every 35 m2, following the method from Yao and Steemers [49].
  • Electric lighting and appliances electricity requirements are, at this step, accounted for by using reference values for the residential program. The load for appliances is set at 3.875 W/m2, and the artificial lighting density is set at 11.84 W/m2. Due to the computational cost, the latter is not yet simulated according to the daylighting conditions but solely based on square meters.
  • Energy production (kWh) is obtained by estimating the energy produced by photovoltaic panels and solar thermal collectors, using efficiency values of 0.15 and 0.7, respectively, mounted parallel to the surface of façades (vertical) and roofs (horizontal), based on the envelope area receiving an irradiation level as follows: 200 to 400 kWh/m2 for ST collectors and over 400 kWh/m2 for PV panels.
  • Final electricity demand (kWh) includes the electricity demand for heating and cooling, electric lighting and appliances, plus any electricity required to produce DHW not covered by ST collectors, minus the electricity produced by PV panels.
It should be noted that ST collectors are solely dedicated to cover the DHW demand, therefore reducing the purchased energy necessary for its production. Any DHW demand that is not covered by ST is produced by the heat pump and converted into electricity through the coefficient COPDHW = 2.36, based on a high-performing product available on the market at the time of the research. The energy produced by the PV panels is used to offset the total electricity need by the heat pump (heating + cooling + DHW).

3.6.2. Thresholds

The original pool of 312 building configurations goes through a selection process using the metrics defined above and based on the following criteria, including a global energy performance indicator and renewable energy coverage:
  • DF average, across all floors of the building, higher than 2%;
  • At least 50% of the electricity demand covered by photovoltaic panels;
  • At least 50% of the DHW demand covered by solar thermal collectors;
  • Final electricity demand lower than 25 kWh/m2.
These criteria reflect common trends in many current energy regulations and labels, including, for example, the Italian legislation [50] that deals with the Implementation of Directive 2009/28/EC. Results should help identifying building shapes with very low total energy demand and the ability to collect the most irradiation for conversion into electricity and DHW, therefore reducing the amount of purchased energy from the grid.

3.7. Step 3: Synthetic Indicator and Final Ranking

3.7.1. Metrics

The second step evaluates the pool of twenty-five selected configurations through a new set of fine-grained, full climate-based analysis, using the following indicators:
  • Spatial daylight autonomy (%): this metric examines “whether a space receives enough daylight during standard operating hours on an annual basis using hourly illuminance grids on the horizontal work plane” [51]. It is expressed as the percentage of floor area (or grid sensors) that achieves at least 300 lux for at least half of the occupied hours over the year, therefore ranging from 0 to 100% of the evaluated space. sDA, combined with the annual solar exposure (ASE), is part of the LEED certification daylight requirement [52], and the thresholds are:
    sDA ≥ 75%: preferred by occupants;
    55% ≤ sDA < 75%: “nominally accepted” space by the occupants;
    sDA < 55%: not acceptable.
  • Annual solar exposure (%): ASE describes how much space receives too much direct sunlight, which can cause visual discomfort (glare) or increase cooling loads. Specifically, ASE measures the percentage of floor area that receives at least 1000 lux for at least 250 occupied hours per year. This metric is coupled with sDA by the LEED criteria to make sure light discomfort is accounted for. Therefore, not only is a high sDA percentage desirable, but also, ASE should be lower than 10%. ASE was evaluated as a secondary metric, as direct sunlight and glare risk can, in any case, be controlled by shading devices that are too detailed for this study.
  • Final energy demand (kWh/m2): identifies the amount of energy purchased from the grid after the offset from on-site renewables has been accounted for. It constitutes a final synthetic indicator because it includes heating and cooling and electric lighting based on case-specific daylighting conditions calculated on an hourly basis, appliances, and DHW and is offset by hot water and electricity production from solar panels.

3.7.2. Final Ranking

Using a synthetic indicator that accounts for the overall building performance, including the energy implications of scarce daylighting, allows to move beyond trade-off equivalence in some cases (i.e., visual comfort vs. energy use). This is possible thanks to climate-based daylight analyses that produce a more accurate assessment of visual comfort conditions, including the number of hours when artificial lighting is necessary to supplement daylighting levels. Results should show which building form results in the lowest energy use overall, including passive and active solar contributions. In addition, they show if any solution meets the nZEB requirements that are fast becoming mandatory in many countries.
A scheme of the process is presented in Figure 3.

4. Findings

4.1. Passive Solar Performance

4.1.1. Analysis

Bars

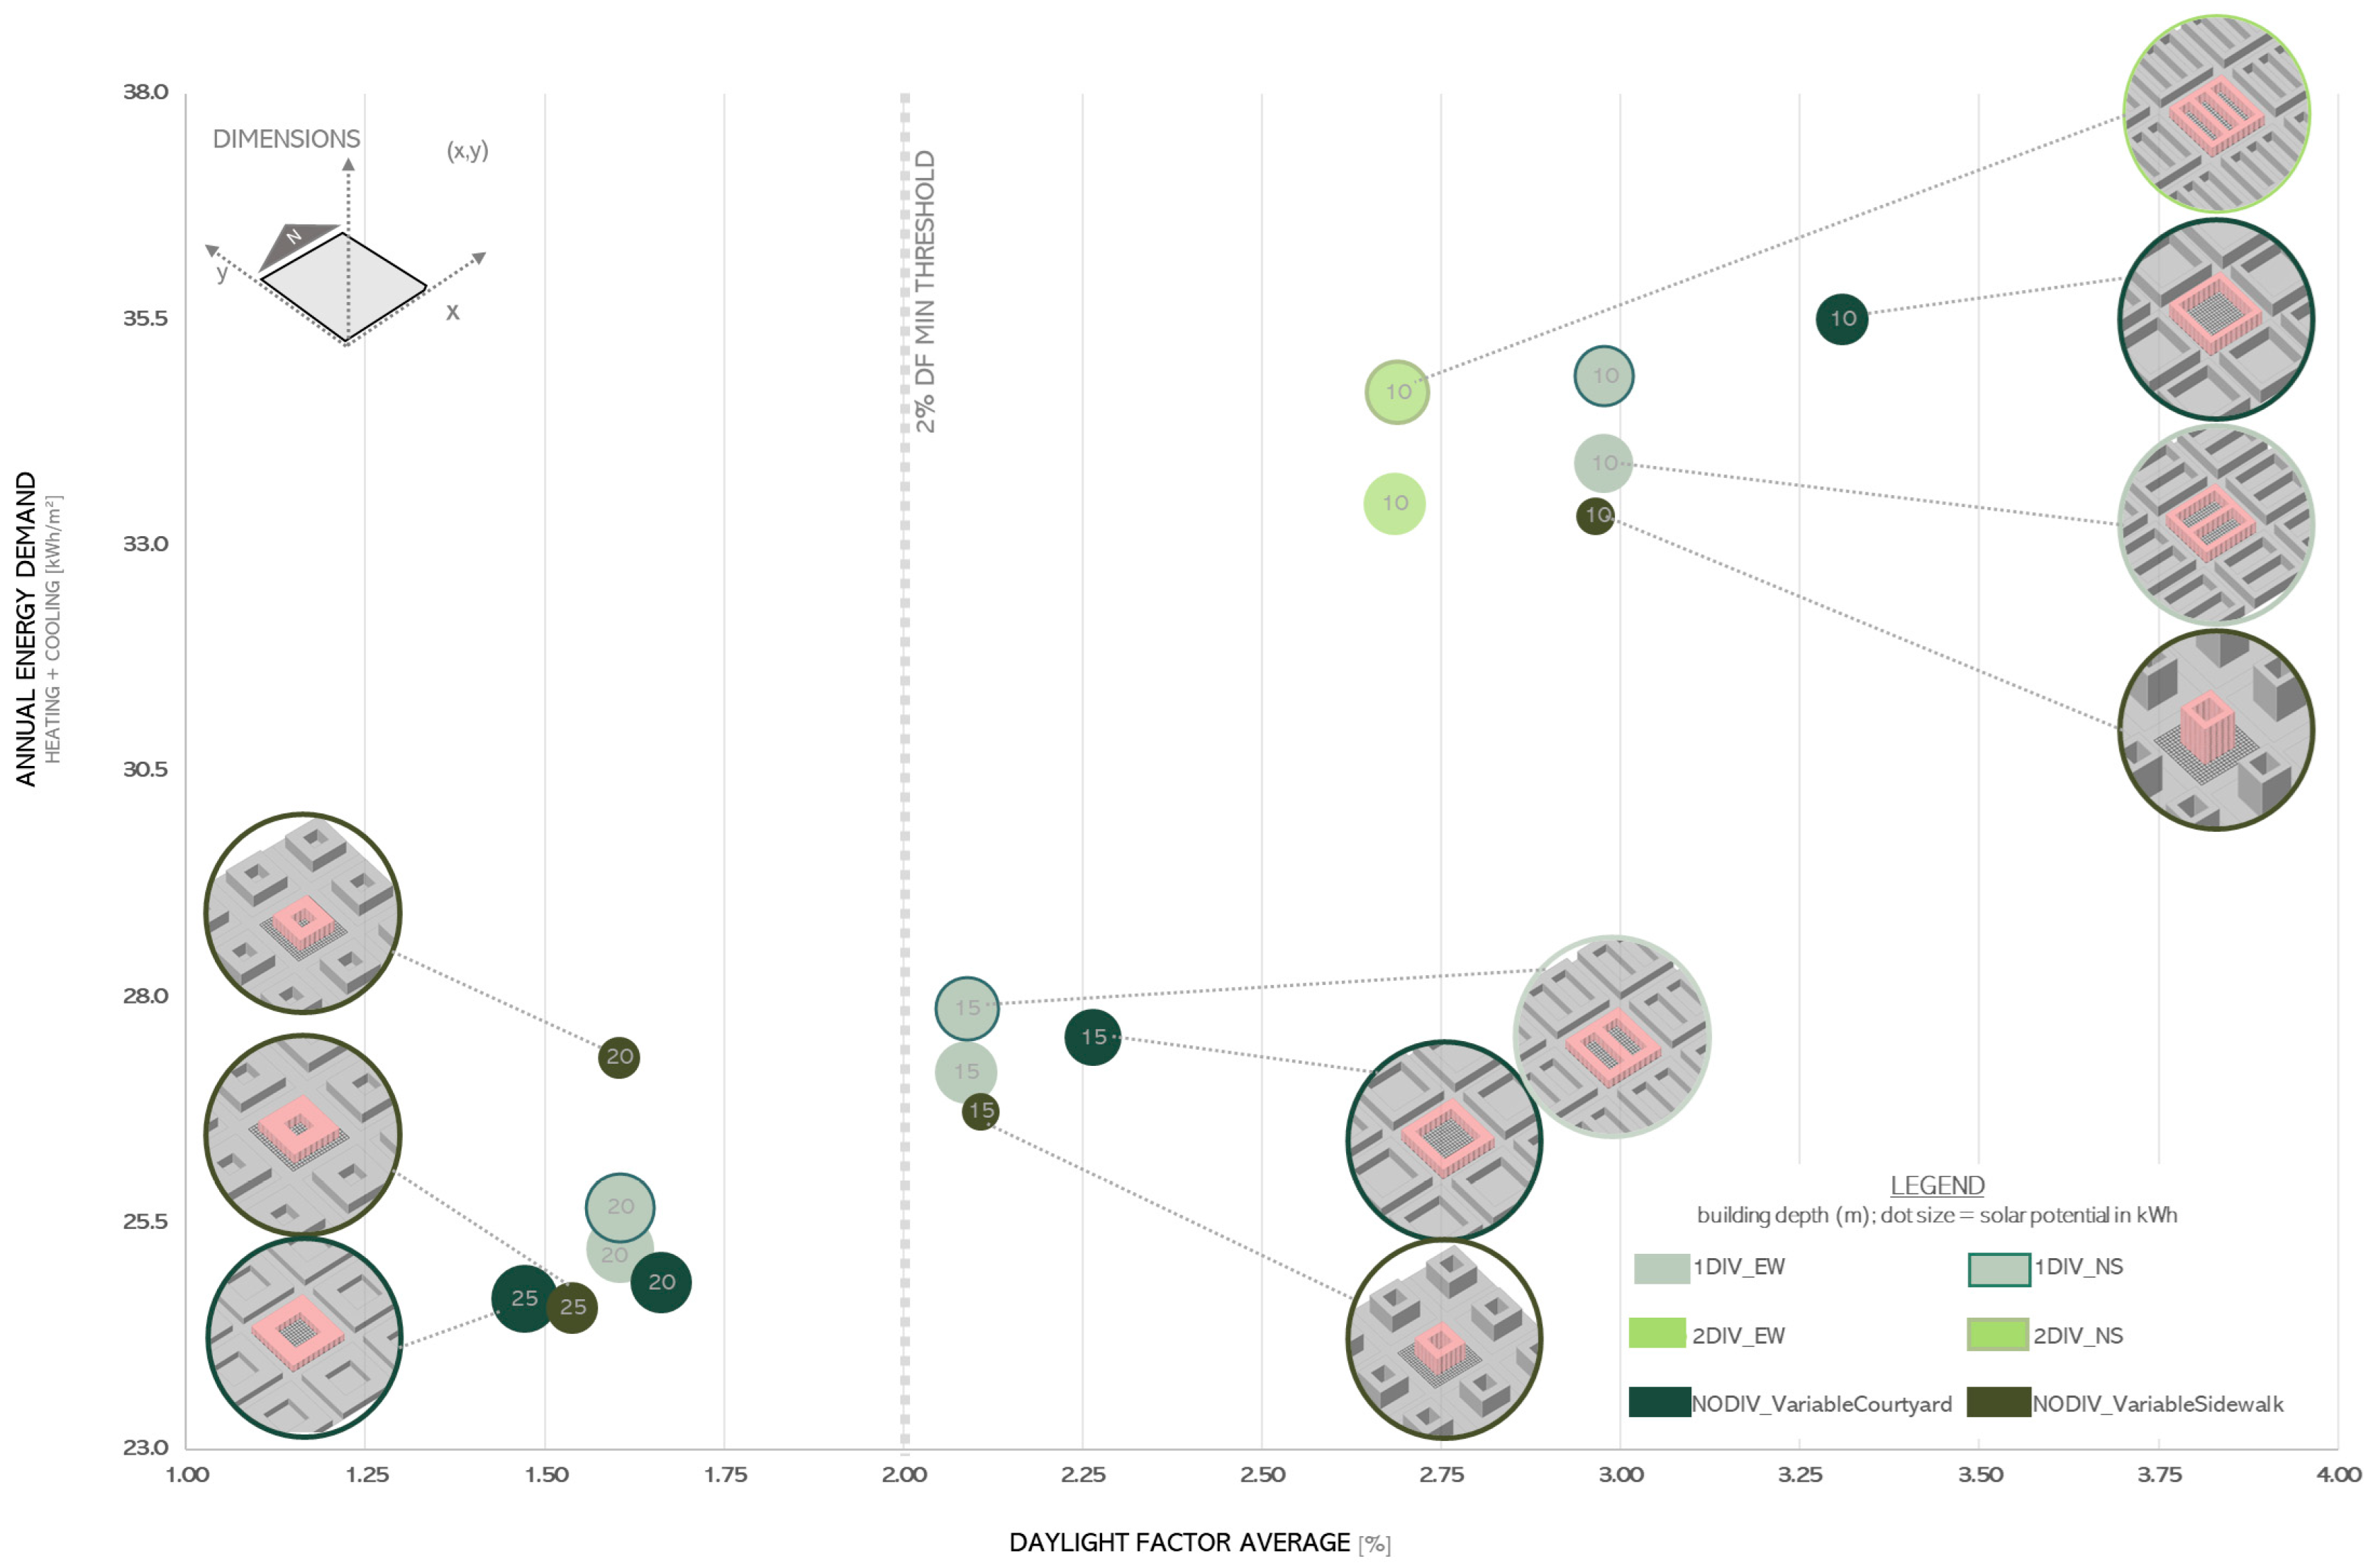
The scatterplot of 168 BAR cases (Figure 4) clearly shows a positive correlation between energy use and daylight. As expected, shallower floor plates with higher surface-to-volume ratio are clearly associated with both higher DF and higher energy use. In particular, the impact of floor depth on:
  • Daylighting: The graph largely confirms the assumption that daylight availability is heavily dependent on floor depth. The relationship is not linear, however, as each 5 m step in floor depth reduction has an increasingly larger impact on DF. For instance, for a 100 m long 1-bar layout reducing depth from 25 m to 20 m increases DF by 20%; from 20 m to 15 m, the increase is 27%; and from 15 m to 10 m, the increase is 41%.
  • Energy use: Similarly, each step has an increasingly larger impact on energy use: for the same 100 m long 1-bar layout, reducing depth from 25 m (24.2 kWh/m2) to 20 m (25 kWh/m2) results in 3% increase; from 20 m (25 kWh/m2) to 15 m (27.1 kWh/m2) in 8% increase; and from 15 m (27.1 kWh/m2) to 10 m (35.3 kWh/m2) in 30% increase. Comparing the two indicators, it appears that with shallower floors, energy use increases faster than DF.
The impact of building height and length is much smaller on either indicator, with taller, slender buildings (e.g., 10 m × 40 m, 75 stories, DF 4.4%, energy use 40 kWh/m2) resulting in 13% higher DF and energy use as compared to lower, squatter buildings (e.g., 10 m × 100 m, 30 stories, DF 3.9%, energy use 35.3 kWh/m2).
The impact of number of buildings on:
  • Daylighting: The graph shows that each additional building placed on the same plot reduces the potential beneficial impact of floor depth on daylight availability. In other words, decreasing the distance between buildings reduces the amount of available daylight so that less irradiation reaches each building in the first place, ultimately reducing the potential benefit of a shallow floor plate.
  • Energy use: While a higher number of buildings can place severe limitations on solar access, it does not seem to affect energy use; in other words, “crowding” the site has the only effect of limiting daylight, without any balancing benefit of reducing energy use.
The impact of orientation on:
  • Daylighting: Bars oriented both N/S and E/W show very similar values since the daylight factor is not dependent on orientation, as it considers only diffuse radiation under overcast sky conditions.
  • Energy use: Bars with N/S orientation display a slightly higher (up to 10%) energy use than E/W orientation for the same geometry and number of buildings. This is probably due to excessive solar intake by east and west elevations in the summer and insufficient intake by the south elevation in the winter for the N/S orientation. The difference in energy needs is reduced by the number of buildings, as the effect of orientation is mitigated by overshadow.

Towers

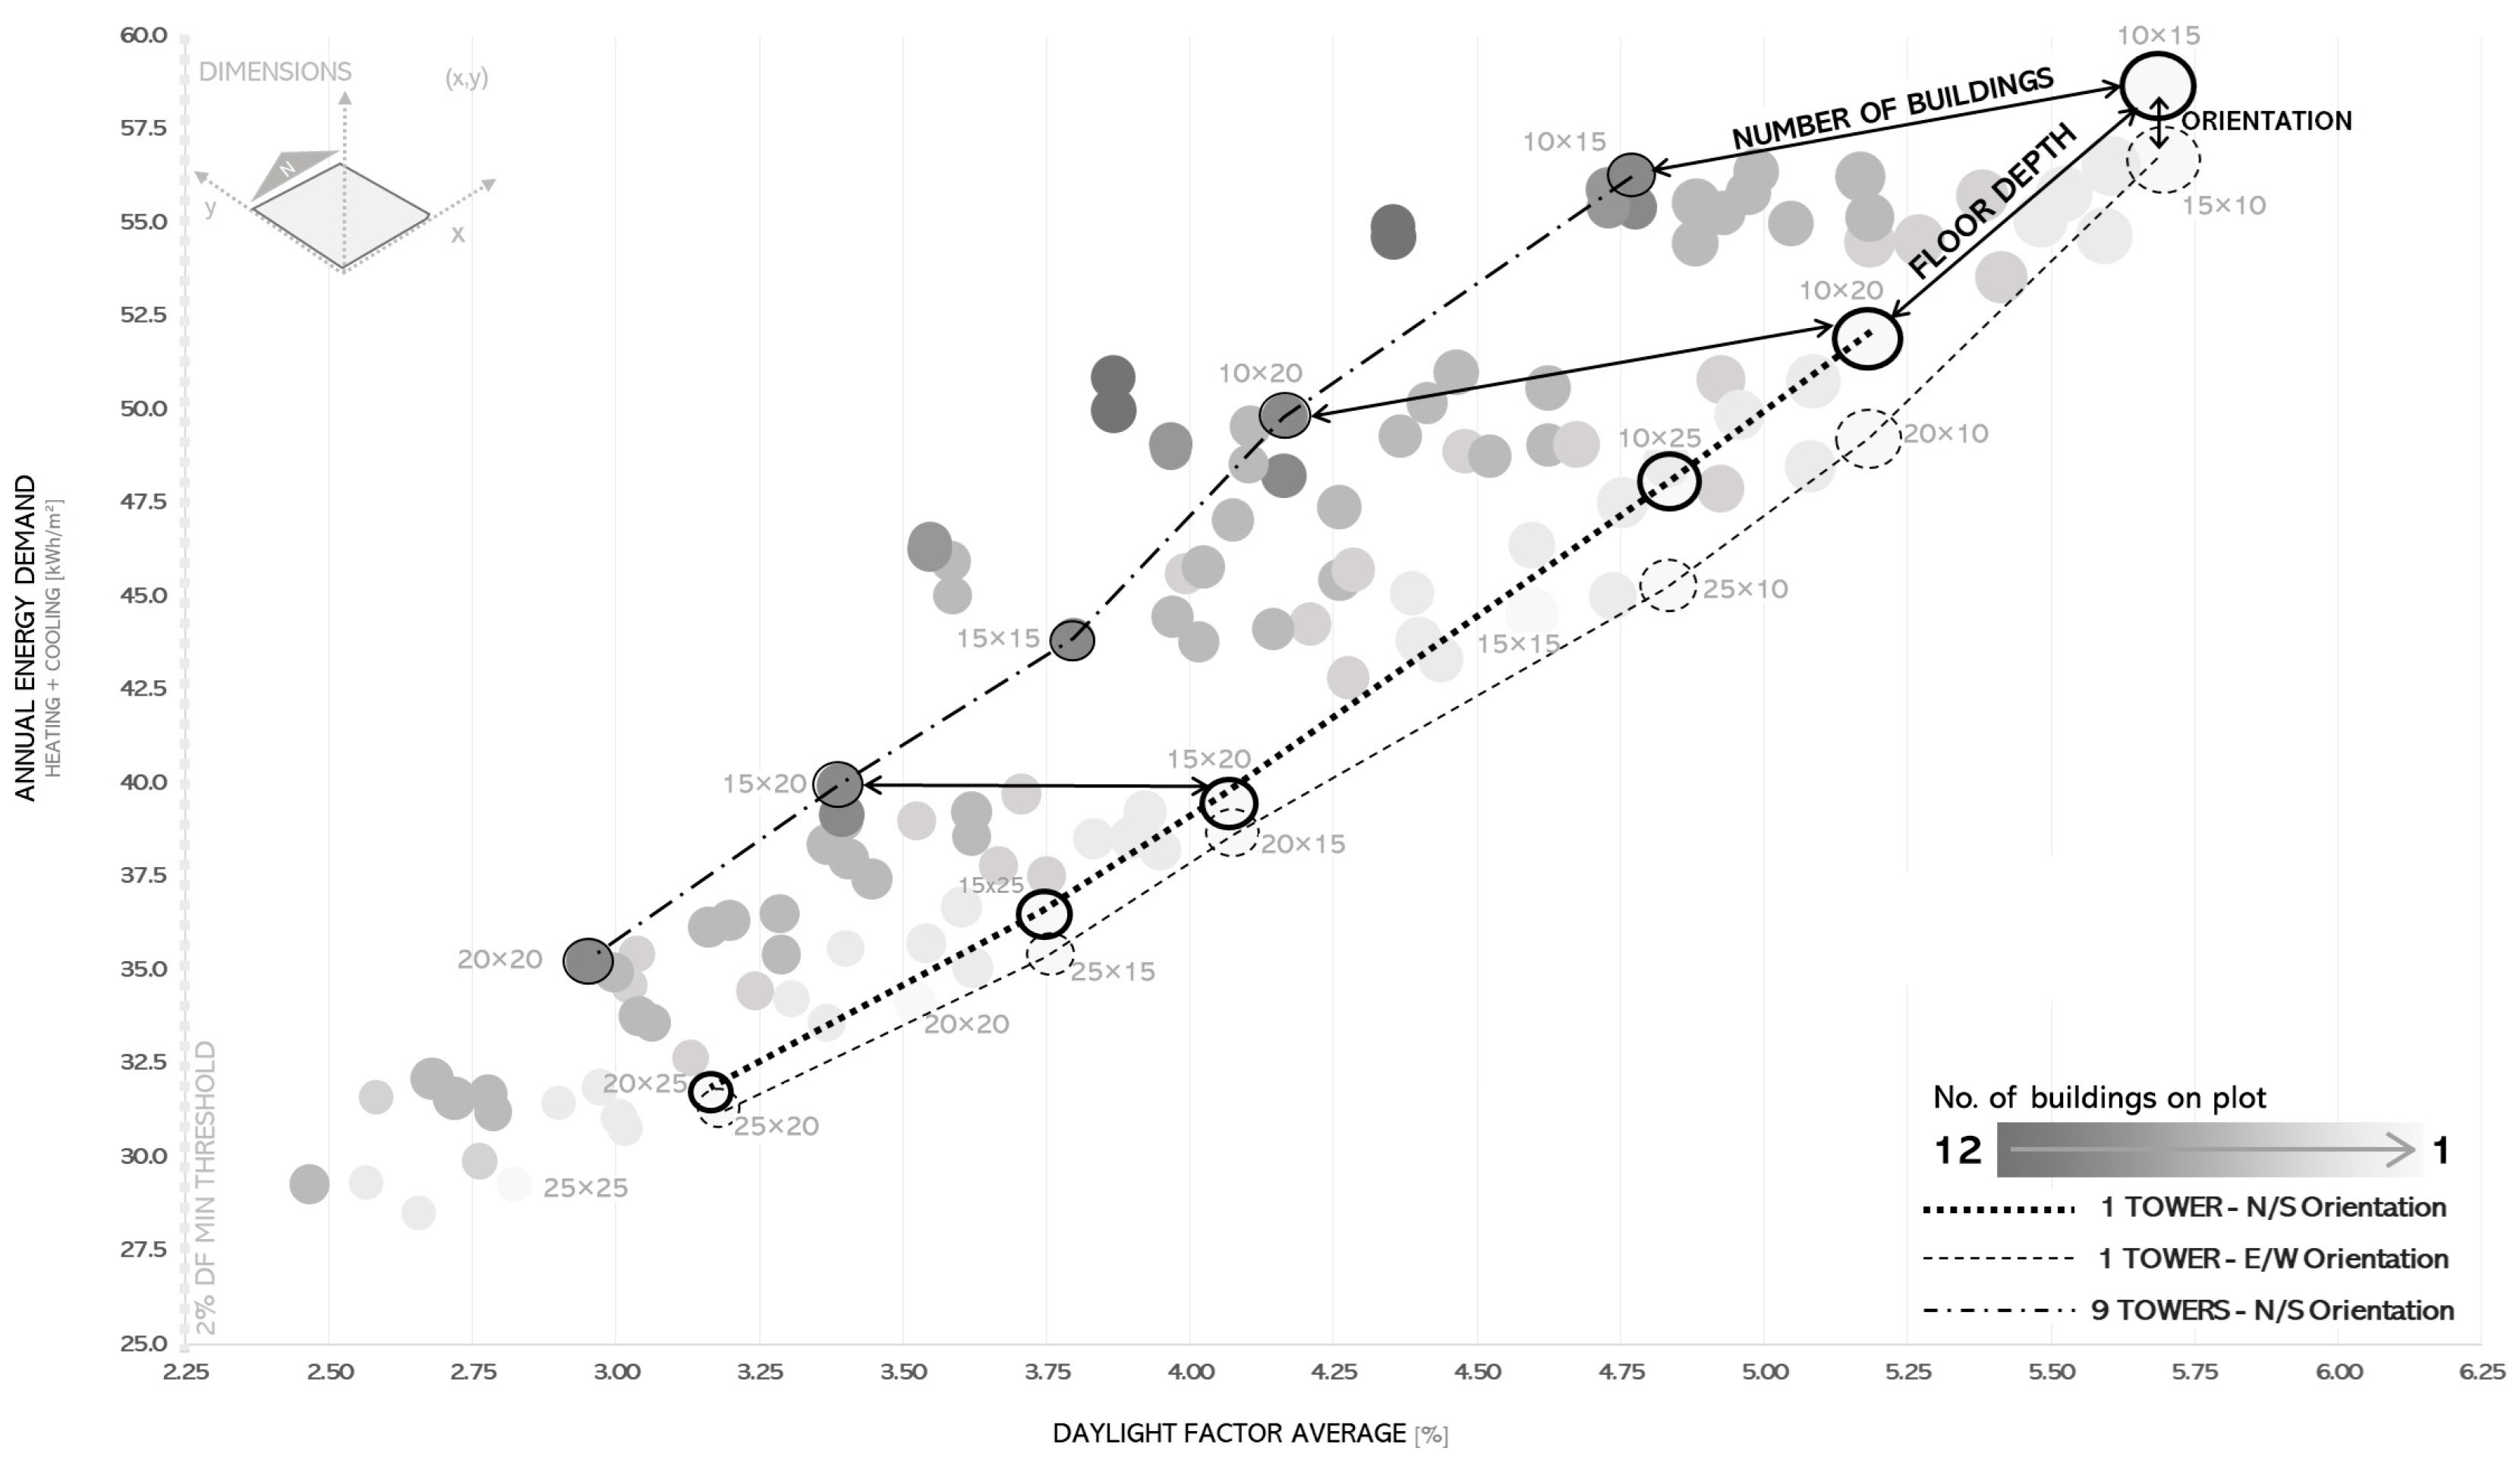
Many of the same trends observed for bars also apply to towers (Figure 5):
  • Daylight factor and energy demand continue to show a strong linear correlation, only with a range of values for both indicators that is higher and wider for towers than for bars. These indicators are still heavily dependent on floor depth, with each 5 m reduction for either of the two footprint dimensions resulting in a 10% to 30% increase for both indicators.
  • In relation to the number of buildings, the incremental reduction of daylight with more buildings on the site is still present but less accentuated, showing that towers are less susceptible than bars to overshadowing. As with the bars, energy demand does not appear to depend on the number of buildings despite the very large disparity in number of floors and building height: a two-tower scheme with 100 floors each and an eight-tower scheme with 25 floors each have the same energy demand (56 kWh/m2).
  • Orientation of towers has a minimal influence on energy use, with N/S still resulting in slightly higher values. Because more towers fit on the site than bars (up to twelve towers vs. four bars), their layout as related to orientation is also a factor; however, it does not seem to produce any meaningful difference in either daylighting or energy use.

Courtyards

Courtyards show some of the same trends observed for bars and towers (Figure 6):
  • Daylight factor and energy demand still show a strong correlation to floor depth, with each 5 m reduction resulting in a 32% (from 20 m to 15 m) and 43% (from 15 m to 10 m) increase for DF and a 10% (from 20 m to 15 m) and 26% (from 15 m to 10 m) increase for energy use. Compared to previous typologies, courtyards have a lower range of daylight and energy values overall, with all cases presenting a floor depth of 25 m and 20 m falling outside of the acceptable threshold DF > 2. More than for any other typology, floor depth is by far the most influential factor among the many variables tested for courtyards, such as number and orientation of divisions and distance from edge of site. This is demonstrated by the clustering of variants by floor depth, with each cluster at some distance from each other, following the linear regression line.
  • At a finer scale, within building with equal floor depth, the open courtyard (no division) has a slightly better DF value as compared to two and three divisions; surprisingly, DF appears to be only minimally affected by the size of courtyards as defined by divisions, while energy is not affected at all. This suggests a certain intrinsic flexibility in accommodating dimensional variation without negatively affecting daylighting, which a courtyard might possess by form, perhaps due to the mitigating effect of its many intersections and contrasting exposures.
  • Orientation of courtyard divisions has a minimal influence on energy use and none on DF values; like for towers, energy use and solar potential are slightly higher for N/S orientations.

4.1.2. Results

Comparing Typologies

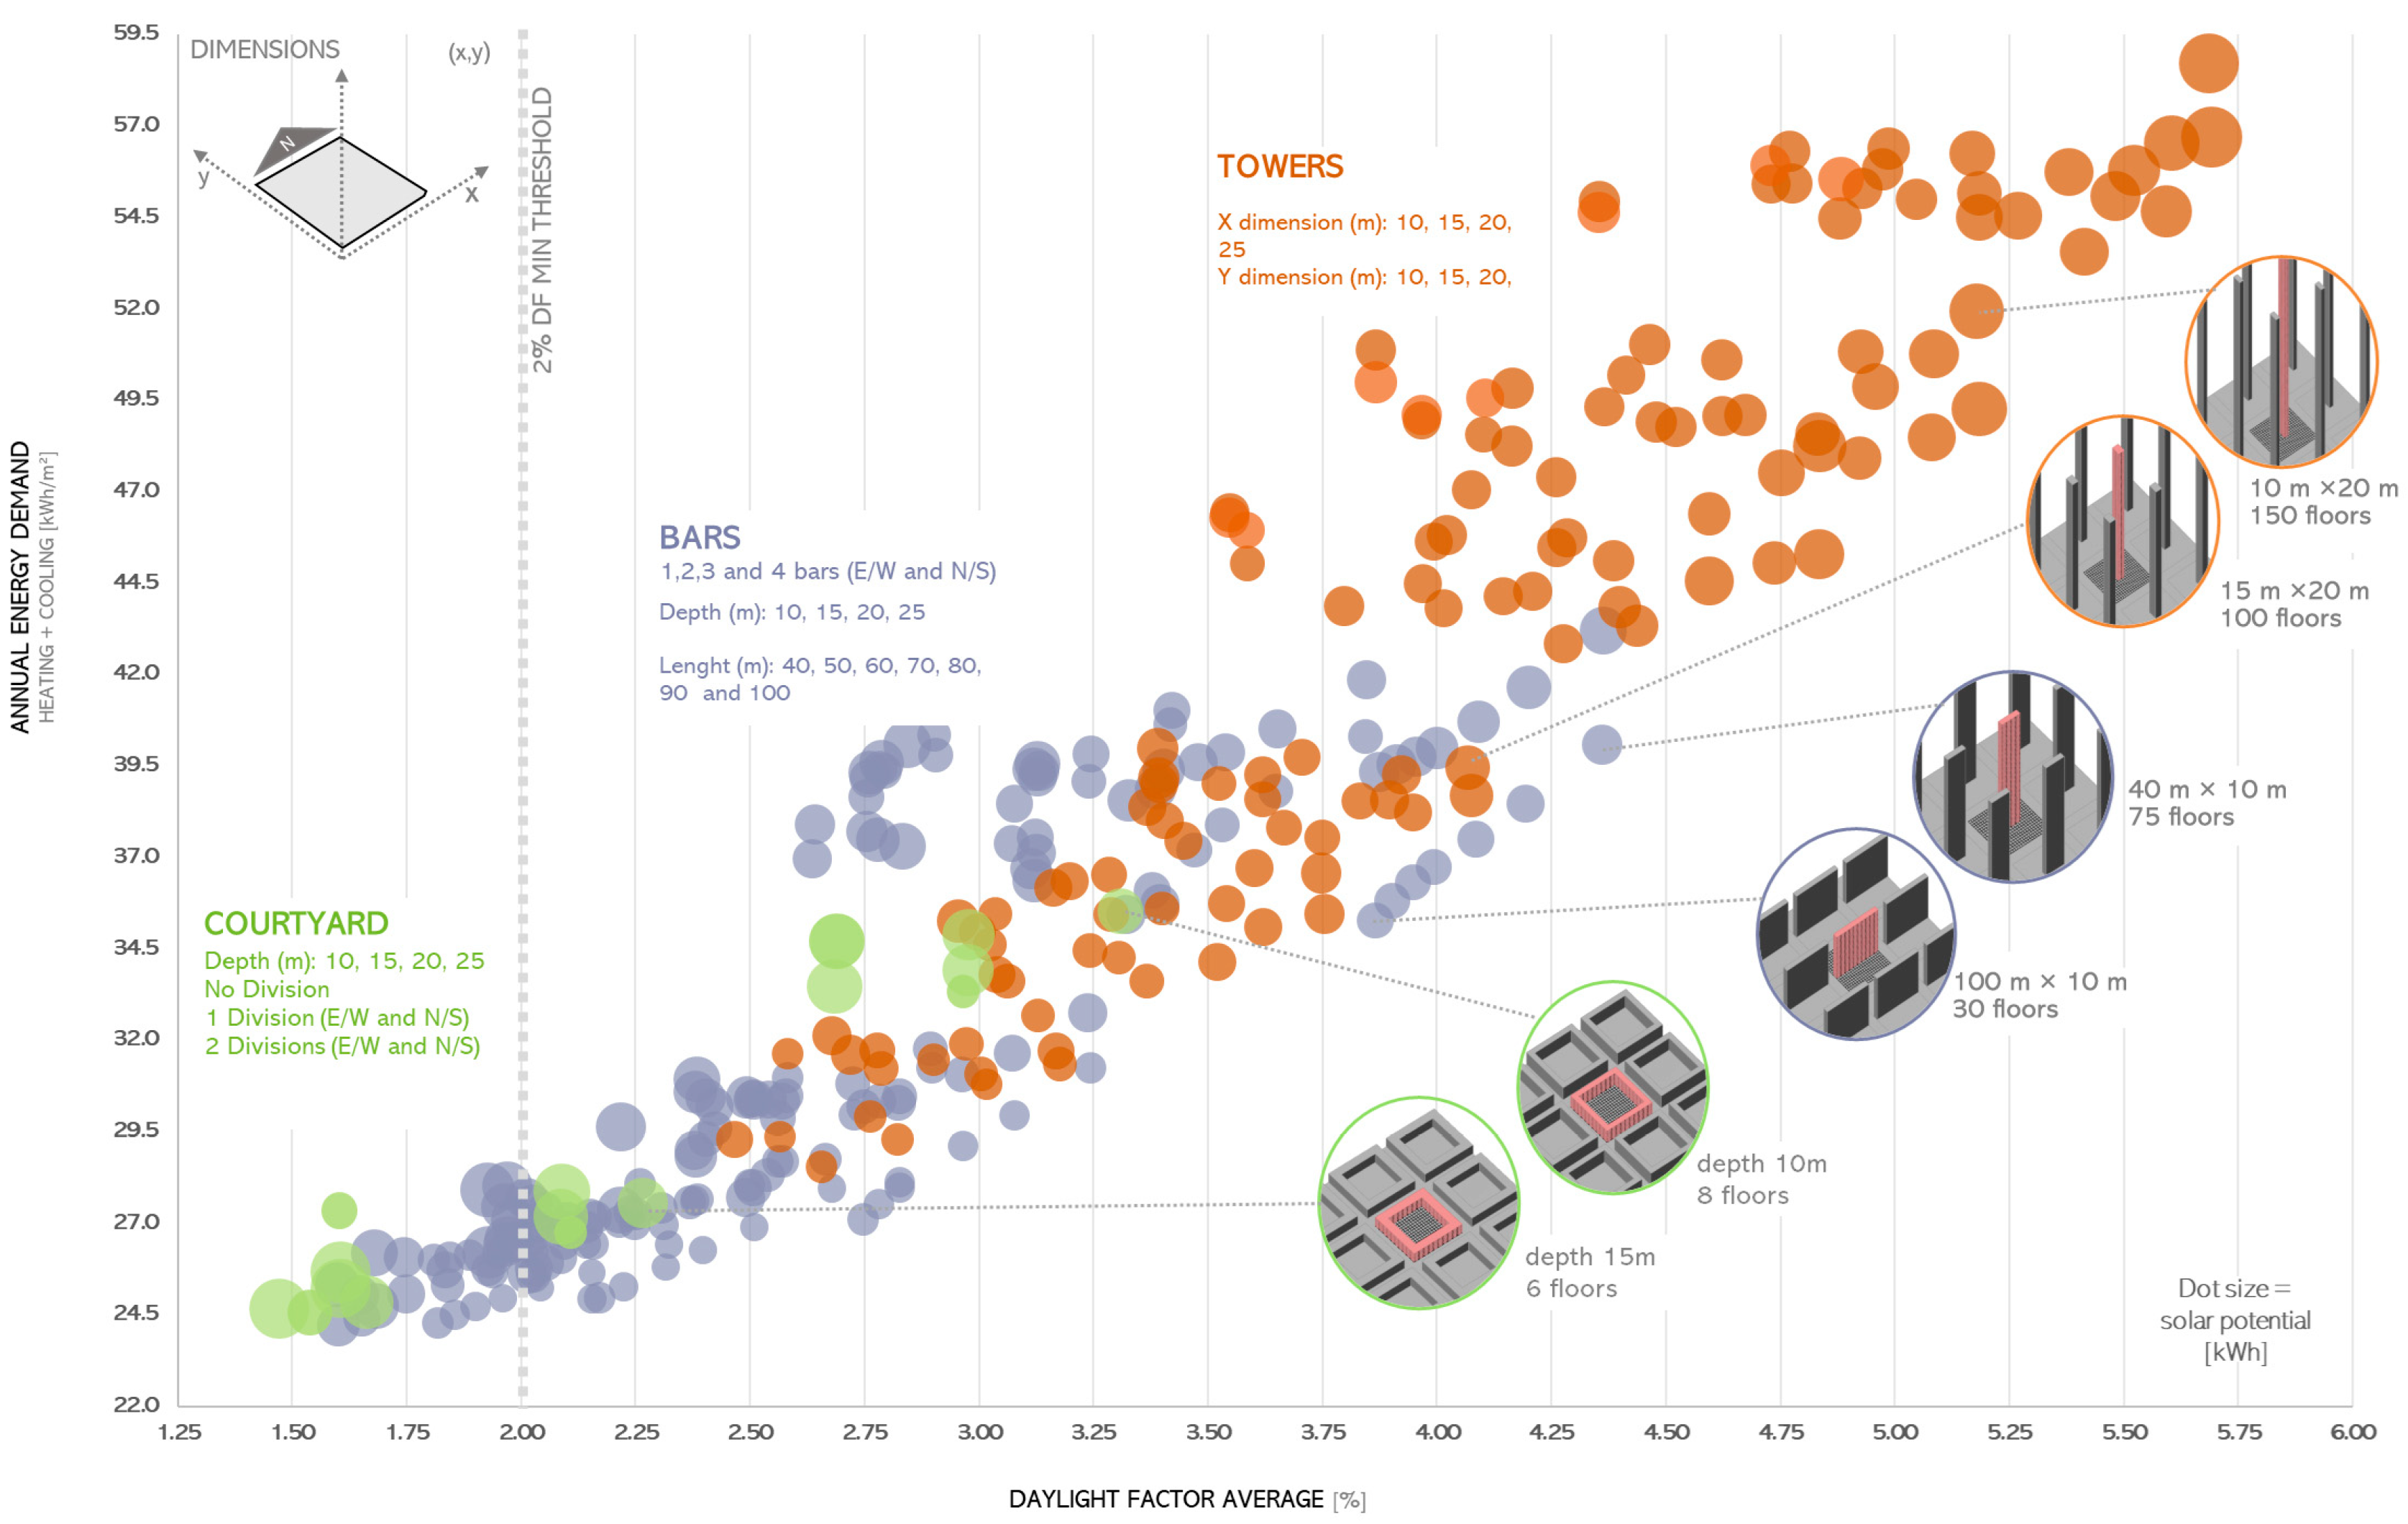
Towers have the widest range and the highest values for daylighting and energy demand, with a maximum of 5.7% for DF and 100% of cases above 2%. The ceiling for energy demand is at about 58 kWh/m2. Orientation has a negligible impact on energy use, with E/W marginally better than N/S.
  • Exemplary case: 1 tower, 15 m × 20 m footprint, 100-story high, either orientation (39 kWh/m2, 4.05 DF).
Bars present the widest variability in percentage for daylight values, as they are most susceptible to the number of buildings on the plot, with a maximum DF of 4.4%. Maximum viable floor depth is 20 m, as most cases with 25 m floor depth fall below 2%. Bars present a ceiling for energy demand at 43 kWh/m2. They are the most sensitive to the orientation of the three typologies, with about 10% lower energy need for E/W.
  • Exemplary case: 1 bar, 100 m × 10 m footprint, 30-story high, E/W orientation (35 kWh/m2, 3.9 DF).
Courtyards have the lowest DF with a maximum value of 3.3% and a maximum viable floor depth of 15 m with DF > 2%. The ceiling for energy demand is at around 35 kWh/m2; orientation of subdivisions has a negligible impact on energy use, with E/W marginally better than N/S.
  • Exemplary case: 1 courtyard, 10 m deep, 8-story high, no subdivisions (35.5 kWh/m2, 3.30 DF).
Figure 7 illustrates the results comparison.

Comparing Trends

Trends for passive solar indicators (Figure 8) appear to be remarkably consistent across the three typologies although ranges differ:
  • Building depth is the dominant factor in determining daylighting and energy use for all typologies and particularly for bars, with DF values increasing by a factor of 2.8 and energy use by a factor of 1.8 when floor depth is reduced from 25 m to 10 m. This confirms a large body of research regarding the benefits of a shallow floor plate but also reveals a larger range of variability than previously documented. It should be noted that iterations with floor depth above 25 m (towers), 20 m (bars), and 15 m (courtyards) fall outside the acceptable range for DF > 2%. Building height and length, on the other hand, have a surprisingly small effect on both daylight and energy use, with only a 10% difference between best- and worst-performing bars.
  • Number of buildings (and spacing between them) can greatly limit the potential for shallow floor plates to increase daylighting, with up to 40% lower DF values for four bars as compared to one bar with the same 10 m deep floor. This confirms a long-held belief that overshadowing is of primary importance as compared to building footprint. Decisions taken at the urban scale in terms of aspect ratio and/or site coverage may compromise any subsequent decision taken by the architect at the building scale. Daylight potential that has been compromised by adjacent buildings cannot be recaptured at the building scale—at least not by designing an appropriate footprint alone. On the other hand, the number of buildings has only minimal effects on energy needs. This clearly dispels the assumption that buildings at a reduced distance from each other, sometimes erroneously associated with the notion of urban density, should result in lower energy needs.
  • Orientation (N/S vs. E/W) produces only a mild effect on energy use, with values for N/S up to 10% higher for the same geometry and number of buildings. It is a somewhat surprising result, given the long-lasting debate on the subject starting in the mid-19th century, that orientation should have only a minor influence on energy performance across such a large pool of cases. Daylighting is not considered in relation to orientation at this stage, as DF is not sensitive to orientation.

4.2. Active Solar Potential

4.2.1. Analysis

Bars

  • Solar potential in bars (Figure 9) does not display a linear correlation to either shape or number of buildings; instead, values follow a well curve with peaks associated to two concomitant factors: (1) a single narrow, taller bar or (2) many longer, lower bars; energy potential for intermediate configurations falls in between these two peaks. This means that higher solar radiation is collected by either vertical surfaces on a single tall building minimally over-shaded or on roof surfaces on many low-rise, densely packed buildings. Intermediate configurations (mid-rise/mid-length buildings) do not perform as well because vertical surfaces are increasingly overshadowed, while roof surfaces are not large enough to compensate for it. Only when buildings are long and numerous does the roof surface become dominant, and overall solar potential increases.
  • Bars with N/S orientation display up to 21% higher solar potential than for E/W orientation for the same geometry and number of buildings. This differential is reduced to about 10% by increasing the number of buildings on the site, perhaps because the roof, less susceptible to overshadow, becomes the main source of solar potential.

Towers

  • Solar potential in towers (Figure 10) follows a more predictable trend, similar to DF, as values increase with shallower footprints and taller towers and decrease with more buildings on the site. However, for more than four buildings, the opposite is true: trend lines reverse, and this time, solar potential decreases with shallower footprints and taller towers. We see here the beginning of that same pattern (or crossover) that appears more explicit with bars: peak values are associated with fewer towers (one to four), with a small footprint (and therefore taller) and a large, minimally overshadowed envelope, or with eight to twelve towers on the same site, with a larger footprint (and therefore shorter), where roof surface can compensate for reduced radiation on the envelope.
  • Orientation of towers has a minimal influence on energy potential.

Courtyards

  • Solar potential shows large variability in courtyards (Figure 11), with higher values associated with two concomitant factors: more divisions and a deeper floor plate. These two circumstances clearly indicate that most radiation is collected by the roof, not the envelope, which makes courtyard the only typology to rely almost exclusively on its roof for active potential. Here, the trend well-described above still applies, but all courtyards lie on the ascending half of the curve after the inflection point, where solar potential moves in the opposite direction as compared to daylight.
  • Orientation of courtyard divisions has a minimal influence on solar potential, with slightly higher values for N/S orientation. This is consistent with the observation that this typology relies on horizontal surfaces for active solar, which are not susceptible to orientation.

4.2.2. Results

Comparing Typologies

  • Courtyards have surprisingly high solar potential comparable only to best-performing towers, with peak values at around 13.106 kWh. They present the largest gap between daylight performance and energy potential, moving from left to right on the lower half of the graph. This is a first clear case of diverging trends when comparing passive and active solar: the typology with lowest daylighting is also the one with best active solar potential.
  • Bars present a large variability, with a concentration of cases in the low-performing lower left corner of the graph. A few individual tall and narrow bars with good daylighting still exhibit good solar potential. On the opposite end of their geometric range, however, a few cases with three to four long bars with very poor daylighting shift to the right of the solar potential scale and occupy the same portion of the graph as best-performing courtyards. This is a second case of diverging results when moving from passive to active solar.
  • Towers largely confirm an excellent solar potential consistent with their daylighting performance; this is the typology with most uniform results for active solar as compared to daylighting. Interestingly, it appears that a ceiling exists for active energy potential across the range of typologies, at about 13 × 106 kWh.
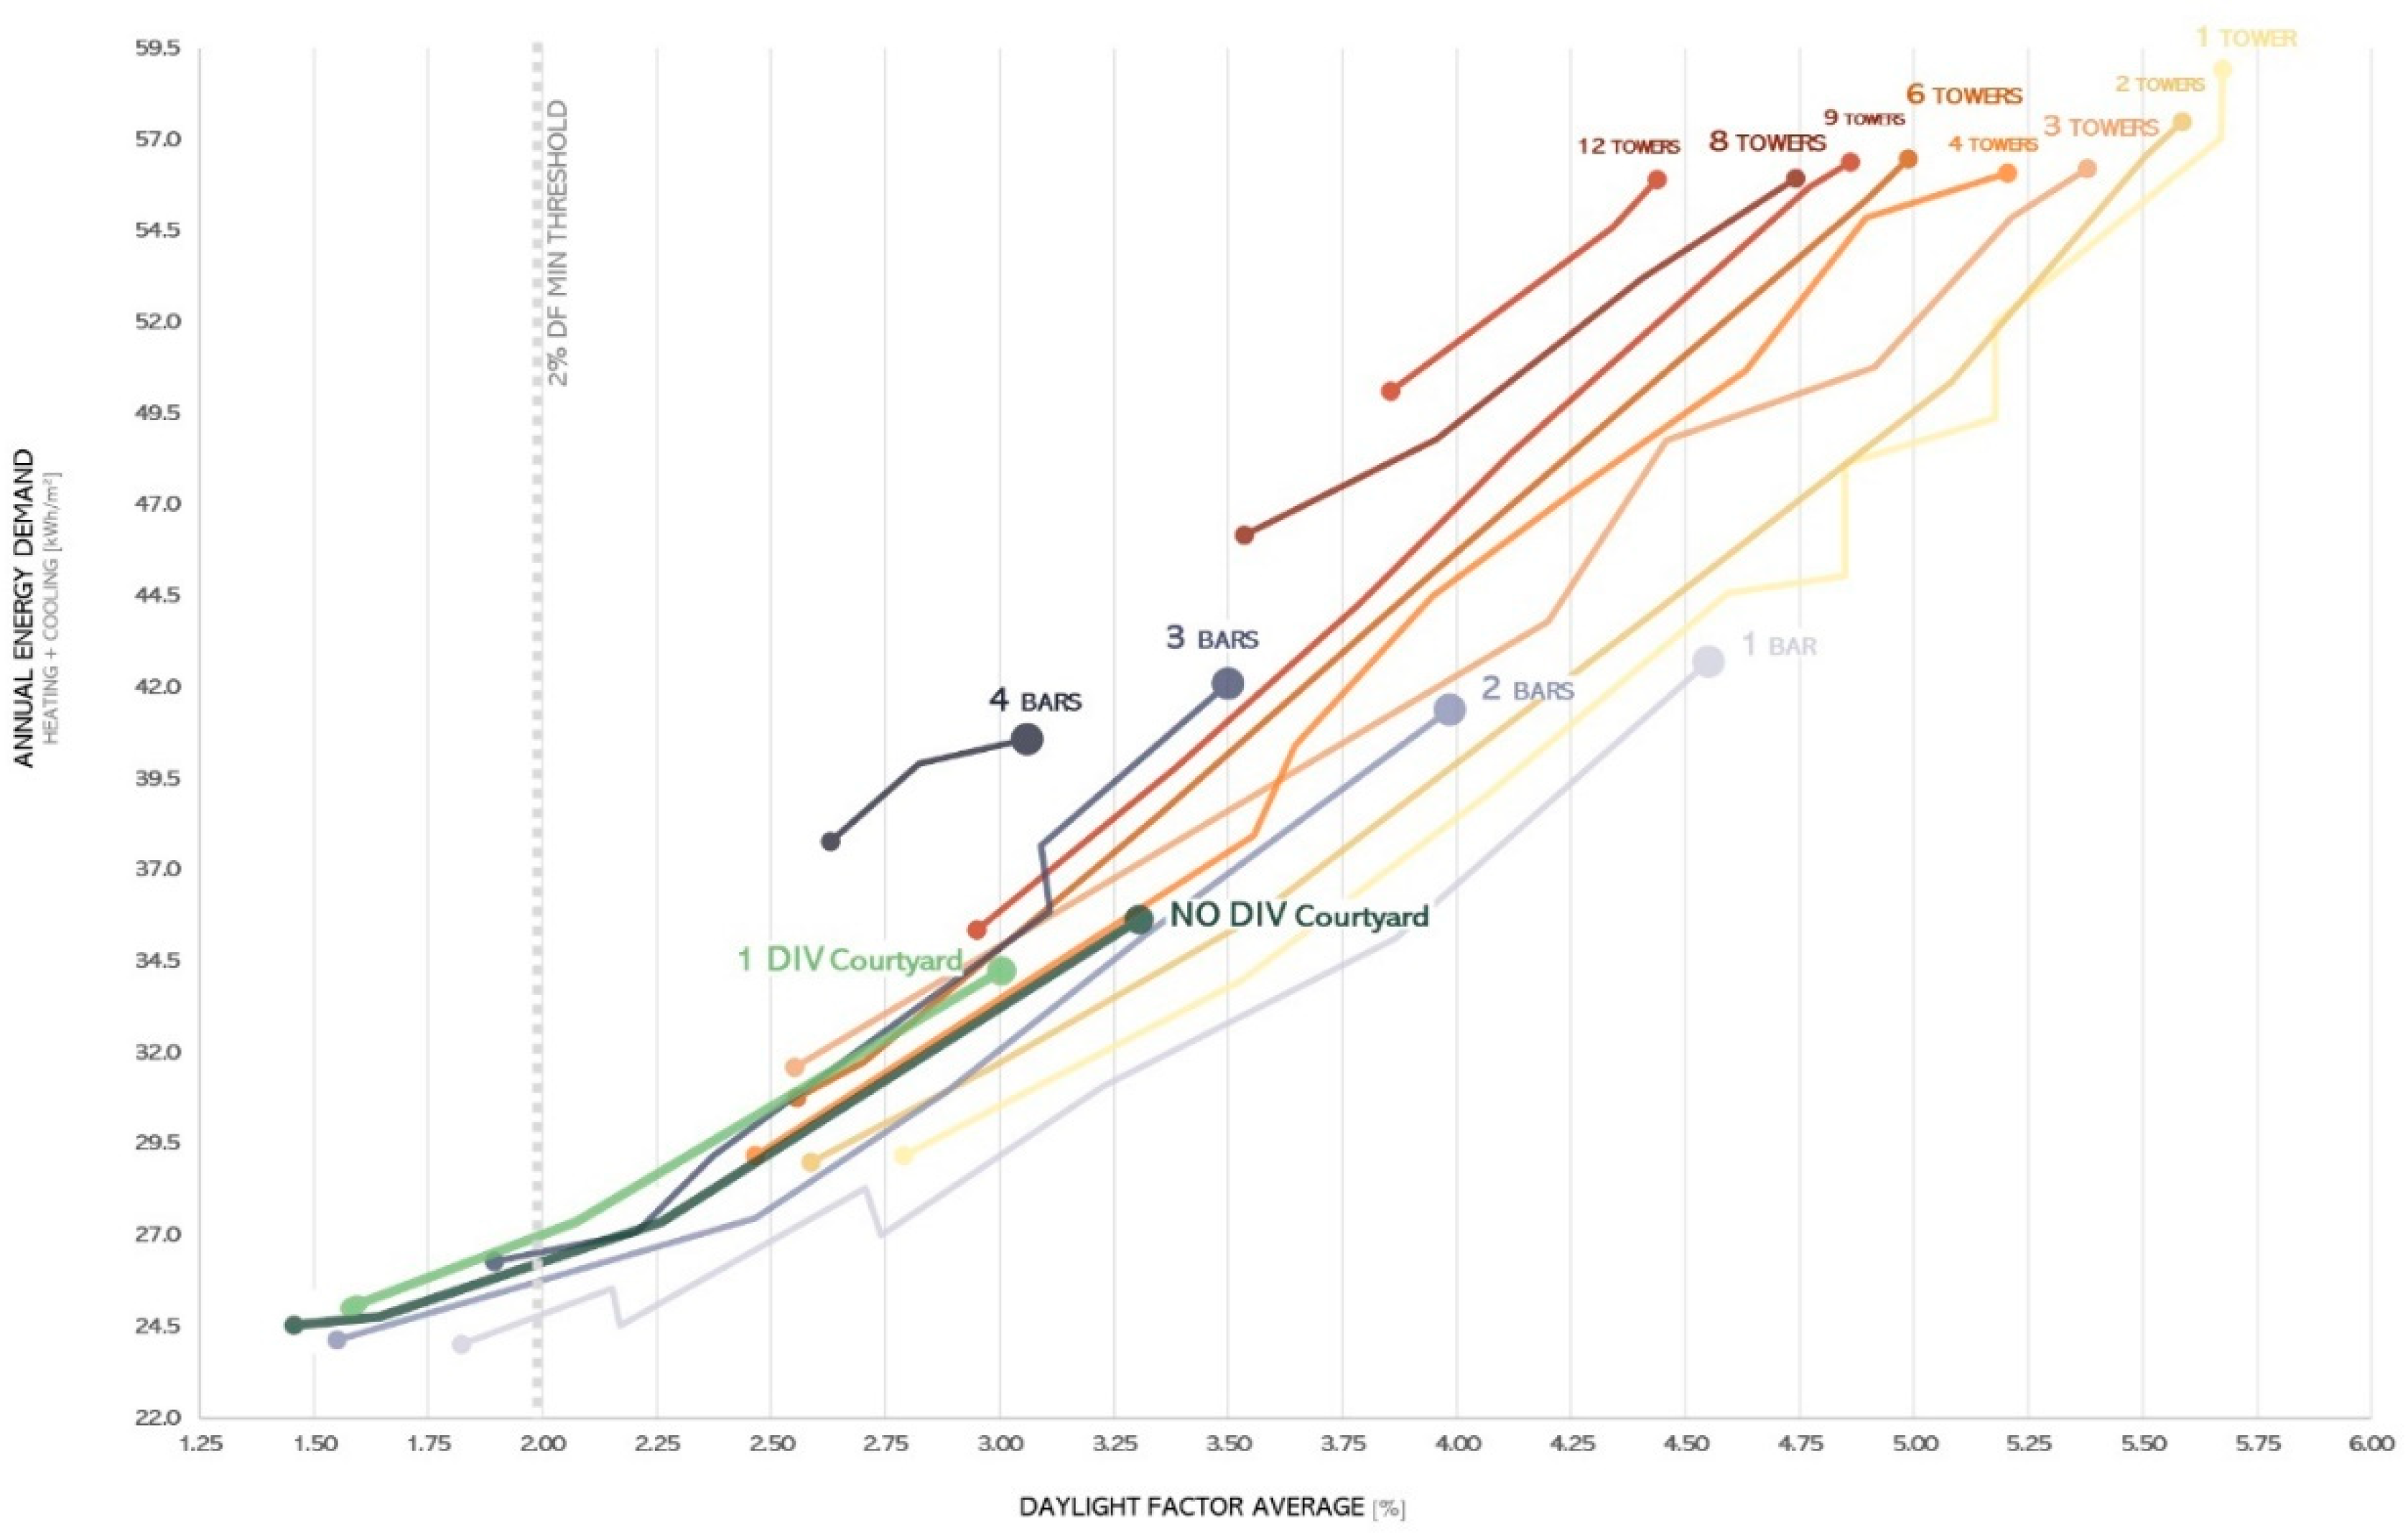
More generally, there seems to be no hardline dividing towers, bars, and courtyards in terms of energy performance, with all three typologies sharing common trends and correlations, yet occupying different segments along trend lines (Figure 12).
Perhaps a more meaningful distinction can be drawn between sparse high-rise, including towers and a few tall, narrow bars, and dense low-rise buildings, including courtyards and groups of low, long bars. Each of these two groups suggests a specific application for active solar systems.

Comparing Trends

The “well” curve already observed for each individual typology is also observable at the macro scale (Figure 13) —that is, it affects the entire pool of cases in a coherent fashion. For tower and bar typologies, energy potential is generally higher for a single, tall building; it lowers for intermediate configurations, then climbs up again towards a maximum number of low-lying buildings. This observation can bring some clarity to the much-debated integration of active systems in buildings, as it narrows useful applications to only two preferred building forms and associated modes of on-site energy production: (1) roof-mounted solar panels in low-rise courtyard or group of bars and (2) facade integration in narrow, isolated high-rise buildings. This is in stark opposition with trends related to visual comfort since daylighting does not benefit from radiation falling on roofs. Low-lying buildings with high site coverage that have been long associated to insufficient daylighting, such as courtyards and low-rise bars, are in fact good candidates to become active solar typologies by virtue of their high potential for energy generation and still have sufficient daylighting if the footprint is no deeper than 15 m.
As outlined in numerous occasions, a shallow floor plate is the single most important factor to guarantee good daylighting but also higher energy needs in buildings. While it might also increase active solar potential when most radiation falls on vertical surfaces, as in slim, tall towers, a shallow plate can be detrimental when radiation is mostly collected by the roof surface, as in long low-rise buildings. Particularly in courtyards, a 10 m shallow plate is associated to both higher energy use and lower energy potential. Conversely, bars with 15 m and even 20 m deep floors display up to 15% increase in solar potential as compared to bars with 10 m floors. Again, this factor points to the same low-lying buildings with high site coverage as potential winners in the active solar arena.
The way building orientation affects useful radiation is also in marked contrast with the way it relates to daylighting. When only passive indicators are concerned, E/W orientation performs better, with 10% lower energy needs than for N/S orientations, with a comparable amount of daylighting. When active systems are considered, however, the opposite might be true, as higher energy potential for N/S orientation appears to compensate for its higher energy needs. For instance, bars with N/S orientation display up to 21% higher solar potential than for E/W orientation for the same geometry and number of buildings. In short, there might be no discernible advantage in either of the two main orientations for active solar typologies. This, too, is in sharp contrast with the countless urban theories promoting a “best” orientation above all others.
The trends outlined above only apply to buildings with active energy systems and clearly diverge from principles of passive solar design. When active solar is included in the energy balance, a very different range of optimal design solutions and associated building shapes emerges. They testify to a specific, measurable relationship between onsite energy production and building forms that may instigate a new vocabulary for active energy-driven design.

4.3. Total Solar Potential

The following section set out to reconcile the diverging trends of active and passive solar indicators and to take in account the contrasting effects of geometric variables by using a single synthetic indicator. This second step evaluates a group of twenty-five configurations selected from the original pool of 312 cases, based on a set of criteria that reflects stricter nZEB requirements mandated by recent EU legislation (Figure 14).
A reduced number of cases allows for full-climate daylight analysis and the contribution of electric lighting to energy use based on simulated daylighting levels for each selected case. The aim is to arrive at the best or concomitant solutions based on total energy demand, including energy for heating and cooling, electric lighting, and energy generation using photovoltaics (PV) and solar thermal (ST) systems.

4.3.1. Comparing Cases

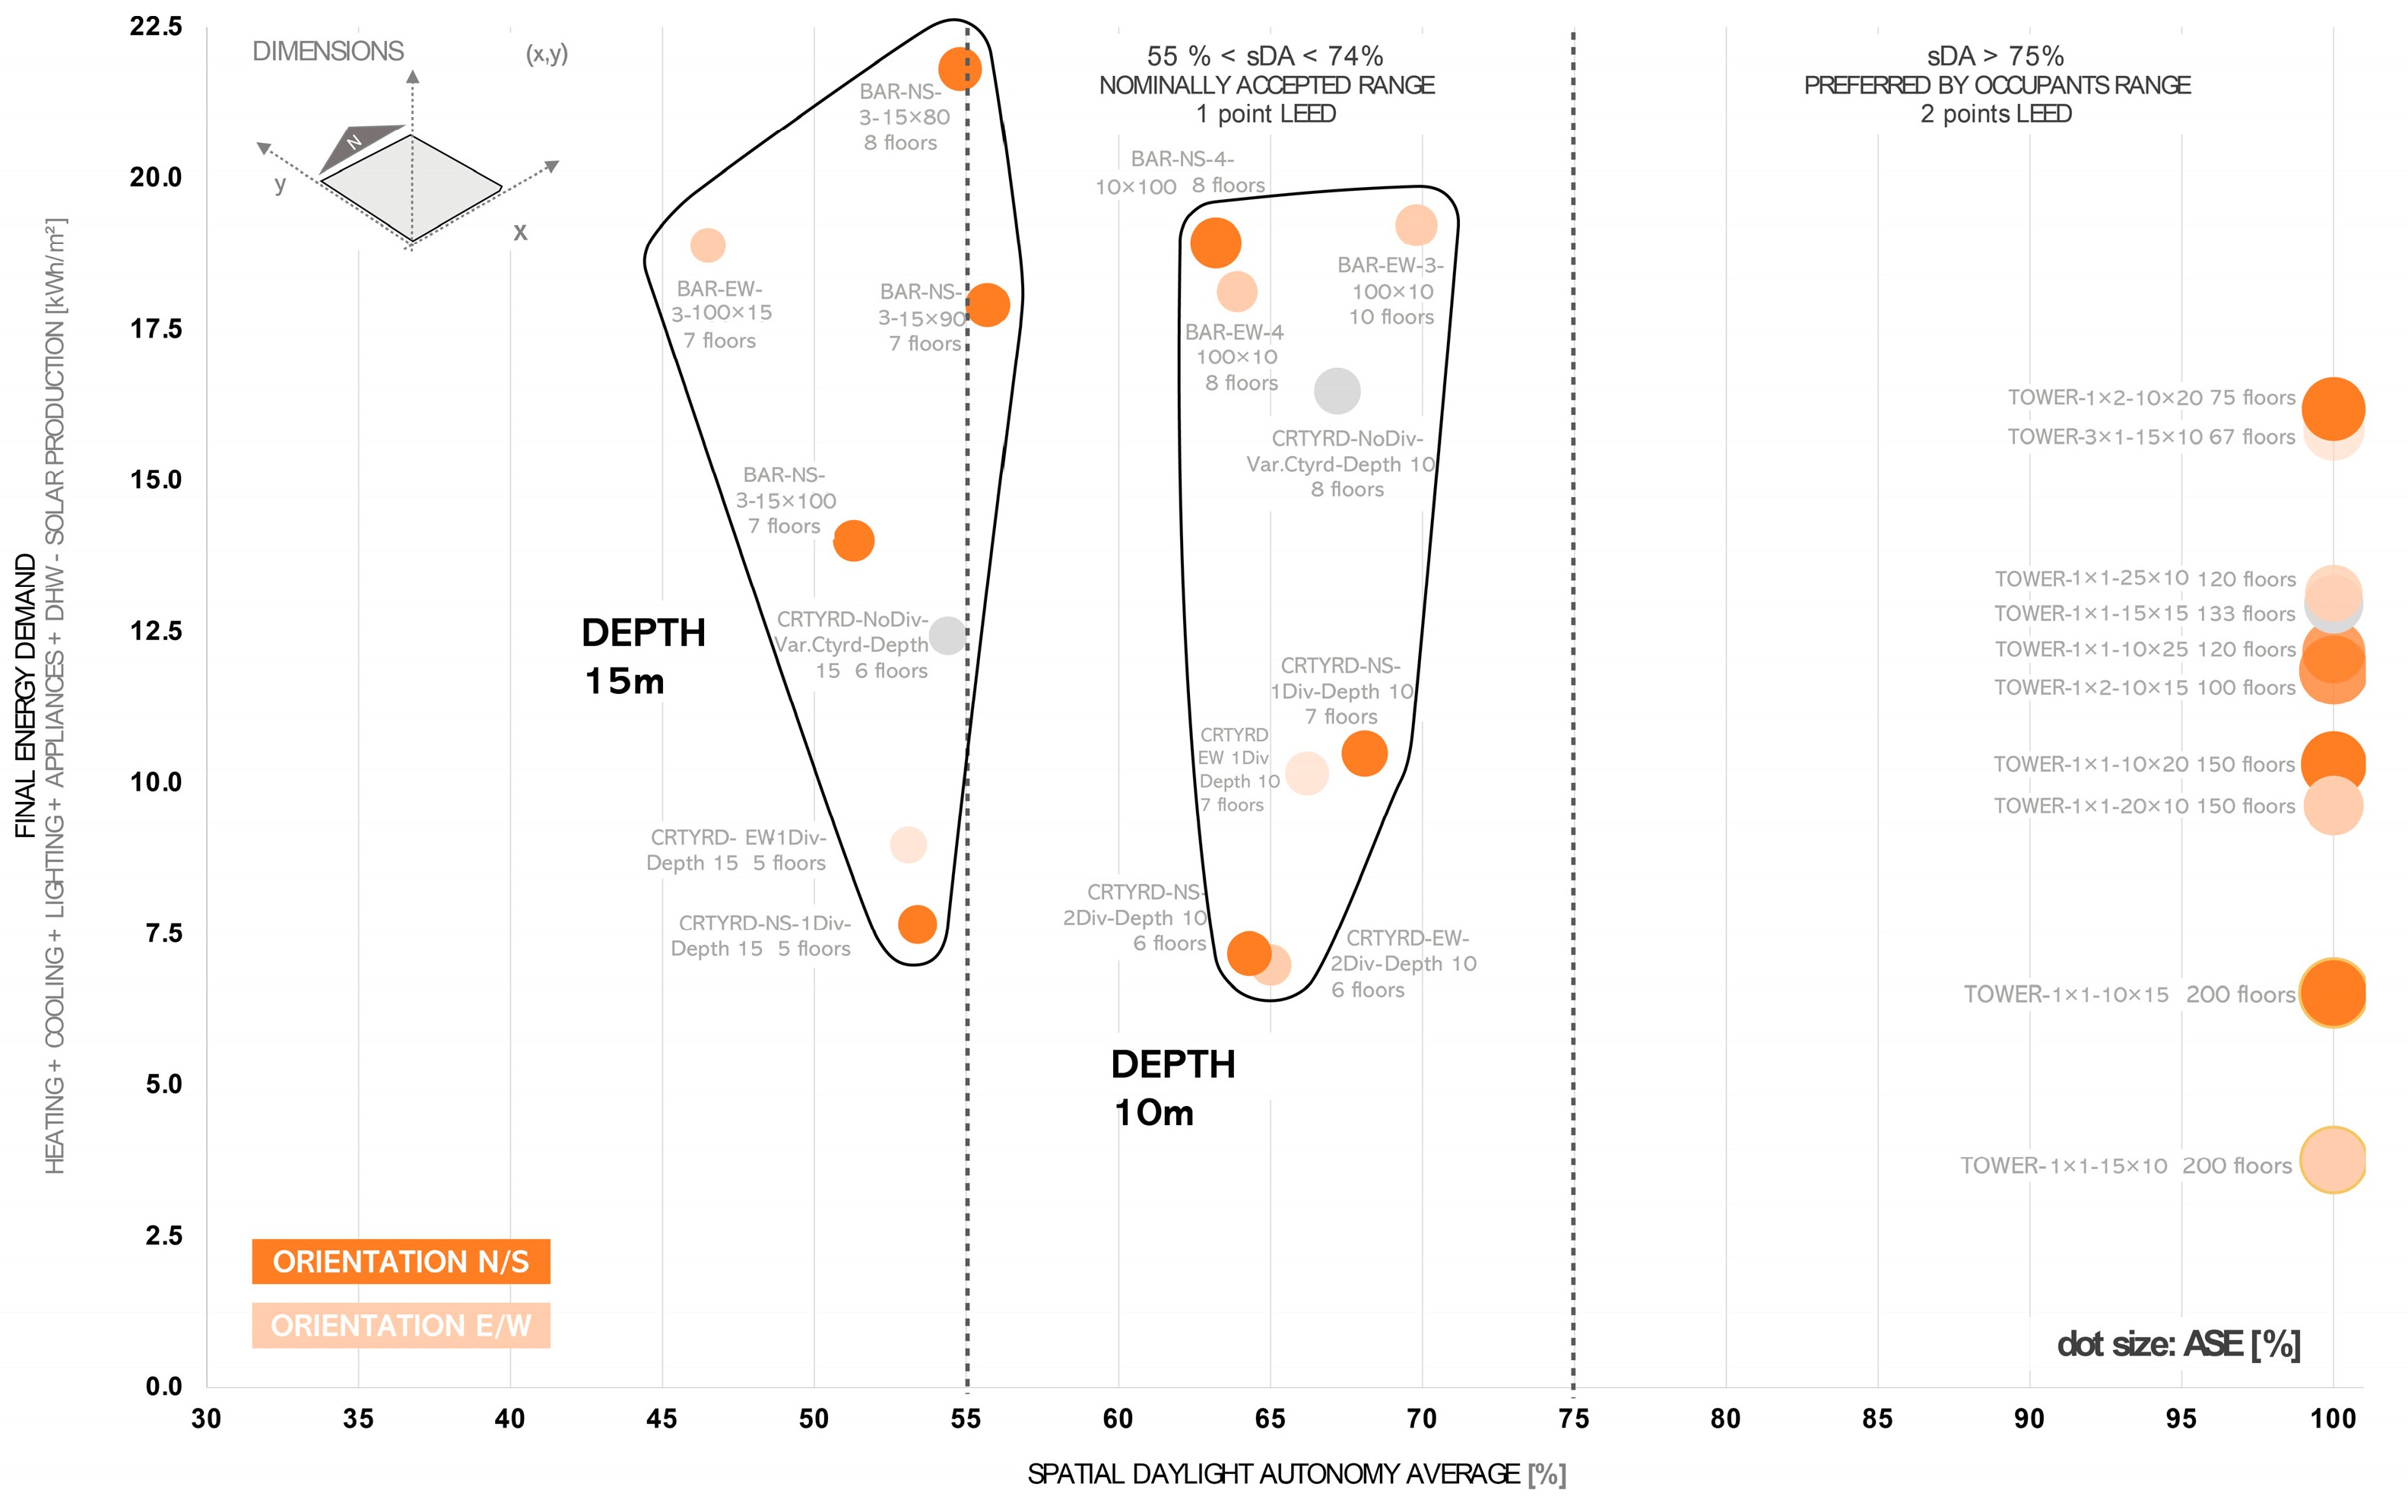
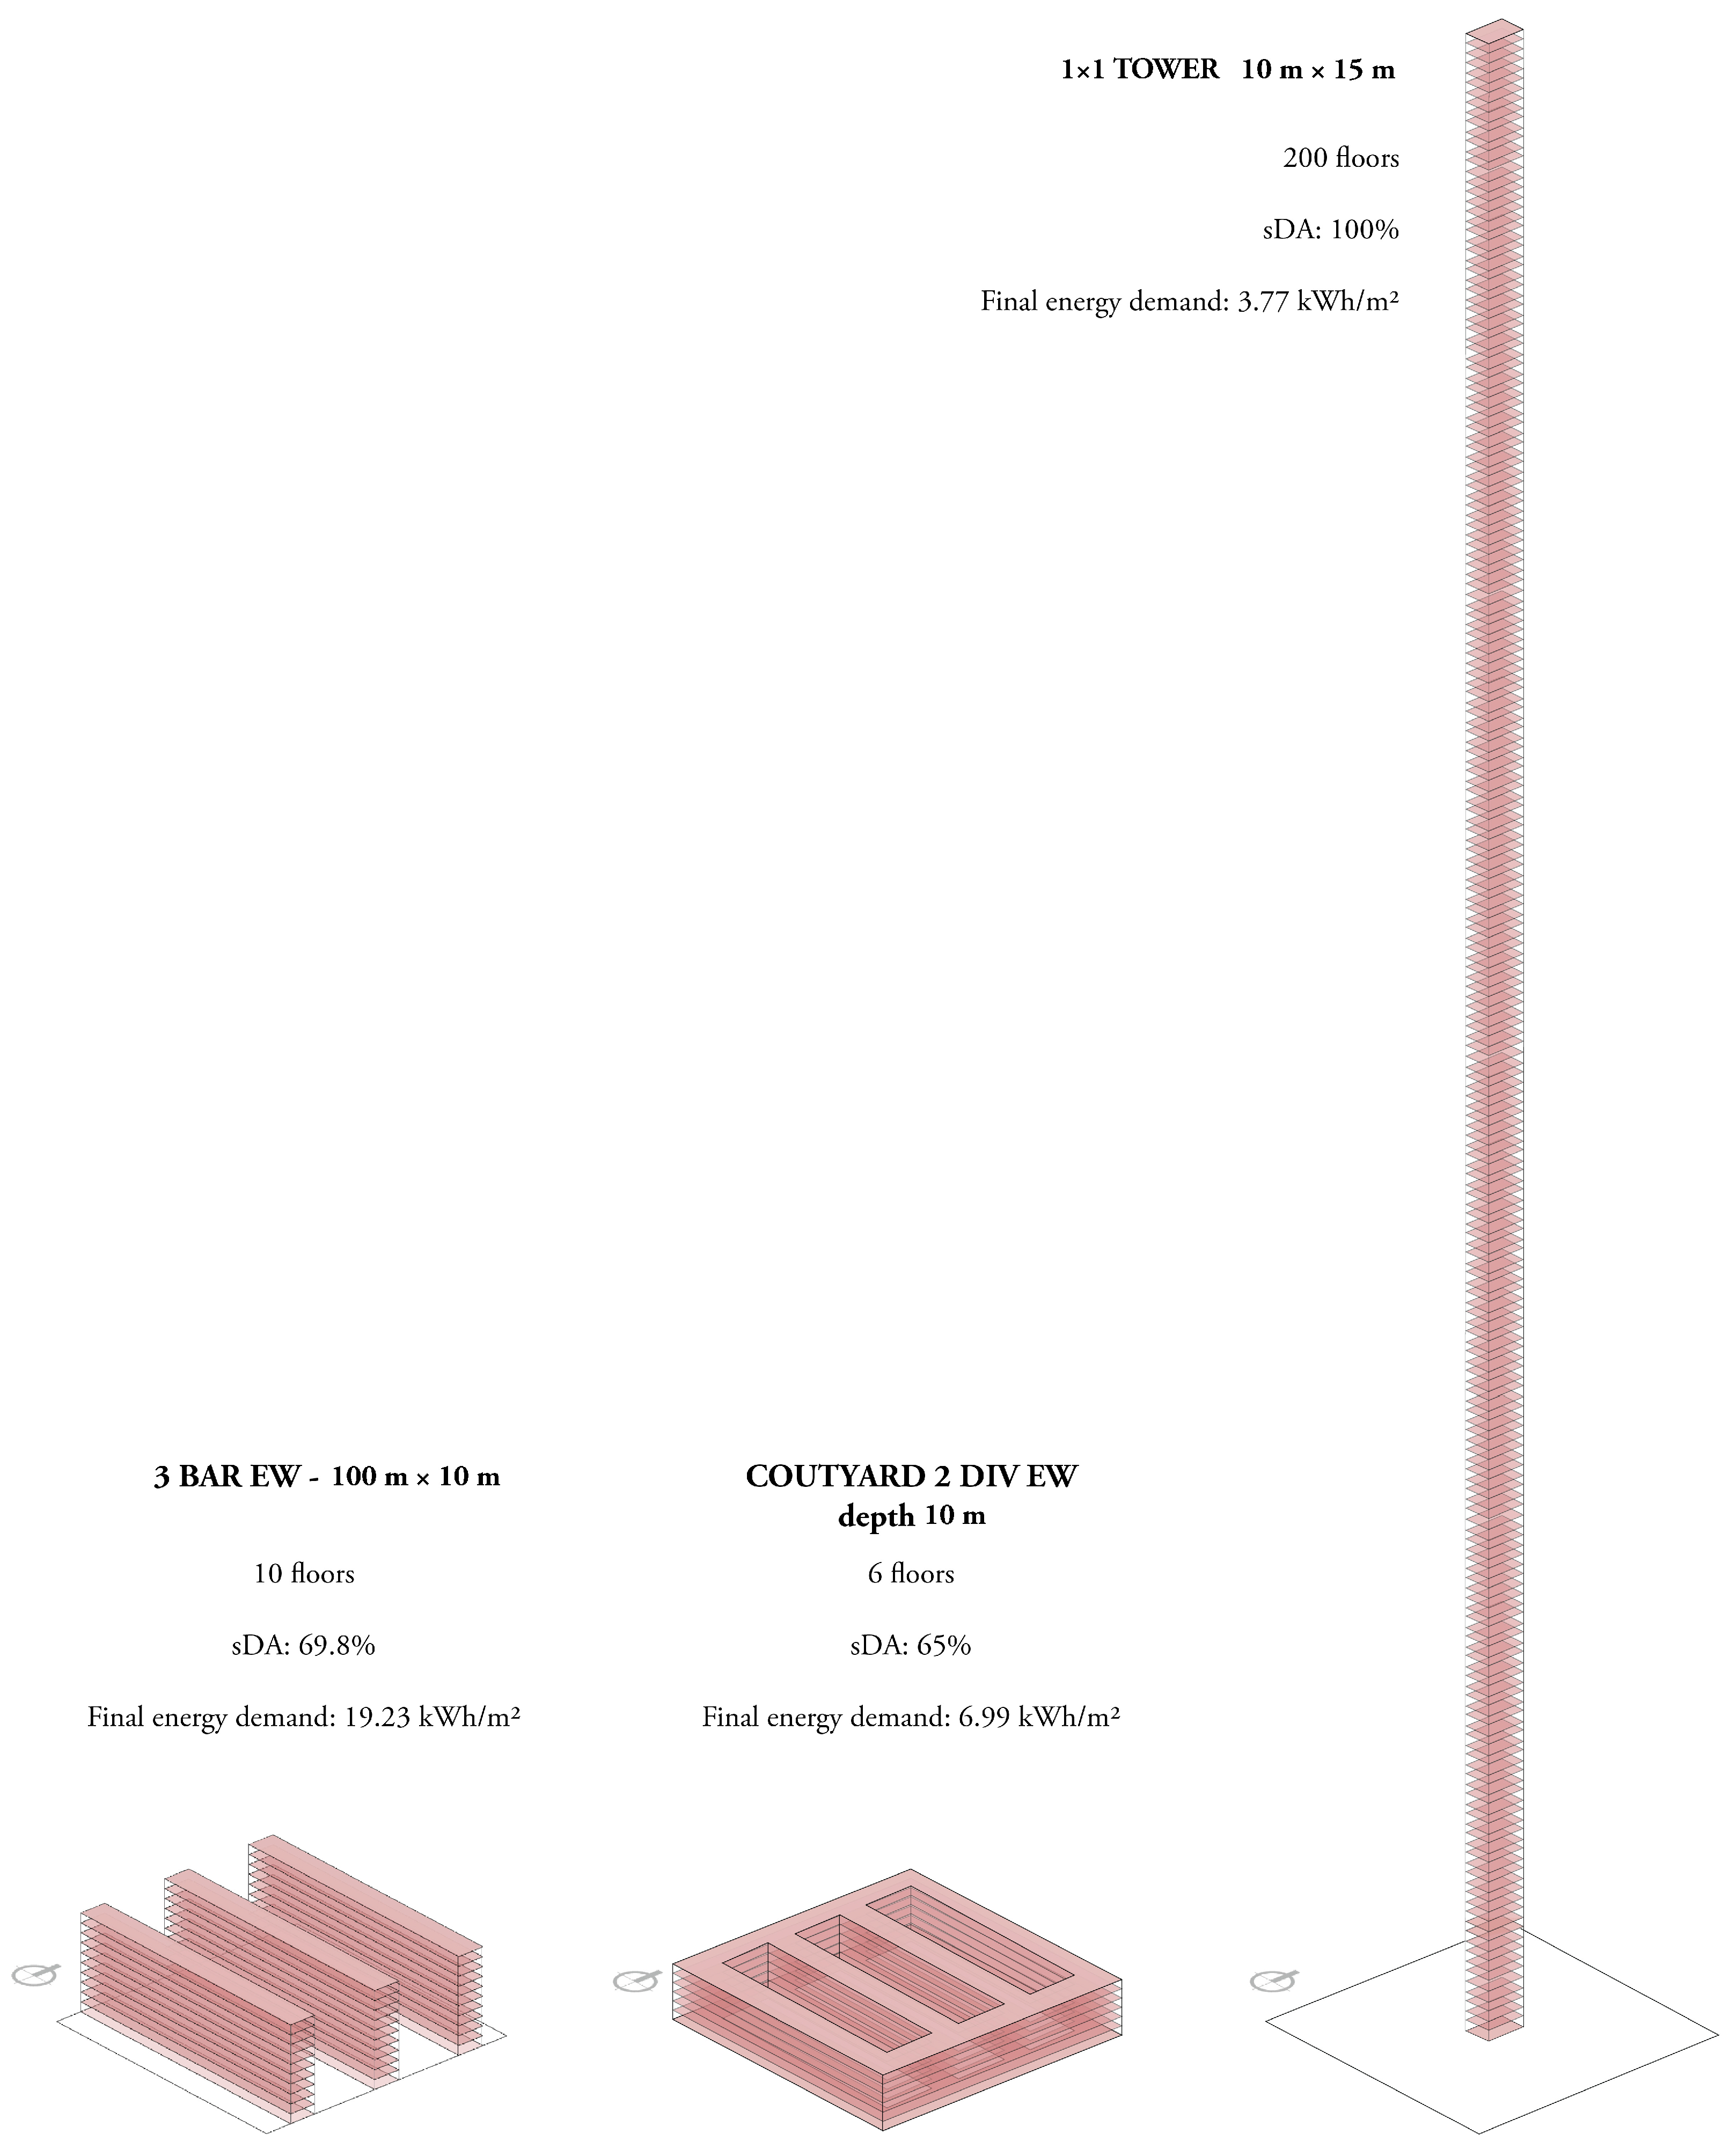
A first, a remarkable result is that all twenty-five selected cases have indeed a very low final energy demand, ranging from 3.8 to 21.8 kWh/m2 once the production of energy from onsite renewables has been accounted for. Results also show that cases fall almost entirely within daylighting acceptable range of sDA > 55%, confirming the validity of using DF > 2% as threshold for early selection (Figure 15). A typology divide clearly exists between towers, characterized by maximum sDA values, and low-rise typologies, sharing the same comparably lower sDA values and a slightly higher range of energy demand. Apart from these moderate differences, similarities between such disparate building shapes are perhaps the most striking feature of this group of high-performing buildings. The best cases for each typology are as follows:
  • Tower with a footprint of 15 m × 10 m and 200 stories and a final energy demand of 3.77 kWh/m2 and 100% sDA;
  • Courtyard with two internal divisions, oriented along N/S or E/W, with depth of 10 m and 6 stories, presenting a final energy demand of 7 kWh/m2 and 65% sDA;
  • Bar with four buildings oriented along E/W on the plot, 100 m × 10 m and 8 floors, presenting a final energy demand of 18 kWh/m2 and 64% sDA.
Overall, the best-performing active solar typology ought to be the tower, followed by courtyards and bars at close proximity.

4.3.2. Comparing Trends

The results largely confirm the trends for active solar observed in the previous phase of the research:
  • Once potential generation (PV + ST) is factored in the calculation for final energy demand, there is clearly no distinction in terms of energy performance or daylighting between the two main orientations. As postulated earlier, N/S-oriented bars and courtyard divisions generate a surplus of energy that neutralizes the initial advantage in lower energy use for E/W-oriented buildings. Accordingly, there is no longer a discernible boundary or trend line between buildings with different orientation on the chart.
  • In terms of form factor, the picture is more ambivalent: floor depth still has an impact on daylighting in bars and courtyards, with cases forming two clusters based on building depths of 10 m and 15 m, respectively, and with each cluster occupying a distinct area along the sDA scale. Specifically, cases with 10 m deep floor plates fall well within the sDA “Nominally accepted range” between 55% and 74%, while cases with 15 m deep floor plates straddle the lower threshold of the same range. In contrast, the 30% gap in energy need between 10 m and 15 m footprints observed in a previous phase is countered by annual electricity for lighting included in the present calculation. As expected, slimmer buildings with higher energy cost for heating and cooling also have better daylighting, translating into lower energy needs for electric lighting. That plus active solar as part of the energy calculation makes a shallow plate no longer a detrimental factor in terms of energy use.
  • The most surprising result, however, might be the wide disparity of building shapes representing the best-performing solar typologies. Slim towers 200-stories tall and low-lying buildings with high site coverage lie at the two extremes of the dimensional and proportional range, yet the two display the same lowest energy demand. Each typology maximizes the type of surface that is most effective for solar collection, within a specific site layout: a low-rise courtyard with many divisions or with as many bars as fit the site maximizes roof surface, still maintaining enough daylighting. A very tall, isolated tower maximizes wall surface, more than compensating for its high energy needs.

5. Discussion

5.1. Design Criteria for Passive Solar Performance

The analysis presented in the first part of the paper looks at 312 cases covering the full range of geometric variables for buildings with FAR 3, using passive solar indicators such as heating and cooling energy and daylight. The results confirm the existence of consistent trends and value ranges across the three typologies correlating geometric variables and morphology factors to the chosen radiation-based indicators.
It is important to note that the number of buildings and orientation (vertical and horizontal arrows in Figure 16) only affect one parameter each (daylighting and energy, respectively), so they do not really pose a dilemma to the designer. When only passive solar strategies are considered, E/W orientation uses up to 10% less energy than N/S orientation for the same amount of daylighting. Similarly, a higher number of buildings on a given site results in up to 40% less daylight availability as compared to a single building for the same amount of energy use. These findings provide unequivocal guidelines for passive solar buildings in the early-design phase.
Aspect ratio, on the other hand, presents a trade-off between energy use and availability of daylight (diagonal lines in the graph) that is well-documented in the literature. With building length and width only minimally affecting performance, the depth of the floor plate is the only geometric variable that still offers a choice to the designer: according to the graph, narrow plates with depth of 10 m or 15 m will result in better daylighting but higher energy use for heating and cooling; conversely, 20 m or 25 m deep plates will result in lower energy but also lower daylighting.

5.2. Design Criteria for Active Solar Performance

The second part of the study focuses on active energy by using solar potential as the main indicator (Figure 17). New trends emerge from these graphs that are in contrast—and sometimes in clear opposition—to passive energy trends. N/S is now preferable to E/W orientation, as it displays up to 21% higher solar potential for bars with the same geometry and number of buildings. This appears to suggest a new trade-off unique to active solar buildings: N/S orientation offers higher energy potential but also higher energy use; conversely, E/W orientation shows lower energy use but also lower energy potential. Solar potential does not display a linear correlation to either footprint or number of buildings, following instead a “well” curve clearly visible on the graph, with peak values associated to two concomitant factors: (1) a single building with a small footprint, minimally overshadowed, where radiation is collected by the envelope, or (2) many buildings with a large footprint, where radiation is collected by the roof surface. The crossover marks the point of inflection where optimal solutions shift from one building type—and active energy system—to the other.
This is perhaps the most significant pattern for active energy buildings that clearly diverge from passive trends: while isolated narrow buildings were a preferred shape for passive solar, more buildings with a large footprint also have high active solar potential.

5.3. Design Criteria for Total Solar Performance

The third part of the study uses a synthetic indicator, including active and passive contributions, in order to move beyond trade-off equivalence and to arrive at a final ranking based on the total energy cost of active urban typologies.
In a first important result, after adding active energy production and electric lighting, cases with 10 m and 15 m deep floor plates have a similar energy cost (Figure 18). This result appears to dispel the notion of a trade-off between energy use and daylighting based on building depth. Scarce daylighting, too, translates into electric lighting—and ultimately higher energy use. Accordingly, slimmer buildings appear to be a better option, providing three times the amount of daylighting, in some cases, for the same energy demand. Results corroborate and qualify the concept of a “passive zone” developed by Baker and Steemers [5] in the active solar scenario. Results also demonstrate the equivalence in terms of total energy demand and daylighting between N/S and E/W orientations once active solar is considered, resolving a second trade-off and putting at rest a long-standing dispute in architecture that spans almost two centuries.
Finally, results confirm the polarizing effects of the “well” curve on building shape. When active systems enter the fray, two new traits for collecting radiation and producing energy prevail: large roofs or large envelopes, both unencumbered by overshadow.

5.4. Solar Typologies

Results show that solutions best adapted to the new selective pressures of very low energy use and high onsite energy fraction are clearly positioned at the two extremes of the geometric and proportional range: (1) low-lying, compact buildings with high site coverage and (2) extremely tall, slim buildings with very low site coverage (Figure 19). These are the best-performing design solutions when considering active solar—two contrasting groups with surprisingly similar energy demand.
The first group includes low-rise courtyards (5 to 8 stories) with subdivisions 15 m to 20 m apart and clusters of three to four long bars (7 to 10 stories) 20 m to 25 m apart, both having shallow floors 10 m to 15 m deep—two typologies that appear compatible with well-established models of urban development.
The courtyard points to the historical city of the 19th century, while the bars closely relate to modernist examples of urban renewal from the 1950s and 1960s of the 20th century, particularly as applied by city planners to post-war reconstruction in Europe. This study suggests that under certain conditions, the two building types that are perhaps most prevalent in our cities today can be effectively retrofitted to meet active energy targets.
The second group includes very tall (70 to 200 floors), isolated towers with a small footprint that preludes a new building species in the active solar arena. This typology appears to be the only one in the study with the potential to become a zero-energy building once the already very low energy demand (between 4 and 15 kWh/m2) is reduced by further improvements to the envelope. Considering the ongoing trend toward “supertall” towers in metropolises around the world—made possible by a rare combination of advances in structural systems, a lax legislation, and high economic rewards—this study strongly advocates for a robust implementation of vertically integrated solar panels to this only truly native solar typology.
As limited or extreme as these building shapes may appear, the selective thresholds for active energy fraction adopted in the study are already enforced by planning authorities in some countries. The results are all the more striking when compared to the range of reassuringly familiar building shapes that are often prescribed for new construction by the very same authorities. This final assessment of the study strongly suggests that planning instruments in force today should acknowledge the dimensional and proportional implications of new active energy targets or become an obstacle to pursuing the very same targets they purport to promote.

6. Conclusions

Much research has been conducted on the relationship between geometric factors, radiation-based indicators, and energy performance—in short, on form and energy in buildings—particularly over the past 20 years since computational advances allow for quick and accurate simulation of energy performance. The results from the study confirm and quantify some of these correlations while also highlighting diverging trends related to passive and active energy potential—a distinction that becomes more critical with new and stricter requirements for active solar in both new buildings and retrofits.
Some of the progress to date has been marred or tamed by so-called trade-offs associated with indicators that produce multiple, contrasting effects on the objective variables and that appear to offer to the designer a range of design options with equivalent performance. This has been often perceived by the design profession as an indication that quantitative analysis cannot provide design guidance and is best used to validate design choices made by other means. The present research resolves some of these trade-offs related to building orientation, form factor, and aspect ratio and proposes design guidelines that should result, under certain conditions, in optimal solutions. Of course, countless other choices rest with the designer that are related to social interaction, sense of identity, lifestyle, or quality of space, to name but a few. These choices, however, should no longer be offered with the presumption of energy equivalence.
A large majority of the 312 configurations included in the research would be considered a viable option by common planning instruments in most countries— despite an extreme variability in their energy demand of up to a factor 2 for passive strategies and a factor 5 when active potential is considered. Save for improvements at the finer scale of the envelope, however, only a handful of these solutions (identified in Stage 2 of the research) meet a set of stricter environmental regulations for lower energy needs and on-site production that are already mandatory in many countries.
The same way that “cheap oil” relaxed formal limitations in buildings, effectively acting as catalyzer for the radical new language of modern architecture, so the combined effect of energy reduction goals and extensive use of active systems today has the potential to radically affect urban typologies, leading to the emergence of new building forms that are best-adapted to maximizing solar capture in buildings. Results from the study show that effective solar typologies can achieve very high energy performance, taking into account a low energy need for thermal services, a significant energy production from on-site renewables, and high daylighting levels by virtue of their shape alone. These shapes may look very different from the most common buildings being developed in our cities today. A new breed of super-tall towers being completed at the time of writing might indeed be the harbinger of a future species of super-active buildings—provided that every available vertical surface is covered by energy systems. Conversely, some of the most common building types, such as the traditional courtyard block of the historical city or the modernist slab that still stands at the edge of so many contemporary cities, can become effective solar typologies. They, too, would require the political determination and cultural acceptance to embark on an extensive, rigorous conversion of every roof into a power plant.

Author Contributions

Conceptualization, S.G., G.M. and R.M.; methodology, S.G., G.M. and R.M.; investigation, R.M.; writing—original draft, S.G., G.M. and R.M.; writing—review & editing, S.G., G.M. and R.M.; visualization, R.M. All authors have read and agreed to the published version of the manuscript.

Funding

This research received no external funding.

Institutional Review Board Statement

Not applicable.

Informed Consent Statement

Not applicable.

Data Availability Statement

Not applicable.

Conflicts of Interest

The authors declare no conflict of interest.

Abbreviations

ASEAnnual solar exposure
BIPVBuilding-integrated photovoltaics
CIEInternational Commission on Illumination
COPCoefficient of performance
DFDaylight factor
DHWDomestic hot water
EEREnergy efficiency ratio
EUEuropean Union
FARFloor-to-area ratio
GHGGreenhouse gas emissions
HVACHeating, ventilation, and air conditioning
LEEDLeadership in Energy and Environmental Design
nZEBNearly zero-energy buildings
PVPhotovoltaic panels
sDASpatial daylight autonomy
STSolar thermal collectors

References

  1. European Commission, Directorate-General for Energy. Clean Energy for All Europeans. 2019. Available online: https://data.europa.eu/doi/10.2833/21366 (accessed on 12 February 2022).
  2. Communication from the Commission to the European Parliament, the European Council, the Council, the European Economic and Social Committee and the Committee of the Regions. The European Green Deal. 2019, Brussels, COM(2019) 640 Final. Available online: https://ec.europa.eu/info/sites/default/files/european-green-deal-communication_en.pdf (accessed on 12 February 2022).
  3. Regulation (EU) 2021/1119 of the European Parliament and of the Council of 30 June 2021 Establishing the Framework for Achieving Climate Neutrality and Amending Regulations (EC) No 401/2009 and (EU) 2018/1999 (‘European Climate Law’). Available online: http://data.europa.eu/eli/reg/2021/1119/oj (accessed on 12 February 2022).
  4. Directive 2010/31/EU of the European Parliament and of the Council of 19 May 2010 on the Energy Performance of Buildings, Amended with Directive (EU) 2018/844 of the European Parliament and of the Council of 30 May 2018 Amending Directive 2010/31/EU on the Energy Performance of Buildings and Directive 2012/27/EU on energy efficiency. Available online: http://data.europa.eu/eli/dir/2010/31/oj (accessed on 12 February 2022).
  5. Baker, N.; Steemers, K. Energy and Environment in Architecture: A Technical Design Guide; E&FN Spon: London, UK; New York, NY, USA, 2000. [Google Scholar]
  6. Salat, S. Energy loads, CO2 emissions and building stocks: Morphologies, typologies, energy systems and behaviour. Build. Res. Inf. 2009, 37, 598–609. [Google Scholar] [CrossRef]
  7. Ratti, C.; Baker, N.; Steemers, K. Energy consumption and urban texture. Energy Build. 2005, 37, 762–776. [Google Scholar] [CrossRef]
  8. Rode, P.; Keim, C.; Robazza, G.; Viejo, P.; Schofield, J. Cities and energy: Urban morphology and residential heat-energy demand. Environ. Plan. B Plan. Des. 2014, 41, 138–162. [Google Scholar] [CrossRef] [Green Version]
  9. Lechner, N. Heating, Cooling, Lighting: Sustainable Design Methods for Architects, 3rd ed.; John Wiley & Sons: Hoboken, NJ, USA, 2009. [Google Scholar]
  10. Brozovsky, J.; Gustavsen, A.; Gaitani, N. Zero emission neighbourhoods and positive energy districts—A state-of-the-art review. Sustain. Cities Soc. 2021, 72, 103013. [Google Scholar] [CrossRef]
  11. Oh, M.; Kim, Y. Identifying urban geometric types as energy performance patterns. Energy Sustain. Dev. 2019, 48, 115–129. [Google Scholar] [CrossRef]
  12. Savvides, A.; Vassiliades, C.; Michael, A.; Kalogirou, S. Siting and building-massing considerations for the urban integration of active solar energy systems. Renew. Energy 2019, 135, 963–974. [Google Scholar] [CrossRef]
  13. Natanian, J.; Aleksandrowicz, O.; Auer, T. A parametric approach to optimizing urban form, energy balance and environmental quality: The case of Mediterranean districts. Appl. Energy 2019, 254, 113637. [Google Scholar] [CrossRef]
  14. Vartholomaios, A. A parametric sensitivity analysis of the influence of urban form on domestic energy consumption for heating and cooling in a Mediterranean city. Sustain. Cities Soc. 2017, 28, 135–145. [Google Scholar] [CrossRef]
  15. De Luca, F.; Naboni, E.; Lobaccaro, G. Tall buildings cluster form rationalization in a Nordic climate by factoring in indoor-outdoor comfort and energy. Energy Build. 2021, 238, 110831. [Google Scholar] [CrossRef]
  16. Olgyay, V.; Olgyay, A.; Lyndon, D.; Olgyay, V.W.; Reynolds, J.; Yeang, K. Design with Climate: Bioclimatic Approach to Architectural Regionalism; New and expanded edition; Princeton University Press: Princeton, NJ, USA, 2015. [Google Scholar]
  17. Moneo, R. On Typology. A J. Ideas Crit. Archit. 1978, 18, 23–45. [Google Scholar]
  18. Banham, R. The Architecture of the Well-Tempered Environment; Architectural Press: New York, NY, USA, 1969. [Google Scholar]
  19. Herzog, T. Solar Energy in Architecture and Urban Planning; Prestel: London, UK, 1996. [Google Scholar]
  20. Martin, L. (Ed.) Urban Space and Structures; Cambridge University Press: Cambridge, UK, 1972. [Google Scholar]
  21. Gupta, V.K. Solar radiation and urban design for hot climates. Environ. Plan. B Plan. Des. 1984, 11, 435–454. [Google Scholar] [CrossRef]
  22. Steemers, K.; Baker, N.; Crowther, D.; Dubiel, J.; Nikolopoulou, M.H.; Ratti, C. City texture and microclimate. Urban Des. Stud. 1997, 3, 25–50. [Google Scholar]
  23. Okeil, A. A holistic approach to energy efficient building forms. Energy Build. 2010, 42, 1437–1444. [Google Scholar] [CrossRef]
  24. Oliveira Panão, M.J.N.; Gonçalves, H.J.P.; Ferrão, P.M.C. Optimization of the urban building efficiency potential for mid-latitude climates using a genetic algorithm approach. Renew. Energy 2008, 33, 887–896. [Google Scholar] [CrossRef]
  25. Compagnon, R. Solar and daylight availability in the urban fabric. Energy Build. 2004, 36, 321–328. [Google Scholar] [CrossRef]
  26. Kanters, J.; Horvat, M. Solar energy as a design parameter in urban planning. Energy Procedia 2012, 30, 1143–1152. [Google Scholar] [CrossRef] [Green Version]
  27. Hachem, C.; Athienitis, A.; Fazio, P. Evaluation of energy supply and demand in solar neighborhood. Energy Build. 2012, 49, 335–347. [Google Scholar] [CrossRef]
  28. Guarino, F.; Tumminia, G.; Longo, S.; Mistretta, M.; Bilotta, R.; Cellura, M. Energy planning methodology of net-zero energy solar neighborhoods in the Mediterranean basin. Sci. Technol. Built Environ. 2016, 22, 928–938. [Google Scholar] [CrossRef]
  29. Lobaccaro, G.; Carlucci, S.; Croce, S.; Paparella, R.; Finocchiaro, L. Boosting solar accessibility and potential of urban districts in the Nordic climate: A case study in Trondheim. Sol. Energy 2017, 149, 347–369. [Google Scholar] [CrossRef]
  30. Mohajeri, N.; Upadhyay, G.; Gudmundsson, A.; Assouline, D.; Kämpf, J.; Scartezzini, J.-L. Effects of urban compactness on solar energy potential. Renew. Energy 2016, 93, 469–482. [Google Scholar] [CrossRef] [Green Version]
  31. Lobaccaro, G.; Fiorito, F.; Masera, G.; Poli, T. District geometry simulation: A study for the optimization of solar façades in urban canopy layers. Energy Procedia 2012, 30, 1163–1172. [Google Scholar] [CrossRef] [Green Version]
  32. Zhang, J.; Xu, L.; Shabunko, V.; Tay, S.E.R.; Sun, H.; Lau, S.S.Y.; Reindl, T. Impact of urban block typology on building solar potential and energy use efficiency in tropical high-density city. Appl. Energy 2019, 240, 513–533. [Google Scholar] [CrossRef]
  33. Blumberga, A.; Vanaga, R.; Freimanis, R.; Blumberga, D.; Antužs, J.; Krastiņš, A.; Jankovskis, I.; Bondars, E.; Treija, S. Transition from traditional historic urban block to positive energy block. Energy 2020, 202, 117485. [Google Scholar] [CrossRef]
  34. Harzallah, A.; Hégron, G. Émergence et Evolution des Préconisations Solaires dans les Théories Architecturales et Urbaines en France, de la Seconde Moitié du XIXe Siècle à la Deuxième Guerre Mondiale. Ph.D. Thesis, Ecole Nationale Supérieure d’Architecture de Nantes, Nantes, France, 2007. [Google Scholar]
  35. Sanaieian, H.; Tenpierik, M.; Linden, K.V.D.; Mehdizadeh Seraj, F.; Mofidi Shemrani, S.M. Review of the impact of urban block form on thermal performance, solar access and ventilation. Renew. Sustain. Energy Rev. 2014, 38, 551–560. [Google Scholar] [CrossRef]
  36. Nault, E.; Peronato, G.; Rey, E.; Andersen, M. Review and critical analysis of early-design phase evaluation metrics for the solar potential of neighborhood designs. Build. Environ. 2015, 92, 679–691. [Google Scholar] [CrossRef]
  37. Morganti, M.; Salvati, A.; Coch, H.; Cecere, C. Urban morphology indicators for solar energy analysis. Energy Procedia 2017, 134, 807–814. [Google Scholar] [CrossRef]
  38. Verdonck, E.; Weytjens, L.; Verbeeck, G.; Froyen, H. Design Support Tools in Practice. The Architects’ Perspective. In Proceedings of the 14th International Conference on Computer Aided Architectural Design Futures, Liege, Belgium, 4–8 July 2011; pp. 769–784. [Google Scholar]
  39. Nault, E.; Moonen, P.; Rey, E.; Andersen, M. Predictive models for assessing the passive solar and daylight potential of neighborhood designs: A comparative proof-of-concept study. Build. Environ. 2017, 116, 1–16. [Google Scholar] [CrossRef] [Green Version]
  40. Sattrup, P.A.; Strømann-Andersen, J. Building typologies in northern European cities: Daylight, solar access, and building energy use. J. Archit. Plan. Res. 2013, 30, 56–76. [Google Scholar]
  41. Kämpf, J.H.; Robinson, D. Optimisation of building form for solar energy utilisation using constrained evolutionary algorithms. Energy Build. 2010, 42, 807–814. [Google Scholar] [CrossRef]
  42. Ekici, B.; Cubukcuoglu, C.; Turrin, M.; Sariyildiz, I.S. Performative computational architecture using swarm and evolutionary optimisation: A review. Build. Environ. 2019, 147, 356–371. [Google Scholar] [CrossRef]
  43. Gagne, J.M.L.; Andersen, M.; Norford, L.K. An interactive expert system for daylighting design exploration. Build. Environ. 2011, 46, 2351–2364. [Google Scholar] [CrossRef]
  44. Nault, É. Solar Potential in Early Neighborhood Design: A Decision-Support Workflow Based on Predictive Models. Ph.D. Thesis, Lausanne Federal Polytechnic School, Lausanne, Switzerland, 2016. [Google Scholar] [CrossRef]
  45. March, L.; Trace, M. The Land Use Performances of Selected Arrays of Built Forms; Centre for Land Use and Built Form Studies; University of Cambridge: Cambridge, UK, 1968. [Google Scholar]
  46. Makido, Y.; Dhakal, S.; Yamagata, Y. Relationship between urban form and CO2 emissions: Evidence from fifty Japanese cities. Urban Clim. 2012, 2, 55–67. [Google Scholar] [CrossRef] [Green Version]
  47. U.S Department of Energy—Energy Efficiency & Renewable Energy. Volume 7.3: Guide to Determining Climate Regions by County. Available online: https://www.energy.gov (accessed on 7 January 2021).
  48. Toutou, A.; Fikry, M.; Mohamed, W. The parametric based optimization framework daylighting and energy performance in rresidential buildings in hot arid zone. Alex. Eng. J. 2018, 57, 3595–3608. [Google Scholar] [CrossRef]
  49. Yao, R.; Steemers, K. A method of formulating energy load profile for domestic buildings in the UK. Energy Build. 2005, 37, 663–671. [Google Scholar] [CrossRef]
  50. Legislative Decree DL 28/11 (03/03/2011) Implementing Directive 2009/28/CE on Promotion of Use of Energy from RES. Available online: https://www.gazzettaufficiale.it/eli/id/2011/03/28/011G0067/sg (accessed on 27 October 2021).
  51. Reinhart, C.F. Tutorial on the Use of Daysim Simulations for Sustainable Design. Harvard Design School: Cambridge, MA, USA, 2010. [Google Scholar]
  52. US Green Building Council. LEED v4 Daylight—Indoor Environmental Quality. Available online: https://www.usgbc.org/credits/healthcare/v4-draft/eqc-0 (accessed on 19 January 2021).
Figure 1. Samples of the layout of the plots and of the general typologies used for the study.
Sustainability 14 09023 g001
Figure 2. Different configurations of the allowable total volume (FAR = 3) on the plot for the three typologies.
Sustainability 14 09023 g002
Figure 3. Scheme of the calculation and selection process.
Sustainability 14 09023 g003
Figure 4. Bar typology (FAR = 3) results showing daylighting, energy demand, and solar potential (x, y, dot size, respectively).
Sustainability 14 09023 g004
Figure 5. Tower typology (FAR = 3) results showing daylighting, energy demand, and solar potential (x, y, dot size, respectively).
Sustainability 14 09023 g005
Figure 6. Courtyard typology (FAR = 3) results showing daylighting, energy demand, and solar potential (x, y, dot size, respectively).
Sustainability 14 09023 g006
Figure 7. Relationship between bars, towers, and courtyards (FAR = 3), showing daylighting, energy demand, and solar potential. (x, y, dot size, respectively).
Sustainability 14 09023 g007
Figure 8. Trendlines for bars, towers, and courtyards showing daylighting, energy demand, and solar potential.
Sustainability 14 09023 g008
Figure 9. Trendlines for the bar typology (FAR = 3) results showing solar potential, energy demand, and daylighting.
Sustainability 14 09023 g009
Figure 10. Trendlines for the tower typology (FAR = 3) results showing solar potential, energy demand, and daylighting.
Sustainability 14 09023 g010
Figure 11. Trendlines for the courtyard typology (FAR = 3) results showing solar potential, energy demand, and daylighting.
Sustainability 14 09023 g011
Figure 12. Relationship between bars, towers, and courtyards (FAR = 3), showing solar potential, energy demand, and daylighting (x, y, dot size, respectively).
Sustainability 14 09023 g012
Figure 13. Trendlines for bars, towers, and courtyards showing solar potential, energy demand, and daylighting.
Sustainability 14 09023 g013
Figure 14. Twenty-five cases selected from the larger pool according to their performance and the filtering criteria.
Sustainability 14 09023 g014
Figure 15. Relationship between selected cases of bar, tower, and courtyard showing daylighting, energy demand, and glare risk (x, y, dot size, respectively).
Sustainability 14 09023 g015
Figure 16. Diagram illustrating how number of buildings, orientation, and floor depth affect passive solar performance (tower typology); daylighting results are plotted on the x axis and energy demand on the y axis; and solar potential is represented by dot size.
Sustainability 14 09023 g016
Figure 17. Diagram illustrating how number of buildings, orientation, and floor depth affect active solar performance (tower typology); solar potential results are plotted on the x axis and energy demand on the y axis; daylighting is represented by dot size.
Sustainability 14 09023 g017
Figure 18. Diagram highlighting building depth and orientation for the best-performing cases amongst all three typologies, with daylighting plotted on the x axis, final energy demand considering renewables production on the y axis, and glare risk results represented by dot size.
Sustainability 14 09023 g018
Figure 19. Best-performing case for each typology balancing final energy demand and sDA values.
Sustainability 14 09023 g019
Table 1. Thermal performance of building elements.
Thermal Transmittance
U-Value (SI)
Thermal Resistance
R-Value (IP)
External walls0.38 W/m2 K14.78 ft2·°F·h/BTU
Roof0.28 W/m2 K20.00 ft2·°F·h/BTU
Floors0.15 W/m2 K35.00 ft2·°F·h/BTU
Glazing unit1.90 W/m2 K and SHG 0.402.85 ft2·°F·h/BTU
Publisher’s Note: MDPI stays neutral with regard to jurisdictional claims in published maps and institutional affiliations.