1. Introduction
China’s high-speed railway (HSR) planning began with the release of “Medium and Long-Term Railway Network Planning” in 2004 [
1]. It has evolved from the initial “four vertical and four horizontal” in 2004 to the “eight vertical and eight horizontal” in 2016, supplemented by more regional connections and intercity railroads. China’s HSR development is developing rapidly. The national railroad network had reached 150,000 km by 2020, including 30,000 km of HSR, and had covered more than 80% of large and medium-sized cities. The “four vertical and four horizontal” HSR network has been fully completed, and the “eight vertical and eight horizontal” HSR network is gradually taking shape.
As the center of the national “eight vertical and eight horizontal” transport corridors, Hubei province actively responds to the national policy requirements. In 2018, “Hubei Railway Medium and Long-term Development Planning” specified a radial HSR network with Wuhan city as the core city and a radial intercity network structure [
2]. In 2021, the Hubei provincial government also proposed to build an integrated transportation hub so as to make Hubei province play an important role in the national transportation infrastructure. A radial HSR hub network is being constructed to meet requirements of “densification, interconnection and quality improvement”.
With the construction of the “eight vertical and eight horizontal” HSR network, the development of HSR has transformed from speed and scale oriented to quality and efficiency oriented. The improvement of the HSR network weakens the spatial barriers to the flow of production factors and optimizes the allocation of resources in a broader range. Thus, scholars began to pay attention to the interaction between HSR construction and regional economic development [
3]. Foreign scholars have discussed the accessibility patterns and changes of HSR in Europe [
4], Shinkansen in Japan [
5], and Seoul–Busan high-speed rail in South Korea [
6], focusing on the impact of accessibility changes on regional economic development. The rapid development of HSR breaks the limitation of original geographical administrative divisions [
7], shortens the time distance among cities, and strengthens the interconnection of cities [
8]. However, the development of HSR has also exacerbated the polarization effect between core and peripheral cities [
9]. The HSR has a “double-edged sword” effect on the cooperative development of the regional economy [
10,
11]. Accordingly, it is a significant challenge for local authorities to make better use of the advantages of HSR to realize the coordinating development and mutual benefit of small and medium-sized cities. Therefore, it’s important to analyze the collaborative relationship between the HSR network and the regional economic network, which helps to utilize the advantageous effect of HSR better and promote the coordinated development of the regional economy.
The objectives of this study are as follows: (i) to investigate the spatial and temporal evolution characteristics of the HSR network and economic network in Hubei province; (ii) to investigate the interactions between the HSR network and the economic network and the level of coupling and coordination; and (iii) to propose suggestions for the integrated development of the regional economy in Hubei province. From the perspective of dynamic networks, we apply social network analysis (SNA) to describe the topological structure characteristics and centrality characteristics of both the HSR network and economic network. Furthermore, we explore the accessibility of city nodes and subgroups in the network and the coupling and coordination level of economic linkages.
Therefore, this study is of great significance to the research on the synergistic development of HSR networks and economic networks. Although there are many studies focusing on the evolutionary characteristics of HSR networks or economic networks, there are relatively few studies on the synergistic relationship between the two networks. This paper analyzes the evolutionary characteristics of HSR networks and economic networks based on a long-time series perspective and reveals the coupling and coordination levels of accessibility and economic linkages. In terms of practical application, the construction status of HSR and the level of economic development are shown from three levels: the overall network, local urban subgroups, and urban nodes. The result can provide references for decision-makers in terms of transportation planning so as to promote coordinated development among regions.
The rest of this paper is organized as follows. In the second part, we briefly introduce the literature review of existing studies. The third part introduces the main research methods and data processing of this paper. The fourth part provides an empirical analysis of the space–time evolution characteristics of the HSR network and economic network and further analyzes the coordination of the coupling between the HSR network and the economic network. The fifth part expounds the main conclusions of this paper, policy recommendations for the coordinated development of the regional economy, and future research directions.
2. Literature Review
The existing research on the HSR network mainly focuses on two aspects: topology analysis of HSR networks and economic effects of HSR networks. The construction of an HSR network mainly takes the existing HSR stations as network nodes and takes the frequency of HSR operation as node relationships. The network topology analysis is mainly carried out through social network analysis (SNA) and complex network theory. Shaw [
12] divided the development of China’s HSR into four stages and studied the influence of the change of HSR policy on the change of Chinese urban space–time pattern in each stage. Nanchen Chu [
13] used the daily operating frequency to construct the intercity model. They analyzed the characteristics of an inter-city HSR connection network model in Northeast China, including network density, small world effect, cohesive subgroup, and centrality. Ming Chen [
14], based on the SNA and GIS spatial analysis method, explored the complex network analysis indicators, such as network density, degree centrality, and cohesive subgroup, for the railway passenger transport frequency data in 2005, 2010, and 2017, in order to describe the structural evolution characteristics of railway passenger transport connection network. Most studies focus on one point in time and do not consider the dynamic evolution of HSR network characteristics from the perspective of long time series.
Secondly, the focus is on the economic effect of the HSR network; research mainly focuses on the impact of HSR construction on economic growth and the reconstructing effect on the regional spatial pattern [
15], such as the space–time convergence effect, corridor effect, siphon effect, and city integration effect. Wetwitoo et al. [
16] empirically investigated an association of HSR with regional economic productivity in the case of Japanese HSR, where scholars have not reached a consensus on whether HSR can promote regional economic growth [
17]. With the opening of the Tokaido Shinkansen in Tokyo, Japan which had an obvious geographical advantage, has been further strengthened. Materials and talents from surrounding cities have flowed into Tokyo, showing an obvious concentration trend, resulting in a siphon effect [
18]. After the opening of the HSR line to Perpignan, Barcelona’s tourist attraction has been enhanced due to its superior geographical location and high tourism resource endowment, resulting in an obvious Matthew effect of HSR [
19]. Chunyang Wang [
20] found that the opening of HSR did not promote the economic growth of cities along the HSR in the short period of time, but it accelerated the economic diffusion of cities along HSR with the passage of time. Meng Nian [
21] found that HSR had a significant time cumulative effect and spatial proximity effect. That is to say, the longer the operation time of HSR, the greater the contribution to the regional economic growth, the closer the distance from HSR to the HSR station, and the more significant the radiation effect. Hongchang Li [
22] found that HSR is a kind of derivative demand that affects economic growth. Its influence on economic growth tends to decline with time. HSR is only an essential background condition for economic development when developing for a certain period and does not significantly impact economic growth. Guo [
23] found that the construction of the Beijing–Guangzhou high-speed railway had a considerable positive impact on the economies of (new) first-tier cities, but it also damaged some second-and third-tier cities using the nighttime lighting data from 2002 to 2018.
As for the role of the HSR effect on the reconstruction of regional spatial patterns, the main concern is the influence of HSR construction on regional integration. In Europe, evidence from Spain, France, and the UK suggests that it may also play a role in promoting intra-regional integration at distances below 200 km [
24]. Zhao [
25] proposed the existence of a two-way feedback mechanism between the HSR network and the regional economic network by constructing a model for the construction of HSR hubs under big data. Kangjie Zhao [
26] verified the synergy with the economic network by QAP correlation analysis and Granger causality test. Tianxiang He [
27] used a coupling coordination degree and spatial Durbin model to explore the level of regional economic collaborative relationship development in Hunan and the influence of HSR network development on regional economic cooperative relationship development. Scholars’ research scales have begun to shift from the national scale to the regional scale. The result of metropolitan areas and urban agglomerations will become the windfall and an essential structural potential for new economic growth in China in the next 5–10 years. Therefore, regional network research is more conducive to explaining the specific mechanism of network formation and evolution. From the perspective of the HSR network and regional economic network, it is of great significance to discuss the important theoretical issues related to transportation and regional economic development.
Based on differences in research perspectives, research methods, and research scales, scholars at home and abroad have drawn different conclusions, both of which have consensus and differences. It is the consensus that the accessibility of high-speed rail changes through space–time compression effects, which causes the flow of elements in space and affects the economic development of cities. The accumulation of these effects leads to changes in urban spatial structure, and this kind of effect is unbalanced in space. The difference in the research lies in whether the high-speed rail leads to the polarized development or balanced development of urban space. Some scholars believe that HSR will gather population, logistics, capital, and technology to central cities, which will further strengthen the development advantages of central cities, weaken the development advantages of surrounding cities and widen the differences in urban development. Other scholars believe that HSR enhances the radiation and diffusion of the central city on the surrounding cities and brings the originally underdeveloped surrounding cities into the development pattern of the central city, which is beneficial to the balanced development of urban space.
Generally speaking, with the advance in HSR network construction, the emphasis and scale of research on the characteristics of HSR networks in China have shown phased characteristics, and rich results have been achieved. However, there is still room for further enrichment and expansion in the breadth and depth of research. Firstly, most studies have mainly revealed the static structural characteristics of the network based on a certain point in time, without considering the dynamic evolution of the characteristics of the HSR network from the perspective of a long time series. Secondly, due to the late formation of the HSR network, most of the existing research has focused on individual lines or the national level, and the analysis of network characteristics at a regional level is relatively insufficient to reflect the formation and evolution mechanism in specific regional networks. Thirdly, there is relatively little research on the synergy between HSR networks and economic networks, and in the empirical aspect, most of them analyze a single city but seldom analyze the synergy of urban agglomerations along the routes, which is not comprehensive and systematic. On the other hand, Hubei province is located in central China, north of Dongting Lake in the middle reaches of the Yangtze River. Hubei province is bordered by Henan province in the north, Anhui province in the east, Hunan province in the southeast, Chongqing in the west, and Shaanxi province in the northwest. As one of the earliest provinces to open an HSR, Hubei province has the advantage of being the center of the national “eight vertical and eight horizontal” traffic corridor. HSR has a vital influence on the regional economic development of Hubei province, and the construction of the HSR in Hubei province is currently in a period of vigorous development; as a case study, it is typical and relevant. Therefore, this paper uses the train running frequency data of 15 cities in Hubei province from 2009 to 2019 to construct the HSR network and uses the nighttime light data of 2009–2019 to modify the gravity model to construct the economic network. It uses the social network analysis, QAP analysis, and coupling coordination degree method to make a collaborative analysis of the HSR network and regional economic network and puts forward relevant countermeasures.
3. Research Methodology and Data Preprocessing
3.1. Research Methodology
In this paper, we construct the HSR network of each city in Hubei Province by using the daily operation frequency of HSR and the economic network of each city in Hubei Province based on the modified gravity model. Then, we analyze the topological characteristics of the two networks by using the social network analysis method. Finally, we explore the collaborative relationship between the HSR and the economic network by using the QAP analysis method and the coupling coordination degree calculation.
3.1.1. The Modified Economic Gravity Model
The amount of inter-city economic connection is an indicator used to examine the economic linkage among regions, which can reflect the radiation effect of the economic center city on other cities and the acceptance degree of surrounding cities of the radiation ability of the economic center. The gravity model is a standard method to measure the inter-city economic connection [
28,
29]. Considering the actual research scenarios, we modified the gravity model from the following aspects.
Gross domestic product (GDP) is one of the core analytical variables in macroeconomics. However, in practice, due to the defects of the statistical data reporting mechanism, the measurement deviation of GDP statistics inevitably exists. In this paper, nighttime light brightness is used to replace the GDP values of cities in Hubei province. As a kind of geospatial raster data, nighttime light data breaks through the administrative boundaries compared with traditional data such as GDP [
30,
31]. In this paper, nighttime light data of DMSP/OLS in 2009 and 2012 and nighttime light data of NPP/VIIRS in 2015 and 2019 are selected as substitute variables for local economic development levels.
Figure 1 shows the overall nighttime light distribution of Hubei province in 2019.The black part represents the area where the light is lacking, and the whiter the color, the higher the light value.
Traffic accessibility, as the “generator” of spatial economic relations and the formation of spatial structure, modifies the time distance between two cities into a gravitational model. The time distance is calculated by the weighted shortest travel time of cars, trains, and HSR between two cities.
where
denotes the time distance between the two cities,
denotes the proportion of the total railroad frequency of high-speed trains (C/G/D) between the two cities,
denotes the shortest travel time for high-speed trains;
denotes the proportion of the total railroad frequency of normal train frequency,
denotes the shortest travel time for ordinary trains (Z/K/T),
denotes the proportion of the choice of car travel between the two cities,
denotes the shortest travel time for the cars. The modified economic gravity model is as follows:
where
denotes the intensity of economic connection between cities
and
,
denotes the proportion of the level of contribution to economic connection, measured by the proportion of GDP of the city
to the sum of GDP of cities
and
,
and
denote the total urban economy of cities
and
, characterized by the total number of urban nighttime light pixels;
and
denote the numbers of the resident population of cities
and
,
denotes the time distance between the two cities,
denotes the distance friction coefficient, whose value is related to the scale difference of the gravitational action range. Considering that Hubei province is close to the provincial scale, the value of
is determined to be 2.
3.1.2. Social Network Analysis Model
The social network analysis method is mainly used to analyze the network structure and attributes [
32,
33,
34,
35]. This paper mainly selects the following indicators to analyze the characteristics of the HSR network and the economic network pattern of cities in Hubei province (
Table 1).
3.1.3. Quadratic Assignment Procedure
The quadratic assignment procedure (QAP) method has been widely used in social network research, and is often used to study the correlation and regression between the two matrices [
36,
37,
38]. In practice, we implemented the algorithm in two steps. Firstly, we calculated the Pearson correlation coefficients between the corresponding elements of two matrices. Then, we randomly replaced the rows and columns of one matrix at the same time and recalculated the correlation between the replaced matrix and the other matrix. The calculations in the second step are performed hundreds of times to obtain a distribution of correlation coefficients, and we can see that the calculated random measurement is greater than or equal to the ratio of the times of observation measurement calculated in the first step. If the ratio is lower than 0.05, it indicates that there is a strong correlation between the matrices.
3.1.4. Coupling Coordination Degree Analysis
The coupling coordination degree model is used to analyze the coordinated development level of things [
39,
40,
41]. Coupling degree refers to the dynamic correlation degree between two or more systems that interact, influence each other, and achieve coordinated development. It can reflect the degree of interdependence and mutual restriction between systems. The degree of coordination refers to the benign coupling degree in the coupling interaction, which can reflect the quality of the coordination state. HSR network and the economic network can be defined as a coupling system because they interact and influence each other through an interactive mechanism. The level of coupling and coordination between these two subsystems is very important for synergistic regional development.
- (1)
Effective average travel time
Average travel time is a standard evaluation index of accessibility, which is generally used to compare the accessibility of different places [
42]. It refers to the time required for a node to reach the economic center,
where
denotes the effective average travel time (min) of the city
,
denotes the number of cities in the study area excluding city
,
denotes the time taken from city
to destination city
(min),
denotes the economic capacity and time weight by referring from city
to destination city
, measured by the square root of the product of resident population and GDP of destination city
,
denotes the resident population of city
, and
denotes the GDP of city
.
- (2)
Coupling Coordination Degree
The coupling degree is an important index to measure the degree of interaction between two or more elements of a system. Due to the significant difference of the selected indexes, the data are first normalized by min–max and then calculated by coupling degree. The coupling degree is calculated as follows.
where
denotes the coupling degree;
denotes the standardized value of accessibility;
denotes the standardized value of total economic connection intensity.
, low-level coupling;
, low to medium-level coupling;
, medium to high-level coupling;
, high-level coupling.
In exceptional cases, the degree of coupling is unlikely to reflect the overall degree and synergistic effect of regional accessibility and strength of economic connection. The indexes of different prefecture-level cities are dynamic, staggered, and uncoordinated, so there may be errors in evaluating the synergy based on the coupling degree alone. The coupling coordination model further applies the following formula:
where
denotes the coupling coordination degree,
;
,
as above;
denotes the reconciliation coefficient of accessibility and economic connection intensity, reflecting the contribution level of the two coupling coordination degrees;
,
denote the weights of accessibility and economic connection intensity
, reflecting the utility value of both, calculated by the entropy weight method.
, low-level coupling coordination;
, medium-level coupling coordination
, medium high-level coupling coordination;
, high-level coupling coordination.
3.2. Data Acquisition and Preprocessing
- (1)
Data source and processing of HSR network
According to the European Union standard, the newly built railway runs at a speed of 250 km/h or above, and the reconstructed existing railway runs at a speed of 200 km/h or above as a high-speed railway. HSR are defined by the State Railway Administration of China as new trains with an operating speed of 250 km/h and above or passenger railroads with an initial operating speed of 200 km/h and above. Referring to this standard, China’s train lines starting with G (G-series high-speed train), C (Intercity high-speed train), and D (D-series high-speed train) in our country are the research goals of this paper. Based on the opening of HSR in Hubei province, Jingmen and Shennongjia Forestry District were omitted. Finally, the remaining 15 cities were selected as the research objects. The HSR train frequency data of 12,306 official website (
http://www.12306.cn/mormhweb/) (accessed on 30 June 2019). from 2009 to 2019 was captured, and the national railway passenger train timetable was checked every year [
43]. We used the social network analysis software UCINET6.2 to build spatial networks of HSR connections. In this paper, the HSR frequency matrix was used as the data source. The node of the network was the cities. The relationship between the nodes was divided by the daily running frequency of HSR, and the HSR network in Hubei province was constructed. We chose the infrastructure construction level and the traffic flow level to construct the network of HSR facilities and HSR travel network in Hubei province. We took the city where the HSR station was located as the network node. If the relationship between the departure city and the destination city is portrayed by “0” and “1”, “0” means there is no HSR connection between the departure city and “1” means there is an HSR connection, i.e., there is an edge, and the network of HSR facilities is constructed without considering the weight of the edge, and if there is a HSR from one city to another, a directed edge is established between the two city nodes, and the daily running frequency of the HSR between cities is taken as the weight on the directed edge, so as to construct the HSR tourism network.
- (2)
Data correction of nighttime light data
First of all, we corrected the annual data of DMSP 2009 and 2012 from the National Geophysical Data Center (NGDC). Then, we performed noise reduction processing on the data of VIIRS 2012, 2015, and 2019 from the NGDC, extracted the two sets of data coincidence years 2012 and 2013 for sensitivity analysis, and selected the optimal fitting parameters. Further, We calculated the annual data of VIIRS (2012–2020) as fit DMSP (2012–2020) data based on the optimal parameters selected. Finally, we constructed the synthetic DMSP (1992–2020) data set to obtain nighttime light data in 2009, 2012, 2015, and 2019.
- (3)
Economic network model calculation and processing
The data used to construct the economic network of each city in Hubei province comes from the Hubei Provincial Bureau of Statistics, and key indicators such as resident population and GDP come from the statistical annual reports of each city and state. According to Formula (2), we calculated the intensity of economic connection in 15 cities in 2009, 2012, 2015, and 2019, forming four 15 × 15 directed weighted urban economic connection matrices. We used the social network analysis software UCINENT6.2 to build spatial networks of economic connection.
4. Results
4.1. Space–Time Evolutionary Analysis of HSR Networks
4.1.1. Network Topology Analysis
- (1)
Network density
The network density reflects the overall development characteristics of the HSR network.
Figure 2 shows that the density of the HSR network in Hubei province has increased significantly year by year, which indicates that more cities have opened HSR and the accessibility of city nodes has improved. The network had good connectivity.
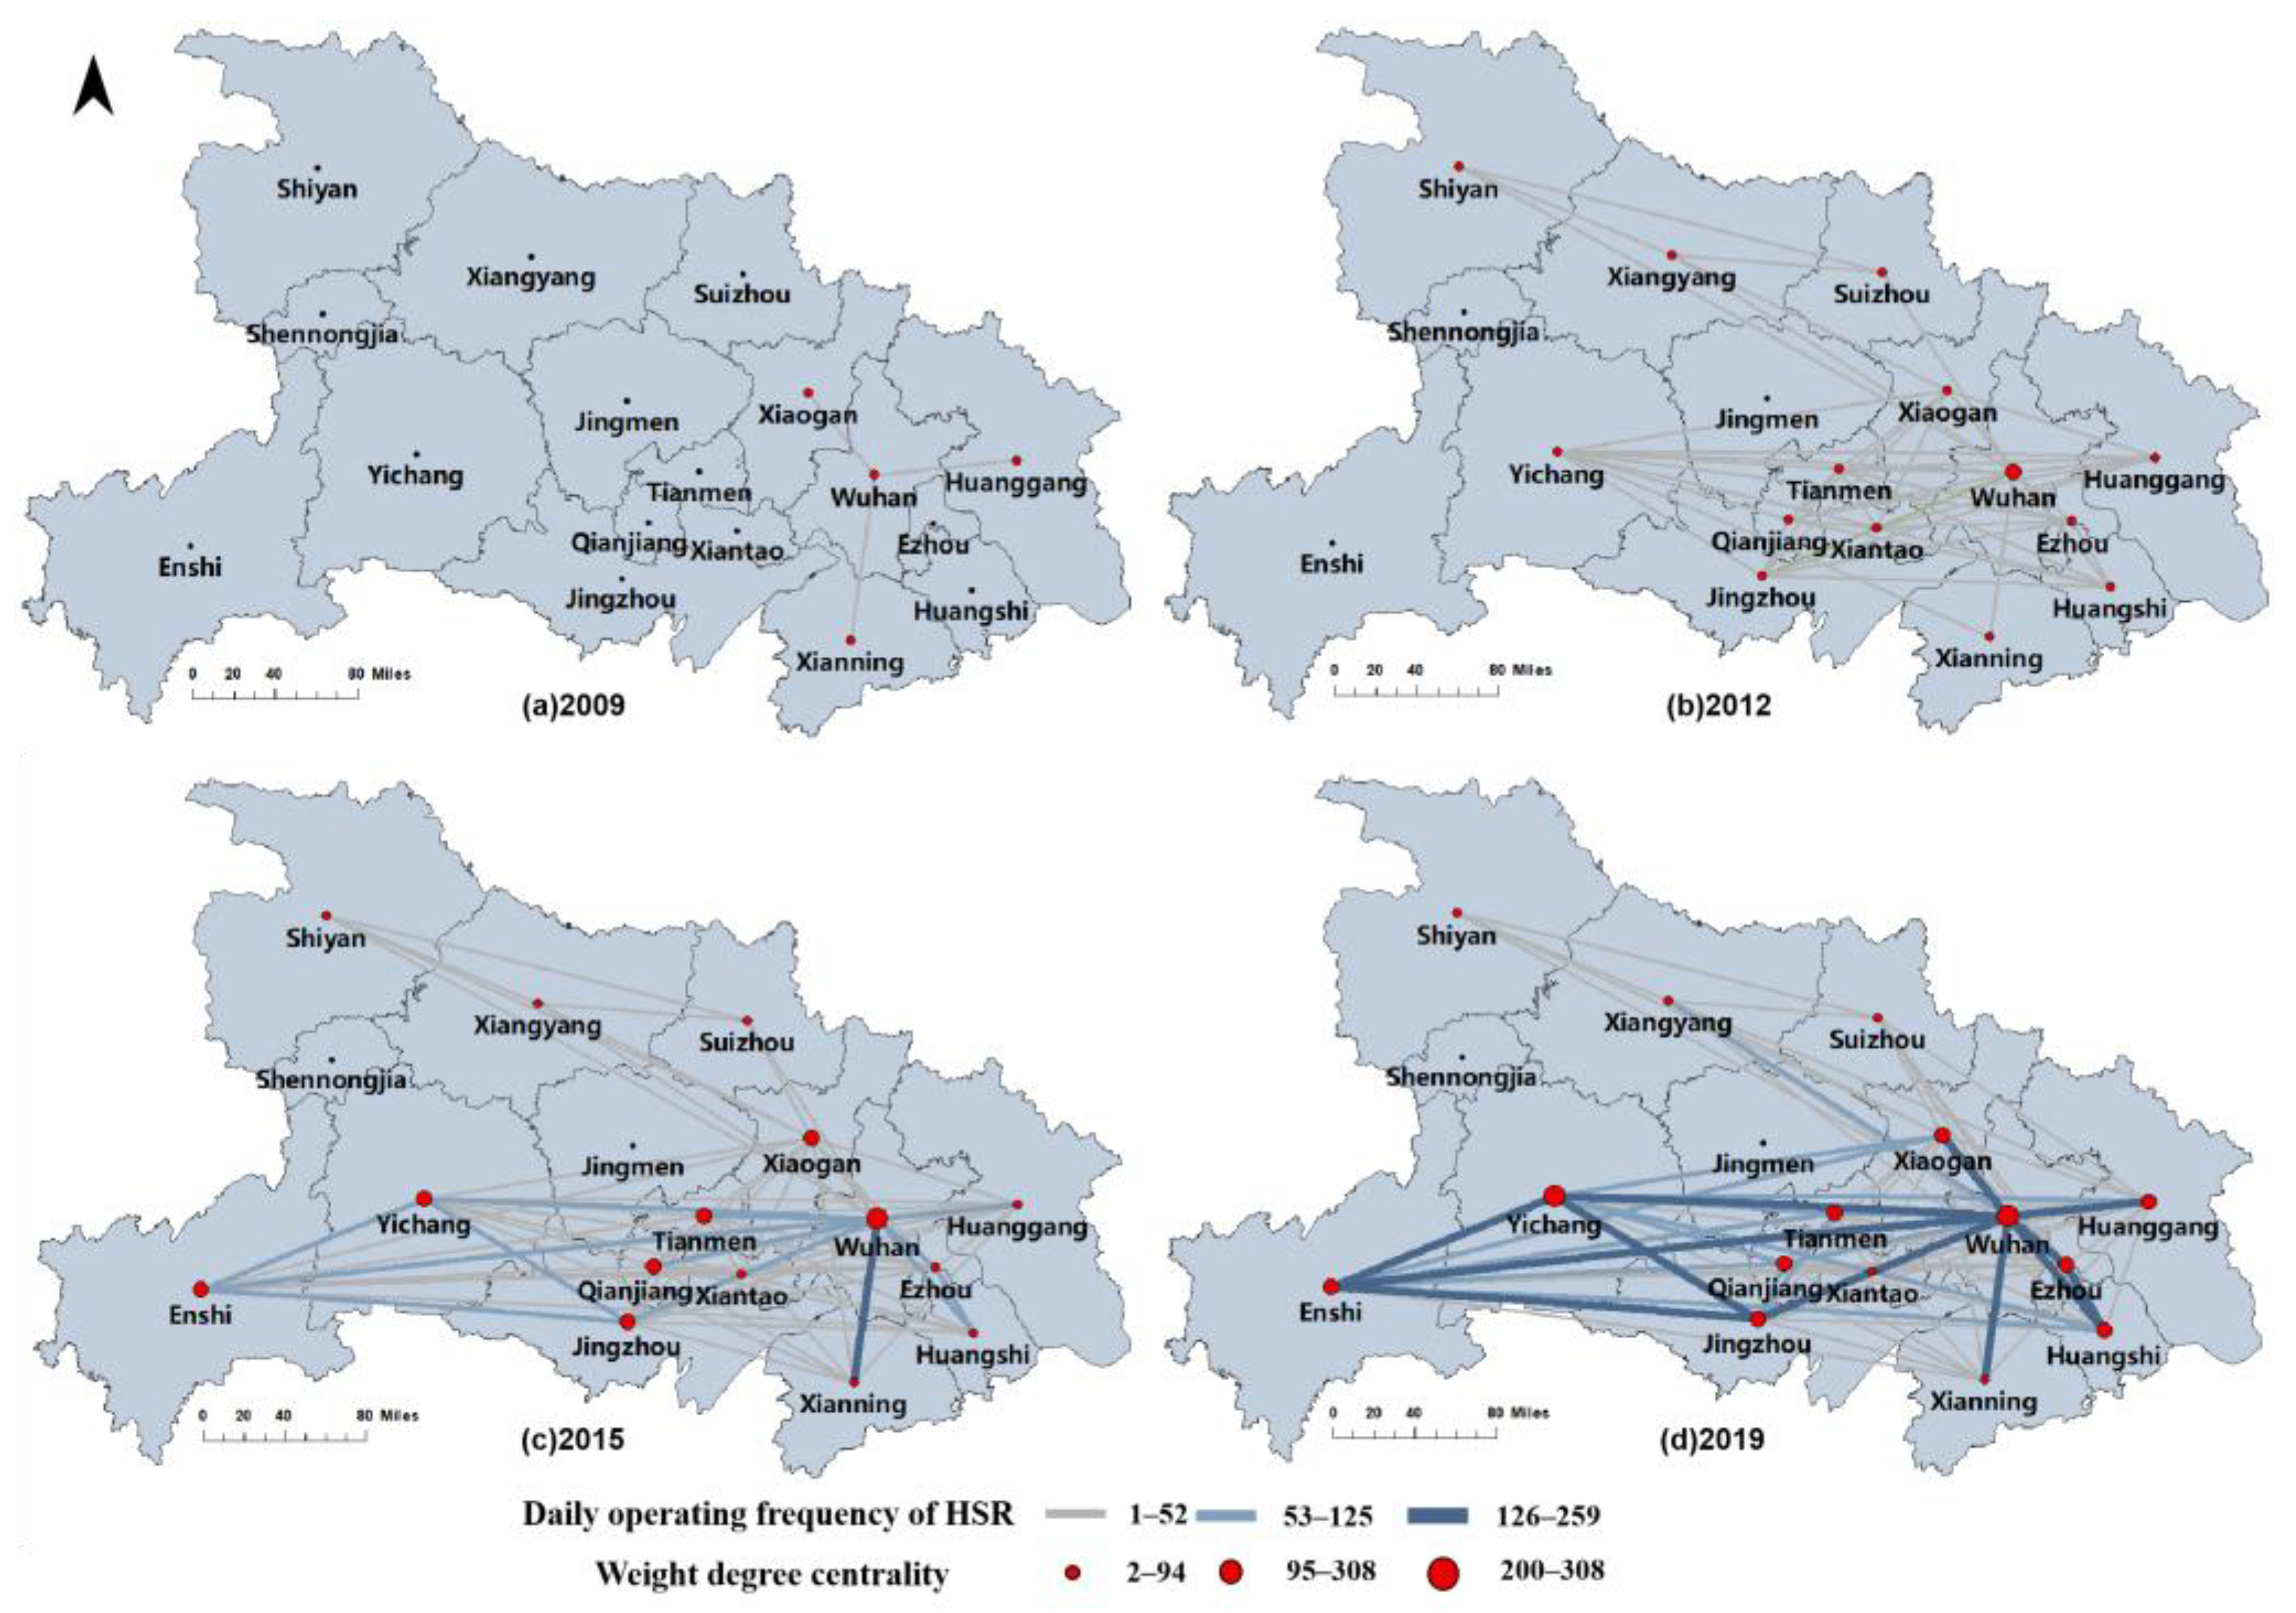
Table 2 shows that from 2009 to 2012, the network density increased from 0.029 to 0.462. However, the network density was small, and it belonged to the primary stage of HSR construction. With the opening of the He-Wu section and Han-Yi section of the Ning-Rong line, the Wu-Guang section and Zheng-Wu section of the Beijing–Guangzhou HSR further promoted Wuhan’s position as a hub node, and the overall infrastructure layout was in the primary stage of the backbone formation stage. From 2015 to 2019, the network density increased from 0.462 to 0.733, showing a trend of gradual increase. The relevance of the HSR network increased and the interactive structure improved obviously. By 2019, Wu-Xian, Wu-Shi, Wu-Gang, Wu-Xiao’s four intercity railroads were all completed and opened to traffic to further improve the construction of the Wuhan Metropolitan Area’s circular HSR Network. At the same time, Wu-Jiu HSR is also an important part of the HSR in Wuhan Metropolitan Area. The Zheng–Xiang section of the Zheng-Yu HSR and Han-Shi HSR has been opened one after another, accelerating the integrated development of the Wuhan Metropolitan Area and the Xiang–Sui-Shi city cluster.
- (2)
HSR connectivity and small-world effect
From
Table 3, the clustering coefficients of the whole HSR network in 2009, 2012, 2015, and 2019 were 0.235, 0.796, 0.848, and 0.843, and the value of the clustering coefficient was more inclined to 1. The HSR network in Hubei province had a significant clustering effect, and the construction of HSR infrastructure tended to be aggregated to a moderately high level. The HSR flow was passed from one node to another node more efficiently, and the flow of HSR elements was relatively rapid. From 2009 to 2019, the average path length of node pairs in Hubei HSR network were 1.5, 1.467, 1.338, and 1.267, showing a decreasing trend, and the traffic accessibility of the HSR elements was better. We further calculated the small-world entropy number, which increased year on year from 2009 to 2019 for the HSR network in Hubei province. This shows that the development of the HSR network produces a noticeable spatial compression effect—the stronger the overall connectivity of the network, the stronger the aggregation characteristics, and the more significant small-world property.
4.1.2. Network Centrality Analysis
- (1)
Weighted degree centrality
The centrality analysis of the network mainly focused on the micro-structure characteristics of the network. We used weighted degree centrality(WDC) to analyze the urban nodes in the network.
Table 4 shows the WDC of Hubei province from 2009 to 2019. As we can see, Wuhan is firmly in the first place, as the center of the HSR network and an important hub of inter-city interconnection. In 2019, the out-degree centrality of Wuhan, Yichang, and Xiaogan was greater than the in-degree centrality, and the radiation diffusion of their HSR was greater than aggregation. Huangshi’s in-degree centrality was bigger than out-degree centrality. Its function mainly lies in agglomeration, and its demand for external connection was weak. As can be seen from
Figure 3 and
Figure 4, from 2009 to 2019, the WDC of most cities has improved to some extent. The regions with the most significant changes are mainly concentrated in the Wuhan Metropolitan Area, such as Wuhan and Xiaogan, and some marginal areas in the southwestern region, such as Enshi, with the smallest growth in the northwest. Further, the coefficients of variation of WDC in 2009, 2012, 2015, and 2019 was 0.69, 0.77, 0.59, and 0.52, which shows that the balance of WDC is increasing, and the difference of WDC among cities is decreasing.
- (2)
Weighted betweenness centrality
As shown in
Table 5, the gap between the weighted betweenness centrality (WBC) of each HSR city in Hubei province is large. The WBC of Wuhan is much larger than the average value from 2009 to 2012, which has a substantial advantageous effect on intermediary HSR flow and controls the HSR element traffic of other nodes. It shows the characteristics of the core-edge pattern. The gap between the WBC of Wuhan and the average value was narrowed from 2015 to 2019. The WBC of other cities such as Xiaogan and Huanggang were all above average, which indicates that more cities in urban agglomerations have played a special advantage in mediating HSR flow and promoting the entry and exit of other node elements. The betweenness centralization was 37.33% in 2012. As shown in
Figure 5, there are some controlled node cities in the Hubei HSR network. Wuhan, Xiaogan, and Xiangyang play a certain role in controlling the HSR flow in Hubei and are important transportation hubs of HSR in the network. In 2015 and 2019, the intermediate concentration rates were 15.80% and 7.3%. The rapid development of HSR in other cities has dispersed the control function of key nodes in the network, which indicates that the development of the HSR network in Hubei tends to be balanced.
4.2. Space–Time Evolutionary Analysis of Economic Networks
4.2.1. Network Topology Analysis
By applying SNA, this paper describes the importance of geographical location and economy [
42]. We discussed the status of economic networks in Hubei province from the aspects of network density and network connectedness, as shown in
Table 6 and
Figure 6. From the perspective of network density, the inter-city economic connections became closer between 2009 and 2019, with network densities of 0.1048, 0.1905, 0.2143, and 0.2762. Within 10 years, the network density increased exponentially, and the interactions within the region increased rapidly. The above results show that although the overall connectivity of Hubei’s cities in 2019 has been substantially improved compared with that in 2009, the urban spatial structure is relatively loose, and most cities are still in a weak connectivity state.
In terms of network connectedness, the network connectedness was low in 2009, the network was highly dependent on specific cities, and the network structure was weak. In 2015, network connectedness became more and more obvious, and the network structure was gradually improved. The number of network connections in 2015 and 2019 was 1, indicating that most cities are directly connected or indirectly connected. The economic network has good accessibility, strong network robustness, and a good synergistic effect on economic development among cities.
4.2.2. Network Centrality Analysis
- (1)
Weighted degree centrality analysis
The weighted degree centrality (WDC) describes the connection strength between the node city and other cities in the network, and reflects the importance of the node, as shown in
Table 7. In terms of out-degree centrality, Wuhan is ten years ahead. Far more than the average, it shows that Wuhan is the core city in Hubei’s urban economic network, at the absolute center of the network, with the ability of three-dimensional radiation in space, and exporting information, technology, talents, and capital to other cities. Xiaogan and Jingzhou have a significant increase in out-degree centrality, gradually overtaking Huanggang, Huangshi, and Ezhou, which shows that the two cities make full use of resources and enhance their economic strength. The opening of the HSR has promoted close contact with cities and further expanded the space radiation. Huanggang, Huangshi, and Ezhou have similar geographical advantages as Xiaogan and Jingzhou, and are adjacent to Wuhan. Wuhan, Huanggang, Xiaogan, Jingzhou, Suizhou, and Ezhou all exceed the average value in the in-degree centrality. Wuhan radiates outward, has strong absorption and tolerance, and receives radiation from other cities. Xiaogan is second, which indicates that it is close to Wuhan, receives radiation and promotes its rapid development. In contrast, the opening and operation of the Xiaoxi section of the Han-Shi HSR mark the beginning and function of the entire Han-Shi HSR line, further promoting its ability to attract resources and factors from other cities. In contrast, the in-degree centrality of Huanggang and Ezhou are far higher than the average, and their geographical location is close to Wuhan, so they can take advantage of their geographical advantages to receive radiation from the central city and achieve rapid development. Jingzhou, taking advantage of its resources and transportation, has a high reputation, accepts information and capital output from other cities, and is expected to develop into a new central town in an urban agglomeration.
In order to further study the WDC, the rank size rule is introduced. The rank-size rule examines the distribution of urban systems in terms of the relationship between city size and city size rank order and is calculated as follows [
44];
where
denotes the ranking order of city
in the city cluster,
denotes the size of town
. In this paper,
denotes the WDC of city
,
and
denote the constants of the fit,
denotes the intercept, and
denotes the slope of the curve.
Through the regression simulation, the following calculation results are obtained (
Table 8). The correlation coefficients of each fitting expression was above 0.6, and the goodness of fit was very high, indicating that the characteristics of the node rank-size rule distribution of the economic network in Hubei province were prominent. The overall ZIPF index has experienced a trend of first falling and then rising.
Between 2009 and 2012, the p-value decreased from 1.125 to 1.082, which indicates that in the evolution of the scale of economic network node, the urban population in the middle rank is growing faster, and the distribution of the scale of economic network node tends to be scattered. After 2012, the p-value increased year by year, which shows that the importance of cities in the network varies widely; large cities are prominent, whereas small and medium-sized cities are underdeveloped. The WDC of a city shows a tendency to cluster to a few cities with the construction of HSR. The structure of HSR expanded the spatial differences of the WDC of urban weighting, and the external contact of high-grade cities was more convenient. The actual WDC of the first city started to be lower than the theoretical value, which indicates that the subsequent higher-ranked cities are developing faster than the first city, and the relative advantage of the first city is decreasing. From the actual situation, the urban economic structure of Hubei province has started to develop into multi-center, which jointly leads the urban economy in a more balanced direction.
- (2)
Cohesive subgroups
The analysis of the cohesive subgroup of the economic network reveals the actual or potential economic relationships of regional cities. It explores the phenomenon of small group gathering among cities due to close economic connection, which reflects the intra-group and inter-group economic affinity. The development of urban agglomerations has roughly experienced four stages, resource concentration, driven development, cluster development, and mature development. In the process of development, there must be unbalanced economic relations in the region, and this method can be used to divide different subgroups. Finding the subgroups with frequent internal relations is helpful in promoting the development of regional clusters and the development process of urban clusters. In this paper, we used the convergent correlation (CONCOR) tool of UCINET to cluster the internal structure of the economic network of urban agglomeration, and we got the cohesive subgroup tree diagram (
Figure 7) and cohesive subgroup density table of the economic spatial network (
Table 9 and
Table 10).
It can be seen in the tree diagram of cohesive subgroups in 2009 and 2019 (
Figure 7) that the economic connections of cities show a pattern of group development, and the construction of HSR promotes the connections between cities. The division of subgroups gradually becomes more obvious. The distribution characteristics of subgroups are strongly correlated with the geographic location of cities which are geographically adjacent or close to each other, with more frequent exchanges and interactions, and closer economic connection, making it easier to form city combinations.
The density matrices of cohesive subgroups in 2009 and 2019 show that the economic development between cities within the same subgroup has substantial similarity and dependence. The economic connections between cities in a cluster gradually deepened, the number of high-density cohesive subgroups expanded, the number of low-density cohesive subgroups shrank, and the economic connections between subgroups strengthened. At the same time, regional economy and spatial pattern are gradually developing toward a relatively balanced direction.
From the four subgroups divided at the second level of the cohesive subgroup analysis, it can be seen that the economic connection of urban agglomeration have formed four obvious subgroups in space:
According to
Figure 8, there are four important subgroups. Wuhan, Xiaogan, and Jingzhou are the first subgroup. Ezhou, Huangshi, Huanggang, and Xianning are the second subgroup. Yichang, Qianjiang, Xiantao, and Tianmen are the third subgroup, and Xiangyang, Suizhou, Shiyan, and Enshi are the fourth subgroup.
Table 11 shows that the density value of the first subgroup is 1, indicating that the cities within the cohesive subgroup have a strong economic connection and frequent interactions in information sharing and economic cooperation. At the same time, the density value of the second and fourth subgroups is higher, which indicates that the first subgroup has a strong economic radiation effect on the second and fourth subgroups. However, the third group still needs to strengthen radiation to enhance its driving effect. The density values of the third and fourth subgroups and other subgroups are lower than those of their internal subgroups. While strengthening the internal relations of subgroups, we should have actively interconnected with different subgroups. As far as the reciprocal relationship within the subgroups is concerned (
Table 12), the first subgroup has formed a reciprocal relationship with other subgroups. The first group, the second group, and the fourth group in the city have established a strong and mutually reciprocal relationship. The reciprocal cities are more active, the inter-city relationship is more stable and active, and cities generally carry out more stable and frequent cross-regional economic factor transfer. The other three subgroups form a reciprocal relationship with the first subgroup, but their reciprocal economic relationship is relatively weak. In summary, it shows that the connection among cities in the sub-group is relatively close and the interaction is strong. The first subgroup is at the center of the four subgroups. The first subgroup has a strong radiation effect and has a good interactive relationship with other subgroups, but the other subgroups have not established a stable and economic interactive relationship. Each subgroup must not only promote the closeness of the internal relations of subgroups, but also actively establish interconnection relationships with other subgroups to promote the coordinated development of the whole economic network.
4.3. Correlation Analysis of HSR and Economic Network
4.3.1. QAP Analysis
In order to analyze the interaction between the HSR network and economic network, we used QAP correlation analysis to examine this relationship.
Table 13 shows the correlation between the HSR network and the economic network of Hubei from 2009 to 2019. Generally speaking, the two networks show a high correlation and have statistical significance, which shows that they can promote each other’s development. From 2009 to 2012, the correlation between the HSR network and the economic network has been on the increase, showing a high correlation, indicating that in the early stage of HSR construction, the mutual promotion between the two is strengthening. The construction of HSR can promote the strengthening of economic connections through direct effects such as investment and employment, improve regional interaction, and influence spatial spillover through indirect benefits. It is self-evident that the economy plays a key role in building an HSR network.
However, from the results of the correlation analysis, the correlation between the two is not obvious, showing a downward trend from 2015 to 2019. This may be because the national economic development has slowed down in recent years, while the construction cost of HSR is high and the payback period of investment is long. This increases the opportunity cost for local governments to miss the development of other industries and overdrafts the future growth potential of the region.
4.3.2. Coupling Coordination Degree Analysis
- (1)
Coupling coordination degree analysis of urban nodes
The coupling degree combines accessibility with economic connection strength, which can more analyze the synergy and interaction between accessibility and economic development, and further evaluate the influence of the HSR network on the regional economy. The higher the degree of coordination, the higher the degree of integration and interaction between them. The more coordinated the development of transportation accessibility and economic connections, the more reasonable the allocation of resources, so that they can play a complementary role and make progress together. On the contrary, the two will be mutually restricted.
Based on the data before and after the opening of the HSR in Hubei province, this paper calculates the coupling coordination degree of cities and studies the development degree between accessibility and economic connection strength. According to the econometric model, the calculation of the coupling coordination degree needs to know the weights of accessibility and the strength of economic connection. Considering the small amount of research data, we used the entropy method to calculate the weights. The calculated results are listed in
Table 14.
According to the calculation, the coupling coordination degree between the accessibility and economic connection strength before and after the formation of the HSR network is obtained (
Table 15). From the comparison of the coupling coordination degree results, we can see that the average value before the opening of an HSR is 0.163, which belongs to low-level coupling coordination. The average value of the province after the opening is 0.348, which belongs to medium-low level coupling coordination, up 53.16%, and the overall coupling coordination remains medium level. With the introduction of the HSR, the economic development of Wuhan and Xiaogan has kept a high degree of coordination with the construction of the HSR power grid, and the corresponding economic connections are closer. The economic development of Huangshi, Ezhou, Huanggang, and Jingzhou has improved with the improvement of the coupling coordination level of HSR construction and has entered the middle-level coupling coordination stage. However, due to the restriction of development, there is a gap in economic connections between other cities and other cities, and the effect of coordinated development is not obvious. The overall coordination level of the whole province has increased.
It can be seen from
Figure 9 that during the ten years of HSR power grid construction, the coupling coordination degree of Wuhan has been kept at a high level. The coupling coordination degree of Xiaogan, Huangshi, Ezhou, Huanggang, and Jingzhou has been on the rise, and the number of cities with moderate coupling and coordination level in the province is increasing year by year. Despite this, other cities are still in a stagnant or declining trend. Although accessibility has formed a virtuous circle with economic connection, the spatial distribution of coupling coordination degree is still unbalanced and polarized due to many factors such as economic structure, development planning, geographical restrictions, etc.
- (2)
Coupling coordination degree analysis of subgroups
PageRank algorithm measures the importance of nodes by considering their connectivity, which is modeled as a web page in the network, and the connected edges are modeled as links between nodes. PageRank algorithm is aimed at unweighted networks. In infrastructure networks, because each edge has a corresponding weight, it means that different edges have different weights. Therefore, the PageRank value formula is weighted and improved to distinguish the importance of nodes with the same degree and the weight difference of the connected edge.
Set the same initial PageRank (PR, denoted by the variable A) value for all nodes in the network, is the weight of the edge connected to node , is the number of nodes, is the resistance coefficient, , generally 0.85.
In this paper, the PageRank algorithm is introduced to evaluate the connectivity of nodes in the transportation network and economic network. The
PR value of nodes indicates the importance of the node, and the sum of
PR values of nodes in their respective subgroups is used to reflect the external connectivity of subgroups. The subgroups with high external connectivity have a high position in the network. The traffic PageRank values and economic PageRank values of the four subgroups in 2019 are calculated, and the results are shown in
Table 16 below. In the first subgroup, most of the cities within the subgroup have a higher strength of external connectivity of transportation or external connectivity of economy and occupy a more important position in the transportation or economic network of the province, with a higher degree of coupling and coordination of transportation and economy. The traffic and economic development of the cities in the second subgroup is lower than that of the cities in the first group, and they are in a low to medium level of coupling and coordination. The cities in the third and fourth subgroups have gaps in transportation or economic connection, and the overall coupling and coordination are low. To sum up, to improve the level of coupling and coordination, we need to improve the degree of urban traffic and economic development, and pay attention to the synergy between traffic and economic development.
We further analyzed the network positions and roles of the subgroups to obtain a matrix (
Table 17) and a role graph (
Figure 10). The arrows in the role graph indicate the ability of a subgroup to “send” relationships outward, indicating its ability to control and influence other subgroups. In 2019, the four subgroups had high centrality, and the arrows pointing to themselves show a high cohesion within the city. The first subgroup radiates to the other three subgroups, but only “receives” the relationship of the second subgroup, and only “sends” the relationship to the third and fourth subgroups unilaterally, while the rest of the subgroups do not “send” relationships to each other. We can get the roles of each subgroup in Hubei province and propose the spatial pattern of future urban development of “one core and three clusters”. The first subgroup is composed of core cities such as Wuhan, which will actively play a leading role in radiation, and other subgroups will respond to the development policy of the core subgroup. They make use of HSR and other transportation construction to strengthen the economic connection among cities in subgroups, promote the economic exchange between cities across subgroups, and revitalize the flow of elements before the core area and peripheral areas, so as to realize the regional integrated development. In “The Implementation Plan for Promoting New Urbanization in the 14th Five-Year Planning”, Hubei province also put forward the construction of “one main wing”. This refers to Wuhan, Xiangyang, and Yichang as the core, leading the three major urban areas in Wuhan Metropolitan Area, Xiang-Shi-Sui-Shen, and Yi-Jing-Jing-En. In line with the conclusions of this paper, we will continue to deepen the economic connection of the core cities and take advantage of the HSR construction to drive the overall coordinated development of the city agglomeration.
5. Discussion
Prior works have not reached a consensus on whether HSR can promote regional economic growth. Here are two main points. First of all, the high-speed rail promotes regional polarization. The practice of France and Japan has proved that the high-speed rail has led to regional polarization development to a certain extent, and regional differences are more obvious. The construction of high-speed rail can not alleviate the problem of over-agglomeration, but will continue to strengthen the original economic cores and make these cores become the central nodes of the high-speed rail network. Second, high-speed rail is conducive to balanced development. Core cities can radiate and drive the development of surrounding cities. The experience of cities along the high-speed rail in the UK shows that high-speed rail has guided the rapid growth of large, medium, and small cities along the line. However, these studies have either been short-term studies or have not focused on a network perspective. In this study, we studied the network topology and evolutionary characteristics of the HSR network and economic network in Hubei province based on the SNA. And we tested the interaction between the two networks is analyzed by using QAP correlation analysis and coupling coordination model, and the main conclusions are drawn.
We found that with the improvement of the overall compactness and connectivity of the HSR network, it has gradually developed from the initial stage of skeleton construction to a more mature stage. The spatial compression effect of developing an HSR network is obvious. The stronger the overall connectivity of the network, the stronger the aggregation characteristics, and the more prominent the small world characteristics. The centralization of the network shows a fluctuating change of first rising and then falling, which indicates that the development of other cities in HSR shares the pressure of Wuhan as a core node. The gap between core nodes and ordinary nodes has narrowed, which improves the stability of the HSR network in Hubei province and shows a balanced development trend. With the HSR network development, the economic network density is increasing year by year, and the intra-regional interaction is getting closer and closer. However, the spatial structure of cities is relatively loose, and the links between most cities are still weak. At the same time, the network connectivity is showing an increasingly significant trend, which indicates that the economic network is stable and has a good synergistic relationship with economic development. Generally speaking, from 2009 to 2019, the concentration of economic networks shows a trend of first increasing and then decreasing. Overall, the out-degree concentration is more significant than that of the out-degree concentration, which indicates that the external radiation capacity of cities in Hubei urban agglomeration is more balanced, and the difference in internal cohesion is more significant. Through the analysis of the interactive relationship between the HSR network and the economic network, the two networks show a high degree of correlation, and it has statistical significance. They can boost each other’s development. However, the correlation tends to decrease later and reduces the promotion effect on economic growth. Then, the number of cities in the area in the medium-level coupling coordination stage increases year by year during the ten years of HSR network construction. The overall coordination level of the whole province has improved. However, although the accessibility and economic connection have formed a virtuous cycle, the spatial distribution of coupling coordination degree still shows an unbalanced and polarized trend due to many factors such as economic structure, development planning, and geographical restrictions of a city.
These findings extend those previous works and demonstrate the impact of HSR on regional economic development from a regional perspective. In addition, the improvements of our study demonstrate the impact of the development of high-speed railway on economic development and the synergy between them from three aspects: the overall network, local city subgroups, and city nodes. The study, therefore, indicates that the coordinated development of high-speed railway and economic development is conducive to exerting the structural potential of high-speed railway network and promoting regional economic integration.
6. Conclusions
To sum up, the development of the HSR network has an important impact on the process of accelerating the development of economic integration in Hubei province. Based on the above conclusions, combined with the synergy between the high-speed rail network and the economic network, the following three policy recommendations are put forward.
Firstly, the core urban agglomeration with Wuhan as the center and Xiaogan as the sub-center should play a leading role in radiating to other cities and promoting the formation of a good industrial division among cities. Non-central cities should attach importance to the development of secondary industry, guide the rational flow of labor factors and narrow the gap with central cities. After the war, Germany formed a city-scale structure characterized by small and medium-sized cities, and the functions of each city complemented and cooperated with each other. Complementary urban networks and the highly developed transportation network reduce the necessity for enterprises to move across regions and cities. HSR usually deepens the cooperation between cities without triggering the flow of capital elements. Cities in Hubei Province have formed an urban system that is closely related to each other, but some cities also have the phenomenon of insufficient industrial division of labor and homogeneous competition. There is no good industrial division and connection among city, small and medium-sized cities, and central cities, which will directly lead to the problem of insufficient division of labor and excessive competition among cities, and ultimately have a negative impact on the overall strength of the metropolitan area.
Secondly, we should pay attention to the construction of HSR stations as regional transportation hubs and guide the construction of regional transportation networks. According to the development experience of the Paris-Lyon high-speed corridor, the completion of HSR has strengthened the links between the cities in HSR station, making the traffic along the HSR more convenient. While bringing economic factors and huge economic growth to big cities, HSR has sacrificed the interests of some small and medium-sized cities. Therefore, while developing the expressway network and improving the accessibility of regional central cities in Hubei province, we should also pay attention to the development of regional transportation networks, and improve the regional transportation links of peripheral cities that are not directly connected with the central city’s HSR lines. And we should further spread the HSR dividend to other cities in the region, thus promoting coordinated development of the region.
Thirdly, we can make use of the existing advantages of urban subgroups to promote local economic integration. Under the premise of ensuring smooth internal relations among subgroups, we should speed up the interaction and exchange of elements between subgroups, strengthen economic connections among subgroups, and give full play to the complementarity of regional financial functions. When the HSR access conditions are relatively good, we should start with the network subgroups with a high degree of shortening of time distance, a foundation for policy guidance, and a relatively close connection, gradually seek to enhance their own openness to the outside world, and strengthen economic ties between subgroups to drive development.
Although we have got the above insights, our research has limitations and can be solved in the future. Firstly, the research area of this paper is Hubei province, which focuses more on the empirical analysis of specific regions. One more comparative study between regions can be added in the follow-up. Secondly, the simulation and estimation of the interaction between cities in China by using urban attribute data is the result of empirical deduction, which can not fully reflect the real connection between cities and has obvious limitations. The following research can use the concrete connections between cities that can be directly quantified. Thirdly, carry out comparative studies of domestic and foreign cases. HSR construction in western countries is relatively mature, while China’s HSR construction started relatively late. Therefore, it is necessary to strengthen the empirical study of high-speed rail cases in typical foreign regions. Finally, this study lacks an exploration of the mechanism of the synergy between the HSR networks and economic networks. Future research can increase the research on the impact mechanism and put forward more targeted decision-making suggestions for promoting the coordinated and integrated development of the regional economy.


