Article

Tourism Destination Competitiveness: Analysis and Strategy of the Miyagi Zaō Mountains Area, Japan

1
Faculty of Business Administration, Tohoku Gakuin University, Tsuchitoi 1-3-1, Aoba-Ku, Sendai City 980-8511, Miyagi, Japan
2
EM3-28 City West Campus, University of South Australia, Adelaide, SA 5001, Australia
*
Authors to whom correspondence should be addressed.
Sustainability 2022, 14(15), 9124; https://doi.org/10.3390/su14159124
Submission received: 20 June 2022 / Revised: 7 July 2022 / Accepted: 18 July 2022 / Published: 25 July 2022

Abstract

:
This paper uses the tourism destination competitiveness framework to support the formulation of a tourism development strategy for the Miyagi Zaō mountains area in Japan. The study area experienced major disruptions associated with the 2011 earthquake, the Fukushima nuclear accident, and the 2015 and 2018 volcanic eruption warnings. The disasters had a significant impact on tourism, which plays a key role in the sustainability of Zaō town and the surrounding region. Zaō town is faced with an aging population and a shrinking economy. A survey of visitors (demand side) and local company representatives (supply side) was conducted to determine perceived strengths and weaknesses of the regional tourism destination. Nature-based activities were awarded the highest scores by both sides. Based on the findings from the destination competitiveness analysis, a nature-centric tourism development strategy is proposed to achieve destination competitiveness and sustainability of the local society and the natural environment.

1. Introduction

All tourism destinations need to be competitive in the global tourism marketplace, even those located in rural areas which may have limited financial and human resources. Some rural towns and communities are highly dependent on the tourism industry to generate jobs and revenues for their residents. In those cases, locally-appropriate tourism is intrinsically linked to the sustainability of local communities [1]. Rural tourism destinations and rural communities must make strategic decisions, based on knowledge generated by relevant research.
The tourism destination competitiveness (TDC) model adopts a holistic approach to identify the strengths and weaknesses of resources and capabilities endowed in and created by tourism destinations. TDC research started in the late 1990s, further developed with subsequent theoretical conceptualizations and empirical studies around 2000, and has become an enduring theme in tourism studies. After reviewing one hundred and twenty-one TDC articles between 1997 and 2018, Cronjé and Du Plessis suggested that “tourism destination competitiveness will remain a popular research topic within the tourism industry” [2] (p. 256).
Cronjé and Du Plessis also claimed that “most [TDC] research case studies were based in Europe and therefore emphasise the need for focus on other continents as well” [2] (p. 256). Japan is recognized as a unique and attractive tourism destination but TDC research in the country has been very scarce. Dwyer et al. [3] measured the price competitiveness of Japan as a tourism destination but no studies which apply TDC in Japanese rural destination have been reported in the tourism literature. This paper seeks to examine the destination competitiveness of the Miyagi Zaō mountains area in the Tōhoku (northeastern) region of Japan. Stakeholder perceptions are identified from both demand and supply sides to inform a tourism strategy designed to achieve sustainable development.
The region that is the subject of the study experienced major disruptions associated with the 2011 earthquake, Tsunami and Fukushima nuclear accident and warnings of volcanic eruptions in 2015 and 2018. Zaō town located in the center of the region has an aging population and shrinking economy and relies heavily upon the tourism industry. The Zaō town government considers tourism development to be the foundation for the sustainability of the local community. Adopting an instrumentalism perspective, this study utilizes the TDC model as a tool to identify the strengths and weaknesses of tourism resources in the Miyagi Zaō region. The findings inform strategy formulation, using tourism development to sustain tourism, the host society and the local environment [1,4].
This article is divided into a number of sections. In the first sections, a review of research related to destination competitiveness is followed by an explanation of the purpose of the study and the approach that was adopted. The history and context of the Miyagi Zaō area and existing development strategies of the Zaō town government are discussed in the third section, and the importance of tourism to the region is identified in the fourth section. The implementation and results of the questionnaire survey are discussed before the findings and implications are presented in the final section.

2. Destination Competitiveness and Strategy

2.1. Attributes of the Tourism Destination Competitiveness Model

An ability to attract tourists is a prerequisite to the development of a successful local tourism industry. This has forced tourism destinations to adopt “a much more professional approach to managing the tourism resources within their boundaries”, requiring “a systematic approach to strengthening the ability of a destination to compete effectively in the international marketplace” [5] (p. 150). Destinations are geographical spaces where visitors are drawn to spend time and money. The spaces may defy political boundaries, incorporating several towns across a region. It is the resources within the region which attract visitors, provide necessary services and help create a distinctive identity, shaping the nature of the destination, the experiences it offers, how it is perceived and the way it should be planned and managed. The competitiveness of a tourism destination concerns its ability to create and integrate value-added tourism products or services, and maintain its market position relative to competitors [6], while sustaining its natural resources and ecology [7]. The emphasis on marketing in this definition is noteworthy as is the importance of achieving sustainability. An ability on the part of industries or companies to utilize resources or assets endowed in a destination determine its competitive advantages [8]. As pioneers, Dwyer et al. and Crouch and Ritchie underlined, that it is important to use competitiveness “to maintain and increase the real income of its citizens” [9] (p. 2), and to achieve “societal prosperity” in these destinations or regions [5] (p. 137).
Research about TDC was first published around 2000 [3,5,10,11]. Enright and Newton [12] noted that, prior to that time, researchers had analyzed the competitiveness of tourism destinations using the concept of destination images or attractiveness. As Crouch [13] also commented, several articles investigated destinations’ competitiveness by focusing on specific aspects of the TDC model, such as destination positioning, management systems, marketing, price competitiveness, and quality management. Crouch and Ritchie [5], partly inspired by Porter’s [14] holistic model for a nations’ competitive advantages, presented a more integrated framework for comprehending the competitiveness of tourism destinations.
According to Azzopardi and Nash [15], the Crouch and Ritchie [5] framework became a seminal work of TDC and can be considered as the cornerstone of subsequent TDC studies. This early model was comprised of 19 elements categorized under four factors—supporting factors and resources, core resources and attractors, destination management, and qualifying determinants. A modified model that included an additional 17 elements was then developed by Ritchie and Crouch [8]. Dwyer and Kim [16] proposed another generic model in which they attempted to conjoin the demand condition as an important determinant into Crouch and Ritchie’s first model. In order to improve those earlier models, Mihalič [17] and Huybers and Bennett [18] suggested that the TDC model should be made more generic by designating environmental management as an additional element. More recently, Greenwood and Dwyer [19] have argued that TDC research failed to capture customer protection legislation matters associated with tourism destinations and that this should be incorporated into the model. Boes et al. [20] examined well-established smart cities in Europe and argued that the smartness of tourism supported by ICT and social capital could enhance the competitiveness of destinations and the quality of life of residents and tourists. Thus, the TDC model has evolved to become more holistic by introducing new dimensions that reflect the changing environment of the tourism industry and the needs of host communities.

2.2. Empirical Studies of TDC

Empirical studies were conducted immediately after the generic TDC models had been published. Enright and Newton [12] investigated Hong Kong’s competitiveness by applying the TDC model to the importance-performance analysis (IPA) and concluded that Hong Kong should maintain its inherently strong position in terms of safety, cuisine, international access, and international transport facilities, but improve dedicated tourism attractions, well known landmarks, government policies, and staff skills. Gomezelj and Mihalič compared the De Keyser-Vanhove and the Dwyer models and concluded that “Slovenia has the opportunity to become a successful tourism destination but, for the efficient prosperity of the tourism industry, many improvements in the area of destination management and demand conditions (most probably promotion) should be made” [21] (p. 301). These studies found that the TDC model had practical effectiveness.
The early empirical studies advocated the inclusion of a supply-side perspective, recognizing that practitioners with expertise in tourism management are able to evaluate TDC elements [12,21]. It was also recognized that, from a demand perspective, “tourists are well placed to evaluate the normal components of a destination’s attractiveness” [21] (p. 298). When analyzing the competitiveness of four destinations in southern Italy, Cracolici and Nijkamp [22] collected data from visitors. Zhou et al. [23] collected data from both 891 visitors and ten executive managers of CVBs. They used two different methods—the non-weighted process and the analytic hierarchy process (AHP) (see also Crouch [13])—to compare TDC scores of four regions in the USA. The responses of the managers were used to derive weighted attribute scores in the AHP method. Zehrer et al. stated that “integrated approaches looking at demand and supply side simultaneously as well as objective and subjective measures are not used very often” [24] (p. 56) in TDC studies. They generated a comprehensive data set collected from 730 destination suppliers and 2,153 visitors to compare four winter sports area, making it possible to investigate the relationship between objective data, such as the number of visitors, and subjective TDC scores. In a comprehensive review of the TDC literature, Cronjé and Du Plessis observed that “most of the research studies were conducted from a supply side approach” (p. 263) [2]. To meet the objectives of our study, the authors decided to adopt an integrated approach and consistent with the study by Zehrer et al. [24]; a survey of both demand and supply sides was conducted to fully understand the competitiveness of the Miyagi Zaō mountains area in Japan.

2.3. Coexistence of Competitiveness and Sustainability

Recent studies have identified sustainability as a factor that can enhance destination competitiveness. Seguí-Amortegui et al., who discussed whether sustainability and competitiveness can coexist, reported that the first article of tourism research related to competitiveness and sustainability (TCS) appeared in Web of Science in 1990. Subsequently, TCS studies were published every year from 1999, reaching one hundred and twenty publications in 2018. Following a systematic review, it was claimed that “a growing interest in research on the subject [TCS] can be observed” [25] (p. 7). Cucculelli and Goffi [26] analyzed the competitiveness of small Italian destinations and found a positive impact of sustainability-related factors on TDC indicators. By applying the same scope to tourism destinations in Brazil, Goffi et al. [27] demonstrated that sustainability is a key factor in enhancing TDC in a developing country. In a recent study, Martín-González et al., identify the most competitive surf beaches and subdistricts in Cape Town in terms of sustainability and point out that some beaches “can be promoted to attract environmentally sensitive surf tourists” [28] (p. 18). Evidence from these studies identifies connections between competitiveness and sustainability and supports the inclusion of measures for both concepts in related studies.

2.4. Strategic Tourism Development

A strategic approach to tourism development is particularly important for small and rural tourism destinations. Robinson and Murray noted that “throughout the world, rural communities have been suffering from industry loss and subsequently population loss” and “tourism development is often a viable tool for re-building rural regions” [1] (p. 2). In rural areas, the strategic development of tourism can enhance the viability of tourism businesses while helping to sustain the vitality of local communities.
The business studies literature defines strategy as the plan to determine goals or visions for an organization and the creation of shared statements to guide the action of members within the organization [29,30]. Rumelt [31] insisted that good strategy defines what organizations or their members should not do as well as what they should do. A strategic focus is particularly important when resources are limited and when key capabilities must be identified [32]. For instance, a SWOT analysis is regarded as a useful tool to investigate current strengths/weaknesses and opportunities/threats of business units [33]. The TDC model becomes an analytical framework to explore strong and weak tourism resources and capabilities situated in tourism destinations. As advocated by Kovačević et al. [4], the TDC model can be used not only for academic research but also as a practical instrument to provide fundamental information to assist strategy formulation.
Tourism destinations consist of fragmented and diversified industries and companies involved in transportation, food supply, tourist attraction, entertainment, retail, museums, galleries, sports, events, conventions and accommodation [34,35]. Accordingly, a tourism development strategy must seek coordination among the diverse components by sharing information, making objectives explicit and providing guidelines for participating organizations. In addition, an explicit and shared strategy can offer a value proposition to attract potential tourists [36].
This article adopts instrumentalism as a research perspective [37] with the TDC model used to provide practical information for strategy formulation to assist management of the Miyagi Zaō mountains area in Japan. A key objective is to identify the perceptions from demand and supply sides about the relative strength of tourism resources in the destination. This is presented as the prerequisite to achieving sustainability and societal prosperity in the region.

3. Miyagi Zaō Mountains and Zaō Town: Understanding the Region

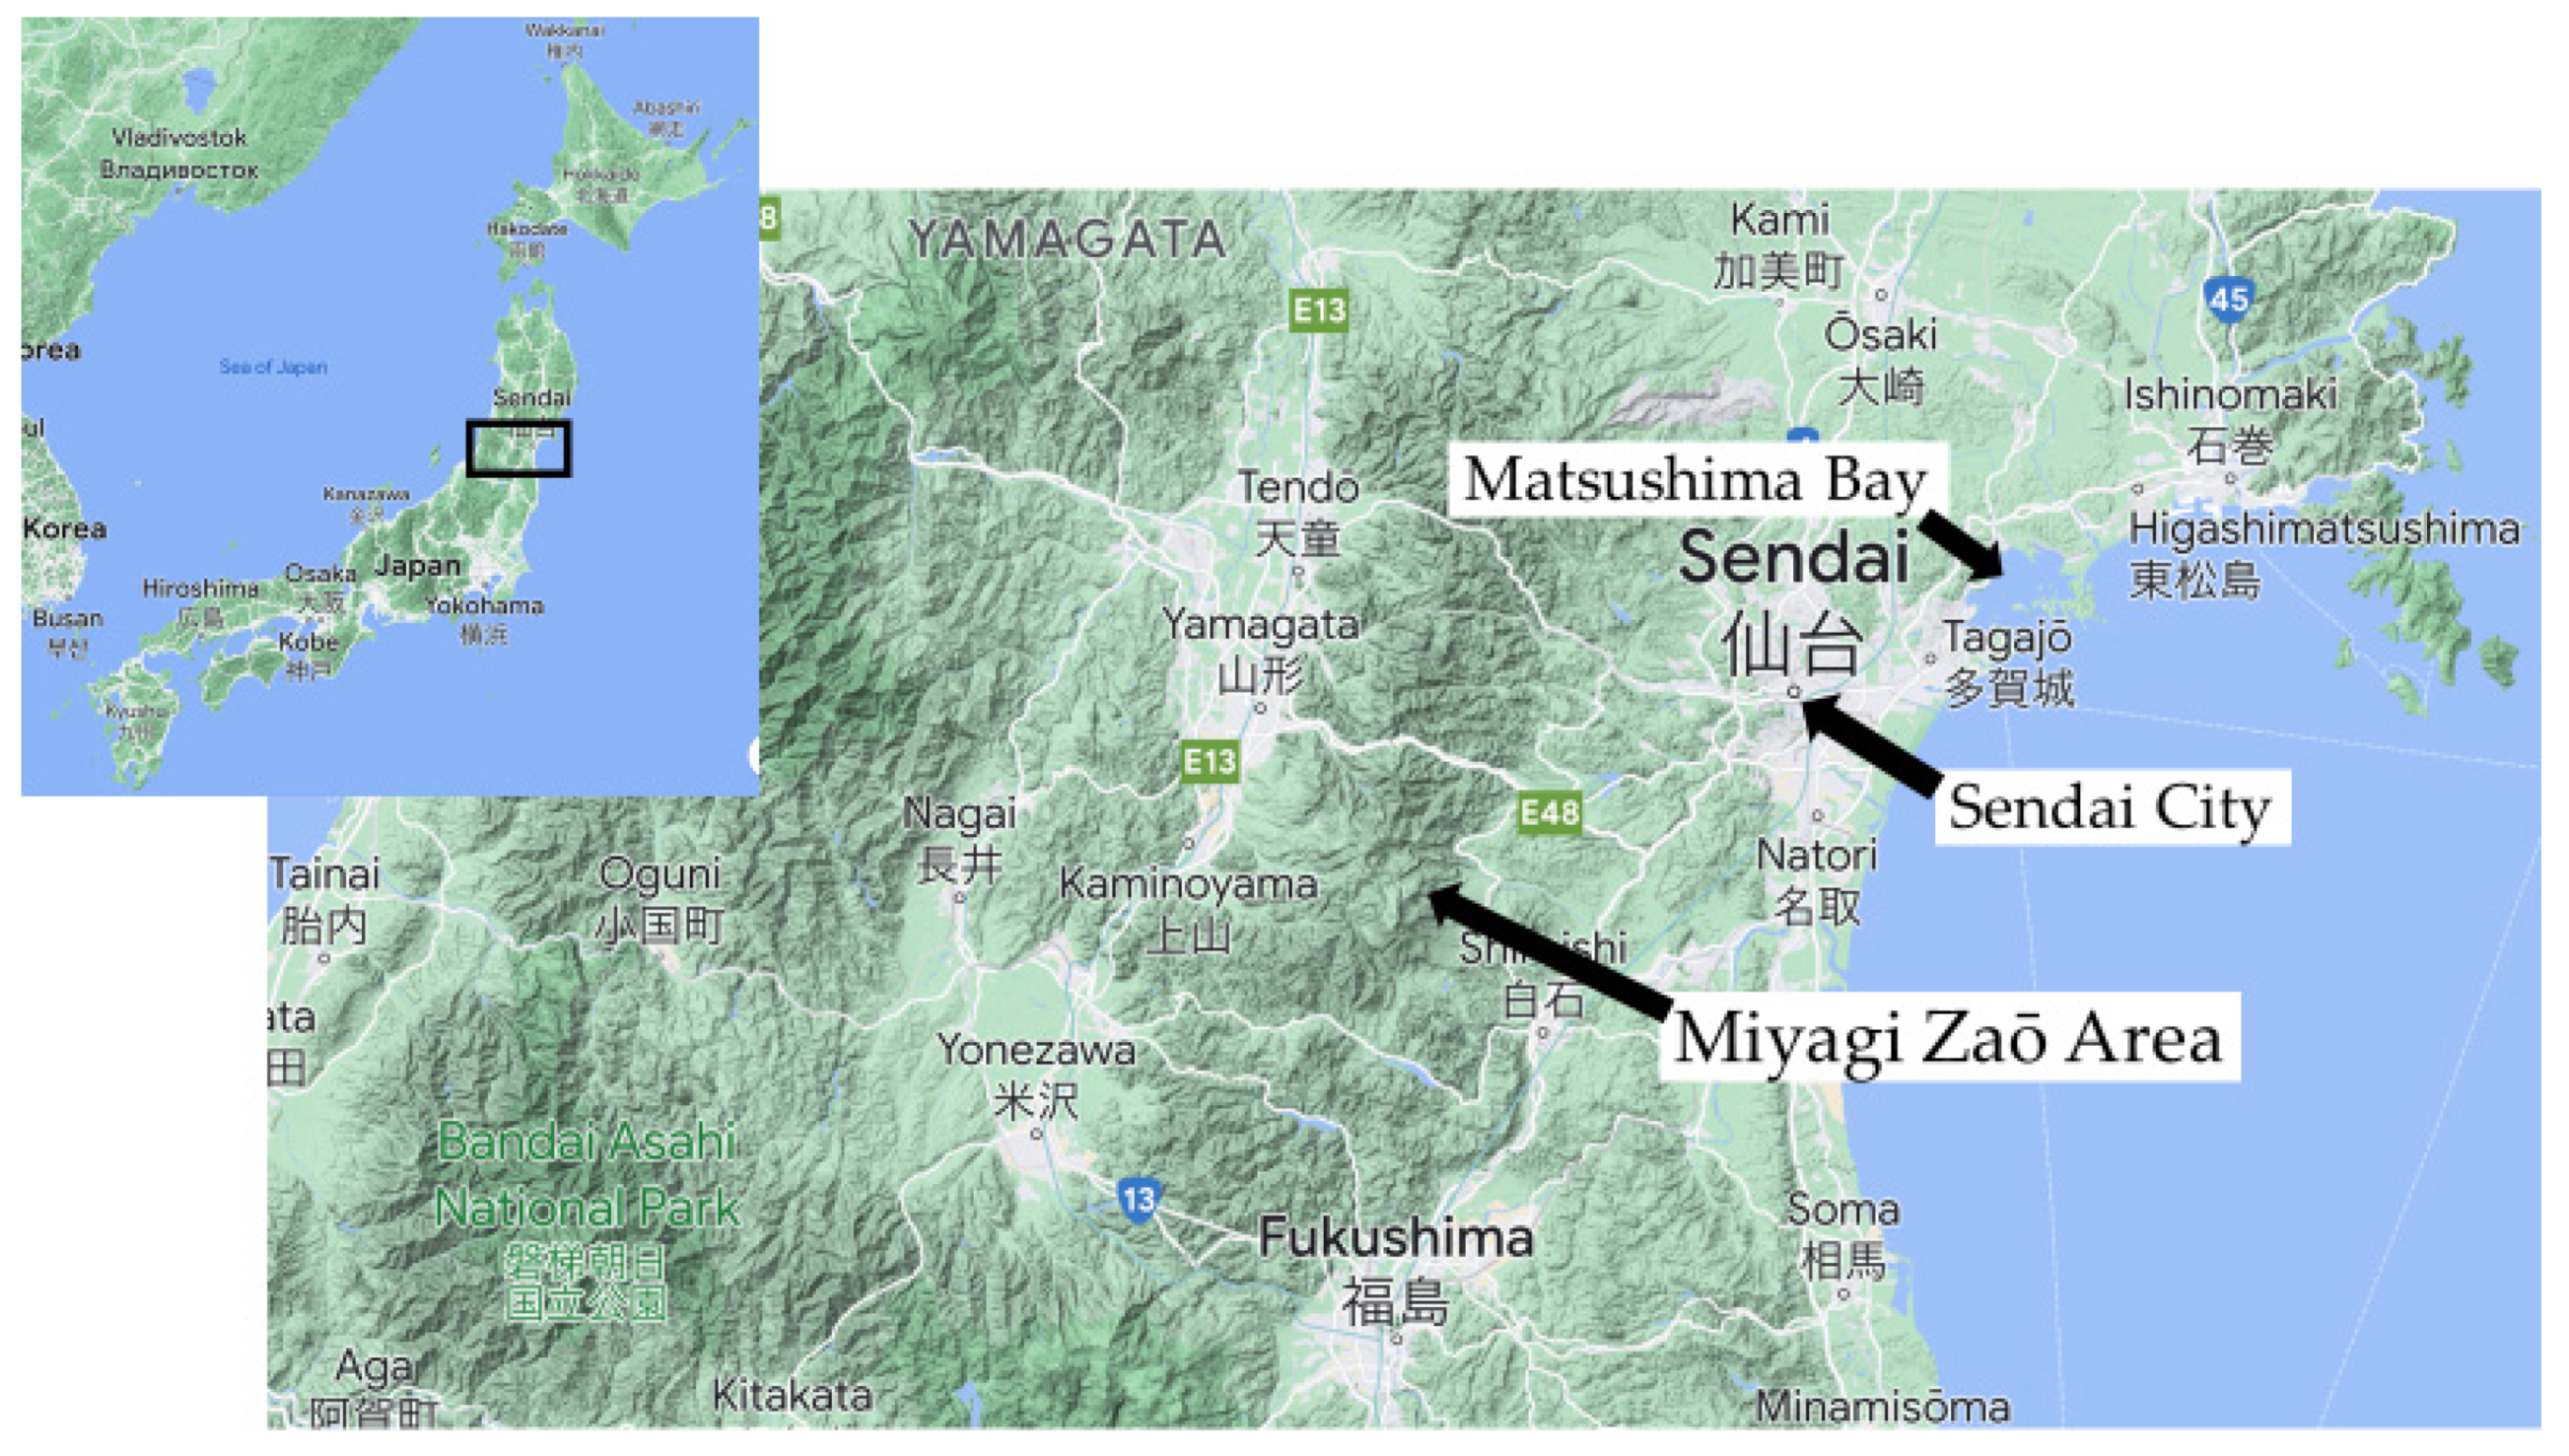
Zaō is the name of the mountains (38.141° N, 140.449° E) that lie between Miyagi and Yamagata prefectures in the northeastern (Tōhoku) region of Japan (Figure 1). The distance from Tokyo to Miyagi Zaō is 287 km [38] with a travelling time, by bullet train and bus, of approximately three hours. The mountains separate the Miyagi Zaō area on the Pacific Ocean side and Yamagata Zaō area on the Japan Sea side. This study focuses only on the Miyagi Zaō area. As recorded history by the Japan Meteorological Agency [39], the Zaō volcano has erupted since 773 with the most recent eruption occurring in 1940. A crater lake, the so-called Okama (kettle), is a famous tourism attraction. Two towns, Zaō and Kawasaki, and a city, Shiroishi, are included in the Miyagi Zaō mountains area. The Zaō town is located at the center of the area.
According to the report “The Vision of Zaō Town Population” issued by the Zaō town government in 2015 [41], the population of Zaō town was 13,172 in 2010. The website of the Miyagi prefecture showed that the population of Zaō town had declined to 11,621 in 2021 (−11.7% since 2010) [42]. “The Vision” indicated that while the population of 65 years and over had increased from 3,676 in 2010 to 4,043 (+367) in 2015, the population, across all age groups, below 65 had decreased. The phenomenon of “shrinking and aging society” has been evident in the town. “The Vision” report suggested that a combination of tourism and agriculture industries—agritourism—could help address the declining population and assist the local economy [41].
According to the tourism statistics of Zaō town and Miyagi prefecture governments [41,43], 3.8 million to 4 million people per year visited to the Miyagi Zaō area (Figure 2). During these sixteen years, the highest and lowest number of visitors were 4.1 million in 2019 and 2.9 million in 2011. The Great East Japan Earthquake in 2011 caused considerable damage in the region and the Fukushima nuclear accident reduced visitation to the region.
In terms of overnight visitation, 592,341 people lodged in the area in 2019 with the highest number being 664,761 in 2006. The global financial crisis reduced visitor numbers in 2008 and 2009. Interestingly, several hotels and traditional Inns situated in the Miyagi Zaō area were designated as temporary shelters for people evacuated from the 2011 Tsunami disaster and the number of people registered as overnight visitors increased in 2011 and 2012. As these evacuees returned to their homes, the number decreased in 2013 and 2014. Warnings about likely eruptions of the Zaō volcano caused a decline of visiting and lodging in 2015 and 2018. In addition, the COVID-19 pandemic had a major impact on tourist activity in 2020.
Statistical information of industry classification in the Zaō town illustrates the economic importance of tourism. The statistics are published every five years on the Zaō town government website. The most recent were figures for 2014, contained in the 2017 report [44]. At this time, the number of offices in accommodation and restaurant industries (103 offices) was the second largest and accounted for 16% of the total number (653 offices) situated in the town. The largest industry was the wholesale and retail classification that owned 137 offices. This would include the tourism-related shops such as those selling souvenirs. The size of the workforce in accommodation and restaurant industries (763 people) was the second largest group and shared 14% of the total workforce (5,503 people) in the town. Manufacturing (1,302 people) was the largest sector with the wholesale and retail (661 people) the third largest. Clearly, tourism represents a major part of the local economy.

4. Tourism Resources and Development in the Miyagi Zaō

It is important to have a clear understanding of the resources that underpin tourism in the region and Table 1 describes the resources, both endowed and created, in the Miyagi Zaō Mountain area. The natural and historical resources include the Okama crater lake, hot spas, shrines and temples, and the history of local Samurai. Although not as famous as Kyoto and Tokyo among international tourists, some of the resources of the Miyagi Zaō mountains area, especially the snow monsters, are well known throughout Japan. The sports, tourist attractions, special events and local foods are created resources that include winter sports, cycle races, a traditional dancing festival, local fruits, Soba noodle, Zaō cheese and beef [45].
The region has sixteen hotels and traditional Japanese Inns (Ryokan in Japanese), six pensions and visitor homes and four rental cottages [46]. Many of the hotels and traditional Japanese Inns are equipped with hot spas (Onsen in Japanese). There are thirteen restaurants, five local markets, and two souvenir shops in the Zaō town [47]. The level of service provision has made the region an attractive destination for residents of the Tōhoku region.
As in many European countries, the development of tourism policies is a responsibility of local government and the Agriculture, Forest and Tourism Department produced “Tourism of Zaō town: Strengthening the competitiveness of hot spas and tourism industry of Zaō region” in 2017 [48]. In the document, the government categorized tourism resources into strengths and weaknesses (Table 2). The name recognition associated with the Zaō mountains, the Zaō dairy industry and accessibility to the region were considered to be key strengths whereas the small and decreasing number of visitors coming from other prefectures and staying overnight in the region, especially overseas visitors, and the spatial concentration of visitors, restricted to a small number of places, were regarded as weaknesses.
Attracting foreign tourists is one of objectives of the Zaō town government, as outlined in a new 10 years tourism development strategy (2018 to 2027) [48]. Inbound tourists, especially from Taiwan and Thailand will be targeted. To do so, the government will make signs multilingual and use pictograms in the destination and hospitality industry. The strategy also emphasizes the need to enhance the destination brand of Zaō, to exploit data-driven strategy formulation, to combine various tourism resources, to attract educational or school tours and to enrich agritourism and local foods.

5. Study Method

Building of the situation analysis and information in the documents prepared by the government department, researchers at Tohoku Gakuin University sought additional data on which to base strategic recommendations. The data from qualitative interviews and a quantitative survey was gathered to provide a comparison of demand and supply perspectives. Yin [49] recommended the combination of qualitative and quantitative data to fully understand and describe a study environment. Two experienced industry professionals; female managers of Japanese traditional Inns situated in the Miyagi Zaō mountains area, were interviewed on 27 September 2018 and a questionnaire survey was conducted with the support of Department of Agriculture Forest and Tourism of the Zaō town government. Drawing on the work of Gomezelj and Mihalič’s [21] and Zhou et al. [23], a list of TDC elements was submitted to the Zaō town government. Following discussions held with government officials, it was decided to retain elements that reflected the characteristics of Miyagi Zaō and were appropriate to the Japanese tourism context. Since competitiveness is a relative measurement and consistent with the approach used by Gomezelj and Mihalič [21], respondents were required to judge five tourism destinations that compete with the Miyagi Zaō mountains area. Respondents were asked to score twenty-six TDC elements using a five-point Likert scale (1 = well below average, 3 = average, 5 = well above average).
The survey sought to gather data from visitors (demand side) and local company managers (supply side). The Zaō town government allowed us to access visitors to complete the questionnaire at designated places in 2017; at the public spa facility on 15 October and at a local festival on 29 October. Trained undergraduate students, majoring in business administration and accounting, were deployed to distribute the questionnaires and 144 were successfully completed. Due to privacy policies, our access to the list of local companies held by the government was restricted. Thus, government officers were asked to select tourism-related local companies such as hotels, restaurants, and tourism attractions from the list and to distribute 150 questionnaires to those companies. Government regulations prohibited the identification of individual businesses. Fifty-two questionnaires were returned from the companies, a response rate of 35%. The response rate (35%) from supply side is higher than Enright and Newton survey (16%) [12], but lower than Gomezelj and Mihalič survey (41%) [21].

6. Respondent Profile

The visitor profile was well balanced in terms of gender but the proportion of males in the business sample was larger than females (Table 3). This reflects the gender distribution in Japanese business society [50]. The largest proportion of visitors was in their sixties which is to be expected as this age group represents a large segment of the Japanese tourist market. They are identified as active seniors; older people with both purchasing power and spare time to travel. The respondents of local companies were concentrated in the fifties to sixties age group which suggests that the questionnaire may have been completed by senior managers. Most visitors came from within the Miyagi prefecture (76%), were on a day trip (84%) and had visited many times before (Table 4). The majority (59%) had visited six or more times. It is clear that the Miyagi Zaō mountains area mainly attracts repeat visitors on a day trip from the neighboring areas.

7. Findings

The industry managers who were interviewed suggested that a famous, local historical figure; a Samurai named Yukimura Sanada, should feature more prominently when developing new tourism products. It was also proposed that food-related events, street performances and Japanese Bon dance festivals should be developed as new tourism attractions. A diversification strategy was advocated, rather than one relying solely on agritourism.
The questionnaire survey found that, among visitors, Sendai was considered to be the main competitor of the Miyagi Zaō mountains (Table 5). Sendai is the largest city in the Tōhoku region with a population of one million. It attracts approximately 22 million visitors each year [43]. It has a wide range of shopping facilities, professional sports teams (baseball, basketball and soccer), cultural and historical attractions and hosts seasonal events. The industry managers considered the neighboring Yamagata prefecture that includes destinations such as Yamagata Zaō, Kaminoyama, Tendō, Yonezawa and so forth to be the main competitor. In third place, with both visitor and industry segments, was Matsushima Bay which has a reputation across the country as being among the top three locations in Japan for the most beautiful coastal scenery [51].
Since TDC research is essentially descriptive rather than analytic [5], this study, in common with those of Enright and Newton [12] and Gomezalj and Mihalič [21], calculated the means and standard deviations of TDC elements and conducted t-tests to determine whether there was a significant difference between visitors’ and company managers’ scores. As shown in Table 6, nature-based activities were awarded the highest scores and there was no significant difference between scores for visitors and industry representatives; 3.844 and 3.885 respectively. Both groups believed that nature-based resources offer the greatest competitive advantage for the Miyagi Zaō mountains area. Similarly, both groups ranked shopping facilities as the least competitive although the industry group gave significantly lower scores (2.607 and 1.981, p < 0.001).
Visitors perceived safety and security, hospitality and friendliness, cleanliness and value for money as the strongest TDC elements. The high score for safety and security is noteworthy as the survey was conducted only two years after the warning about a likely volcanic eruption. This suggests that such warnings may not have a long-term impact on the appeal of the region. Only eight of the twenty-six items received scores lower than 3.0 by visitors. In addition to shopping facilities, they were well-known landmarks (2.769), exciting experience from adventures (2.817), availability of activities for children (2.831), interesting architecture (2.875), accessibility (2.974), local transportation efficiency (2.975) and facilities to interact (2.984).
The sample of company managers, representing the supply side, gave lower scores for destination competitiveness than the visitor sample. The difference was significant for many of the items especially for hospitality and friendliness, value for money of trip, variety and quality of restaurants and availability of tourist information. Relative to visitors, the company managers seem to underestimate the destination’s resources and their own capabilities to serve visitors. From both the demand and supply perspectives, well-known landmarks (2.769 and 2.118), exciting experience (2.817 and 2.24), availability of activities for children (2.831 and 2.118), interesting architecture (2.875 and 2.059), accessibility to destination (2.974 and 2.615) and facilities to interact (2.984 and 2.462) received low scores. These elements were perceived as weaknesses of the Miyagi Zaō mountains area by both sides.
In Table 6, the consonance and dissonance of evaluations between demand and supply sides are evident. The tendency for local industry representatives to undervalue the competitiveness of their destination compared with visitors’ evaluations is reinforced. In Table 7, a comparison is made between the findings of the survey and the self-categorization of strengths and weaknesses by the Zaō town government officials (as shown in Table 2). The consistently high scores for nature provides a strong foundation for strategy formulation but it is also important to note the variations in the evaluations. While the government representatives considered accessibility to the destination as a strength, visitors gave it a lower score. In contrast, visitors gave a relatively high evaluation for the quality of accommodation but the government perceived visitors to have a low level of satisfaction with these services. It is noteworthy that the TDC framework helps clarify differences between visitors (demand side) and local companies (supply side) and the perceptions among government officials. This insight is of considerable value for strategy formulation.

8. Discussion and Conclusion

8.1. Discussion: Roles of TDC Survey in Tourism Strategy

Tourism has the potential to energize the social and economic life of regions and may be particularly important in places such as the Miyagi Zaō mountains, which face problems associated with natural disasters, population decline, and an aging society. These were identified as threats to sustainability by officials of the town government [52]. However, for tourism to be successful, the destination must be competitive in order to attract the type of tourists who will make the desired contribution to local life. Appropriate development strategies must be based on a clear understanding of the region’s capabilities and the resources that offer a competitive advantage. As proposed by Kovačević et al., the TDC conceptual model can be “adapted to assess the current state of tourism industry in a particular area” and used to enable “a systematic approach to revealing the region’s strengths and weaknesses, and ways to improve its competitiveness” (p. 121) [4]. Information generated by a TDC survey can be used to assist strategy formulation and decision-making. With local governments facing budget and human resource restrictions, effective resource allocation has become essential.
The findings from the study described in this paper help create a shared understanding of competitiveness among tourism stakeholders—visitors, local companies, and government officials—making tourism strategy formation more feasible by mitigating conflicts among stakeholders [53]. Fragmentation and the diversified features of the tourism industry requires an explicit destination strategy based on shared objectives [54,55]. A TDC survey that incorporates demand and supply sides can help establish a common approach by identifying the range of perceptions about resource strengths and tourism capabilities. In the case of the study area, nature and nature-based activities were consistently identified as offering the strongest resource base. Therefore, it is proposed that the region should develop a “nature-centric tourism development strategy” for the Miyagi Zaō mountain areas. As Ratten et al. pointed out, “nature or ecotourism is a growing segment and a further distinct subcategory of tourism” [56] (p. 2). Consistent with the objectives of the Zaō town government, the proposed strategy offers the potential to increase the number of overnight visitors by promoting the region as an ecotourism destination.

8.2. Managerial Implication

The study also identified support for diversification, as suggested by the managers of the Japanese traditional inns. This could help spread the spatial pattern of tourists, reducing the focus of visitor interest at a small number of locations. The level of concentration had been identified as a weakness by officials of the town government. Product diversification can take advantage of opportunities to incorporate historical and cultural assets, offering scope for creativity and products that reflect a harmonious combination of local resources. It also adds tactical flexibility, making it possible to promote products to different market segments. This diversification within the nature-centric strategy offers the opportunity for the development of events that are related with the nature of the Zaō mountains. Similarly, local stories should be narrated about the history of nature, the local ecology, and the volcano of Zaō mountains. The nature-centric strategy and diversification can help create a distinctive unified destination image and a value proposition of Miyagi Zaō mountains area that has wide local support and can be presented to potential visitors, making the destination marketing more effective [36].
It is noteworthy that some recent TDC studies [25,26,27,28] have focused on the coexistence and interconnectedness between competitiveness and sustainability of tourism destinations. Protecting the environment is fundamental to sustainability and protecting the region’s natural resources would be a key objective of the nature-centric tourism development strategy. If the tourism industry and town government recognize the unique nature and ecology of Miyagi Zaō mountains as valuable resources to attract potential visitors and generate new jobs and revenue for the region, the connectivity between natural capital and economic capital is created [57,58]. It is commonly understood that forests must be managed and those that lose economic value become neglected and then cause natural disasters, such as large-scale landslides, in Japan. It is also important to respond to negative tourism impacts since overcrowding, imprudent behaviours of visitors, and traffic congestion can harm the environment and ecology of Zaō mountains area. Government departments, working with the tourism industry must carefully monitor and control the repercussions of nature-centric tourism development [59]. Nevertheless, the findings of this study conclude that a well-managed nature-centric tourism development strategy would contribute to the sustainability of both the local society and nature of the Miyagi Zaō mountains area.

8.3. Theoretical Contribution, Limitation and Future Research

The study has demonstrated that the TDC model is not just an academic concept, as it can make a practical contribution. As Kovačević et al. pointed out, application of the TDC model to small and rural destinations reveals the effectiveness or limitation of the model and helps contribute to the model’s further development [4]. Informed strategies, based on the model’s implementation, can support local environments; both ecological and social. However, the latter will be best achieved by reflecting the needs of host communities and it is suggested that future research investigate the perceptions of local residents. Inadequate inclusion of their views is a weakness of the Miyagi Zaō study. The behavior of local residents, especially their hospitality and the atmosphere they create, are integral to the destination experience. It can offer a competitive advantage. TDC studies that include resident perceptions have been scarce. It is important that future TDC research includes resident perceptions to improve tourism strategies and make development compatible with local attitudes about sustainability.

Author Contributions

Conceptualization, T.M., G.B., R.H. and K.M; Methodology, T.M.; Questionnaire design, T.M. and K.M.; Software manipulation, K.M. and T.M.; Validation, R.H. and G.B.; Formal analysis, T.M. and K.M.; Investigation, T.M. and K.M.; Data curation in the field, T.M. and K.M.; Interview with managers; T.M. and K.M.; Interview with Zaō town government officers; T.M., K.M. and R.H.; Writing—Original draft preparation, T.M.; Writing—Review and editing, T.M. and G.B.; Visualization, T.M.; Supervision, G.B. and R.H.; Project administration, T.M.; Funding acquisition, T.M. All authors have read and agreed to the published version of the manuscript.

Funding

The Japan Society for the Promotion of Science Grant-in-Aid for Scientific Research (C), 2018-2021 (Funding number: 18K11872) (Project leader: Takatoshi Murayama) and the Transcosmos Foundation Promotion Services for the Field of Academic and Scientific Technologies 2021–2022 (Project leader: Takatoshi Murayama) supported this research. We are grateful for the cooperation extended to us by the Zaō town government.

Institutional Review Board Statement

The statement is available on request. This research was approved by the Human Subject Research Committee of Tohoku Gakuin University.

Informed Consent Statement

According as the Japan Society for the Promotion of Science “For the Sound Development of Science-The Attitude of a Conscientious Scientist” (https://www.jsps.go.jp/j-kousei/data/rinri_e.pdf (accessed on 19 June 2022)), informed consent was obtained from all of subjects involved in this study. The procedure of informed consents in this study was approved by the Human Subject Research Committee of Tohoku Gakuin University.

Data Availability Statement

Available on request. However, personal profiles of respondents should be protected.

Conflicts of Interest

The authors declare no conflict of interest.

References

  1. Robinson, P.; Murray, A. Rural enterprise business development in the developed world. In Rural Tourism and Enterprise: Management, Marketing and Sustainability; Oriade, A., Robinson, P., Eds.; CABI: Oxfordshire, UK, 2017; ISBN 978-1-78064-750-0. [Google Scholar]
  2. Cronjé, D.F.; du Plessis, E. A review on tourism destination competitiveness. J. Hosp. Tour. Manage. 2020, 45, 256–265. [Google Scholar] [CrossRef]
  3. Dwyer, L.; Forsyth, P.; Rao, P. The price competitiveness of travel and tourism: A comparison of 19 destinations. Tour. Manag. 2000, 21, 9–22. [Google Scholar] [CrossRef]
  4. Kovačević, N.D.; Kovačević, L.; Stankov, U.; Dragićević, V.; Miletić, A. Applying destination competitiveness model to strategic tourism development of small destinations: The case of South Banat district. J. Destin. Mark. Manag. 2018, 8, 114–124. [Google Scholar]
  5. Crouch, G.I.; Ritchie, J.R.B. Tourism, Competitiveness, and Societal Prosperity. J. Bus. Res. 1999, 44, 137–152. [Google Scholar] [CrossRef]
  6. Mendola, D.; Volo, S. Building composite indicators in tourism studies: Measurements and applications in tourism destination competitiveness. Tour. Manag. 2017, 59, 541–553. [Google Scholar] [CrossRef]
  7. Hassan, S.S. Determinants of Market Competitiveness in an Environmentally Sustainable Tourism Industry. J. Travel Res. 2000, 38, 239–245. [Google Scholar] [CrossRef]
  8. Ritchie, J.R.B.; Crouch, G.I. The Competitive Destination: A Sustainable Tourism Perspective; CABI: Oxfordshire, UK, 2003; ISBN 978-1-84593-010-3. [Google Scholar]
  9. Dwyer, L.; Mellor, R.; Livaic, Z.; Edwards, D.; Kim, C. Attributes of Destination Competitiveness: A Factor Analysis. Tour. Anal. 2004, 9, 91–101. [Google Scholar] [CrossRef]
  10. Buhalis, D. Marketing the competitive destination of the future. Tour. Manag. 2000, 21, 97–116. [Google Scholar] [CrossRef] [Green Version]
  11. Kozak, M.; Rimmington, M. Measuring tourist destination competitiveness: Conceptual considerations and empirical findings. Int. J. Hosp. Manag. 1999, 18, 273–283. [Google Scholar] [CrossRef]
  12. Enright, M.J.; Newton, J. Tourism destination competitiveness: A quantitative approach. Tour. Manag. 2004, 25, 777–788. [Google Scholar] [CrossRef]
  13. Crouch, G.I. Destination Competitiveness: An Analysis of Determinant Attributes. J. Travel Res. 2011, 50, 27–45. [Google Scholar] [CrossRef]
  14. Porter, M.E. The Competitive Advantage of Nations; The Free Press: New York, NY, USA, 1990; ISBN 0-684-84147-9. [Google Scholar]
  15. Azzopardi, E.; Nash, R. A review of Crouch and Ritchie’s, Heath’s, and Dwyer and Kim’s models of tourism competitiveness. Tour. Anal. 2017, 22, 247–254. [Google Scholar] [CrossRef]
  16. Dwyer, L.; Kim, C. Destination Competitiveness: Determinants and Indicators. Curr. Issues Tour. 2003, 6, 369–414. [Google Scholar] [CrossRef]
  17. Mihalič, T. Environmental management of a tourist destination: A factor of tourism competitiveness. Tour. Manag. 2000, 21, 65–78. [Google Scholar] [CrossRef]
  18. Huybers, T.; Bennett, J. Environmental Management and the Competitiveness of Nature-Based Tourism Destinations. Environ. Resour. Econ. 2003, 24, 213–233. [Google Scholar] [CrossRef]
  19. Greenwood, V.A.; Dwyer, L. Consumer protection legislation: A neglected determinant of destination competitiveness? J. Hosp. Tour. Manage. 2015, 24, 1–8. [Google Scholar] [CrossRef]
  20. Boes, K.; Buhalis, D.; Inversini, A. Smart tourism destinations: Ecosystems for tourism destination competitiveness. Int. J. Tour. Cities 2016, 2, 108–124. [Google Scholar] [CrossRef]
  21. Gomezelj, D.O.; Mihalič, T. Destination competitiveness—Applying different models, The case of Slovenia. Tourism Manage. 2008, 29, 294–307. [Google Scholar] [CrossRef]
  22. Cracolici, M.F.; Nijkamp, P. The attractiveness and competitiveness of tourist destinations: A study of Southern Italian regions. Tour. Manag. 2008, 30, 336–344. [Google Scholar] [CrossRef]
  23. Zhou, Y.; Maumbe, K.; Deng, J.; Selin, S.W. Resource-based destination competitiveness evaluation using a hybrid analytic hierarchy process (AHP): The case study of West Virginia. Tour. Manag. Perspect. 2015, 15, 72–80. [Google Scholar] [CrossRef]
  24. Zehrer, A.; Smeral, E.; Hallmann, K. Destination Competitiveness—A Comparison of Subjective and Objective Indicators for Winter Sports Areas. J. Travel Res. 2017, 56, 55–66. [Google Scholar] [CrossRef]
  25. Seguí-Amortegui, L.; Clemente-Almendros, J.A.; Medina, R.; Gala, M.G. Sustainability and Competitiveness in the Tourism Industry and Tourist Destinations: A Bibliometric Study. Sustainability 2019, 11, 6351. [Google Scholar] [CrossRef] [Green Version]
  26. Cucculelli, M.; Goffi, G. Does sustainability enhance tourism destination competitiveness? Evidence from Italian Destinations of Excellence. J. Clean. Prod. 2016, 111, 370–382. [Google Scholar] [CrossRef]
  27. Goffi, G.; Cucculelli, M.; Masiero, L. Fostering tourism destination competitiveness in developing countries: The role of sustainability. J. Clean. Prod. 2019, 209, 101–115. [Google Scholar] [CrossRef]
  28. Martín-González, R.; Swart, K.; Luque-Gil, A.-M. Tourism Competitiveness and Sustainability Indicators in the Context of Surf Tourism: The Case of Cape Town. Sustainability 2021, 13, 7238. [Google Scholar] [CrossRef]
  29. Ansoff, I.; McDonnel, E. Implanting Strategic Management, 2nd ed.; Prentice Hall: Hertfordshire, UK, 1990; ISBN 0-13-451915-9. [Google Scholar]
  30. Mintzberg, H.; Ahlstrand, B.; Lampel, J. Strategy Safari: A Guided Tour Through the Wilds of Strategic Management; The Free Press: New York, NY, USA, 1998; ISBN 0-684-84743-4. [Google Scholar]
  31. Rumelt, R.P. Good Strategy Bad Strategy: The Difference and Why it Matters; Profile Books: London, UK, 2017; ISBN 978-1-78125-617-6. [Google Scholar]
  32. Grant, R.M. Contemporary Strategy Analysis; Concepts, Techniques, Applications, 2nd ed.; Blackwell Publishing: Hoboken, NJ, USA, 1995; ISBN 1-55786-513-2. [Google Scholar]
  33. Weihrich, H. The TOWS matrix—A tool for situational analysis. Long Range Plan. 1982, 15, 54–66. [Google Scholar] [CrossRef]
  34. D’Angella, F.; Go, F.M. Tale of two cities’ collaborative tourism marketing: Towards a theory of destination stakeholder assessment. Tour. Manag. 2009, 30, 429–440. [Google Scholar] [CrossRef]
  35. Sheehan, L.R.; Ritchie, J.B. Destination Stakeholders Exploring Identity and Salience. Ann. Tour. Res. 2005, 32, 711–734. [Google Scholar] [CrossRef]
  36. Line, N.D.; Wang, Y. A multi-stakeholder market oriented approach to destination marketing. J. Destin. Mark. Manag. 2017, 6, 84–93. [Google Scholar] [CrossRef]
  37. Getz, D.; Page, S.J. Progress and prospects for event tourism research. Tour. Manage. 2016, 53, 593–631. [Google Scholar]
  38. The Location and Distance are Measured by Google Map. Available online: https://www.google.co.jp/maps/place/%E6%9D%B1%E4%BA%AC%E9%83%BD%E6%9D%B1%E4%BA%AC/@36.9903573,139.7782204,8.5z/data=!4m5!3m4!1s0x60188b857628235d:0xcdd8aef709a2b520!8m2!3d35.6804462!4d139.7690964 (accessed on 21 July 2020).
  39. Japan Meteorological Agency. Available online: https://www.data.jma.go.jp/svd/vois/data/sendai/212_Zaozan/212_history.html (accessed on 22 March 2022).
  40. The Map Is Based on Google Map. Available online: https://www.google.com/maps/@38.2557477,140.4960627,9.75z?hl=en (accessed on 21 July 2022).
  41. “The Vision of Zaō Town Population” Issued by the Zaō Town Government in November 2015 (Printed Material). Available online: https://www.town.zao.miyagi.jp/kurashi_guide/shisaku_machi/shisaku_machi/machihitoshigoto/sogo_senryaku.files/jinko.pdf (accessed on 19 July 2022).
  42. Miyagi Prefecture Government Statistics. Available online: https://www.pref.miyagi.jp/soshiki/sichouson/juuki-nenpou.html (accessed on 26 November 2021).
  43. Miyagi Prefecture Tourism Statistics. Available online: https://www.pref.miyagi.jp/soshiki/kankou/statistical.html (accessed on 25 March 2022).
  44. Zaō Town Government Statistics Website. Available online: https://www.town.zao.miyagi.jp/kurashi_guide/toukei/index.html (accessed on 25 March 2022).
  45. Miygi Zaō Sightseeing Navigation. Available online: https://miyagizao-navi.jp/en/list_en/ (accessed on 25 November 2021).
  46. Zaō Chō Kankō Bussan Kyōkai (Zaō Town Tourism and Product Association). Available online: https://www.zao-machi.com/stay_hotspring/ (accessed on 25 November 2021).
  47. Zaō Chō Kankō Bussan Kyōkai (Zaō Town Tourism and Product Association). Available online: https://www.zao-machi.com/gourmet_buy/ (accessed on 25 November 2021).
  48. Zaō Town Government (Zaō Town, Miyagi Prefecture, Japan). Tourism of Zaō Town: Strengthening the Competitiveness of Hot Spas and Tourism Industry of Zaō Region. 2017; Unpublished work. [Google Scholar]
  49. Yin, R. The Case Study Crisis: Some Answers. Adm. Sci. Q. 1981, 26, 58. [Google Scholar] [CrossRef] [Green Version]
  50. Hofstede, G.; Hofstede, G.J.; Minkov, M. Cultures and Organizations: Software of the Mind, 3rd ed.; McGraw-Hill: New York, NY, USA, 2010; ISBN 978-0-07-166418-9. [Google Scholar]
  51. Three Most Scenic Spot of Japan. Available online: https://www.matsushima-kanko.com/en/ (accessed on 25 March 2022).
  52. Department of Agriculture, Forest and Tourism of Zaō Town Government (Zaō Town, Miyagi Prefecture, Japan). Zaō Town Tourism Development: The Second Plan. Unpublished work. 2018. [Google Scholar]
  53. Getz, D.; Anderson, D.; Sheehan, L. Roles, issues, and strategies for convention and visitors’ bureaux in destination planning and product development: A survey of Canadian bureaux. Tour. Manag. 1998, 19, 331–340. [Google Scholar] [CrossRef]
  54. Bornhorst, T.; Ritchie, J.B.; Sheehan, L. Determinants of tourism success for DMOs & destinations: An empirical examination of stakeholders’ perspectives. Tour. Manag. 2010, 31, 572–589. [Google Scholar]
  55. Hankinson, G. Relational network brands: Towards a conceptual model of place brands. J. Vacat. Mark. 2004, 10, 109–121. [Google Scholar] [CrossRef]
  56. Ratten, V.; Braga, V.; Álvarez-Garćia, J.; Cruz, R. Tourism innovation: The role of technology, sustainability and creativity. In Tourism Innovation: Technology, Sustainability and Creativity; Ratten, V., Braga, V., Álvarez-Garćia, J., Cruz, R., Eds.; Routledge: New York, NY, USA, 2020; ISBN 978-0-367-07789-1. [Google Scholar]
  57. Gӧssling, S.; Hall, C.M.; Weaver, D.B. Sustainable tourism futures: Perspectives on systems, restructuring and innovations. In Sustainable Tourism Futures: Perspectives on Systems, Restructuring and Innovations; Gӧssling, S., Hall, C.M., Weaver, D.B., Eds.; Routledge: New York, NY, USA, 2009; ISBN 978-0-415-54225-8. [Google Scholar]
  58. Hall, C.M.; Gӧssling, S.; Scott, D. Tourism and sustainability: An introduction. In The Routledge Handbook of Tourism and Sustainability; Hall, C.M., Gӧssling, S., Scott, D., Eds.; Routledge: Oxon, UK, 2015; ISBN 978-1-138-07147-6. [Google Scholar]
  59. Zeng, L.; Li, R.Y.M.; Huang, X. Sustainable mountain-based health and wellness tourist destinations: The interrelationships between tourists’ satisfaction, behavioral intentions, and competitiveness. Sustainability 2021, 13, 13314. [Google Scholar] [CrossRef]
Figure 1. Location of the Miyagi Zaō Mountain Area [40]. Note: Sendai city and Matsushima Bay are regional destinations that compete with the Miyagi Zaō Mountains Area.
Sustainability 14 09124 g001
Figure 2. Number of People to Visit to and Lodge in the Miyagi Zaō Mountain Area. Drawn by the Authors Based on [41,43].
Sustainability 14 09124 g002
Table 1. Tourism Resources in the Miyagi Zaō Mountains Area.
Nature-Related Tourism Resources and AttractionsHistorical and Cultural Tourism AssetsSports, Tourist Attractions and Special EventsLocal Foods
  • Crater lake
  • Hot spas (Onsen in Japanese)
  • Zaō echo-toll road
  • Water falls
  • Mountain trekking
  • Alpine flora
  • Tree snow monsters
  • Kattamine shrine
  • Image of seated Buddha of 2.88 m high at Hōshōji temple
  • Old farmer house built in 1753
  • Historical story of Japanese Samurai
  • Skiing and snowboarding
  • Golfing, horse riding and fishing
  • Cow milking
  • Painting wooden Kokeshi doll
  • Pottery
  • Zaō fox village (fox-themed zoo)
  • Hill-climbing cycle race, street performance and Japanese Bon dancing festival
  • Pear, apple, blueberry and peach
  • Soba noodle
  • Zaō cheese,
  • Zaō Sōsei brand beef
  • Handmade sausage
  • Local vegetable pickles
Table 2. Self-Categorization of Strengths and Weaknesses by the Zaō Town Government. Based on [48] with the Permission of Zaō Town Government.
Strengths
  • Well-known Zaō mountains to attract nation-wide visitors.
  • Accessibility from the Sendai airport and bullet train stations.
  • Proximity to the large city, Sendai (a million population), and other tourism destinations, Matsushima bay, Yamagata Zaō and Fukushima Īzaka hot spring.
  • The capacity and variety of accommodation to fit various consumer segments (maximum four thousand lodgers per day)
  • Affluent nature, hot spring, historical and cultural resources that include underdeveloped ones.
  • Four seasons’ sceneries (cherry blossom, narcissus, crimson foliage, tree snow monster, Miyagi Zaō’s 36 beauty sceneries)
  • Food tourism based on agriculture in Miyagi Zaō and well-known dairy products, such as milk and cheese, of Zaō brand.
  • Natures, recreations and highlander resorts to satisfy various tourists’ needs.
  • Two skiing fields and snow resorts to solve seasonal demand fluctuation.
Weaknesses
  • Concentration of visitors on few specific places such as the crater lake and Tōggata hot spring. Poor circulation of visitors to other attractions.
  • Decline of visitors lodged in the Miyagi Zaō and came from other prefecture who generally spend much money.
  • Poor visitors’ satisfaction with tourism attractions and accommodation in the Miyagi Zaō due to insufficient hospitality compared to other tourism destinations.
  • Insufficient tourism services and products to motivate visitors to stay for two or more days in the Miyagi Zaō.
  • Few planned tours for visitors to travel around the southern region in Miyagi prefecture that includes the Miyagi Zaō.
  • Less-branded agricultural products, local foods and souvenirs.
  • Poor public transportation. Visitors must use their owned or rental cars.
  • Insufficient posture to accept foreign visitors and negative attitudes of accommodation to entertain them.
Table 3. Gender and Age of Respondents.
VisitorCompany
Number%Number%
GenderMale7049%3671%
Female7251%1529%
Total14251
Age10–1932%00%
20–292820%00%
30–392115%815%
40–492618%917%
50–592417%1733%
60–693524%1325%
70 or more64%510%
Total14352
Note: Given the privacy protection policy of The Japan Society for the Promotion of Science, respondents were not forced to answer all the survey questions, particularly those pertaining to personal profiles. Thus, three visitors and a company person did not indicate their gender and two visitors did not answer to their age.
Table 4. Number of Visits and Nights.
Number%
Number of visits1 visit1913%
2–3 visits2719%
4–5 visits129%
6 visits or more8359%
Total141
Place of residence (prefecture)Miyagi 10576%
Fukushima 86%
Yamagata86%
Tokyo43%
Chiba 32%
Saitama32%
Other five prefectures75%
Total138
Number of nights0 night (day trip)10984%
1 night2015%
2 nights11%
Total130
Note: The other five prefectures include Ibaraki (2), Nīgata (2), Akita (1), Kanagawa (1), Tottori (1). Given the privacy protection policy of The Japan Society for the Promotion of Science, respondents were not forced to answer all the survey questions, particularly those pertaining to personal profiles.
Table 5. Top Three Destinations Competing with the Miyagi Zaō MountainAreas.
VisitorCompany
1stSendai (63)Yamagata (66)
2ndYamagata (56)Sendai (44)
3rdMatsushima (49)Matsushima (26)
Note: Number of respondents in parentheses.
Table 6. Evaluation of TDC Elements from Demand (Vistor) and Supply (Company) Sides. The Items of Questionnaire Is Based on [21,23].
VisitorCompany
TDC elementsAveragesdAveragesddftp
Hospitality & friendliness3.5710.8392.8270.944169.0005.1340.000***
Safety & security3.5930.8282.9020.700109.7095.6110.000***
Cleanliness3.4960.8082.8850.646119.5085.2760.000***
Variety of activities to do3.1270.9742.4621.24479.7663.4230.00098***
Accessibility to destination2.9740.9422.6151.31675.1611.7750.080
Well-managed road & attraction signs3.0250.7692.5001.11172.8213.1010.003**
Availability of activities for children2.8310.9092.1181.013167.0004.5200.000***
Shopping facilities2.6070.8681.9811.18075.5413.4480.0009***
Good weather & climate3.0820.6993.1540.607172.000-0.6450.520
Value for money of trip3.4020.6762.9410.785171.0003.8910.000***
Road conditions3.1900.7222.8430.94675.6962.3470.022*
Variety & quality of accommodation3.2130.8262.7840.945171.0002.9830.003**
Variety & quality of restaurants3.0670.8312.4420.93887.5574.1470.000***
Value for money of shopping items3.3360.7452.9610.824171.0002.9260.004**
Local transportation efficiency2.9750.7692.3271.20069.6573.5920.0006***
Exciting experience from adventures2.8170.6862.2401.08066.0903.4940.0009***
Historic sites3.0410.8942.5201.03580.5343.1150.003**
Nature-based activities3.8440.9543.8850.855172.000-0.2630.793
Visitor’s accessibility to tourism attractions3.3980.8662.8821.17773.4362.8290.006**
Special events and festivals3.0440.8563.0001.02082.8380.2680.790
Well-known landmarks2.7690.7932.1181.10772.5643.8070.000***
Convenient location of destination3.1070.8612.5401.09275.1533.2760.002**
Availability of tourist information3.2180.7812.6350.929174.0004.2650.000***
Facilities to interact2.9840.7492.4621.03874.6423.2810.002**
Interesting architectures2.8750.8362.0591.12174.6684.6770.000***
Dedicated tourism attractions3.3610.8822.9811.29172.1131.9380.057
*** p < 0.001, ** p < 0.01, * p < 0.05, † p < 0.10.
Table 7. Strengths and Weaknesses of Resources and Assets Based on the TDC Analysis and Self-Categorization of the Zaō Town Government.
Visitor (from Table 6)Local Company (from Table 6)In Tourism Strategy of the Zaō Town Government (from Table 2)
Strengths (3 points or more)
  • Hospitality
  • Safety
  • Cleanliness
  • Variety of activities to do
  • Road & attraction signs
  • Good weather
  • Value for money of trip
  • Road condition
  • Variety & quality of accommodation
  • Variety & quality of restaurants
  • Value for money of shopping items
  • Historic site
  • Nature-based activities
  • Visitor’s accessibility to attractions
  • Special events
  • Convenient location
  • Tourist information
  • Dedicated tourism attractions
  • Good weather
  • Nature-based activities
  • Special events
  • Well-known Zaō mountain
  • Nature
  • Accessibility
  • Food
  • Winter resort
Weaknesses (Less than 3 points)
  • Accessibility to destination
  • Availability of activities for children
  • Shopping facilities
  • Local transportation efficiency
  • Exciting experience from adventure
  • Well-known landmarks
  • Facilities to interact
  • Interesting architecture
  • Hospitality
  • Safety
  • Cleanliness
  • Variety of activities to do
  • Road & attraction signs
  • Value for money of trip
  • Road condition
  • Variety & quality of accommodation
  • Variety & quality of restaurants
  • Value for money of shopping items
  • Historic site
  • Visitor’s accessibility to attractions
  • Convenient location
  • Tourist information
  • Dedicated tourism attractions
  • Accessibility to destination
  • Availability of activities for children
  • Shopping facilities
  • Local transportation efficiency
  • Exciting experience from adventure
  • Well-known landmarks
  • Facilities to interact
  • Interesting architecture
  • Concentration on few tourism spots
  • Decline of visitors lodged
  • Poor satisfaction with attractions and accommodation
  • Insufficient tourism service and product for visitors to stay for many days
  • Few planned tours to circulate the area
  • Less-branded agricultural products
  • Poor public transportation
  • Insufficient posture to accept foreign visitors
Publisher’s Note: MDPI stays neutral with regard to jurisdictional claims in published maps and institutional affiliations.

