Article

Improved Operation Strategy of the Pumping System Implemented in Timisoara Municipal Water Treatment Station

by
Ionel Aurel Drăghici
1,
Ionuţ-Daniel Rus
2,
Adrian Cococeanu
1,2 and
Sebastian Muntean
2,3,*
1
AQUATIM S.A., 300081 Timisoara, Romania
2
Faculty of Mechanical Engineering, University Politehnica Timisoara, Blvd. Mihai Viteazu, No. 1, 300222 Timisoara, Romania
3
Center for Fundamental and Advanced Technical Research, Romanian Academy—Timisoara Branch, Blvd. Mihai Viteazu, No. 24, 300223 Timisoara, Romania
*
Author to whom correspondence should be addressed.
Sustainability 2022, 14(15), 9130; https://doi.org/10.3390/su14159130
Submission received: 23 May 2022 / Revised: 14 July 2022 / Accepted: 21 July 2022 / Published: 25 July 2022

Abstract

:
Water treatment stations (WTSs) provide drinking water to the community and are critical infrastructures of any village or city. The main energy consumption of WTSs is associated with the operation of the pumping units installed in the water supply stations (WSSs). The parameters of the pumping units installed in the WSSs are continuously adjusted during service to meet the requirements of the customers. Therefore, variable-speed pumping units (VSPUs) are feasible technical solutions implemented in WSSs. Several strategies combining VSPUs and constant-speed pumping units (CSPUs) have been developed to operate in WSSs. A technical solution with four pumping units (two VSPUs and two CSPUs) is implemented in Timisoara pumping station No. 1 (TPS1) in the Bega municipal water treatment station (MWTS). The layout of TPS1 is detailed, and its energy consumption from the budget of the Bega MWTS is quantified. The operation strategy with four pumping units selected in TPS1 is investigated. The number of hours in service of each pumping unit and the total operating time of all pumping units in the last six years are examined. The specific power consumption associated with the operation of the pumping units installed in TSP1 is detailed. The failure incidents of the pumping units counted in service are enumerated and correlated with the operating conditions of the pumping units. A new strategy developed for the operation of the pumping units installed in TPS1 is proposed to better adapt to the operating conditions, improving the specific power consumption as well as diminishing the failure incidents. The new operation strategy is presented and assessed based on the data acquired from TPS1 over one year. The conclusions and the lessons learned in this case study are drawn in the last section.

1. Introduction

The annual energy consumption of all pumps (constant- and variable-flow applications) was 225 TWh in 2015 [1]. Drinking-water processes and wastewater activities account for 3–4% of energy consumption in the U.S. [2]. The energy consumption of the water sector is about 3.5% of the total EU budget [3]. The estimated total energy consumption of the water sector is projected to be 253 TWh/year in 2025 [1], with an increase of 12.5% over a decade.
The above data clearly show that the activities associated with the water treatment processes and drinking-water supply activities require high energy consumption. Based on market research and data from the industry for constant- and variable-flow applications, it has been determined that a significant part of clean-water-pump application is for variable flow. However, the number of pumps installed in the water sector with variable-speed drive (VSD) is still limited [1]. Therefore, there would be a large energy-saving potential if VSD pumps were implemented in applications with variable flow.
Drinking-water supply systems (DWSSs) are adapted to the geographic conditions and the requirements of each city. Therefore, DWSSs are uniquely developed and implemented in each city. Commonly, DWSSs include water treatment stations (WTSs), booster pumping stations, storage tanks/reservoirs, and drinking-water distribution systems (e.g., tunnels, aqueducts or pipelines, siphons, valves) [4]. A few researchers have developed methods for optimizing municipal drinking-water distribution networks considering different criteria, but they applied them to hypothetical cases [5]. A literature survey revealed several investigations that have analyzed drinking-water distribution systems, taking into account the specific features of each case [6,7,8]. The application of multiple criteria (e.g., the financial constraints associated with operational and maintenance costs, the minimization of water residence time, maintaining positive water pressure to avoid contamination, and controlling the pressure in the water distribution network to maintain the hydraulic integrity) for the optimization of municipal drinking-water distribution networks requires taking into account the specific constraints for each case [9,10]. Mathematical models and numerical simulations deliver effective and feasible results to investigate the hydraulic integrity and water quality conditions of DWSSs [11,12,13]. These predictive capabilities are useful for detecting the integrity loss of DWSSs [4].
WTSs deliver drinking water to the community through supply systems. The major energy consumption of WTSs is associated with the operation of pumping units in the water supply system (WSS). The pumping units installed in the WSS consume up to 90% of the total energy [14,15]. The energy consumption depends upon the pumping-unit type (e.g., constant-speed pumping units (CSPUs) and variable-speed pumping units (VSPUs)) and the selected operation strategy [16]. A significant reduction in energy consumption can be achieved by combining variable-speed pumping units (VSPUs) and constant-speed pumping units (CSPUs) in the operation strategy of WSSs. A remarkable reduction in energy consumption through the pumping units installed in the WSS of Milan city has been reported by Castro-Gama et al. (2017) [17].
The purpose of the investigation conducted in our research study is to select a strategy with reduced operating and maintenance costs for installed pumping units in the water sector. An improved operation strategy for pumping units is developed based on an in-depth analysis of the available infrastructure and water treatment processes conducted in 2019 and then implemented in September 2020 in an infrastructure with four pumping units (two VSPUs and two CSPUs) available in Timisoara pumping station No. 1 (TPS1) in the Bega municipal water treatment station (MWTS). The analyzed data collected in 2021 from the pumping units installed in TPS1 highlight a decrease in operating and maintenance costs.
An overview of the drinking-water supply system and the water treatment stations available in Timisoara city is detailed in Section 2. The layout of TPS1 is presented, highlighting its contribution to the Bega MWTS. The specific energy consumption associated with the operation of the pumping units installed in TSP1 is detailed. Two specific energy consumption indicators (ECIs) are determined to assess the performance of TSP1. Both old and new operating strategies for the four pumping units selected in TPS1 are examined in Section 3. The old operation scenario of the pumping units installed in TSP1 is investigated, revealing its limitations. Then, a new strategy is developed and implemented for the operation of the pumping units installed in TPS1 to better adapt to the operating conditions, improving the specific energy consumption as well as diminishing the failure incidents. The new operation strategy is assessed based on the data acquired from TPS1. The number of hours in service in the last six years for each pumping unit and the total time for all pumping units are analyzed in Section 4. The failure incidents of the pumping units counted in service are enumerated and correlated with the operating conditions of the pumping units. The conclusions and the lessons learned in this case study are drawn in the last section.

2. Drinking-Water Supply System (DWSS) of Timisoara City

At the beginning of the 20th century, the water source for Timisoara city was groundwater captured from deep drilled wells. The water supply infrastructure of Timisoara city was designed and developed by the technical service of the mayor’s office under the coordination of engineer Stan Vidrighin. The groundwater source was supplemented with treated water from the Bega River starting with the industrial development of Timisoara city in the second part of the last century [18]. The first development of the surface water treatment station (denoted WTS2), which took water from the Bega River with a designed capacity of 0.12 m3/s, was carried out at the end of 1959. Several extensions of the WTS2 capacity have been successively implemented: 0.3 m3/s in 1965 and 0.48 m3/s in 1976. A new surface-water treatment station (denoted WTS4) with a capacity of 0.9 m3/s was put into operation in 1982 in the same location as WTS2 [18]. The WTS4 capacity was expanded to 1.24 m3/s in 1994. As a result, a maximum capacity for both surface-water treatment plants (WTS2 + WTS4) of 1.72 m3/s was reached.
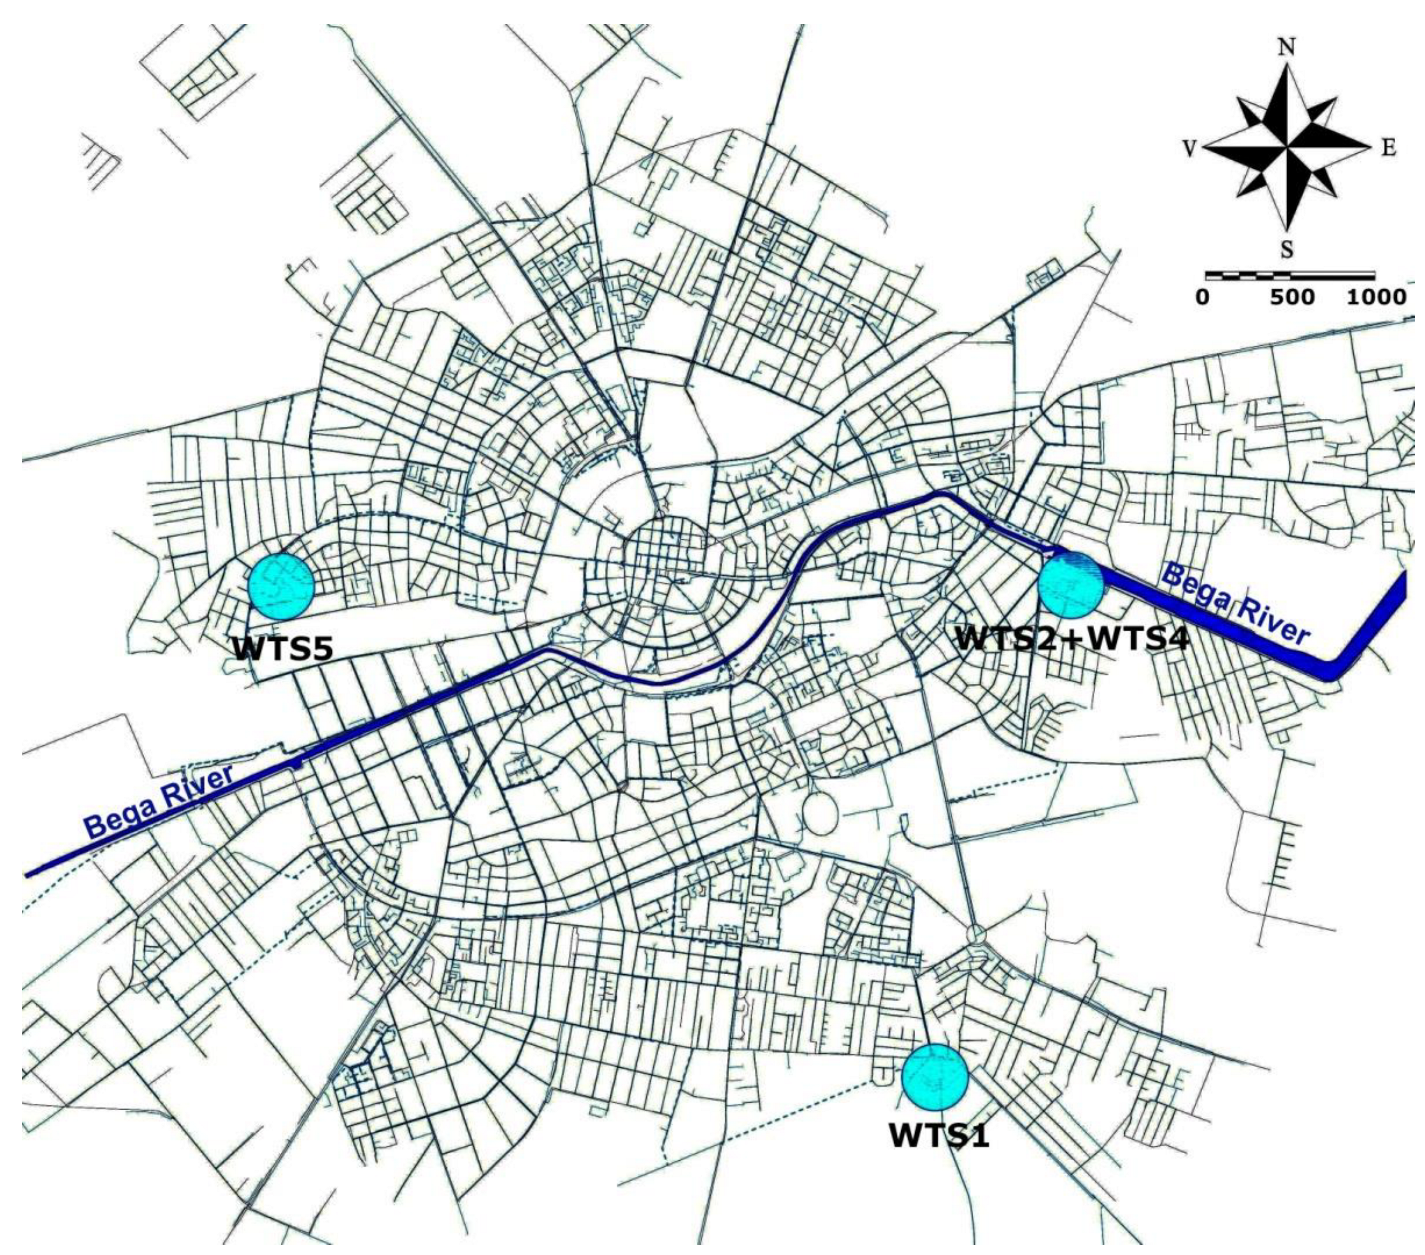
Nowadays, the drinking-water supply system in Timisoara city is a combination of two sources: WTS2 and WTS4 deliver up to 72% of surface water from the Bega River and the rest from groundwater is provided by WTS1 (called Urseni WTS) and WTS5 (called Ronaţ WTS), as shown in Figure 1. Thus, the groundwater is an alternative and complementary source to the primary water surface source for Timisoara city. The water supply infrastructure of Timisoara city has been managed by the municipal company AQUATIM S.A. since 1991 [18].
The layout of the Bega MWTS (WTS2 + WTS4) of Timisoara city for surface water from the Bega River is given in Figure 2.
The water flow into the Bega MWTS is gravitational along the passage from the river intake to the TSP1 pumping station because it is installed below the Bega River water level (see Figure 2). The water settling stage takes place along this passage to the underground suction tank of the hydraulic pumping units installed in TPS1. Four hydraulic pumping units installed in TPS1 deliver water to the WTS2 and WTS4. Then, the water processed in WTSs is pumped into the DWSS of Timisoara city, as presented in Figure 1.
The energy consumption in the water treatment process of Bega MWTS (WTS2 and WTS4) for three years is shown in Figure 3. One can remark in this figure that around 50% of the energy is consumed in the water distribution pumping process and 33% of energy consumption is associated with the pumping process in TSP1. The energy consumption from 4% to 7% is accounted for by the sludge treatment process, while around 11% is related to other processes (e.g., household reagents, chlorination station, thermal power plant, workshop, and so on). In contrast, the energy consumption in the filtering processes is less than 2% of the total budget.
The volume of water pumped by TSP1 and treated by WTS2 and WTS4 from 2016 to 2021 is shown in Figure 4a. There was an increase in the volume of water pumped by TSP1 from 25.45 million m3 in 2016 to 28.18 million m3 in 2019. We would like to point out that this increase equates to 10% of the volume of pumped water. Moreover, the volume of water pumped by TSP1 in 2020 and 2021 was practically the same as in 2019. The energy consumption of the pumping units installed in TSP1 for the treatment of water volumes by WTS2 and WTS4 from 2016 to 2021 is shown in Figure 4b. As expected, the energy consumption of the pumping units installed in TSP1 increased with the volume of water processed. The energy consumption of the pumping units increased from 1.3 million kWh in 2016 to 1.51 million kWh in 2019, an increase of 16.3%. In 2020 and 2021 there was a 1% and 2% decrease in energy consumption compared to 2019.
The annual population equivalents (PE) for Bega MWTS (WST2 + WST4) are given in Figure 5 from 2016 to 2021. There is a monotonous increase in the population equivalents that is served by Bega MWTS every year. An average value of 290,000 population equivalents (PE) can be estimated for Bega MWTS.
Two specific energy consumption indicators (ECIs) are determined to assess the performances of TSP1. The first indicator is the specific energy consumption in relation to the volume of water pumped. The indicator ECIm3 is defined as the ratio between the annual energy consumption and the annual volume pumped by units installed in TSP1.
ECI m 3 kWh / m 3 = Energy   consumption   kWh / year Volume   of   water   pumped   m 3 / year
The second indicator ECIPE is defined as the ratio between the annual energy consumption and population equivalents (PE) served by pumping units installed in TSP1 [19]:
ECI PE kWh / PE / year = Energy   consumption   kWh / year Population   equivalents   PE
The ECIm3 indicator was calculated for each year from 2016 to 2021 using Equation (1) with the data included in Figure 4. The data obtained for the pumping units installed in TSP1 for the ECIm3 indicator are plotted in Figure 6. The minimum value of 0.0509 kWh/m3 of the ECIm3 indicator was reached in 2016, while the maximum value of 0.0548 kWh/m3 was reached in 2018. We noticed an improvement in the ECIm3 indicator of the specific energy consumption of the pumping process in TSP1 after 2018 by decreasing the indicator to 0.0535 kWh/m3 in 2019 and 2021, respectively to 0.0544 kWh/m3 in 2020. There was an improvement of up to 2% in specific energy consumption.
It is shown in Figure 3 that the energy consumption in TSP1 represents 33% of the energy consumption of the full process of Bega MWTS (WTS2 + WTS4). As a result, a range from 0.154 kWh/m3 to 0.166 kWh/m3 was obtained for the six years taken into account for the ECIm3 specific energy consumption indicator of the full water treatment process in the Bega MWTS. Benchmarking the energy consumption undertaken for selected regions in Europe shows that electricity consumption for water supply is in the range of 0.5–0.7 kWh/m3 in Germany, 0.2–0.6 kWh/m3 in Denmark, and 0.7–0.93 kWh/m3 in Sweden, with a median value of 0.76 kWh/m3 [20]. The range of the specific energy consumption indicator ECIm3 obtained for the Bega MWTS (WST2 + WST4) is near to the lower limit of the range 0.14 ÷ 0.71 kWh/m3 indicated by Vaccari et al. (2018) [19] for water treatment plants available in Italy with population equivalents larger than 100,000.
The ECIPE indicator is calculated using Equation (2) with the data included in Figure 4b and Figure 5 from 2016 to 2021. The data for the ECIPE indicator corresponding to the pumping units installed in TSP1 is shown in Figure 7. The minimum value of 4.57 kWh/PE/year of the ECIPE indicator was reached in 2016 while the maximum value of 5.19 kWh/PE/year was reached in 2019. We noticed an improvement in the ECIPE indicator of the specific energy consumption of the pumping process in TSP1 after 2019 with a decrease in the indicator to 5.11 kWh/PE/year in 2020 and 5.03 kWh/PE/year in 2021. There was an improvement in this specific energy consumption indicator in 2021 of over 3% compared to 2019.
The specific energy consumption indicator ECIPE of the full water treatment process in the Bega MWTS (WTS2 + WTS4) covers a range from 13.85 kWh/PE/year to 15.73 kWh/PE/year over the six years taken into account in our investigation. The range limits of the ECIPE indicator are determined based on the fact that the energy consumption in TSP1 represents 33% of the energy consumption of the whole process (see Figure 3). A literature survey led to a reference value for the ECIPE indicator corresponding to large water treatment stations (>100,000 PE), as follows: 18 kWh/PE/year for German water treatment stations [21], 20 ÷ 22.5 kWh/PE/year for northwest European water treatment stations [22], and 23 kWh/PE/year for Italian water treatment stations [19]. The maximum value of 15.73 kWh/PE/year determined for the full water treatment process in Bega MWTS (WTS2 + WTS4) was lower than the reference values specified in the literature. It can be concluded based on the specific indicators determined above that the energy consumption in Bega MWTS is in line with the international recommendations for large WTSs.
An in-depth analysis of the pumping process in TSP1 performed in 2019 led to the identification of limitations in the operation of the pumping units. A new operating strategy for TP1 pumping units was implemented in September 2020. The improvements in the reduced operating and maintenance costs due to the new operating strategy were quantified in 2021. The next section presents the two operating strategies (old and new) of the pumping units installed in TSP1.

3. Timisoara Pumping Station No. 1 (TPS1)

Layout of the TPS1

The water flow along the passage from the river intake to TSP is gravitational. The water settling stage takes place along this passage to the underground suction tank of the hydraulic pumping units installed in TPS1. This underground suction tank is made of concrete with a volume of around 160 m3 and the bottom is located at −3.55 m below ground level. Four DN 600 suction pipes are installed in the underground suction tank of the TPS1. These four pipes supply four hydraulic pump units (from P1 to P4) installed in TPS1 which deliver water to the WTS2 and WTS4 filters located approximately 10–12 m above ground level. Two DN600 valves are installed upstream and downstream of each hydraulic pump to allow for its maintenance operations. A DN800 butterfly valve installed on the discharge pipe ensures the interconnected or separate operation of the two WTSs. An electromagnetic flow meter and a butterfly valve are mounted on each water transport pipe of DN800 to WTS2 and WTS4 to monitor and adjust the flow rate delivered to the filters. From each discharge pipe the necessary water is taken for the turbidimeter and the residual chlorine analyzer is located in the automation panel in order to monitor water quality.
The value of the flow rate delivered by the pumping units in operation in TPS1 depends on the volumetric flow rate captured from the Bega River. The water level in the suction basin of the TPS1 is monitored by an ultrasonic level transducer. This water level is constantly compared with the water level recorded by the transducer level located on the Bega River. A warning signal is sent to the operator’s room when a level of 50 cm is exceeded. The pumps installed in TSP1 are switched off automatically for safety reasons when the minimum level in the suction tank drops to the level where there is a danger of sucking air and/or the risk of developing cavitation phenomena.
Two groups of two pumping units installed in TPS1 are supplied with electricity by two dry transformers of 1000 kVA 20/0.4 kV installed in two transformer cells located in the 20 kV power station. Each pumping unit is driven by a 90 kW/0.4 kV electrical motor. Each group of two hydraulic pumping units is controlled by a frequency converter that provides variable speed for one hydraulic pumping unit (VSPU) and a constant speed for the second one (CSPU). As a result, a technical solution with four pumping units (two VSPUs and two CSPUs) has been implemented in the Timisoara pumping station no. 1 (TPS1) of the Bega municipal water treatment station (MWTS). A SCADA system is installed to monitor and control the operation of the pumping units and the parameters of the water treatment process. The pumping units installed in TSP1 fulfill the EU regulation 2006/42/EC.
The P1 and P2 pumping units (marked with blue) are included in the group G1 while the P3 and P4 pumping units (colored with green) belong to the group G2, as shown in Figure 8a. Each pumping group (G1 and G2) is serviced by a frequency converter to ensure the variable speed operation of one of two available pumping units. Therefore, only one pumping unit in each group can be controlled with variable speed at the same time, Figure 8b. This means that the operation in each pumping group can be performed with a single pumping unit at a variable speed while the other pumping unit is stopped or operating at a maximum speed of 730 rpm. The pumping group (G1 or G2) supplies water towards two water treatment stations (denoted WTS2 and WTS4) (see Figure 2). The volumetric flow rates required for each WTS are different from one to another and vary throughout the day.
Since commissioning in 2011, the TSP1 operating procedure has been selected to pump with only one single group (e.g., G1), while the second group is in reserve (G2). This selection of pumping operation in TPS1 implies that the butterfly valve (BV1) located between the pumping groups (G1 and G2) is always opened (see Figure 9) to supply water to both WTS2 and WTS4. This operation procedure in TSP1 is called scenario no. 1, or the old operation strategy.
The performances (pumping head and power versus volumetric flow rate and speed) of the variable-speed pumping units (VSPUs) installed in TSP1 are plotted in Figure 10a while the main parameters are given in Table 1. The main parameters (e.g., speed, volumetric flow rate at best efficiency point, pumping head at best efficiency point and reference diameter) of the pumping units are selected from the manufacturer’s documentation [23]. Both the characteristic speed value nq ≈ 104 and the dimensionless specific speed value ν = 1.112 are determined according to IEC standard [24]. These values correspond to a mixed-type flow pump, Figure 10b.
In this case, the hydraulic parameters delivered by the pumping group in operation to each WTS are directly correlated with the losses along the hydraulic passage. In the normal operation of the TPS1 station, the discharge value delivered to WTS4 is higher than the value delivered to WTS2 due to the fact that the hydraulic losses along the passage to WTS4 are smaller than that to WTS2. Therefore, the hydraulic parameters required by WTS2 are the ones provided by the pumping group while the hydraulic parameters for WTS4 are controlled by the BV4 butterfly valve. The operating scenario changes when the hydraulic parameters required by WTS4 are modified due to the filtration system. In these cases, the discharge value delivered to WTS2 is higher than the value delivered to WTS4. Therefore, the hydraulic parameters required by WTS4 are the ones to be provided by the pumping group while the hydraulic parameters for WTS2 are controlled by the BV2 butterfly valve. This selection of operation of pumps from the same group in TPS1 has two major drawbacks: (1) part of the energy supplied by the pumping group is lost in the butterfly valves which are controlled to ensure the hydraulic parameters required by each WTS; and (2) several events have been recorded which resulted in the failure of various mechanical components of the hydraulic pump due to the operating conditions beyond the limits prescribed by the pump designer (see Section 4.2).
A new operating strategy for the pumping units installed in TSP1 has been developed based on in situ investigations conducted in 2019. The new operating strategy was implemented in TSP1 in September 2020 to better adapt to the operating conditions by improving specific energy consumption and reducing the failure incidences. The newer operating strategy for TSP1 pumping units is called scenario no. 2 and involves operation with the butterfly valve (BV1) closed, as in Figure 11.
In this scenario, the pumping group no. 1 serves the WTS4 and the pumping group no. 2 supplies water to the WTS2. In other words, one pumping unit (e.g., P1 or P2) corresponding to the G1 pumping group operates with variable speed to supply water to WTS4, and one pumping unit (e.g., P3 or P4) available to the G2 pumping group delivers water to WTS2. Each pumping unit independently adjusts its volumetric flow rate according to the requirements of each water treatment station. One pumping unit from each pumping group is in reserve in scenario no. 2. As a result, the energy losses from adjusting the butterfly valves in scenario no. 1 are eliminated in scenario no. 2. Part of this energy recovered through the implementation of scenario no. 2 in TSP1 can be found in the improved values of the specific energy consumption indicators (ECIm3 and ECIPE) for 2021. It is certain that the operating and maintenance costs due to failure incidents in the operation of the pumping units have decreased, as no incidents were reported in 2021. An analysis of the failure incidents in the operation of the pumping units installed in TSP1 can be found in Section 4.3.

4. Analysis of the Pumping Units Installed in TPS1 in Both Scenarios

4.1. Time Operation Analysis of the Pumping Units Installed in TPS1

The operating time corresponding to the pumping units P1 (light blue), P2 (blue), P3 (light green) and P4 (blue) from 2016 to 2021 are presented in Figure 12. The cumulative operating time in service for all pumping units is 1200 ± 250 h per month from 2016 to 2019, except for December 2018. It can be noticed that all four pumping units were in operation during this time. This means that the pumping groups were in successive operation. Water pumped to both WTS2 and WTS4 was provided with one or two pumping units available in a single group (e.g., G1). Then, the pump(s) in the other group (e.g., G2) were only operational when the first pumping group (G1) was stopped.
There has been an increasing trend in drinking-water consumption since May 2020 due to the SARS-CoV-2 pandemic. In particular, one can notice a cumulative operating time of the pumping units installed in TSP1 of over 1350 h every month in 2021, except for February and November.
The cumulative operating time in service per year of each pumping unit installed in TSP1 is shown in Table 2 (column marked with grey). The cumulative operating time per year of all pumps installed in TSP1 increased monotonically from 14,448 h in 2016 to 17,230 h in 2021. There was an increase in the cumulative operating time in service for all four pumps installed at TSP1 of 2782 h over the six years. The cumulative operating time per year of all pumping units installed in TSP1 computed as a percentage of the total available time is determined in the last column of Table 2. It can be noticed that the cumulative operating time per year for all pumps computed as a percentage from the total available time increased from 41.2% to 49.2% in last six years. We emphasize that this 8% represents the increase in the number of operating hours in the last six years for the pumps installed in TSP1 from the total available hours. The mean operating time for the last six years of all pumping units installed in TSP1 is 44%. This percentage value of 44% is slightly lower than the 50% taken into account at the design stage.
The cumulative operating time for each pumping unit installed in TSP1 in the last six years is presented in Table 2 (row marked with grey). As expected, each pumping unit installed in TSP1 had a different number of operating hours. It can be seen that the cumulative operating time in the last six years was shorter for pumping units no. 4 (18,522 h) and no. 1 (22,593 h) and higher for pumping units no. 3 (25,820 h) and no. 2 (25,676 h). It is noted that, in each pumping group, there was a pumping unit with a large number of operating hours (e.g., P2 in G1 and P3 in G2) and a pumping unit with a small number of operating hours (e.g., P1 in G1 and P4 in G2). Both pumping units with a large number of operating hours had a “quiet” operation being the first option in the selection of the operator. The “quiet” operation of the two pumping units was due to their central location in TSP1 (see Figure 8a).
The cumulative operating time of each pumping unit installed in TSP1 computed as a percentage of the total available time is determined in the last row of Table 2. It can be noticed that the cumulative operating time values for the two pumping units computed as a percentage of the total available time are 48.8% and 49.1% for P2 and P3, respectively. These percentage values around 49% are slightly lower than the 50% taken into account at the design stage.

4.2. Operating Conditions of the Pumping Units Installed in TSP1

Figure 8a shows that two pumping groups (G1 and G2) make up TSP1. It has already been underlined that a pumping group is equipped with two pumping units (e.g., P1 and P2 belong to G1, while P3 and P4 are part of G2). The pumping units installed in TSP1 are operated in two ways: (1) with a variable-speed pumping unit (VSPU) and (2) with a constant-speed pumping unit (CSPU), respectively.
The operation scenario no. 1 in TSP1 involves the variable-speed operation of one pumping unit within a pumping group while the butterfly valve (BV1) is open (see Figure 9b). This means that one single pumping group supplies water for both WTS2 and WTS4. The increase in water requirement for WTS2 and WTS4 over the volumetric flow rate provided by the pumping unit in operation is ensured by starting the second pumping unit available in the same pumping group. Operation with two pumping units installed in the same pumping group means operation with a variable-speed pump unit (VSPU) and a constant-speed pump unit (CSPU) because there is only one frequency converter for each pumping group. In this scenario, the volumetric flow rate balance between WTS2 and WTS4 is achieved by adjusting the butterfly valves (BV2 and BV4) installed on the pipes that supply them. In this scenario, the second pumping group is in reserve. Two shortcomings are associated with the operation of the pumping units in TSP1 in scenario no. 1: (1) the energy losses from adjusting the butterfly valves; and (2) the failure incidents in the operation of the pumping units that increase operating and maintenance costs.
A careful analysis of the operation of variable-speed pumping units (VSPUs) installed in TSP1 has been conducted. The pumping head curves H(Q) for variable-speed pumping units (VSPUs) installed in TSP1 are given in Figure 13.
This VSPU operation corresponds with both scenarios no. 1 and no. 2. The solid lines of the pumping head for six speed values (480 rpm (orange), 530 rpm (light blue), 575 rpm (magenta), 630 rpm (light green), 680 rpm (dark red), and the maximum value of 730 rpm (blue) recommended by the manufacturer are plotted based on the experimental data provided by the manufacturer for VSPU. The red stripe marked on Figure 13 corresponds to the VSPU maximum speed of the 780 rpm setup in the frequency converter to start the second pumping unit available in the same pumping group when operating in scenario no. 1. The red stripe marked in Figure 13 is no longer valid for scenario no. 2 due to the second pumping unit not starting. This is one of the main advantages of scenario no. 2.
In situ experimental investigations performed on three pumping units installed in TSP1 are marked with circle symbols in Figure 13. The curve for the hydraulic losses Hr(Q) corresponding to the hydraulic passage of each water treatment station (WTS) is determined with the butterfly valve closed (see BV1 in Figure 9b). Then, the hydraulic losses Hr(Q) associated with the hydraulic passage of WTS2 are determined with the pumping unit no. 3 (light green circle symbol O in Figure 13) and the pumping unit no. 4 (green circle symbol O in Figure 13), respectively. On the other hand, the hydraulic losses Hr(Q) corresponding to the hydraulic passage of WTS4 are experimentally obtained with the pumping unit no. 2 (blue diamond symbol in Figure 13) in the same operating conditions with the butterfly valve closed. Unfortunately, the determination of the hydraulic losses Hr(Q) corresponding to the hydraulic passage of WTS4 with the pumping unit no. 1 was not possible due to suction pressure sensor failure.
Each pumping unit (P3 or P4) in variable-speed operation delivers a volumetric flow rate value up to 0.55 m3/s at a maximum speed of 730 rpm for WST2. The P2 variable-speed pumping unit operation provides a volumetric flow value up to 0.6 m3/s at a maximum speed of 730 rpm for WST4. It is important to note that the same pump units deliver a 10% higher flow rate for WTS4 than WTS2. This is because the hydraulic passage associated with WTS4 is shorter than WTS2. As a result, the operation in scenario no. 1 with one pumping unit with variable speed (VSPU) or two pumping units available in the same pumping group (one pumping unit with constant speed (CSPU) and one pumping unit with variable speed (VSPU)), and the butterfly valve (BV1) in the open position, leads to the dissipation of part of the hydraulic energy by adjusting the butterfly valves (BV2/BV4) on the hydraulic passages of the water treatment stations (WTS2 and/or WTS4). In addition, the operation of pumping units at speed values higher than 730 rpm leads to issues that increase operating and maintenance costs.
Next, a deep analysis of the operation of variable-speed pumping units (VSPUs) together with constant-speed pumping units (CSPUs) is given. This combined operation of VSPUs together with CSPUs is specific to scenario no. 1. The pumping head curves H(Q) for VSPU + CSPU combined operation are given in Figure 14. The black solid line corresponds to CSPU operation at 730 rpm. The solid lines of the VSPU pumping head for six speed values (480 rpm (orange), 530 rpm (light blue), 575 rpm (magenta), 630 rpm (light green), 680 rpm (dark red), and a maximum value of 730 rpm (blue)) are plotted in combination with CSPU.
In situ experimental investigations conducted on combined operation P3 (VSPU) + P4 (CSPU) are marked with square symbols in Figure 14. The curve for the hydraulic losses Hr(Q) corresponding to the hydraulic passage of WTS2 is determined with the butterfly valve closed (see BV1 in Figure 9b). In situ experimental data determined for P3 and P4 under the VSPU operation plotted in Figure 13 is added with circle symbols O in Figure 14. Unfortunately, the determination of the hydraulic losses Hr(Q) corresponding to the hydraulic passage of WTS4 in P1 (VSPU) + P2 (CSPU) combined operation was not possible due to pressure sensor failure on the suction of pumping unit no. 1 (P1).
The parallel operation of P3 (VSPU) + P4 (CSPU) pumping units cover the volumetric flow rate range from 0.7 m3/s to 1.2 m3/s required for WST2 + WST4 operation in scenario no. 1. The volumetric flow rate range specified above is ensured by the operation of the pumping unit no. 3 (P3) on a speed range between 550 rpm and 730 rpm and the pumping unit no. 4 (P4) operates at a constant speed of 730 rpm.

4.3. Major Incidents Recorded in the Operation of the Pumping Units Installed in TPS1

The operation of the pumping units in TSP1 has been affected over time by incidents. Listed below are ten major incidents that affected the pumping units installed in TSP1 during the period 2016–2021 that have been taken into account in our analysis.
The distribution of major incidents on the pumping units installed in TSP1 is shown in Figure 15. The following distribution of major incidents is noted: P1—one incident in 2017; P2—two incidents in 2018 and 2020; P3—four incidents in 2016; and P4—three incidents in 2017, 2019 and 2020.
Three major incidents of single-stage pumping units installed in TSP1 are detailed below. First, the major failure of the mixed-flow-type impeller of the pumping unit no. 3 registered on 9 March 2016 is shown in Figure 16. This major failure corresponds to incident no. 3 in Table 3.
The impeller failure of pumping unit no. 3 recorded on 9 March 2016 was found in the vicinity of the trailing edge of the missing part of the blade (see Figure 16). We note that the impeller of these pump units was manufactured with stainless steel 316SS. The impeller was repaired but the cause of the incident has not yet been identified.
There have been several failures of ball bearings in the operation of the pumping units at TSP1 (see Figure 17). Wear and even breakage of the bearing balls was found when inspecting the bearing box after noises were heard in the operation of the pumping units. Operating at speeds higher than those recommended by the designer, eccentricities and shaft alignment deviations caused the pump bearings to overload. The implementation of scenario no. 2 in September 2020 eliminated the operation of pumping units with speeds higher than those recommended by the designer.
A small clearance (0.5–1 mm) between the shroud front of the impeller and the suction housing is recommended by the manufacturer to obtain minimum internal leakage from the high-pressure area (discharge flow at volute) of the pump to the low-pressure area (eye of the impeller). This clearance is controlled by adjusting the number of seals or the thickness of the sealed box gasket. The lateral loading of the impeller and the axial movement of the rotating assembly of the pump lead to wear on the front surfaces of the shroud impeller and the pump housing (see Figure 18). A new sealing kit is needed each time to fix problems of this type.
It is important to note that in 2021 no incidents were recorded in the operation of the pumping units. All the information and data included in this case study provide lessons regarding the service and maintenance activities for the pumping units, and offer valuable support for other cases in the water sector.

5. Conclusions

The paper focuses on the issues associated with the drinking-water infrastructure of large cities. The key elements of the water infrastructure corresponding to the drinking-water supply system and water treatment stations (MWTSs) of Timisoara city are presented. The Bega municipal water treatment station (MWTS) is considered as a case study for our investigation. The main components of the water treatment process included in the Bega MWTS are shown.
Two specific energy consumption indicators (ECIs) associated with water treatment processes from the Bega MWTS are determined. Both the ECIm3 and ECIPE indicators are determined for the Bega MWTS from 2016 to 2021, covering the pandemic period. The ECIm3 indicator corresponded to a range of 0.154 kWh/m3 to 0.166 kWh/m3 over the six years taken into account for the full process of the Bega MWTS. The maximum value of the ECIm3 specific energy consumption indicator for Bega MWTS corresponded to the reference value for water treatment plants with population equivalents larger than 100,000 available in Europe (e.g., Italy, Germany, Scandinavian countries).
It has been identified, based on recorded data from the Bega MWTS, that 83% of the energy consumption corresponds to the pumping activities (50% of the energy is consumed in the water distribution pumping process and 33% of the energy consumption is associated with the pumping process in TSP1). As a result, the ECIm3 indicator associated with the energy consumption in the pumping process in TSP1 is improved up to 2% in the last three years. The ECIPE indicator corresponding to the pumping units installed in TSP1 showed an improvement in 2021 of over 3% compared to 2019. This slight reduction in energy consumption was also due to the implementation of the new operating strategy of the pumping units installed in TSP1.
The number of hours in service for each pumping unit and the total time for all pumping units were examined for the last six years. It was determined that the cumulative operating time per year for all pumping units, computed as a percentage from total available time, has increased from 41.2% to 49.2%. It is emphasized that this 8% represents the increase in the number of operating hours in the last six years of the pumps installed in TSP1. The mean operating time over the last six years for all pumping units installed in TSP1 is 44%. This percentage value of 44% is slightly lower than the 50% taken into account at the design stage. It is noticed that there has been an increasing trend in drinking-water consumption since May 2020 due to the SARS-CoV-2 pandemic.
The layout of the TPS1 has been detailed, and its contribution to the Bega MWTS has been highlighted. A technical solution with four pumping units (two VSPUs and two CSPUs) is implemented in TPS1. This old operating strategy, labeled scenario no. 1, has been implemented in TSP1 since 2011. This operating procedure involves only one group in service, while the second group is in reserve. The selection of pumping operation in TPS1 implies that the butterfly valve (BV1) located between pumping groups G1 and G2 is always open and both water treatment plants (WTS2 + WTS4) are supplied by a single pumping group (with one or two pumping units). The failure incidents of the pumping units counted in service were enumerated and correlated with operating conditions. The main drawback of this operating scenario, identified over time, is the high maintenance and repair cost of the pumping units. It was identified that the high maintenance and repair costs of the pump units in this scenario are associated with their operation beyond the limit set by the manufacturer.
A new operating strategy, labeled scenario no. 2, was developed based on in situ investigations conducted in 2019. The new operating strategy was implemented in TSP1 in September 2020 to better adapt to in situ operating conditions, improving the specific power consumption as well as diminishing the failure incidents. The new operating strategy for TSP1 pumping units involves operation with the butterfly valve (BV1) closed. As a result, the pumping group G1 serves the WTS4 and the pumping group G2 supplies water to the WTS2. One pumping unit corresponding to the G1 pumping group operates with variable-speed drive to supply water to WTS4 and one pumping unit with variable-speed drive is available in the G2 pumping group to deliver water to WTS2. Each pumping unit independently adjusts its volumetric flow rate according to the requirements of each water treatment station it supplies. One pumping unit from each pumping group is in reserve in scenario no. 2. The energy losses from adjusting the butterfly valves in scenario no. 1 are not found in scenario no. 2. Therefore, it is expected that part of this energy recovered through the implementation of scenario no. 2 in TSP1 is found in the improved values of the specific energy consumption indicators (ECIm3 and ECIPE) for 2021. It is certain that the operating and maintenance costs due to failure incidents in the operation of the pumping units were decreased, as no incidents were reported in 2021. The lessons learned in this case study are useful for other cases in the water sector.
The AQUATIM Company operates a fleet of hundreds of hydraulic pumping units that cover a quite wide range of powers, from a few kilowatts to megawatts, installed in dozens of water treatment stations. Further work will focus on investigating the operating conditions of pumping systems available in the water treatment plants administrated by AQUATIM in order to reduce operating and maintenance costs using the lessons learned in this case study.

Author Contributions

Conceptualization, S.M.; methodology, S.M.; validation, I.A.D., I.-D.R., A.C. and S.M.; investigation, I.A.D., I.-D.R., A.C. and S.M.; resources, I.A.D., A.C. and S.M.; data curation, I.A.D., A.C. and S.M.; writing—original draft preparation, I.A.D., I.-D.R., A.C. and S.M.; writing—review and editing, I.A.D., A.C. and S.M.; supervision, S.M.; project administration, I.A.D. and S.M. All authors have read and agreed to the published version of the manuscript.

Funding

This research received no external funding.

Institutional Review Board Statement

Not applicable.

Informed Consent Statement

Not applicable.

Data Availability Statement

Not applicable.

Acknowledgments

The author affiliated with Romanian Academy—Timisoara Branch has been supported by the research program of Hydrodynamic and Cavitation Laboratory from Center for Fundamental and Advanced Technical Research.

Conflicts of Interest

The authors declare no conflict of interest.

References

  1. Maagøe, V.; Van Holsteijn en Kemna, B.V. Ecodesign Pump Review Study of Commission Regulation (EU) No. 547/2012 (Ecodesign Requirements for Water Pumps) Extended Report—Final Version; European Commission: Brussels, Belgium, 2018. [Google Scholar]
  2. U.S. Environmental Protection Agency. Strategies for Saving Energy at Public Water Systems, EPA report 816-F-13-004, EPA Office of Water. 2013. Available online: http://water.epa.gov/type/drink/pws/smallsystems/upload/epa816f13004.pdf (accessed on 20 July 2022).
  3. EURACTIV: How Europe Can Make Its Water Sector Energy Neutral. 2018. Available online: https://www.euractiv.com/section/energy-environment/opinion/how-europe-can-make-its-water-sector-energy-neutral/ (accessed on 20 July 2022).
  4. National Academies of Sciences, Engineering, and Medicine. Drinking Water Distribution Systems: Assessing and Reducing Risks; The National Academies Press: Washington, DC, USA, 2006. [Google Scholar] [CrossRef]
  5. McCormick, G.; Powell, R.S. Optimal Pump Scheduling in Water Supply Systems with Maximum Demand Charges. J. Water Resour. Plann. Manage. 2003, 129, 372–379. [Google Scholar] [CrossRef]
  6. Georgescu, A.-M.; Georgescu, S.-C.; Petrovici, T.; Culcea, M. Pumping stations operating parameters upon a variable demand, determined numerically for the water distribution network of Oradea. U.P.B. Sci. Bull. Ser. C 2007, 69, 643–650. [Google Scholar]
  7. Georgescu, S.-C. HBMOA applied to design a water distribution network for a town of 50000 inhabitants. U.P.B. Sci. Bull. Ser. D 2012, 74, 91–102. [Google Scholar]
  8. Georgescu, S.-C.; Georgescu, A.-M.; Madularea, R.A.; Piraianu, V.-F.; Anton, A.; Dunca, G. Numerical model of a medium-sized municipal water distribution system located in Romania. Procedia Eng. 2015, 119, 660–668. [Google Scholar] [CrossRef] [Green Version]
  9. Gullick, R.W.; LeChevallier, M.W.; Svindland, R.C.; Friedman, M.J. Occurrence of transient low and negative pressures in distribution systems. J. Amer. Water Work. Assoc. 2004, 96, 52–66. [Google Scholar] [CrossRef]
  10. Cromwell, J.; Nestel, G. ; Albani. R. Financial and Economic Optimization of Water Main Replacement Programs; AwwaRF: Denver, CO, USA, 2001. [Google Scholar]
  11. Lansey, K.E.; Boulos, P.F. Comprehensive Handbook on Water Quality Analysis for Distribution Systems; MWH Soft Pub: Pasadena, CA, USA, 2005. [Google Scholar]
  12. Panguluri, S.; Grayman, W.M.; Clark, R.M. Distribution System Water Quality Report: A Guide to the Assessment and Management of Drinking Water Quality in Distribution Systems; EPA Office of Research and Development: Cincinnati, OH, USA, 2005. [Google Scholar]
  13. Boulos, P.F.; Lansey, K.E.; Karney, B.W. Comprehensive Water Distribution Systems Analysis Handbook for Engineers and Planners, 2nd ed.; MWH Soft Pub: Pasadena, CA, USA, 2006. [Google Scholar]
  14. Electric Power Research Institute (EPRI). Water & Sustainability (Volume 4): U.S. Electricity Consumption for Water Supply & Treatment—The Next Half Century; Electric Power Research Institute (EPRI): Washington, DC, USA, 2002. [Google Scholar]
  15. Magagna, D.; Hidalgo González, I.; Bidoglio, G.; Peteves, S.; Adamovic, M.; Bisselink, B.; De Felice, M.; De Roo, A.; Dorati, C.; Ganora, D.; et al. Water—Energy Nexus in Europe; Publications Office of the European Union: Luxembourg, 2019; ISBN 978-92-76-03385-1. [Google Scholar] [CrossRef]
  16. Plappally, A.K.; Lienhard, V.J.H. Energy requirements for water production, treatment, end use, reclamation, and disposal. Renew. Sust. Energ. Rev. 2012, 16, 4818–4848. [Google Scholar] [CrossRef]
  17. Castro-Gama, M.; Pan, Q.; Lanfranchi, E.A.; Jonoski, A.; Solomatine, D.P. Pump scheduling for a large water distribution network. Milan, Italy. Procedia Eng. 2017, 186, 436–443. [Google Scholar] [CrossRef]
  18. Vlaicu, I.; Haţegan, I. Timisoara’s Water Supply System: History, Present and Perspectives; Brumar Publishing House: Timisoara, Romania, 2012. (In Romanian) [Google Scholar]
  19. Vaccari, M.; Foladori, P.; Nembrini, S.; Vitali, F. Benchmarking of energy consumption in municipal wastewater treatment plants—A survey of over 200 plants in Italy. Water Sci. Technol. 2018, 77, 2242–2252. [Google Scholar] [CrossRef] [PubMed]
  20. Ronen, P.; Jacobsen, B.N. Performance of Water Utilities beyond Compliance; EEA Technical report No 5 (Appendix 2); EEA: Brussels, Belgium, 2014. [Google Scholar]
  21. Baumann, P.; Roth, M. Senkung des Stromverbrauchs auf Kläranlagen, Leitfaden für das Betriebspersonal (Reduction of the Energy Consumption of WWTPs—Manual for Operators); Heft 4 (In German). DWA Landesverband Baden-Württemberg: Stuttgart, Germany, 2014. [Google Scholar]
  22. Torregrossa, D.; Schutz, G.; Cornelissen, A.; Hernández-Sancho, F.; Hansen, J. Energy saving in WWTP: Daily benchmarking under uncertainty and data availability limitations. Environ. Res. 2016, 148, 330–337. [Google Scholar] [CrossRef] [PubMed]
  23. Apex Fluid Engineering Ltd. Apex AMF Mixed Flow Pumps; Datasheet TCAMF-2001 Rev. 1; Apex Fluid Engineering Ltd.: Bristol, UK, 2003. [Google Scholar]
  24. International Electrotechnical Commision (IEC). Hydraulic Turbines, Storage Pumps and Pumps-Turbines Model Acceptance, International Standard IEC No. 60193, 2nd ed.; International Electrotechnical Commision (IEC): Lausanne, Switzerland, 1999. [Google Scholar]
Figure 1. Drinking-water supply system (DWSS) of Timisoara city together with locations of the water treatment stations (WTS): WTS2 and WTS4 (Bega MWTS) for surface water from the Bega River and WTS1 (Urseni WTS) and WTS5 (Ronaţ WTS) for groundwater.
Sustainability 14 09130 g001
Figure 2. Bega MWTS (WTS2 and WTS4) layout of Timisoara city for surface water collected from Bega River.
Sustainability 14 09130 g002
Figure 3. Energy consumption in the water treatment process of Bega MWTS (WTS2 + WTS4) for three years: (a) 2017; (b) 2019; (c) 2020.
Sustainability 14 09130 g003
Figure 4. (a) Annual volume of water pumped by TSP1 and treated by WTS2 and WTS4 from 2016 to 2021; (b) annual energy consumption of the pumping units installed in TSP1 from 2016 to 2021.
Sustainability 14 09130 g004
Figure 5. The evolution of the population equivalents (PE) from 2016 to 2021 for Bega MWTS (WST2 + WST4).
Sustainability 14 09130 g005
Figure 6. The specific energy consumption indicator ECIm3 (kWh/m3) from 2016 to 2021 for pumping units installed in TSP1.
Sustainability 14 09130 g006
Figure 7. Specific energy consumption indicator ECIPE (kWh/PE/year) from 2016 to 2021 for pumping units installed in TSP1.
Sustainability 14 09130 g007
Figure 8. Timisoara Pumping Station no. 1 (TSP1) equipped with four pumping units: (a) layout; (b) photo.
Sustainability 14 09130 g008
Figure 9. Layout of the TSP1 with two pumping units selected in one group (G1 or G2) in scenario no. 1. Butterfly valve BV1 is always opened while butterfly valves BV2 and BV4 are adjusted to control the volumetric flow rate required by WTS2 and WTS4: (a) panel view; (b) schematic view.
Sustainability 14 09130 g009
Figure 10. Variable-speed pumping unit (VSPU) installed in TSP1: (a) performance of the pumping units: pumping head and power vs. volumetric flow rate and speed; (b) photo of the pumping unit.
Sustainability 14 09130 g010
Figure 11. Layout of the TSP1 with two pumping units (one pumping unit from G1 and one pumping unit from G2) operating in scenario no. 2 implemented in September 2020.
Sustainability 14 09130 g011
Figure 12. In situ operating time in hours for the pumping units installed in TSP1: (a) 2016; (b) 2017; (c) 2018; (d) 2019; (e) 2020; (f) 2021.
Sustainability 14 09130 g012
Figure 13. Pumping head curves H(Q) for variable-speed pumping unit (VSPU) installed in TSP1 and the hydraulic losses Hr(Q) corresponding to the hydraulic passages of WTS2 (green circles) and WTS4 (blue diamond).
Sustainability 14 09130 g013
Figure 14. Pumping head curves H(Q) for combined variable-speed pumping unit (VSPU) together with a constant-speed pumping unit (CSPU) installed in TSP1 and the hydraulic losses Hr(Q) corresponding to the hydraulic passages of WTS4.
Sustainability 14 09130 g014
Figure 15. Major incidents encountered in service during 2016–2021 for the pumping units installed in TPS1.
Sustainability 14 09130 g015
Figure 16. Impeller failure of the pumping unit no. 3 on 9 March 2016.
Sustainability 14 09130 g016
Figure 17. Ball bearing failure of the pumping unit no. 2 on 9 October 2018.
Sustainability 14 09130 g017
Figure 18. Sealing failure of the pumping unit no. 4 on 9 October 2020.
Sustainability 14 09130 g018
Table 1. Main parameters of the pumping units installed in TSP1.
Parameters of the Pumping UnitSymbol (Unit)Value
Maximum speed n (rpm)730
Angular velocityω (rad/s)76.45
Volumetric flow rate at best efficiency pointQBEP (m3/s)0.694
Pumping head at best efficiency pointHBEP (m)10.5
Reference diameterDref = 2·Rref0.478
Characteristic speed n q = nQ BEP 1 2 / H BEP 3 4 (-)104.3
Discharge coefficient φ = Q BEP / π ω R ref 3 (-)0.212
Head coefficient ψ = gH / ω 2 R ref 3 (-)0.308
Dimensionless specific speed ν = 1 2 / ψ 3 4 (-)1.112
Table 2. Cumulative operating time in service for each pumping unit installed in TSP1.
Pumping Group G1G2
Year (Y)\Pumping Unit (P)P1P2P3P4Total Time/Y (h)Total Time/Y (%)
2016432842652931292414,44841.1
2017416544313243264714,48641.3
2018270326974725482714,95242.7
2019445343803311327615,42044.0
2020475034883327451016,07545.8
202121946415828333817,23049.2
Total time/P (h)22,59325,67625,82018,52292,61144.0
Total time/P (%)42.948.849.135.244.0
Table 3. Major incidents encountered in the service of the pumping unit installed in TSP1.
No.Pumping UnitDatePumping Unit Incident
1P315 January 2016Sealing leaks
2P323 February 2016Sealing leaks
3P39 March 2016Impeller failure, sealing leaks
4P34 April 2016Ball bearings failure
5P411 July 2017Ball bearings failure
6P19 October 2017Shaft failure
7P29 October 2018Ball bearings failure
8P421 June 2019Bearing heating
9P227 May 2020Bearing heating
10P49 October 2020Sealing leaks
Publisher’s Note: MDPI stays neutral with regard to jurisdictional claims in published maps and institutional affiliations.

