Abstract
Many scholars focus on China’s booming economy and its social impacts, while there is little attention regarding subjective well-being, especially after considering income and social capital. Therefore, the purpose of this paper was to examine the correlations between income, social capital and subjective well-being of western Chinese residents, basing on a representative comprehensive social survey. Several meaningful conclusions are shown below: (1) Western residents in China retain a relatively high degree of subjective well-being on average, and the mean value of subjective well-being for urban residents is slightly higher than that for rural residents; (2) there are regional and group differences in the influence of income and social capital on residents’ subjective well-being; and (3), although economic factors play a primary role in subjective well-being, the potential influence of non-economic factors cannot be ignored. This paper attempts to fill the gap in perspective regarding potential correlations between income, social capital, and subjective well-being.
1. Introduction
The extraordinary economic boom of China from 1980 to 2022 has garnered global notice. More specifically, in 2010, the total GDP of China surpassed that of Japan, making it the second largest economy in the world. Meanwhile, the per capita GDP of China reached $4382 [1], and the urbanization rate reached 49.90% [2]. Along with the tremendous economic development, Chinese people’s life quality improved dramatically as well. However, the subjective well-being (SWB) of Chinese residents still not very satisfying, more specifically, the average SWB of Chinese residents was even lower than that of several poor countries. According to the 2010 Gallup Global Happiness Survey results, only 12% of Chinese people were extremely satisfied with their living conditions, nearly 71% Chinese residents considered life difficult, and even more than 17% said they were miserable [3]. The United Nations released its 2013 Global Happiness Index Report, which ranked mainland China 93rd out of 156 countries and regions, placing Chinese residents in the bottom 25% of the world’s population in terms of SWB [4]. The World Value Survey consistently demonstrated an inverted U-shaped correlation between the income and SWB of Chinese residents. In other words, a considerable number of middle-income residents in China suffered sadness in their life. There is no evidence that China’s economic boom directly leads to significant SWB enhancements [5]. The complex relationship between the SWB and income of Chinese residents has also attracted the attention of scholars worldwide.
It is necessary to explore the SWB of citizens in western China for the following reasons: western China is characterized by a relatively small population, low mobility and low average income, compared to its southern counterpart. It is noteworthy that these three factors are associated with SWB. The transformation of Chinese society has further deepened this gap.
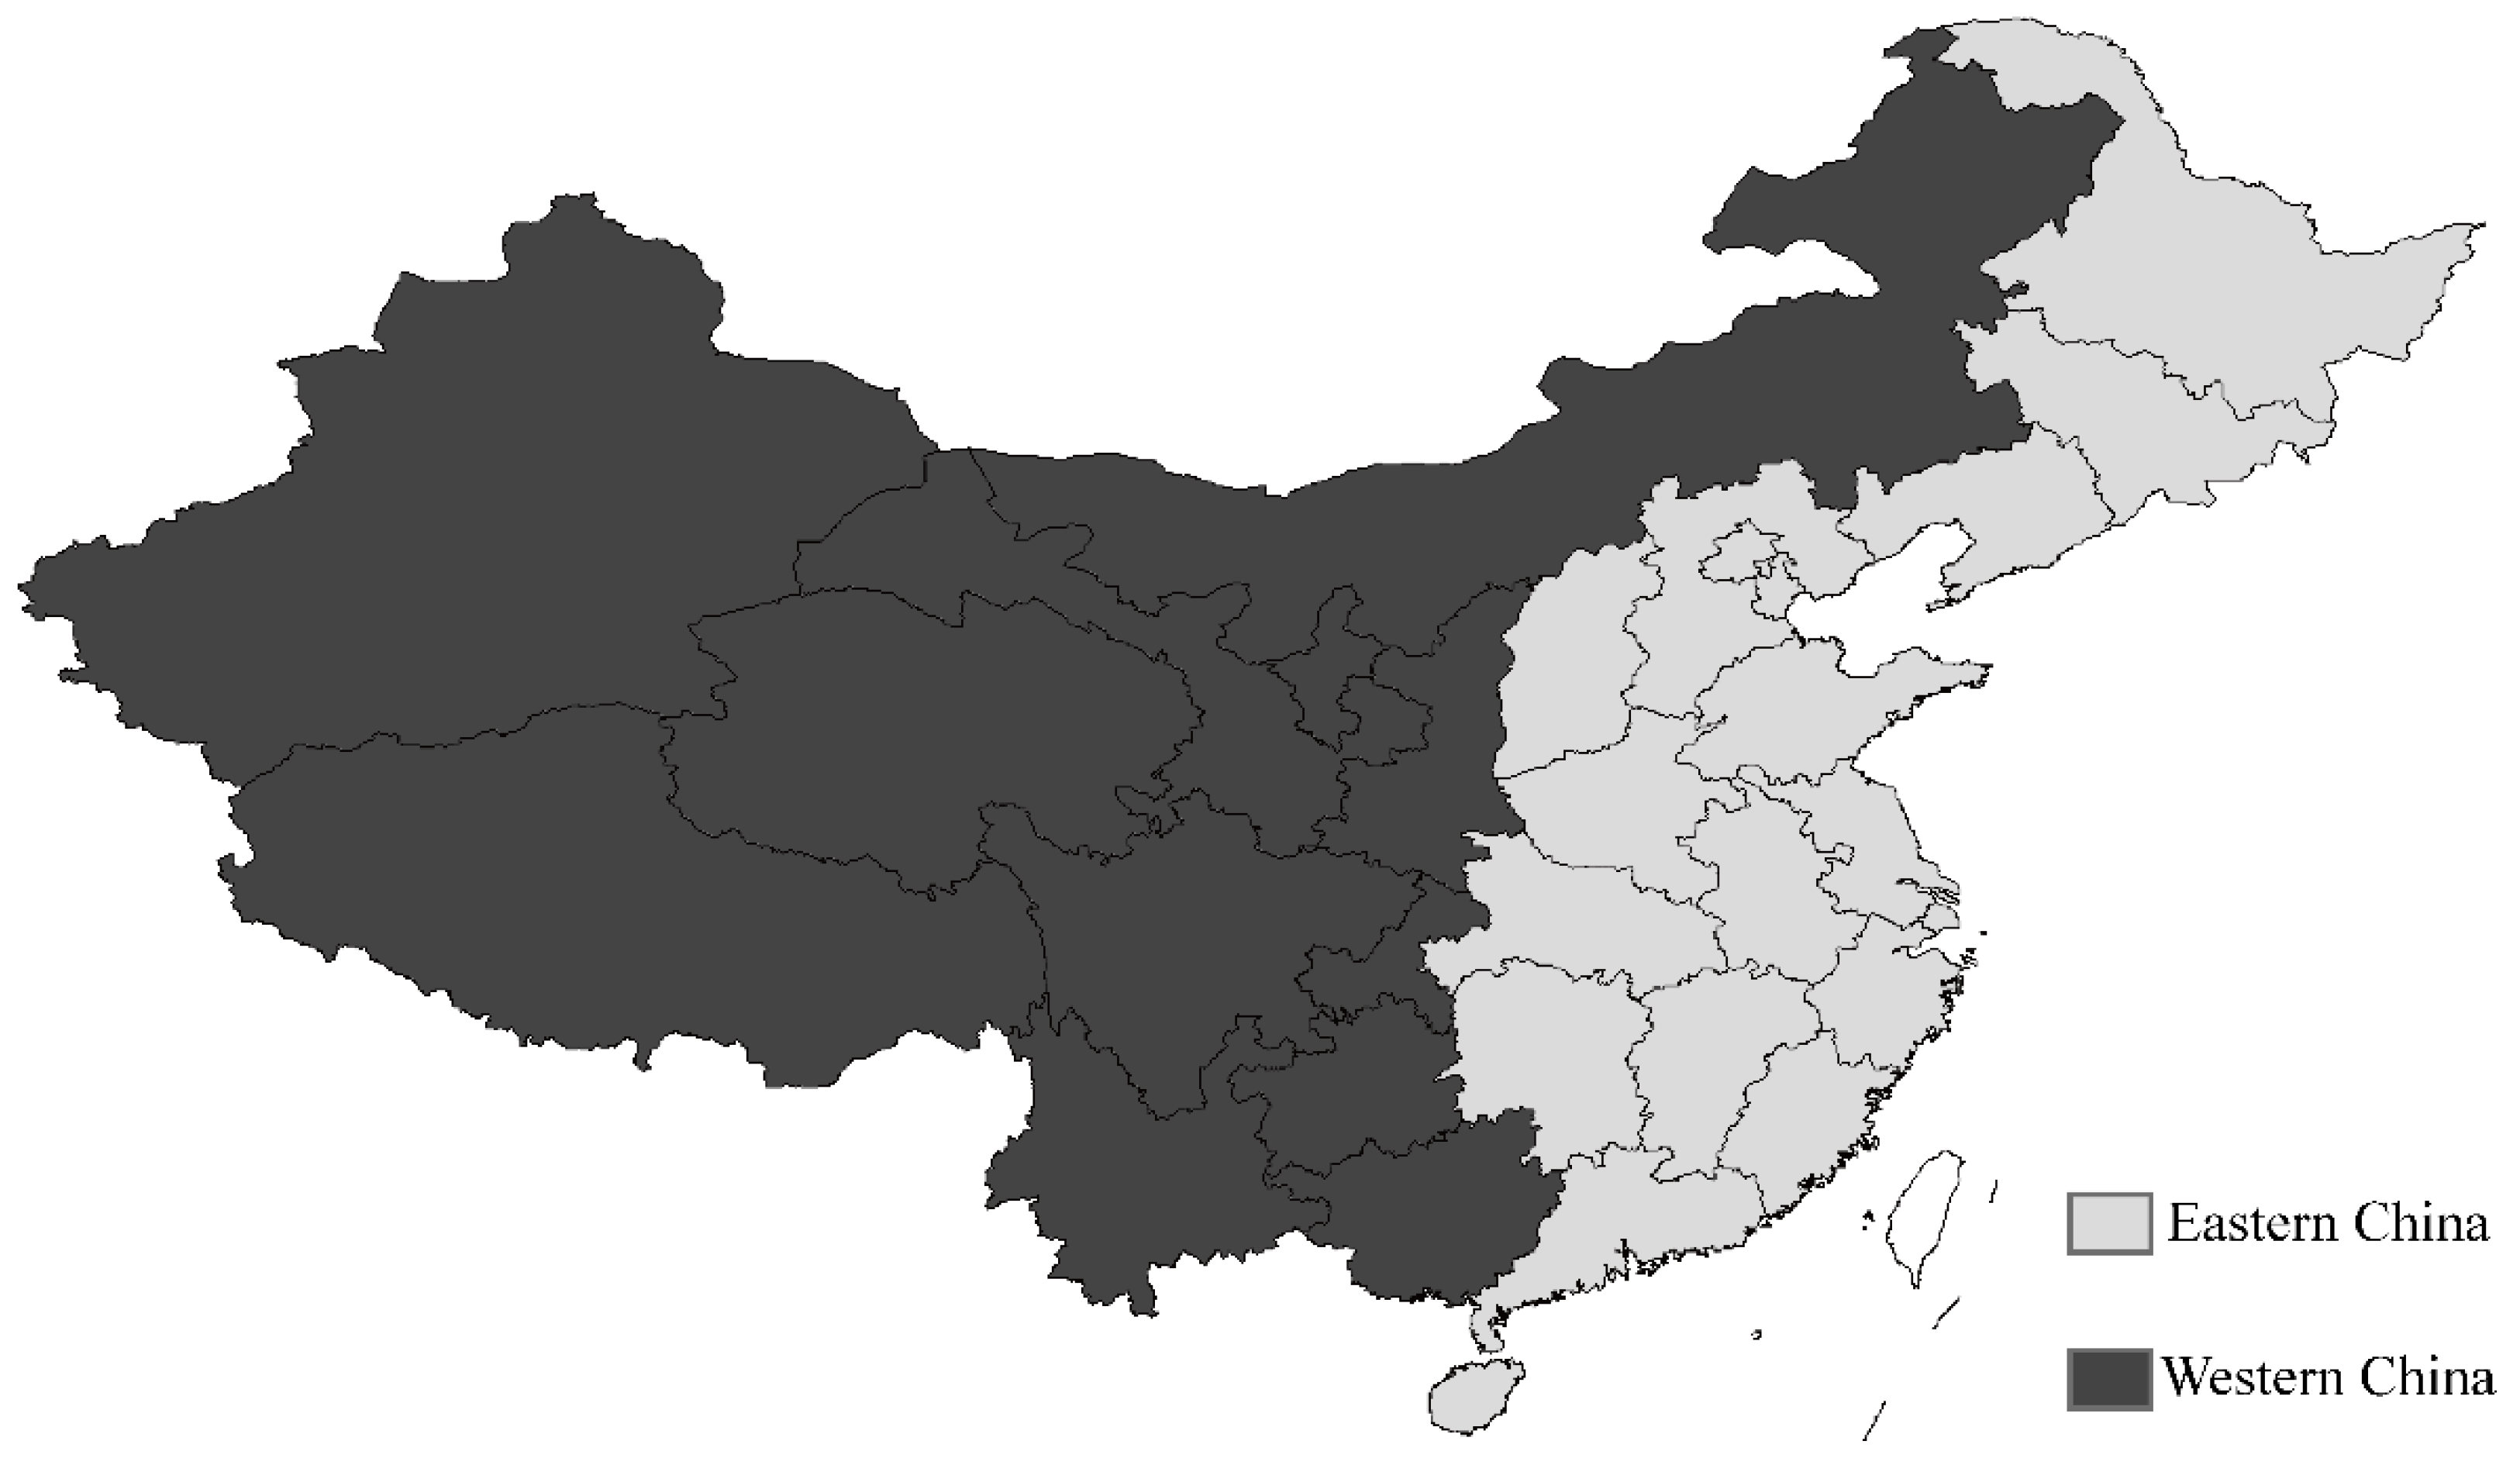
SWB refers to the individual’s subjective perception of his or her general life situation [6], which is influenced by a combination of positive effects, negative effects, and life satisfaction [7]. Sample identification needs special attention in terms of empirical studies in China for the following reasons: China has a land area of 9.6 million square kilometers, with 34 provinces and 57 ethnic groups. This means that if we chose the whole sample in China, the unobservable provincial and ethnic characteristics might bias the estimation, making it hard to isolate the net effects between the dependent variables and independent variables. Therefore, it was necessary to select a more homogeneous sample for our empirical study. Western China is a special region with rapid development in industrialization and urbanization. The heterogeneity of the economic base, social capital, and demographic structure among the western provinces is significant, making western China an ideal sample for studying the potential mechanisms between income, social capital, and SWB (Figure 1).
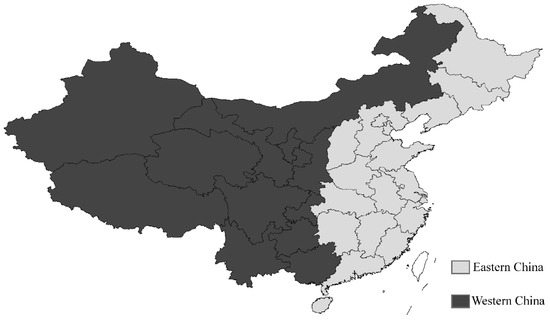
Figure 1.
The geographical location of the western provinces of China.
Accordingly, we used comprehensive survey data from 12 western Chinese provinces and examined the potential correlation between income, social capital, and SWB. This paper primarily addresses the following three questions:
- What is the overall profile of residents’ SWB in western China?
- How do income and social capital lead to changes in SWB, respectively?
- Does social capital moderate the impact of income on SWB?
2. Review of the Literature
2.1. Income and SWB
The association between SWB and income has not been consistently reported in the prior literature. This complex relationship is even more pronounced in East Asia, particularly in China [8,9]. In the context of sustainable development, SWB is gradually replacing gross domestic product (GDP) as a more convincing indicator to assess the overall level of modernization of a given country. According to the economic rationality hypothesis (ERH), the increase in income directly benefits an individual’s welfare, and accordingly improves their living conditions indirectly, ultimately enhancing their SWB. Notably, nearly all prior works in the literature showed a positive correlation between income and SWB, namely the higher the income, the higher the SWB [6]. However, with methodological developments, more empirical studies revealed that the relationship between income and SWB is complex. For example, Easterlin’s cross-country empirical study revealed that the relationship between income and SWB could vary within a specific country. More precisely, high income does not successfully translate into high SWB in developed countries (e.g., the United States of America, Canada, and the United Kingdom). This means that the economic and political system might be confounders of the correlation between SWB and income [10,11]. Several United States studies also revealed a weak correlation between income and SWB [12]. Taken together, the empirical researches so far have been unable to establish a consistent relationship between income and SWB.
Easterlin explains that the core concept of relative status is “relative income”. Using the actual income of their countries’ residents as references, the subjective perceptions of income level could vary significantly or even be opposite in poor and rich countries. In the diachronic study, increasing income would not lead to an increased SWB as the average income of the whole society also rises [9]. The concept of “relative position” soon became widely accepted. In the field of economics, studies have discovered that utility diminishes as the level of well-being of others rises from individual utility models [13]. Relative income has a significant influence on SWB, and some studies proved it to be more influential in determining SWB than absolute income [14]. However, several cross-national researches found different results. There is also a positive link between country-level income and SWB [15]. According to Verhoeven’s analysis of the 1975 Gallup survey data, the GNP per capita of each nation is substantially connected with the SWB of the population, with a correlation coefficient of 0.84 [16]. Another study of SWB in 21 countries found that GDP per capita was positively correlated with SWB in 7 countries, with the correlation being stronger in poorer nations [17]. Subsequent studies also confirmed the positive association between SWB and economic development [18].
The extant research showed that economics was not the only determinant of SWB; more specifically, the non-economic factors might also significantly influence SWB. That is to say, when a given country’s economic development reaches a certain level, non-economic variables may outweigh economic considerations and become the primary influence on SWB. This also coincides with Ronald F. Inglehart’s post-materialist theory [19]. Inglehart thought that individuals would first pursue their basic material needs of life, then transfer their focus to non-material needs once their basic material needs were met. Therefore, it is essential to simultaneously study economic and non-economic factors of SWB.
2.2. Social Capital and SWB
Social capital, as a crucial non-economic factor, is firmly embedded in social networks and, therefore, deeply influences individuals’ living conditions, as well as their SWB [20]. Social capital derives from social networks and is applied to each individual’s daily interactions with others. The strength of social ties is positively associated with a person’s well-being. This idea was firstly proposed by Durkheim in as early as the 19th century [21]. Positive social interactions significantly enhance SWB [22]. For example, individuals are able to share mental and material resources and provide social assistance. Moreover, because social support is typically connected with positive emotions [23], those who receive social support would exhibit increased SWB [24].
Social capital is the most influential factor affecting an individual’s ability to engage in social relationships, express emotions and exchange views. Individuals finally earn instrumental and emotional support, simultaneously. Furthermore, social capital can provide a unique method of social support for individuals as follows: social relationships and the social capital embedded reinforce individuals’ identification with their own identity symbols, then enable them to be recognized and accepted by the group. This mechanism of reinforcing individual’s perception of social identity is essential for enhancing SWB. In summary, social capital is conceptualized as a concept to measure the amount of support for a given individual, which may potentially influence SWB.
Social capital may play a more essential role in research on Chinese residents’ SWB. Due to China’s emphasis on social networks and interpersonal relationships, both economic factors (e.g., income) and non-economic factors (e.g., social capital) have a direct impact on SWB. In particular, Chinese society is currently undergoing a time of fast transformation, during which official institutions are still in an unstable state, and individuals are highly dependent on social supports from informal institutions such as social networks.
3. Materials and Methods
3.1. Data
The data used in this paper were from the Western China Economic and Social Change Survey (ESCS 2020). The survey was conducted by Xi’an Jiaotong University, beginning 5 January 2020 and ending 5 July 2020. The ESCS 2020 was a cross-sectional national survey, which used probability proportional to size (PPS) sampling and aimed to explain the socio-economic characteristics of the inhabitants of western China. ESCS 2020 included all twelve provinces in western China. With the respondents’ consent, the enumerator provided a questionnaire that consisted of detailed questions about the respondents’ socio-economic characteristics. We only retained samples from respondents older than 18 and younger than 65 and ensured that each individual was not unemployed. The survey covered income, social capital and employment characteristics that were relevant to our research. After excluding samples with missing values, the final sample size of the model was 7877.
3.2. Variables
3.2.1. Dependent Variables
The dependent variable in this study was SWB. With reference to previous studies, we conceptualized SWB as individuals’ self-assessment of life satisfaction [25,26]. Respondents were asked “In the last week, did you feel happy?” The available answers included 1, 2, 3, and 4, where 1 represented the lowest SWB, and 4 represented the highest SWB. Respondents were asked to choose only one answer.
3.2.2. Independent Variables
The independent variables in this study covered income and social capital. Notably, we did not choose to use an individual’s annual wage as a proxy for income, as has been commonly done in previous studies. Instead, we focused on absolute income and relative income, since they provided a more complete description of each individual’s economic situation in the entire sample.
Absolute income. That is, an individual’s economic income was obtained by asking respondents how much they made last year. We use 2020 China per capita income, derived from the China Statistical Yearbook, to indicate different income groups. In 2020, Chinese per capita income encapsulated three indicators, with 1–33% defined as low income, 34–66% defined as middle income, and 67–99% defined as high income. Absolute income could also be classified into three groups based on its distribution: high income, middle income, and low income. The values of 3, 2 and 1 were assigned, respectively.
Relative income. Namely, the relative position of an individual’s income among all samples. The core issue with relative income measurement is the choice of reference group. In this paper, we first presented the mean absolute income of the inhabitants of the 12 provinces. Additionally, the relative income of each individual equaled the ratio of absolute income to the absolute income of the province in which the individual resided.
Social capital. We referred to the study by Bian et al. to measure social capital. Bian’s research points out that network size, network position, network differentiation and resource content of the network location influence the social capital level. They constituted the five dimensions of social capital measurement, and a social prestige scale was used to measure them [27,28]. To eliminate the influence of multicollinearity, five network structural variables, such as network size and network density, were dimensionally reduced through principal component factor analysis, and the extracted common factors were used as a measure of social capital. The final KMO value was 0.73, indicating a good factor aggregation effect. Meanwhile, for the purpose of comprehension and comparison, the results of factor analysis were normalized to values from 0–100 and included as logarithms in the final model. The details are shown in Table 1.

Table 1.
Results of social capital factor analysis.
3.2.3. Control Variables
We included a number of factors that had an impact on SWB as covariates including gender (binary variables, 0 = male, 1 = female), age (continuous variables ranging from 18–65), schooling years (continuous variables ranging from 0–19), marriage (binary variables, 0 = unmarried, 1 = married), physical health (multi-categorical variables, from 1 = very unhealthy to 5 = very healthy), mental health status (multi-categorical variables, from 1 = very bad to 5 = very good) and region of residence (binary variables, 0 = urban, 1 = rural).
The details of all variables are systematically presented in Table 2.
Table 2.
Basic variable description statistics table (n = 7877).
3.3. Analysis Strategy
For the robustness of the results, the Ologit model was chosen for the analysis in this study. First, descriptive statistical analysis of the variables was conducted. Second, step-by-step regression models were built to test the research hypotheses. Again, based on the model data, the problem was discussed and interpreted. Finally, based on the empirical results, some targeted policy recommendations were proposed.
We used the Ologit model to examine the potential correlations between income, social capital and SWB, as shown in Equation (1).
where, Xj denotes the explanatory variables, including income, social capital and other control variables, Xβ denotes the matrix of coefficients corresponding to xi denotes the sequential SWB categories, including 1, 2, 3, 4, with 1 representing the lowest and 4 showing the highest. αj denotes the intercept term of the Ologit estimation.
4. Results
4.1. A Descriptive Statistical Analysis of the Differences in the Characteristics of Residents
Due to the longstanding policy of urban–rural household registration division, significant differences in socio-economic characteristics appear in the comparison of urban and rural populations in western China. Therefore, we conducted descriptive statistics based on urban and rural samples, respectively. Table 3 displays this distinction. The first and second columns show the characteristics of the urban and rural samples, respectively, while the third and fourth columns show the ratio and difference between urban and rural areas, and the fifth column reveals whether the difference is statistically significant.
Table 3.
Comparative analysis of the differences in relevant characteristics of residents.
The t-test indicated that the disparities between urban and rural residents in terms of absolute income were statistically significant (difference = 0.07, p < 0.05). The absolute income of urban residents was CNY 18,003.08, while the absolute income of rural residents was only CNY 9247.94. As for relative income, the mean value of relative income of urban residents was slightly lower than that of rural residents and statistically significant (difference = −0.13, p < 0.05). This significant difference clearly indicates the income divide between urban and rural residents in western China.
We further focus on the distribution of social capital. In terms of social capital, rural residents are also at a disadvantage. Among them, the overall social capital factor of urban residents is 3.73, while that of rural people is 2.97, and the score of rural residents is only 79.6% that of urban residents, which is a statistically significant difference (difference = 0.76, p < 0.05). More specifically, Table 3 also reveals the distribution of the five characteristic factors of social capital; the majority of them show statistically significant differences in the distribution between urban and rural samples.
Additionally, the urban and rural samples differed significantly in the distribution of covariates, which was proved to potentially influence SWB; therefore, these covariates needed to be controlled in the subsequent regression analysis.
4.2. Correlation between Income, Social Capital and SWB
Table 4 further reveals the correlations between absolute income, relative income, social capital and SWB. Most western Chinese residents have high SWB. An 80.05% share of residents often felt happy, and the mean SWB score for urban residents was slightly higher than for rural residents, which is consistent with the results of descriptive statistics. Variables such as gender, age, education, marital status, and physical and mental health all significantly influenced residents’ SWB. The coefficients of gender and marital status were positive, indicating that female and married individuals would have higher SWB compared with their counterparts. The coefficient of age was negative, while the coefficient of age squared was positive, indicating an inverted U-shaped relationship between age and SWB, with middle-aged people having the lowest SWB. Years of schooling had a positive correlation, indicating that the higher the level of education, the higher one’s SWB. Additionally, SWB was positively connected with physical and mental well-being. The findings above are congruent with those of previous academic researches [17,18,22].
Table 4.
Ologit model regression analysis results (odds ratio).
However, after controlling the above variables, there was no significant correlation between household registration and SWB, which contradicted our expectations. This presents a possibility that household registration is only a surface indicator that connotes a collection of differences in characteristics such as health status, income, and social capital. When only including the household registration variable in the model, its coefficient was negative, indicating that urban residents showed higher SWB. In contrast, the significance level of household registration disappeared once control variables were included, indicating that the control variables could dilute the effects of household registration on SWB.
Model 2 tested the correlation between absolute income and SWB. After adding the absolute income to Model 1, the SWB of the high-income group turned out to be higher than that of the low-income group. Additionally, the SWB of the middle-income group did not change compared with that of the low-income group. This indicates that absolute income has a positive but insignificant effect on SWB. This finding is consistent with the findings of Diener, Hagerty et al., suggesting that the absolute level of income is not the primary factor that might influence SWB [12,17].
Model 3 and Model 4 further included relative income and social capital variables, respectively. In Model 3, the significantly positive coefficient of relative income showed that relative income has a positive correlation with SWB. After adding the relative income variable, the absolute income turned out to be insignificant. Therefore, relative income has a stronger influence on SWB than absolute income, and it can even replace the role of absolute income.
Model 4 tested the correlation between social capital and SWB. In Model 4, the coefficient of social capital was significantly positive, which showed that higher social capital would lead to higher SWB for western residents. In addition, after taking social capital into consideration, absolute income remained insignificant, while relative income became less significant. Compared with the income factor, higher social capital contributed more to SWB.
Taken together, relative income and social capital positively correlated with SWB. After controlling for relative income, the significance of absolute income disappeared, and the role of relative income completely replaced its influence.
Model 5 introduced the interaction term. Household registration with absolute income, relative income and social capital were included to test whether they would affect SWB differentially. The empirical results confirmed that differences do exist. In terms of the coefficients, the moderation of absolute income and household registration were both positive, indicating that the rise in income had a stronger effect on rural residents compared to urban residents. In contrast, relative income and social capital had a stronger impact on urban residents compared to rural residents, with a negative moderation.
Due to the limitations in institutional structure, China’s regional economic development levels and social environment differ significantly. Generally speaking, urban areas tend to show advantages in economic development and a more progressive society, while their rural counterparts suffer relative disadvantages. As a result, the actual quality of life of urban and rural residents differs significantly, especially in terms of the levels of material needs, such as food, clothing, and security. Rural residents would care more about tangible material life, such as clothing, food, housing, and transportation, than urban residents, explaining a more absolute income-sensitive SWB. Urban residents tend to care more about relative societal status, social support and interaction, with love, respect and self-actualization being their dominant needs [29]. Therefore, their SWB will be more sensitive to the correlation between relative income and social capital.
5. Discussion and Conclusions
Many scholars focus on China’s booming economy and its social impacts, while little attention has been devoted to SWB, especially after considering income and social capital. Therefore, this paper attempted to fill this gap in perspective by systematically analyzing the potential correlations between income, social capital and SWB. This paper chose a more valuable sample, the inhabitants of western China, and came up with meaningful conclusions: (a) first, western residents exhibit a high level of SWB; (b) second, the mean value of SWB of urban residents is slightly higher than that of rural residents; (c) third, economic factors significantly positively influence SWB; and (d) fourth, the impact of non-economic factors, such as social capital, on SWB cannot be ignored.
Comparing the findings of this paper with the prior empirical results, several meaningful conclusions can be drawn. First, using more adequate data, we found that income was positively associated with the SWB of Chinese residents. Previous research has been inconsistent with the debate about the relationship between income and SWB. Several examples are shown as follows: the Pew Center (PEW) poll results showed that life satisfaction among Chinese residents increased with income. Among them, 31% of Chinese people considered their current life to be satisfactory (7–10), and 74% of respondents estimated that their future life would be pleasant [3]. Through cohort analysis of CGSS data, Liu Junqiang et al. found that the SWB of Chinese residents has been rising over the last decade, and then argued that economic growth was the primary factors leading to the improvement in SWB [9]. However, the Gallup survey results showed that the vast majority of Chinese people were dissatisfied with their lives. Xing Zhanjun’s analysis based on cohort data from Shandong province did not find a statistically significant relationship between SWB and income [8].
Second, the contribution of non-economic factors to SWB is significant. This paper mainly focused on the study of life satisfaction by adding individuals’ subjective feelings or self-evaluation and analyzed individual SWB more from the aspects of individuals’ personal and social situations. In terms of non-economic factors, social capital plays a vital role in promoting SWB. Generally speaking, the higher the social capital of western residents, the higher their SWB.
Third, in terms of the moderation between economic and non-economic factors, the empirical results show significant differences. On the one hand, the benefits of rising income were higher for rural residents compared with their urban counterparts. On the other hand, relative income and social capital had a more significant influence on urban residents compared with the rural residents.
Additionally, several limitations of this study must be carefully explained: (a) Bias derives from the potential non-linear distribution of several key variables. More specifically, the distributions of income, social capital, and SWB in this study may be non-linear, which would cause the estimates to be the average mathematical expectation of the full sample. It may be difficult to reveal more detailed characteristics. (b) Cross-sectional data rather than cohort data were used. Because of data limitations, we could only use cross-sectional data, which means that many characteristics that did not vary over time could not be controlled for in the model by certain measures, such as difference-in-difference. The above phenomenon may lead to potential endogeneity problems. (c) Self-assessment questionnaires may not be very objective in reflecting the true characteristics of the respondent. This is because several potential factors, such as the mood on the day of the interview, the weather, the tone of the surveyor, etc., may have an impact on the respondent, and result in the respondent not being able to express themselves objectively. Despite these limitations, this study still has theoretical and empirical meaning.
The findings of this paper strongly support the efforts of the Chinese government in enhancing residents’ SWB. For example, since the inauguration of President Xi Jinping, the Chinese government has made efforts, including poverty alleviation, optimization of economic distribution, and protection of laid-off workers and the disadvantaged, to raise the incomes of Chinese residents and create a relatively harmonious social atmosphere to promote SWB among Chinese individuals [30,31,32]. In this context, the Chinese government’s efforts to raise people’s incomes and SWB have been effective and need to be sustained.
This paper attempted to apply the Ologit model to infer the correlations between income, social capital, and SWB of residents in western China, and accordingly provided two meaningful insights for future research. (a) In addition to the economic dimension, the dominant cultural values of countries and ethnic groups also influence people’s SWB. Therefore, comparative studies are meaningful, especially for comparisons between developed and developing countries. (b) For the conceptualization and measurement of SWB, future research needs to seek a more scientific method of analysis.
Author Contributions
Conceptualization, J.Z. and J.Y.; Data curation, J.X.; Formal analysis, J.Y.; Investigation, X.Z.; Methodology, J.Y.; Writing—original draft, J.Z.; Writing—review & editing, J.Z. and J.X. All authors have read and agreed to the published version of the manuscript.
Funding
This research received no external funding.
Institutional Review Board Statement
The studies involving human participants were reviewed and approved by the Ethics Committee of the School of Xi’an Jiaotong University and the legal guardians of all participants (20BASK0125). All methods were performed in accordance with relevant guidelines and regulations. Written informed consent to participate in this study was provided by the themselves.
Informed Consent Statement
Informed consent was obtained from all subjects involved in the study.
Data Availability Statement
The dataset used in this study can be obtained from the corresponding author on reasonable request.
Acknowledgments
The authors would like to acknowledge the editor and three anonymous reviewers for their insightful suggestions and constructive comments. The first author also thanks Cao for her unwavering support.
Conflicts of Interest
The authors declare no conflict of interest.
References
- Information Office of the State Council. 2010 National Economic Performance [EB/OL]. 20 January 2011. Available online: http://www.scio.gov.cn/ztk/xwfb/21/index.htm (accessed on 6 May 2022).
- National Bureau of Statistics. 2010 National Economic and Social Development Statistics Bulletin [EB/OL]. 28 February 2011. Available online: http://www.gov.cn/gzdt/2011-02/28/content_1812697.htm (accessed on 6 May 2022).
- GlobeNewswire; Gallup. Chinese People’s Happiness Is Low [EB/OL]. 23 April 2011. Available online: https://world.huanqiu.com/article/9CaKrnJqULC (accessed on 8 May 2022).
- GlobeNewswire.com. 2013 Global Happiness Index Report: China Ranked 93rd [EB/OL]. 10 September 2013. Available online: https://world.huanqiu.com/article/9CaKrnJCdo6 (accessed on 10 May 2022).
- Easterlin, R.A. China’s life satisfaction, 1990–2010. Proc. Natl. Acad. Sci. USA 2012, 109, 9775–9780. [Google Scholar] [CrossRef] [PubMed] [Green Version]
- Diener, E.; Suh, E.M.; Lucas, R.E.; Smith, H.L. Subjective well-being: Three decades of progress. Psychol. Bull. 1999, 125, 276–302. [Google Scholar] [CrossRef]
- Diener, E.D.; Emmons, R.A.; Larsen, R.J.; Griffin, S. The satisfaction with life scale. J. Personal. Assess. 1985, 49, 71–75. [Google Scholar] [CrossRef] [PubMed]
- Xing, Z. A study on the relationship between income and happiness in China. Sociol. Res. 2011, 25, 196–219. [Google Scholar]
- Liu, J.; Xiong, M.; Su, Y. National happiness in the period of economic growth—A tracking study based on CGSS data. China Soc. Sci. 2012, 12, 82–102. [Google Scholar]
- Easterlin, R.A. Does Economic Growth Improve the Human Lot? Some Empirical Evidence. In Nations and Households in Economic Growth; Academic Press: New York, NY, USA, 1974; pp. 89–125. [Google Scholar] [CrossRef]
- Easterlin, R.A. Will raising the incomes of all increase the happiness of all? J. Econ. Behav. Organ. 1995, 27, 35–47. [Google Scholar] [CrossRef]
- Diener, E.; Lucas, R.E. Explaining Differences in Societal Levels of Happiness: Relative Standards, Need Fulfillment, Culture, and Evaluation Theory. J. Happiness Stud. 2000, 1, 41–78. [Google Scholar] [CrossRef]
- Kingdon, G.G.; Knight, J. Community, Comparisons and Subjective Well-being in a Divided Society. J. Econ. Behav. Organ. 2007, 64, 69–90. [Google Scholar] [CrossRef] [Green Version]
- Deaton, A.; Stone, A.A. Two happiness puzzles. Am. Econ. Rev. 2013, 103, 591. [Google Scholar] [CrossRef] [Green Version]
- Inglehar, R. Culture Shift in Advanced Industrial Society; Princeton University Press: Princeton, NJ, USA, 1990. [Google Scholar]
- Veenhoven, R. Is happiness relative? Soc. Indic. Res. 1991, 24, 1–34. [Google Scholar] [CrossRef]
- Hagerty, M.R.; Veenhoven, R. Wealth and Happiness Revisited: Growing National Income Does Go with Greater Happiness. Soc. Indic. Res. 2003, 64, 1–27. [Google Scholar] [CrossRef]
- Becker, G.S.; Krueger, A.B. Economic Growth and Subjective Well-Being: Reassessing the Easterlin Paradox. In Brookings Papers on Economic Activity; National Bureau of Economic Research: Cambridge, MA, USA, 2008; pp. 88–102. [Google Scholar] [CrossRef]
- Inglehart, R. Post-materialism in an environment of insecurity. Am. Political Sci. Rev. 1981, 75, 880–900. [Google Scholar] [CrossRef]
- Coleman, J.S. Social Capital in the Creation of Human Capital. Knowl. Soc. Cap. 2000, 94, 17–41. [Google Scholar] [CrossRef]
- Alpert, H.; Durkheim, E.; Spaulding, J.A.; Simpson, G.; Solovay, S.A.; Mueller, J.H.; Catlin, G.E.G. Suicide: A Study in Sociology; Routledge Press: New York, NY, USA, 2012. [Google Scholar]
- Dolan, P.; Peasgood, T.; White, M. Do we really know what makes us happy? A review of the economic literature on the factors associated with subjective well-being. J. Econ. Psychol. 2008, 29, 94–122. [Google Scholar] [CrossRef]
- Meehan, M.P.; Durlak, J.A.; Bryant, F.B. The relationship of social support to perceived control and subjective mental health in adolescents. J. Community Psychol. 1993, 21, 49–55. [Google Scholar] [CrossRef]
- Weiss, R. The provisions of social relationships. In Doing Unto Others; Prentice-Hall: Englewood Cliffs, NJ, USA, 1974; pp. 17–26. [Google Scholar] [CrossRef]
- Ivaldi, E.; Bonatti, G.; Soliani, R. Objective and Subjective Health: An Analysis of Inequality for the European Union. Soc. Indic. Res. 2018, 138, 1279–1295. [Google Scholar] [CrossRef]
- Macků, K.; Caha, J.; Pászto, V.; Tuček, P. Subjective or Objective? How Objective Measures Relate to Subjective Life Satisfaction in Europe. Int. J. Geo-Inf. 2020, 9, 320. [Google Scholar] [CrossRef]
- Bian, Y.J. Bringing Strong Ties Back in: Indirect Ties, Network Bridges, and Job Searches in China. Am. Sociol. Rev. 1997, 62, 366–385. [Google Scholar] [CrossRef]
- Lin, N. Social Capital: A Theory of Social Structure and Action; Cambridge University press: Cambridge, UK, 2001. [Google Scholar]
- Maslow, A.H. Motivation and Personality; Renmin University of China Press: Beijing, China, 2007. [Google Scholar]
- Tang, Y. What makes rural teachers happy? An investigation on the subjective well-being (SWB) of Chinese rural teachers. Int. J. Educ. Dev. 2018, 62, 192–200. [Google Scholar] [CrossRef]
- Song, Y.; Zhou, A.; Zhang, M.; Wang, H. Assessing the effects of haze pollution on subjective well-being based on Chinese General Social Survey. J. Clean. Prod. 2019, 235, 574–582. [Google Scholar] [CrossRef]
- Li, C.; Yan, J.; Xu, Z. How does new-type urbanization affect the subjective well-being of urban and rural residents? Evidence from 28 provinces of China. Sustainability 2021, 13, 13098. [Google Scholar] [CrossRef]
Publisher’s Note: MDPI stays neutral with regard to jurisdictional claims in published maps and institutional affiliations. |
© 2022 by the authors. Licensee MDPI, Basel, Switzerland. This article is an open access article distributed under the terms and conditions of the Creative Commons Attribution (CC BY) license (https://creativecommons.org/licenses/by/4.0/).