
Fuzzy-Based Ecological Vulnerability Assessment Driven by Human Impacts in China


Abstract
:1. Introduction
2. Materials and Methods
2.1. Study Area
2.2. Datasets
2.3. Methods
2.3.1. Ecological Vulnerability Assessment Framework
2.3.2. Analytical Hierarchy Process (AHP) Method for Index Weight
- Model construction: The objective layer of this paper is “ecological vulnerability”, which is subsequently deconstructed into three sub-objects: Exposure, sensitivity, and adaptive capacity. Table 1 shows how the three sub-objects are further classified into 15 attribute indices.
- Weight determination: The weights for the EVA indices were derived from pairwise comparisons within each sub-object layer. In the pairwise comparisons, a preference scaling approach was used with the following scale numbers: 9, 8, …, 2, 1, 1/2, …, 1/8, 1/9, where 9 indicates that one index is the most important for the assessment objective, while 1 means that the contributions of two indices to the assessment objective are equal, and so on down to 1/9, which represents the least important. Utilizing a survey questionnaire sent to eight ecological specialists and managers, we collected data for pairwise comparisons and constructed judgment matrices. To determine weights for each index, the largest eigenvalues (λmax) of the judgement matrices were calculated as shown in Equation (1):
- 3.
2.3.3. Fuzzy Theory for Ecological Vulnerability Assessment
2.3.4. Ecological Vulnerability Aggregation
3. Results
3.1. Assessment Results of Exposure, Sensitivity, and Adaptive Capacity
- (1)
- Exposure
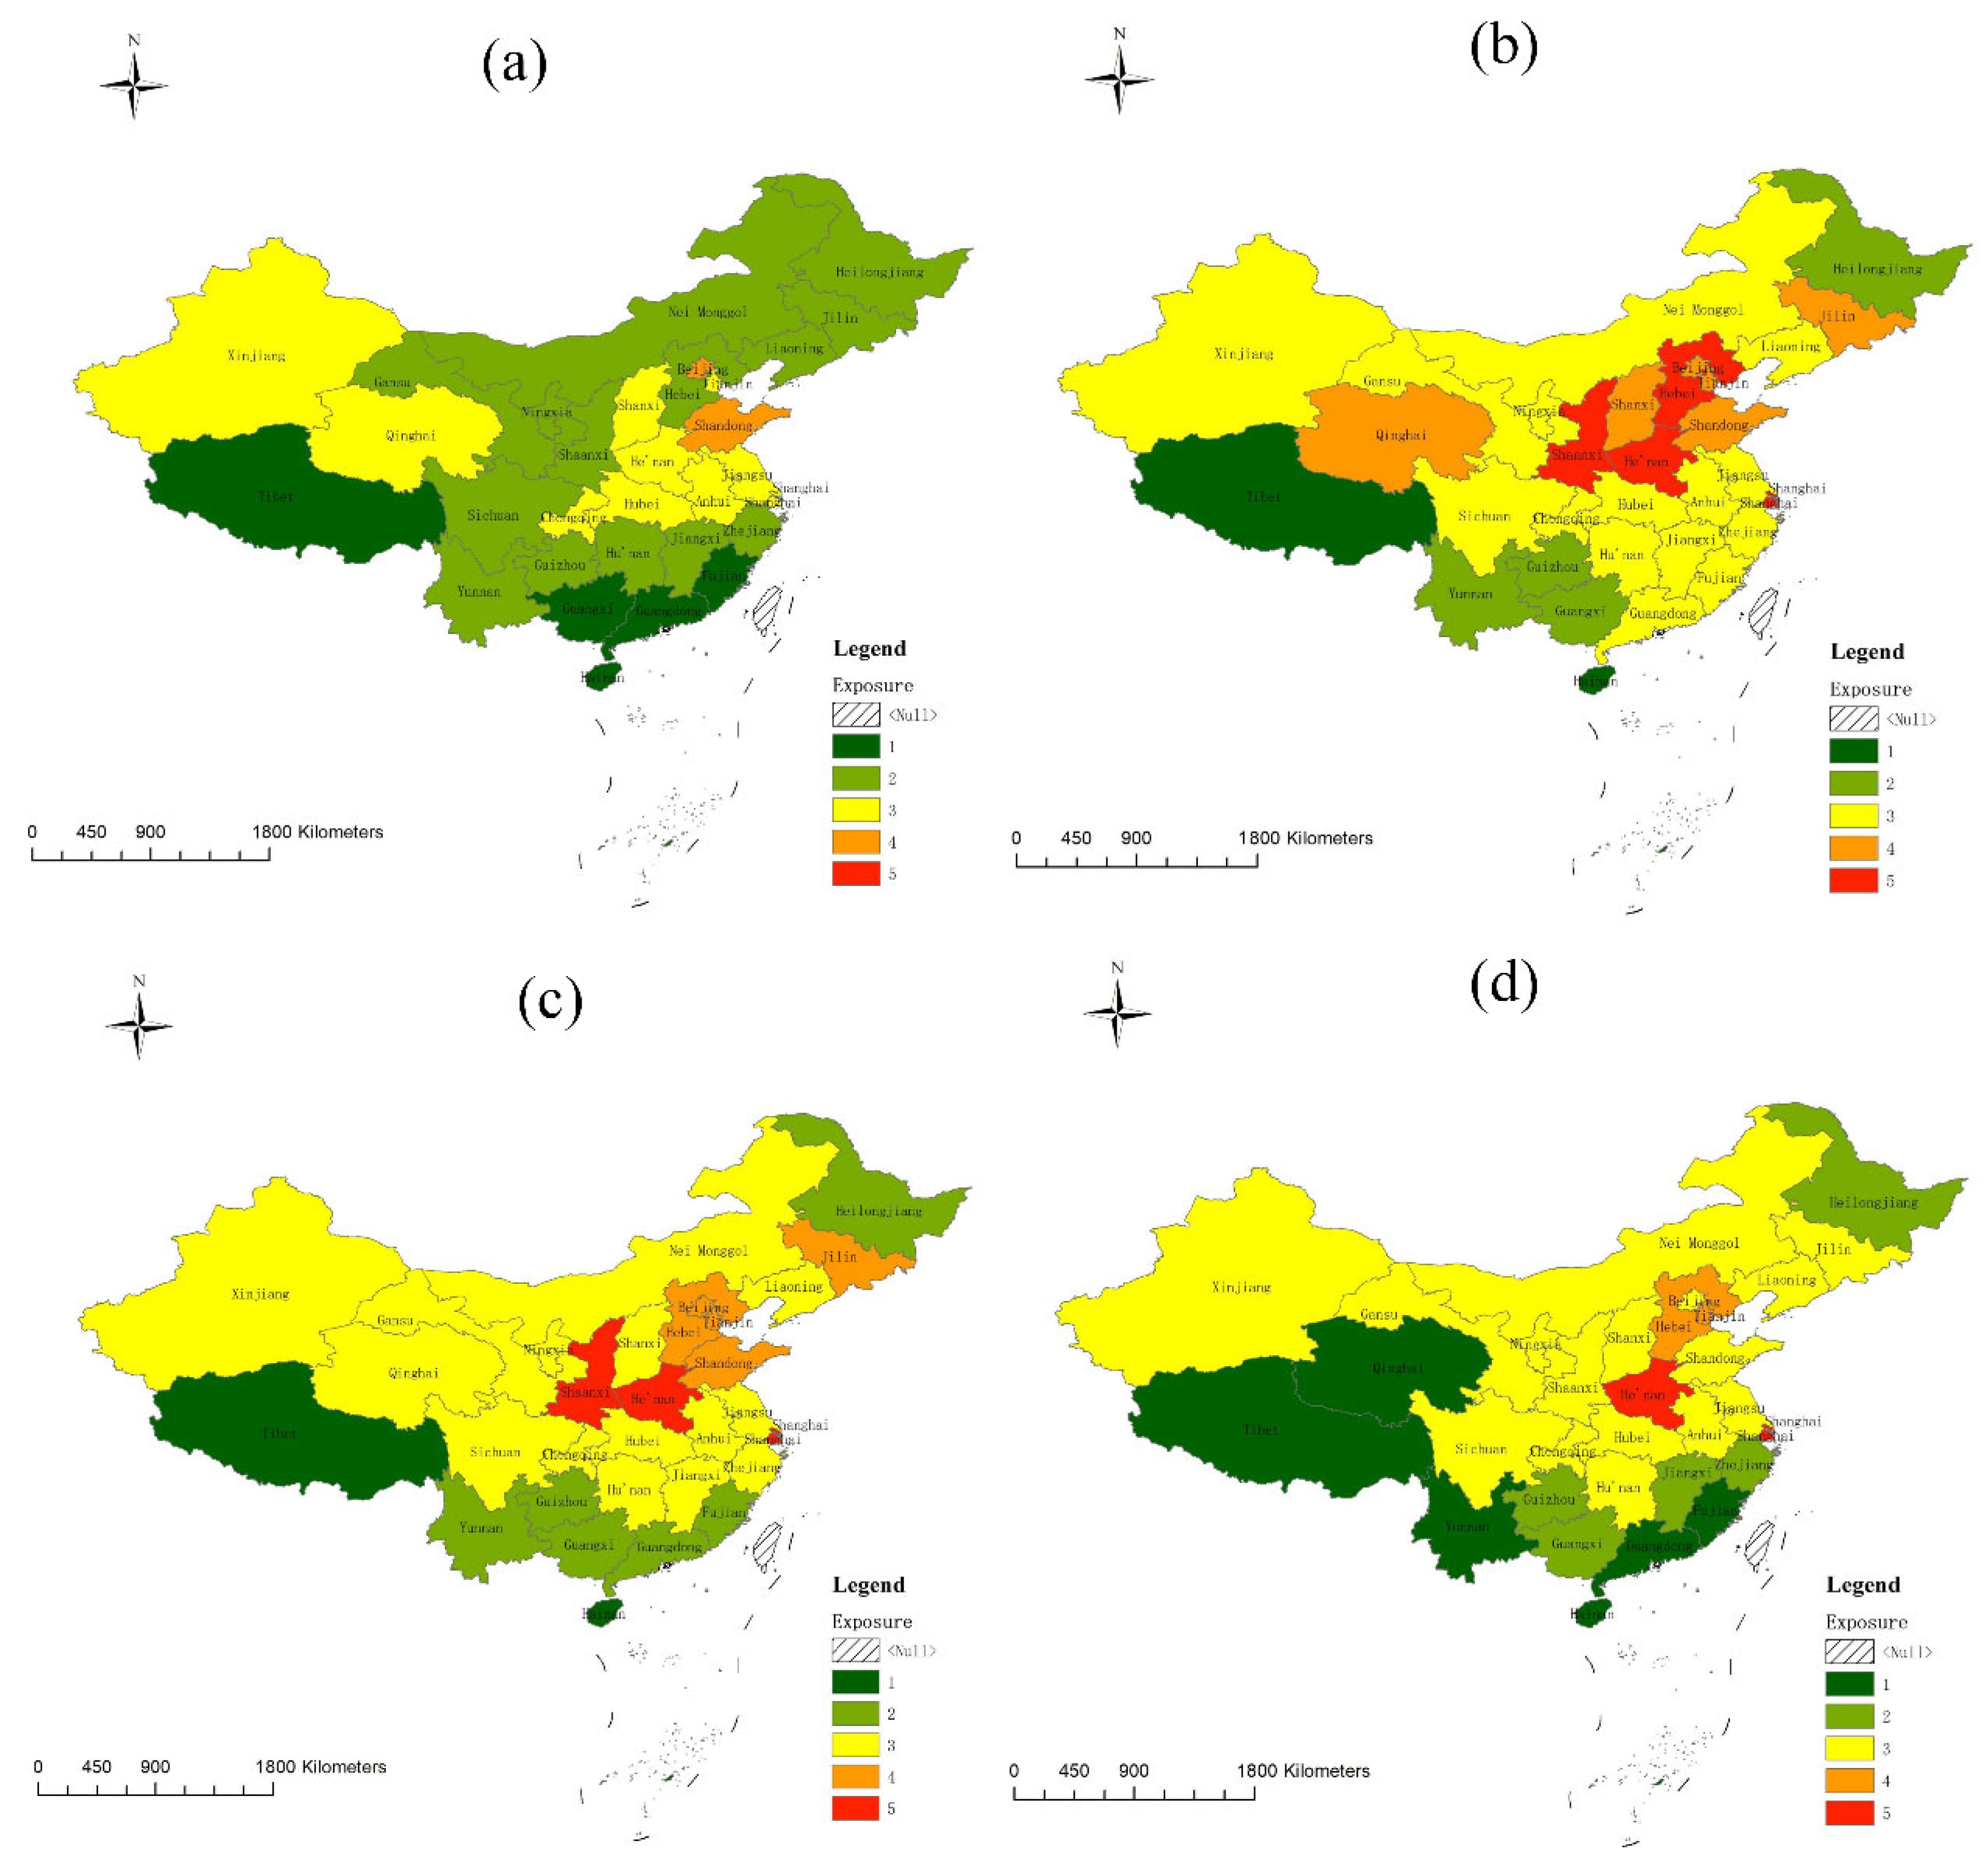
- (2)
- Sensitivity

- (3)
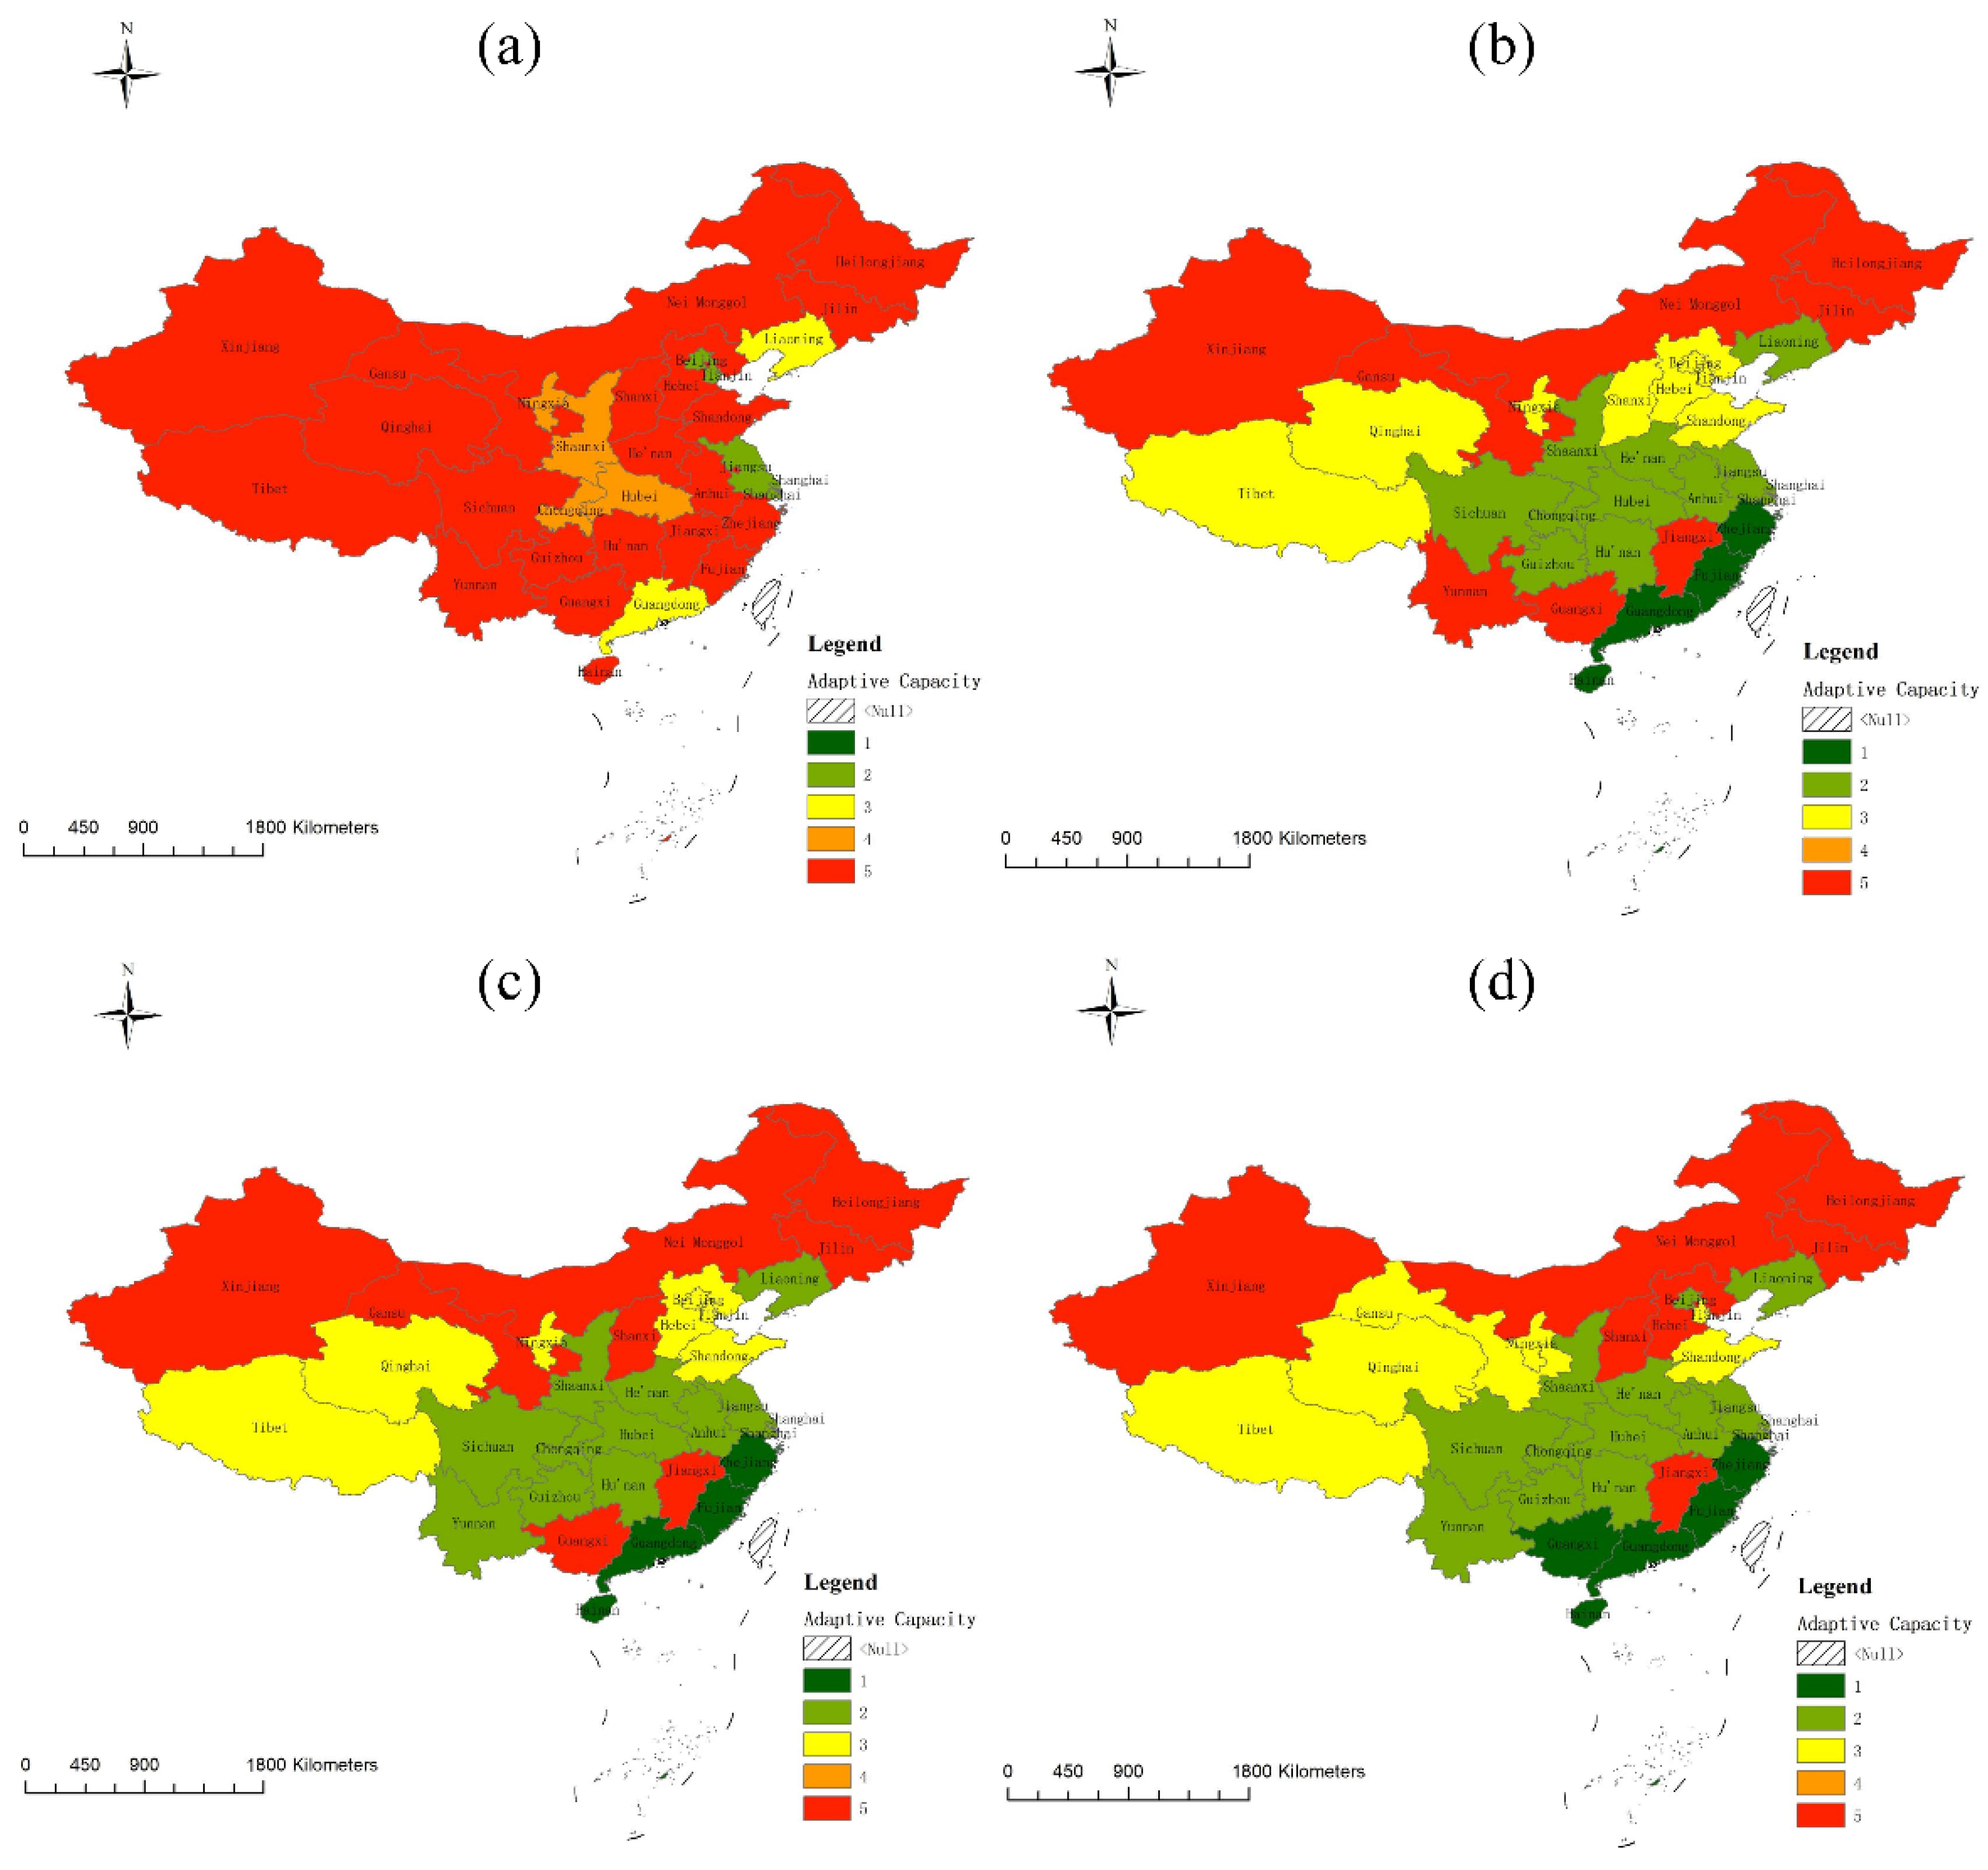
- Adaptive capacity
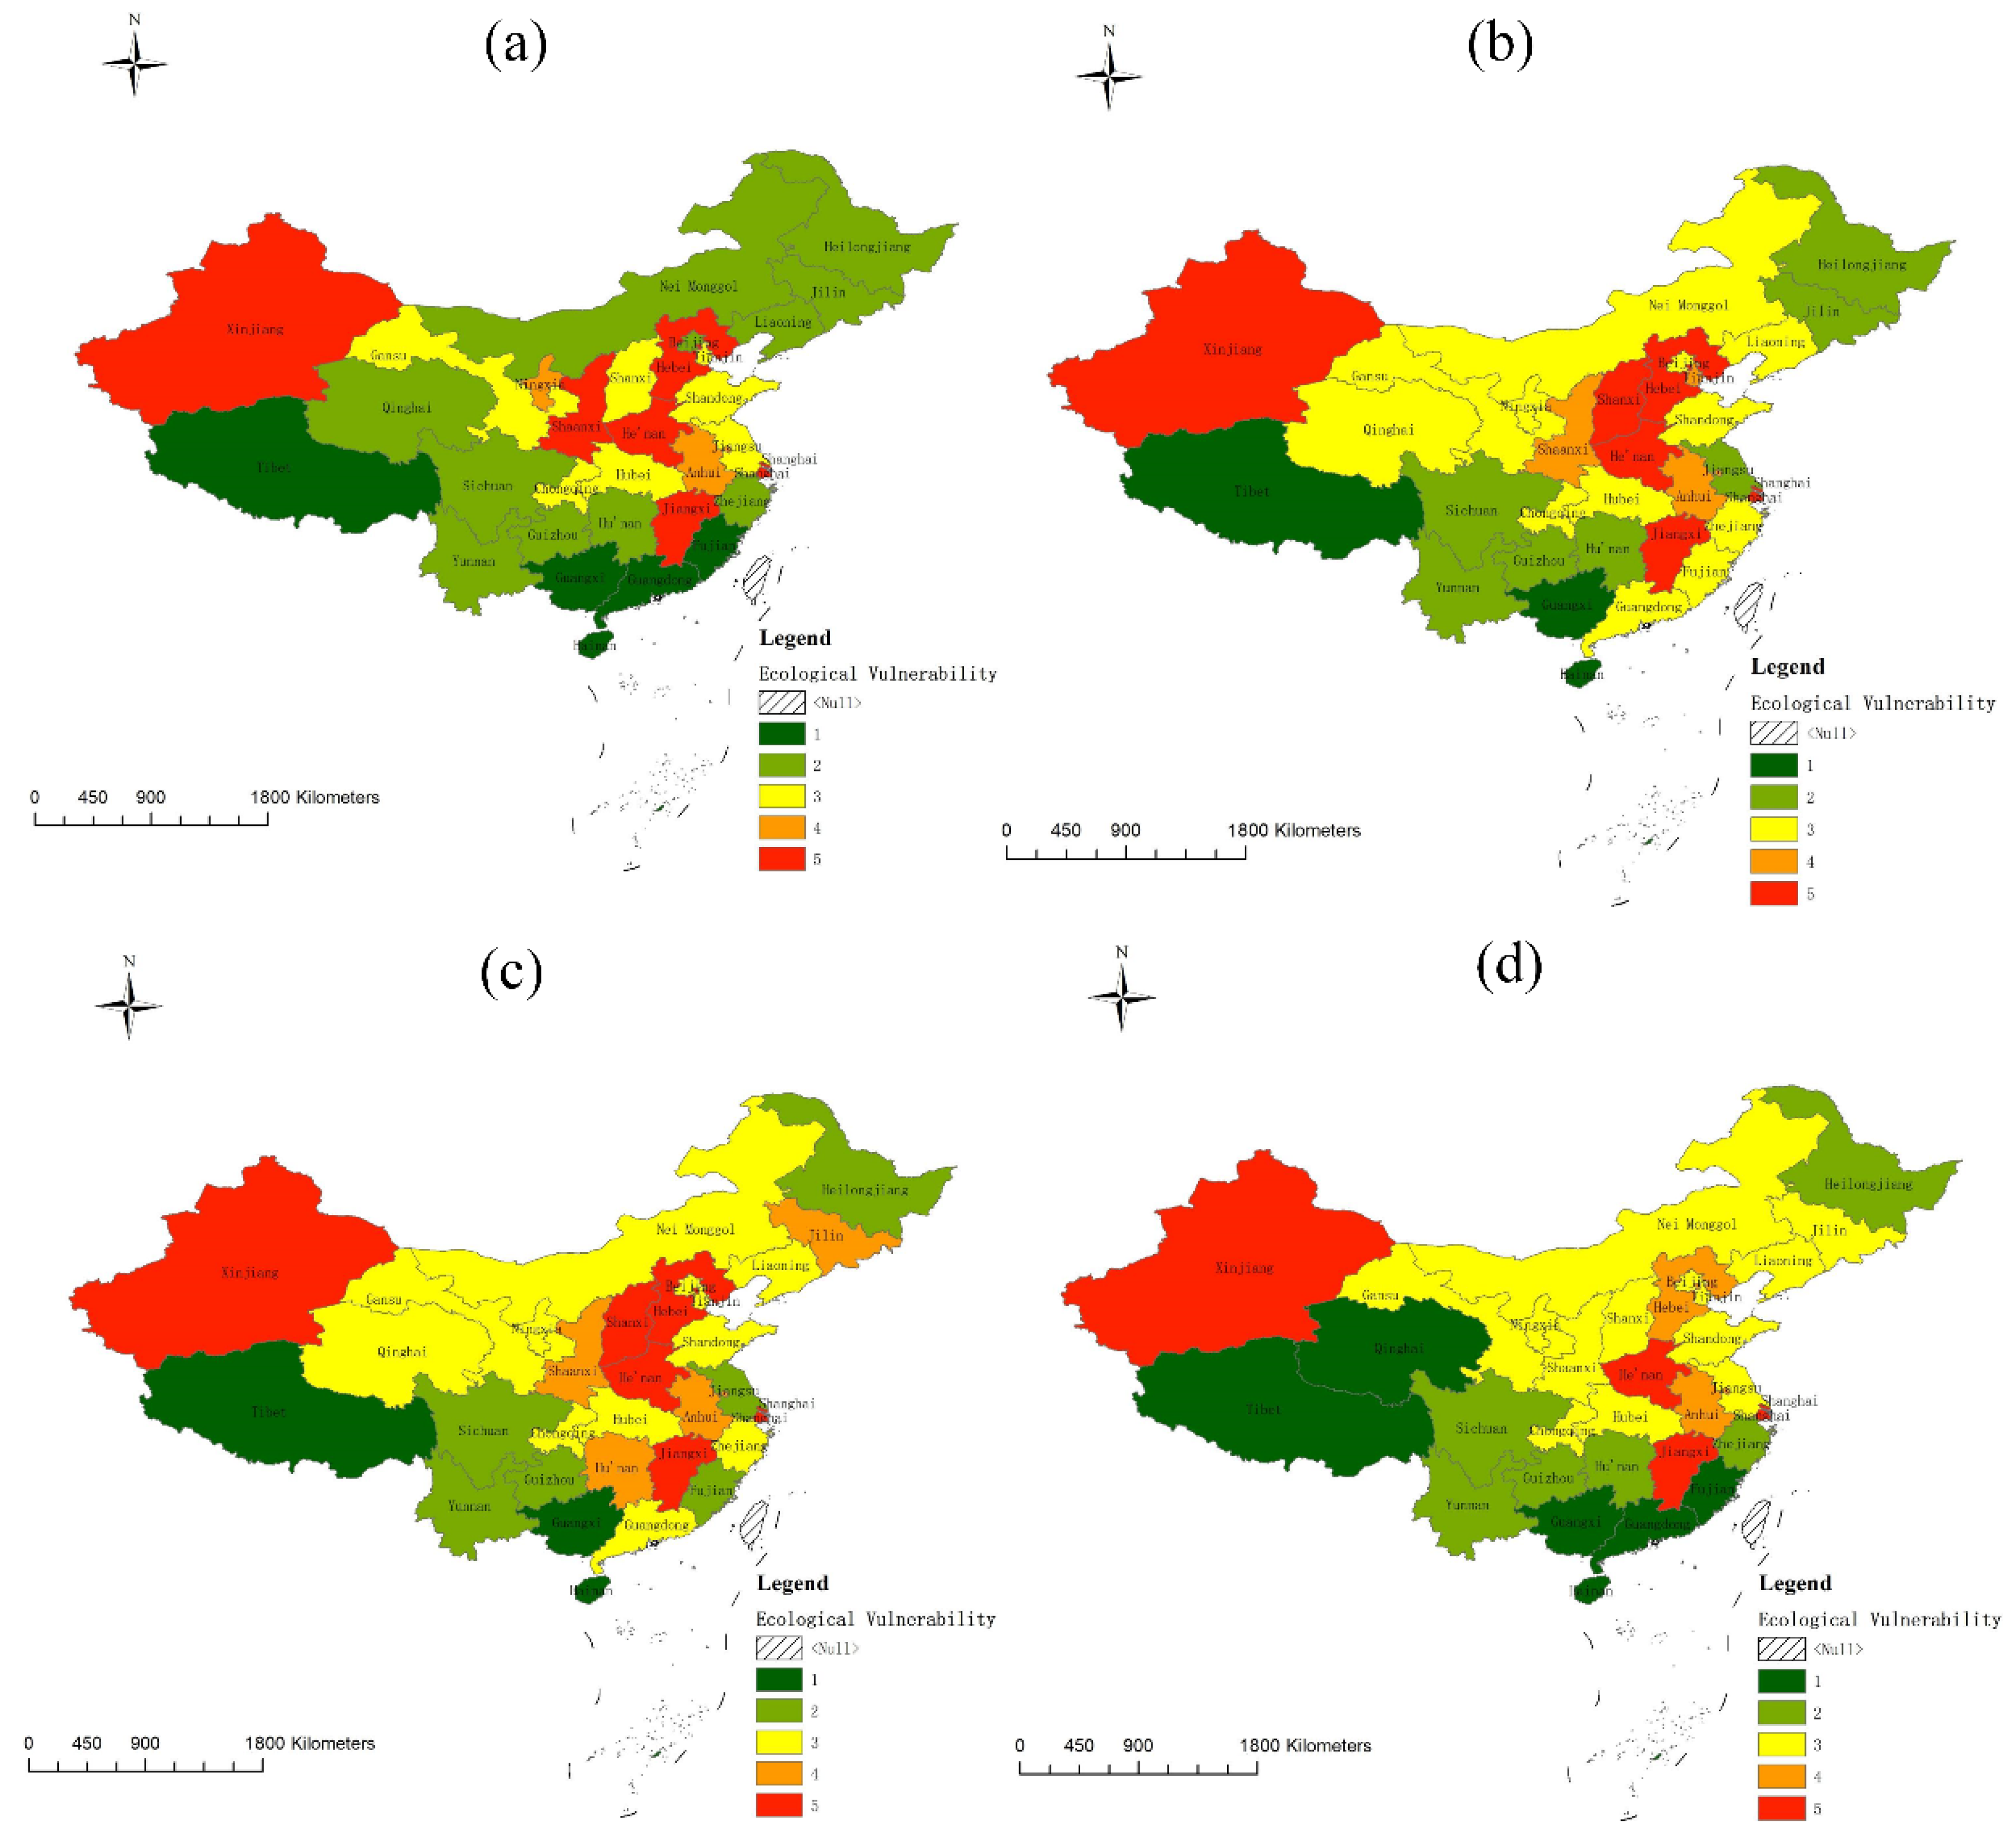
3.2. Assessment Results of Aggregated Ecological Vulnerability
4. Discussion
4.1. Cause Analysis
4.2. Benefits of the EVA Framework
4.3. Limitations of the EVA Framework and Future Scope
5. Conclusions
Author Contributions
Funding
Institutional Review Board Statement
Informed Consent Statement
Data Availability Statement
Conflicts of Interest
References
- Liu, C.; Li, W.; Xu, J.; Zhou, H.; Li, C.; Wang, W. Global trends and characteristics of ecological security research in the early 21st century: A literature review and bibliometric analysis. Ecol. Indic. 2022, 137, 108734. [Google Scholar] [CrossRef]
- Cao, M.; Lu, X.; Qin, Z.; Liu, X.; Li, F. Social-ecological system changes in China from 1990 to 2018. Ecol. Indic. 2022, 139, 108926. [Google Scholar]
- Wang, X.; Peng, J.; Luo, Y.; Qiu, S.; Dong, J.; Zhang, Z.; Vercruysse, K.; Grabowski, R.C.; Meersmans, J. Exploring social-ecological impacts on trade-offs and synergies among ecosystem services. Ecol. Econ. 2022, 197, 107438. [Google Scholar] [CrossRef]
- Li, Y.; Zhang, X.; Cao, Z.; Liu, Z.; Liu, Y. Towards the progress of ecological restoration and economic development in China’s loess plateau and strategy for more sustainable development. Sci. Total 2021, 756, 143676. [Google Scholar]
- Zhong, C.; Hu, R.; Wang, M.; Xue, W.; He, L. The impact of urbanization on urban agriculture: Evidence from China. J. Clean. Prod. 2020, 276, 122686. [Google Scholar] [CrossRef]
- Wang, S.; Xie, Z.; Wu, R.; Feng, K. How does urbanization affect the carbon intensity of human well-being? A global assessment. Appl. Energy 2022, 312, 118798. [Google Scholar] [CrossRef]
- Nguyen, K.-A.; Liou, Y.-A. Global mapping of eco-environmental vulnerability from human and nature disturbances. Sci. Total Environ. 2019, 664, 995–1004. [Google Scholar] [CrossRef]
- Hu, T.; Peng, J.; Liu, Y.; Wu, J.; Li, W.; Zhou, B. Evidence of green space sparing to ecosystem service improvement in urban regions: A case study of China’s Ecological Red Line policy. J. Clean. Prod. 2020, 251, 119678. [Google Scholar] [CrossRef]
- Yang, X.; Liu, S.; Jia, C.; Liu, Y.; Yu, C. Vulnerability assessment and management planning for the ecological environment in urban wetlands. J. Environ. Manag. 2021, 298, 113540. [Google Scholar] [CrossRef]
- Zhang, Y.; Shen, J.; Ding, F.; Li, Y.; He, L. Vulnerability assessment of atmospheric environment driven by human impacts. Sci. Total Environ. 2016, 571, 778–790. [Google Scholar] [CrossRef]
- Zhang, X.; Wang, L.; Fu, X.; Li, H.; Xu, C. Ecological vulnerability assessment based on PSSR in Yellow River Delta. J. Clean. Prod. 2017, 167, 1106–1111. [Google Scholar] [CrossRef]
- Zhang, F.; Liu, X.; Zhang, J.; Wu, R.; Ma, Q.; Chen, Y. Ecological vulnerability assessment based on multi-sources data and SD model in Yinma River Basin, China. Ecol. Model. 2017, 349, 41–50. [Google Scholar] [CrossRef]
- Song, K.; Mi, C.-R.; Zhao, Y.-Z.; Yang, N.; Sun, Y.-H.; Xu, J.-L. Zonation of nature reserve according to the habitat requirement of conservation target: A case study on the endangered Brown Eared-Pheasant at Baihuashan Nature Reserve. Glob. Ecol. Conserv. 2021, 32, e01941. [Google Scholar] [CrossRef]
- Zang, Z.; Zou, X.; Zuo, P.; Song, Q.; Wang, C.; Wang, J. Impact of landscape patterns on ecological vulnerability and ecosystem service values: An empirical analysis of Yancheng Nature Reserve in China. Ecol. Indic. 2017, 72, 142–152. [Google Scholar] [CrossRef]
- Sowman, M. Participatory and rapid vulnerability assessments to support adaptation planning in small-scale fishing communities of the Benguela Current Large Marine Ecosystem. Environ. Dev. 2020, 36, 100578. [Google Scholar] [CrossRef]
- Ben-Hasan, A.; Christensen, V. Vulnerability of the marine ecosystem to climate change impacts in the Arabian Gulf—An urgent need for more research. Glob. Ecol. Conserv. 2019, 17, e00556. [Google Scholar] [CrossRef]
- Liu, H.-L.; Willems, P.; Bao, A.-M.; Wang, L.; Chen, X. Effect of climate change on the vulnerability of a socio-ecological system in an arid area. Glob. Planet. Chang. 2016, 137, 1–9. [Google Scholar] [CrossRef]
- Han, C.; Zheng, J.; Guan, J.; Yu, D.; Lu, B. Evaluating and simulating resource and environmental carrying capacity in arid and semiarid regions: A case study of Xinjiang, China. J. Clean. Prod. 2022, 338, 130646. [Google Scholar] [CrossRef]
- Liao, X.; Li, W.; Hou, J. Application of GIS Based Ecological Vulnerability Evaluation in Environmental Impact Assessment of Master Plan of Coal Mining Area. Procedia Environ. Sci. 2013, 18, 271–276. [Google Scholar] [CrossRef] [Green Version]
- Bárcena, J.F.; Gómez, A.G.; García, A.; Álvarez, C.; Juanes, J.A. Quantifying and mapping the vulnerability of estuaries to point-source pollution using a multi-metric assessment: The Estuarine Vulnerability Index (EVI). Ecol. Indic. 2017, 76, 159–169. [Google Scholar] [CrossRef]
- Hoang, H.D.; Momtaz, S.; Schreider, M. Assessing the vulnerability of small-scale fishery communities in the estuarine areas of Central Vietnam in the context of increasing climate risks. Ocean Coast. Manag. 2020, 196, 105302. [Google Scholar] [CrossRef]
- Ojima, D.; Chuluun, T.; Galvin, K. Social-Ecological Vulnerability of Grassland Ecosystems. Clim. Vulnerability 2013, 4, 151–162. [Google Scholar]
- Xia, M.; Jia, K.; Zhao, W.; Liu, S.; Wei, X.; Wang, B. Spatio-temporal changes of ecological vulnerability across the Qinghai-Tibetan Plateau. Ecol. Indic. 2021, 123, 107274. [Google Scholar] [CrossRef]
- Wiréhn, L.; Danielsson, Å.; Neset, T.-S.S. Assessment of composite index methods for agricultural vulnerability to climate change. J. Environ. Manag. 2015, 156, 70–80. [Google Scholar] [CrossRef]
- Angeon, V.; Bates, S. Reviewing Composite Vulnerability and Resilience Indexes: A Sustainable Approach and Application. World Dev. 2015, 72, 140–162. [Google Scholar] [CrossRef]
- Yang, W.; Xu, K.; Ma, C.; Lian, J.; Jiang, X.; Zhou, Y.; Bin, L. A novel multi-objective optimization framework to allocate support funds for flash flood reduction based on multiple vulnerability assessment. J. Hydrol. 2021, 603, 127144. [Google Scholar] [CrossRef]
- Jiang, Y.; Shi, B.; Su, G.; Lu, Y.; Li, Q.; Meng, J.; Ding, Y.; Song, S.; Dai, L. Spatiotemporal analysis of ecological vulnerability in the Tibet Autonomous Region based on a pressure-state-response-management framework. Ecol. Indic. 2021, 130, 108054. [Google Scholar] [CrossRef]
- Malekmohammadi, B.; Jahanishakib, F. Vulnerability assessment of wetland landscape ecosystem services using driver-pressure-state-impact-response (DPSIR) model. Ecol. Indic. 2017, 82, 293–303. [Google Scholar] [CrossRef]
- Newton, A.; Weichselgartner, J. Hotspots of coastal vulnerability: A DPSIR analysis to find societal pathways and responses. Estuar. Coast. Shelf Sci. 2014, 140, 123–133. [Google Scholar] [CrossRef]
- Maiti, S.; Jha, S.K.; Garai, S.; Nag, A.; Bera, A.; Paul, V.; Upadhaya, R.; Deb, S. An assessment of social vulnerability to climate change among the districts of Arunachal Pradesh, India. Ecol. Indic. 2017, 77, 105–113. [Google Scholar] [CrossRef]
- Zhang, Y.; Shen, J.; Li, Y. Atmospheric Environment Vulnerability Cause Analysis for the Beijing-Tianjin-Hebei Metropolitan Region. Int. J. Environ. Res. Public Health 2018, 15, 128. [Google Scholar] [CrossRef] [Green Version]
- Zhang, Y.; Shen, J.; Li, Y. An atmospheric vulnerability assessment framework for environment management and protection based on CAMx. J. Environ. Manag. 2017, 207, 341–354. [Google Scholar] [CrossRef] [PubMed]
- Duffield, S.J.; Bas, B.L.; Morecroft, M.D. Climate change vulnerability and the state of adaptation on england’s national nature reserves. Biol. Conserv. 2021, 254, 108938. [Google Scholar] [CrossRef]
- Zhu, Q.; Zhou, W.M.; Jia, X.; Zhou, L.; Yu, D.P.; Dai, L.M. Ecological vulnerability assessment on Changbai Mountain National Nature Reserve and its surrounding areas, Northeast China. J. Appl. Ecol. 2019, 30, 1633–1641. [Google Scholar]
- Shi, H.; Lu, J.; Zheng, W.; Sun, J.; Li, J.; Guo, Z.; Huang, J.; Yu, S.; Yin, L.; Wang, Y.; et al. Evaluation system of coastal wetland ecological vulnerability under the synergetic influence of land and sea: A case study in the Yellow River Delta, China. Mar. Pollut. Bull. 2020, 161, 111735. [Google Scholar] [CrossRef]
- Duan, H.; Yu, X.; Zhang, L.; Xia, S.; Liu, Y.; Mao, D.; Zhang, G. An evaluating system for wetland ecological risk: Case study in coastal mainland China. Sci. Total Environ. 2022, 828, 154535. [Google Scholar] [CrossRef]
- Ribeiro, D.; Costa, S.; Guilhermino, L. A framework to assess the vulnerability of estuarine systems for use in ecological risk assessment. Ocean Coast. Manag. 2016, 119, 267–277. [Google Scholar] [CrossRef]
- Okey, T.A.; Agbayani, S.; Alidina, H.M. Mapping ecological vulnerability to recent climate change in Canada’s Pacific marine ecosystems. Ocean Coast. Manag. 2015, 106, 35–48. [Google Scholar] [CrossRef]
- Smith, E.R. An Overview of Epa’s Regional Vulnerability Assessment (ReVA) Program. Environ. Monit. Assess. 2000, 64, 9–15. [Google Scholar] [CrossRef]
- Hoffman, F.O.; Chambers, D.B.; Stager, R.H. Uncertainty Is Part of Making Decisions. Hum. Ecol. Risk Assess.: Int. J. 1999, 5, 255–261. [Google Scholar] [CrossRef]
- Peterman, R.M.; Anderson, J.L. Decision Analysis: A Method for Taking Uncertainties into Account in Risk-Based Decision Making. Hum. Ecol. Risk Assess.: Int. J. 1999, 5, 231–244. [Google Scholar] [CrossRef]
- Climate Change 2014: Impacts, Adaptation, and Vulnerability. Part A: Global and Sectoral Aspects. Available online: https://www.ipcc.ch/report/ar4/syr (accessed on 14 May 2022).
- Zou, T.; Yoshino, K. Environmental vulnerability evaluation using a spatial principal components approach in the Daxing’anling region, China. Ecol. Indic. 2017, 78, 405–415. [Google Scholar] [CrossRef]
- Adger, W.N. Vulnerability. Glob. Environ. Chang. 2006, 16, 268–281. [Google Scholar] [CrossRef]
- He, L.; Shen, J.; Zhang, Y. Ecological vulnerability assessment for ecological conservation and environmental management. J. Environ. Manag. 2018, 206, 1115–1125. [Google Scholar] [CrossRef] [PubMed]
- Shen, J.; Lu, H.; Zhang, Y.; Song, X.; He, L. Vulnerability assessment of urban ecosystems driven by water resources, human health and atmospheric environment. J. Hydrol. 2016, 536, 457–470. [Google Scholar] [CrossRef]
- MEE PRC. Available online: https://www.mee.gov.cn/ (accessed on 3 July 2022).
- NBS PRC. Available online: http://www.stats.gov.cn/ (accessed on 3 July 2018).
- Saaty, T.L. The Analytic Hierarchy Process; McGraw-Hill: New York, NY, USA, 1980. [Google Scholar]
- Saaty, T.; Vargas, L.G. Models, Methods, Concepts and Applications of the Analytic Hierarchy Process; KLUWEI Academic Publisher: Boston, MA, USA, 2001. [Google Scholar]
- Elvis, B.W.W.; Arsène, M.; Théophile, N.M.; Bruno, K.M.E.; Olivier, O.A. Integration of shannon entropy (SE), frequency ratio (FR) and analytical hierarchy process (AHP) in GIS for suitable groundwater potential zones targeting in the Yoyo river basin, Méiganga area, Adamawa Cameroon. J. Hydrol. Reg. Stud. 2022, 39, 100997. [Google Scholar] [CrossRef]
- Zadeh, L.A. Fuzzy sets. Inf. Control 1965, 8, 338–353. [Google Scholar] [CrossRef] [Green Version]
- Chenery, H.B.; Syrquin, M. Patterns of Development; Oxford University Press: London, UK, 1975. [Google Scholar]
- MEE PRC. Ambient Air Quality Standards (GB3095-2012). 2012. Available online: https://www.mee.gov.cn/gkml/hbb/bgg/201203/t20120302_224145.htm (accessed on 3 July 2022).
- MEE PRC. China Environmental Status Bulletin in 2015. Available online: https://www.mee.gov.cn/hjzl/sthjzk/zghjzkgb/201606/P020160602333160471955.pdf (accessed on 3 July 2022).
- Falkenmark, M.; Lundquist, J.; Widstrand, C. Macro-scale Water Scarcity Requires micro-scale Approaches: Aspects of Vulnerability in Semi-arid Development. Nat. Resour. Forum 1989, 13, 258–267. [Google Scholar] [CrossRef]
- Jin, Q.; Fang, X.; Wen, B.; Shan, A. Spatio-temporal variations of PM2.5 emission in China from 2005 to 2014. Chemosphere 2017, 183, 429–436. [Google Scholar] [CrossRef]
- Guo, H.; Cheng, T.; Gu, X.; Wang, Y.; Chen, H.; Bao, F.; Shi, S.; Xu, B.; Wang, W.; Zuo, X.; et al. Assessment of PM2.5 concentrations and exposure throughout China using ground observations. Sci. Total Environ. 2017, 601–602, 1024–1030. [Google Scholar] [CrossRef]
- Singh, C.; Deshpande, T.; Basu, R. How do we assess vulnerability to climate change in India? A systematic review of literature. Reg. Environ. Chang. 2017, 17, 527–538. [Google Scholar] [CrossRef]
- Shukla, R.; Chakraborty, A.; Joshi, P.K. Vulnerability of agro-ecological zones in India under the earth system climate model scenarios. Mitig. Adapt. Strat. Glob. Chang. 2017, 22, 399–425. [Google Scholar] [CrossRef]
- Hoque, M.Z.; Cui, S.; Xu, L.; Islam, I.; Tang, J.; Ding, S. Assessing Agricultural Livelihood Vulnerability to Climate Change in Coastal Bangladesh. Int. J. Environ. Res. Public Health 2019, 16, 4552. [Google Scholar] [CrossRef] [PubMed] [Green Version]
- Sebesvari, Z.; Renaud, F.G.; Haas, S.; Tessler, Z.; Hagenlocher, M.; Kloos, J.; Szabo, S.; Tejedor, A.; Kuenzer, C. A review of vulnerability indicators for deltaic social-ecological systems. Sustain. Sci. 2016, 11, 575–590. [Google Scholar] [CrossRef]
- Seidl, R.; Rammer, W.; Lexer, M.J. Adaptation options to reduce climate change vulnerability of sustainable forest management in the Austrian Alps. Can. J. For. Res. 2011, 41, 694–706. [Google Scholar] [CrossRef] [Green Version]
- Deléglise, C.; Dodier, H.; Garde, L.; François, H.; Arpin, I.; Nettier, B. A Method for Diagnosing Summer Mountain Pastures' Vulnerability to Climate Change, Developed in the French Alps. Mt. Res. Dev. 2020, 39, 27–41. [Google Scholar] [CrossRef] [Green Version]
- Wu, X.; Tang, S. Comprehensive evaluation of ecological vulnerability based on the AHP-CV method and SOM model: A case study of Badong County, China. Ecol. Indic. 2022, 137, 108758. [Google Scholar] [CrossRef]
- Shahbazi, F.; Jafarzadeh, A.A. Integrated assessment of rural lands for sustainable development using MicroLEIS DSS in West Azerbaijan, Iran. Geoderma 2010, 157, 175–184. [Google Scholar] [CrossRef]
- Zhao, J.; Ji, G.; Tian, Y.; Chen, Y.; Wang, Z. Environmental vulnerability assessment for mainland China based on entropy method. Ecol. Indic. 2018, 91, 410–422. [Google Scholar] [CrossRef]
- Karaouzas, I.; Dimitriou, E.; Skoulikidis, N.; Gritzalis, K.; Colombari, E. Linking Hydrogeological and Ecological Tools for an Integrated River Catchment Assessment. Environ. Model. Assess. 2009, 14, 677–689. [Google Scholar] [CrossRef]
- Huang, P.; Ma, C.; Zhou, A. Assessment of groundwater sustainable development considering geo-environment stability and ecological environment: A case study in the Pearl River Delta, China. Environ. Sci. Pollut. Res. 2022, 29, 18010–18035. [Google Scholar] [CrossRef] [PubMed]


| Component | Indicator | Unit | Orientation with Ecological Vulnerability | Data Source |
|---|---|---|---|---|
| Exposure | E1: Annual mean concentration of PM2.5 | μg/m3 | Positive | [47] |
| E2: Annual mean concentration of PM10 | μg/m3 | Positive | [47] | |
| E3: Annual mean concentration of SO2 | μg/m3 | Positive | [47] | |
| E4: Annual mean concentration of NO2 | μg/m3 | Positive | [47] | |
| E5: Qualified rate of surface water quality | % | Negative | [47] | |
| E6: Qualified rate of drinking water quality | % | Negative | [48] | |
| Sensitivity | S1: Population density | Pop. per km2 | Positive | [48] |
| S2: Ecological index | - | Negative | [47] | |
| S3: Nature reserve proportion of administrative district | % | Negative | [48] | |
| S4: Water resources per capita | m3/people | Negative | [48] | |
| S5: Vulnerable groups proportion | % | Positive | [48] | |
| Adaptive capacity | AC1: GDP per capita | $/people | Negative | [48] |
| AC2: Harmless disposal rate of municipal waste | % | Negative | [47] | |
| AC3: R & D investment rate | % | Negative | [47] | |
| AC4: Environmental protection investment rate | % | Negative | [48] |
| Sub-Object Layer | Weight | Indicator Weight | ||
|---|---|---|---|---|
| Exposure | 0.4103 | E1: 0.1318 | E2: 0.0755 | E3: 0.0331 |
| E4: 0.0331 | E5: 0.0863 | E6: 0.0504 | ||
| Sensitivity | 0.3198 | S1: 0.0765 | S2: 0.1167 | S3: 0.0345 |
| S4: 0.0576 | S5: 0.0345 | |||
| Adaptive capacity | 0.2700 | AC1: 0.1046 | AC2: 0.0293 | AC3: 0.0507 |
| AC4: 0.0854 | ||||
| Indicator Layer | 1 (Potential) | 2 (Slight) | 3 (Low) | 4 (Moderate) | 5 (High) | Reference |
|---|---|---|---|---|---|---|
| E1: Annual mean concentration of PM2.5 | 15 | 35 | 55 | 90 | 120 | [54] |
| E2: Annual mean concentration of PM10 | 40 | 70 | 100 | 150 | 180 | [54] |
| E3: Annual mean concentration of SO2 | 20 | 40 | 60 | 80 | 100 | [54] |
| E4: Annual mean concentration of NO2 | 30 | 40 | 50 | 60 | 80 | [54] |
| E5: Qualified rate of surface water quality | 100 | 90 | 80 | 70 | 60 | |
| E6: Qualified rate of drinking water quality | 100 | 90 | 80 | 70 | 60 | |
| S1: Population density | 25 | 100 | 1000 | 3000 | 5000 | |
| S2: Ecological index | Very good | Good | Medium | Relatively bad | Bad | [55] |
| S3: Nature reserve proportion of administrative district | 30 | 22.5 | 15 | 10 | 5 | |
| S4: Water resources per capita | 7500 | 2500 | 1700 | 1000 | 500 | [56] |
| S5: Vulnerable groups proportion | 5 | 10 | 20 | 30 | 40 | |
| AC1: GDP per capita | 30,000 | 11,429 | 9000 | 6098 | 3050 | [53] |
| AC2: Harmless disposal rate of municipal waste | 100 | 95 | 80 | 75 | 50 | |
| AC3: R&D investment rate | 5 | 4 | 3 | 2 | 1 | |
| AC4: Environmental protection investment rate | 3 | 2.5 | 2 | 1.5 | 1 |
| Indicator | Observed Value | Membership at Different Classes | Vulnerability Rank | ||||
|---|---|---|---|---|---|---|---|
| A1 | A2 | A3 | A4 | A5 | |||
| Annual mean concentration of PM2.5 | 86.6 | 0.0000 | 0.0000 | 0.0971 | 0.9029 | 0.0000 | 4 |
| Annual mean concentration of PM10 | 109 | 0.0000 | 0.0000 | 0.8200 | 0.1800 | 0.0000 | 3 |
| Annual mean concentration of SO2 | 28 | 0.6000 | 0.4000 | 0.0000 | 0.0000 | 0.0000 | 1 |
| Annual mean concentration of NO2 | 52 | 0.0000 | 0.0000 | 0.8000 | 0.2000 | 0.0000 | 3 |
| Qualified rate of surface water quality | 53.6 | 0.0000 | 0.0000 | 0.0000 | 0.0000 | 1.0000 | 5 |
| Qualified rate of drinking water quality | 90.8 | 0.0800 | 0.9200 | 0.0000 | 0.0000 | 0.0000 | 2 |
| Population density | 1464 | 0.0000 | 0.0000 | 0.7680 | 0.2320 | 0.0000 | 3 |
| Ecological index | Good | 0.0000 | 1.0000 | 0.0000 | 0.0000 | 0.0000 | 2 |
| Nature reserve proportion of administrative district (%) | 8 | 0.0000 | 0.0000 | 0.0000 | 0.6000 | 0.4000 | 4 |
| Water resources per capita | 193.24 | 0.0000 | 0.0000 | 0.0000 | 0.0000 | 1.0000 | 5 |
| Vulnerable groups proportion | 17.98 | 0.0000 | 0.2020 | 0.7980 | 0.0000 | 0.0000 | 3 |
| GDP per capita | 13,857.43 | 0.1308 | 0.8692 | 0.0000 | 0.0000 | 0.0000 | 2 |
| Harmless disposal rate of municipal waste | 99.1 | 0.8200 | 0.1800 | 0.0000 | 0.0000 | 0.0000 | 1 |
| R&D investment rate | 5.95 | 1.0000 | 0.0000 | 0.0000 | 0.0000 | 0.0000 | 1 |
| Environmental protection investment rate | 0.64 | 0.0000 | 0.0000 | 0.0000 | 0.0000 | 1.0000 | 5 |
| Exposure | - | 0.0239 | 0.0596 | 0.1012 | 0.1392 | 0.0863 | 4 |
| Sensitivity | - | 0.0000 | 0.1237 | 0.0863 | 0.0384 | 0.0714 | 2 |
| Adaptive capacity | - | 0.0884 | 0.0962 | 0.0000 | 0.0000 | 0.0854 | 2 |
| Ecological vulnerability | - | 0.1123 | 0.2795 | 0.1875 | 0.1777 | 0.243 | 2 |
Publisher’s Note: MDPI stays neutral with regard to jurisdictional claims in published maps and institutional affiliations. |
© 2022 by the authors. Licensee MDPI, Basel, Switzerland. This article is an open access article distributed under the terms and conditions of the Creative Commons Attribution (CC BY) license (https://creativecommons.org/licenses/by/4.0/).
Share and Cite
Han, C.; Zhang, Y.; Shen, J. Fuzzy-Based Ecological Vulnerability Assessment Driven by Human Impacts in China. Sustainability 2022, 14, 9166. https://doi.org/10.3390/su14159166
Han C, Zhang Y, Shen J. Fuzzy-Based Ecological Vulnerability Assessment Driven by Human Impacts in China. Sustainability. 2022; 14(15):9166. https://doi.org/10.3390/su14159166
Chicago/Turabian StyleHan, Cheng, Yang Zhang, and Jing Shen. 2022. "Fuzzy-Based Ecological Vulnerability Assessment Driven by Human Impacts in China" Sustainability 14, no. 15: 9166. https://doi.org/10.3390/su14159166