Article

Swamp Wetlands in Degraded Permafrost Areas Release Large Amounts of Methane and May Promote Wildfires through Friction Electrification

1
Institute of Cold Regions Science and Engineering, Northeast Forestry University, Harbin 150040, China
2
Ministry of Education Observation and Research Station of Permafrost Geo-Environment System in Northeast China (MEORS-PGSNEC), Harbin 150040, China
3
Collaborative Innovation Centre for Permafrost Environment and Road Construction and Maintenance in Northeast China (CIC-PERCM), Harbin 150040, China
*
Author to whom correspondence should be addressed.
Sustainability 2022, 14(15), 9193; https://doi.org/10.3390/su14159193
Submission received: 17 May 2022 / Revised: 22 July 2022 / Accepted: 25 July 2022 / Published: 27 July 2022
(This article belongs to the Section Hazards and Sustainability)

Abstract

:
Affected by global warming, permafrost degradation releases a large amount of methane gas, and this part of flammable methane may increase the frequency of wildfires. To study the influence mechanism of methane emission on wildfires in degraded permafrost regions, we selected the northwest section of Xiaoxing’an Mountains in China as the study area, and combined with remote sensing data, we conducted long-term monitoring of atmospheric electric field, temperature, methane concentration, and other observation parameters, and further carried out indoor gas–solid friction tests. The study shows that methane gas (the concentration of methane at the centralized leakage point is higher than 10,000 ppm) in the permafrost degradation area will release rapidly in spring, and friction with soil, surface plant residues, and water vapor will accelerate atmospheric convection and generate electrostatic and atmospheric electrodischarge phenomena on the surface. The electrostatic and atmospheric electrodischarge accumulated on the surface will further ignite the combustibles near the surface, such as methane gas and plant residues. Therefore, the gradual release of methane gas into the air promotes the feedback mechanism of lightning–wildfire–vegetation, and increases the risk of wildfire in degraded permafrost areas through frictional electrification (i.e., electrostatic and atmospheric electrodischarge).

1. Introduction

Methane is not only a strong greenhouse gas, but is also a combustible gas that plays an important role in the interactions between terrestrial ecosystems and the climate [1,2,3,4]. The Earth’s cryosphere constitutes a vast climate-sensitive carbon reservoir; the carbon in this system exists not only in the form of permafrost soil carbon, but also in the form of methane reservoirs under permafrost and ice sheets [5,6,7]. The amount of soil organic carbon stored in these permafrost regions is approximately twice the amount of carbon stored in the atmosphere, and this carbon is sensitive to climate warming [8,9]. Climate change threatens this vast carbon pool, and the Earth’s cryosphere is shrinking at an average annual rate of 87,000 square kilometres [10,11]. Among these permafrost areas, the permafrost area in Northeast China has a size of approximately 354,700 square kilometres. The permafrost layer in this region has a high temperature (−1.5~0 °C; some areas have temperatures even higher than 0 °C, under which conditions permafrost begins to degenerate), thin thickness, and unstable thermal state. It is thus vulnerable to interferences from the external environment, climate, and human factors [12,13,14,15,16,17]. The increase in the mean average air temperature (MAAT) in Northeast China is higher than that in the world [18,19,20,21]. In the past 50 years, the air temperature in Northeast China has generally increased by 0.9~2.2 °C; additionally, the overall permafrost area has decreased by 35~37% compared with that measured in the 1970s [17]. In addition, there is a large area of swamp wetlands in Northeast China, and the distribution range of these swamp wetlands is related to the permafrost distribution. Affected by global warming and human activities, many wildfires have appeared in this part of the swamp wetland area [12,22,23,24,25]. A large methane source in the degraded permafrost area of Northeast China was found to have been caused by spring thawing; the maximum hourly emission rate is 48.6 g C m−2h−1, which is three orders of magnitude higher than the methane emission rate regularly observed during the growing season [22]. Owing to the isolation of frozen surfaces and winter snow in permafrost areas, most of the methane produced in these soils cannot be released into the air immediately [26]. During the thawing season of the following year, the release of this methane stored in permafrost occurs over a very short time period, resulting in emission explosions that form an eruption process similar to that of a volcano [22,23].
Recently, the eruption of the Tonga volcano has attracted the attention of scholars, as this eruption triggered a series of environmental disasters. By analysing the volcanic eruption images, we determined, that with the eruption of the volcano, many electrodischarges (lightning bolts) appeared in the atmosphere. In addition to the Tonga volcano, the eruptions of the Taal volcano in 2020, Anak Krakatau volcano in 2018, and La Soufrière volcano in 2021 were also accompanied by extensive lightning activity [27,28] (Video-1–Video-4). The formation principle of volcano-induced lighting is basically the same as that of lightning in thunderstorm weather [29,30]. Driven by the large updrafts associated with volcanic eruptions, at least two main substance friction and collision modes occur in a certain spatial range and form the electrodischarge phenomenon [31]. In addition, in the neutralization process of electrocharges with different properties, the electric potential energy in the electric field also disappears; according to the law of energy conservation, this electric potential energy is transformed into heat energy and released [32,33,34]. However, in permafrost regions, methane gas stored in the lower part of the permafrost layer erupts and is released in spring, and this also induces an eruption process involving fine soil particles and water vapour, thus resulting in corresponding friction and electrodischarges similar to those associated with volcanos. One past study showed that the methane released from permafrost areas may promote the occurrence of wildfires [25]. Lightning is the main cause of wildfires in the permafrost areas near the Arctic [35,36,37,38,39,40,41,42,43]. The lightning frequency in the Arctic is now higher than it was a decade ago, and this frequency may soon double [44]. In addition, because the permafrost regions in Northeast China are the source of the generation and movement of northern cyclones in East Asia and are also affected by the Northeast cold vortex, frequent, unstable thunderstorms occur in this region, and the atmosphere is prone to strong convective movement [45,46]. In Northeast China, lightning fires are mainly distributed in three zones: Hulunbuir League in the southwest, Heihe region in the northeast, and the mountainous area to the north of 51° N. Lightning fires in the northern region account for approximately 38% of the total number of forest fires, and the Heihe region and Hulunbuir League in the permafrost zone are consistent with lightning activity centers [47,48]. In addition, methane gas stored in the lower part of the frozen soil layers in these regions burst and release into the air in spring, thus accelerating atmospheric convection in the northeast permafrost area and increasing the atmospheric electrodischarge phenomenon and, because of the low soil resistivity, swamp areas in these permafrost regions are increasingly likely to be hit by lighting [49,50,51].
In summary, after permafrost degrades, the methane gas stored under the permafrost layer is rapidly released. This process is similar to a volcanic eruption, and the released gas, solid particles, and water vapour generate electrodischarge as a result of mutual friction. However, the accumulated static electricity and electrodischarge may promote the occurrence of wildfires. To further study the mechanism by which methane gas releases influence wildfire activities in permafrost areas, we selected the northwest section of the Xiao Xing’an Mountains in China, within the degraded area on the southern edge of the Eurasia permafrost area, as the study area; then, we set up multiple research and monitoring areas, installed monitoring equipment (to observe parameters including the atmospheric electric field, air temperature, ground temperature, methane concentration, and pore water pressure), and combined the observations with remote sensing data to monitor the changes in the methane concentration and its influencing parameters over the long term. Then, through indoor gas–solid friction tests, we verified that the friction between gas and solid soil particles causes electric potential differences during the emissions process of methane gas. The analysis revealed the mechanism of seasonal wildfires in the study area and elucidated the lightning–wildfire–vegetation feedback mechanism as it relates to permafrost.

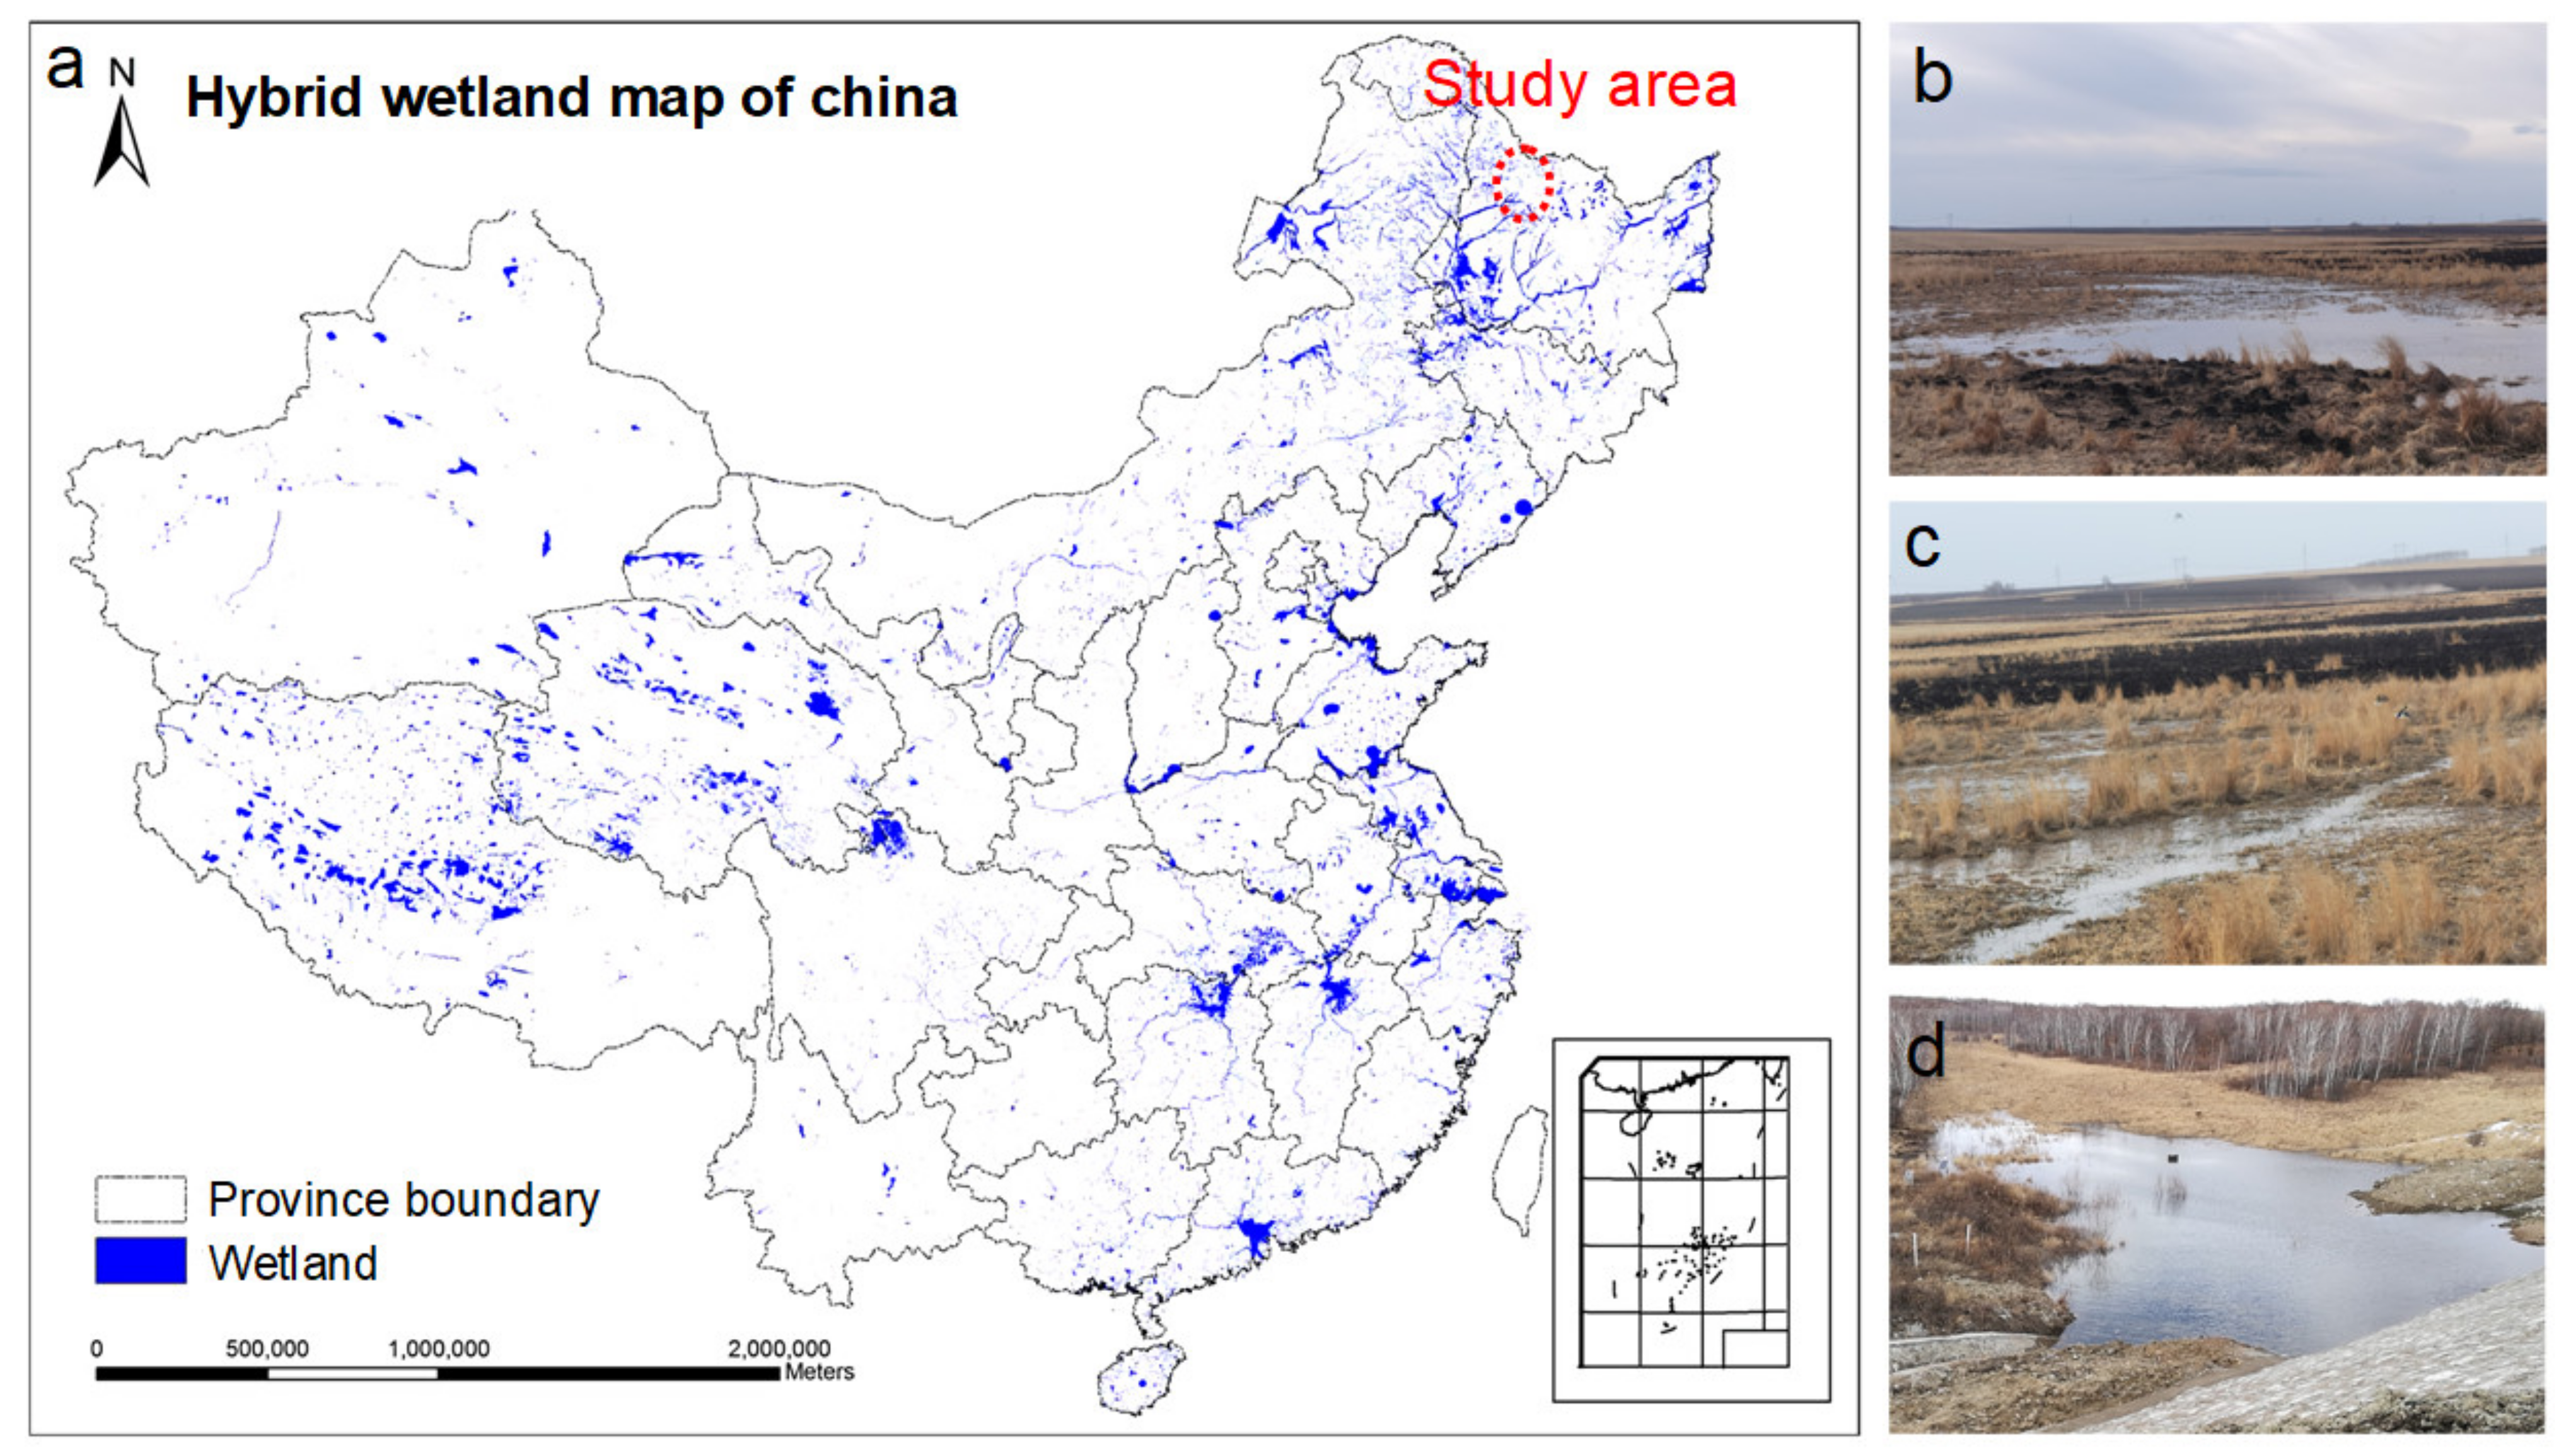
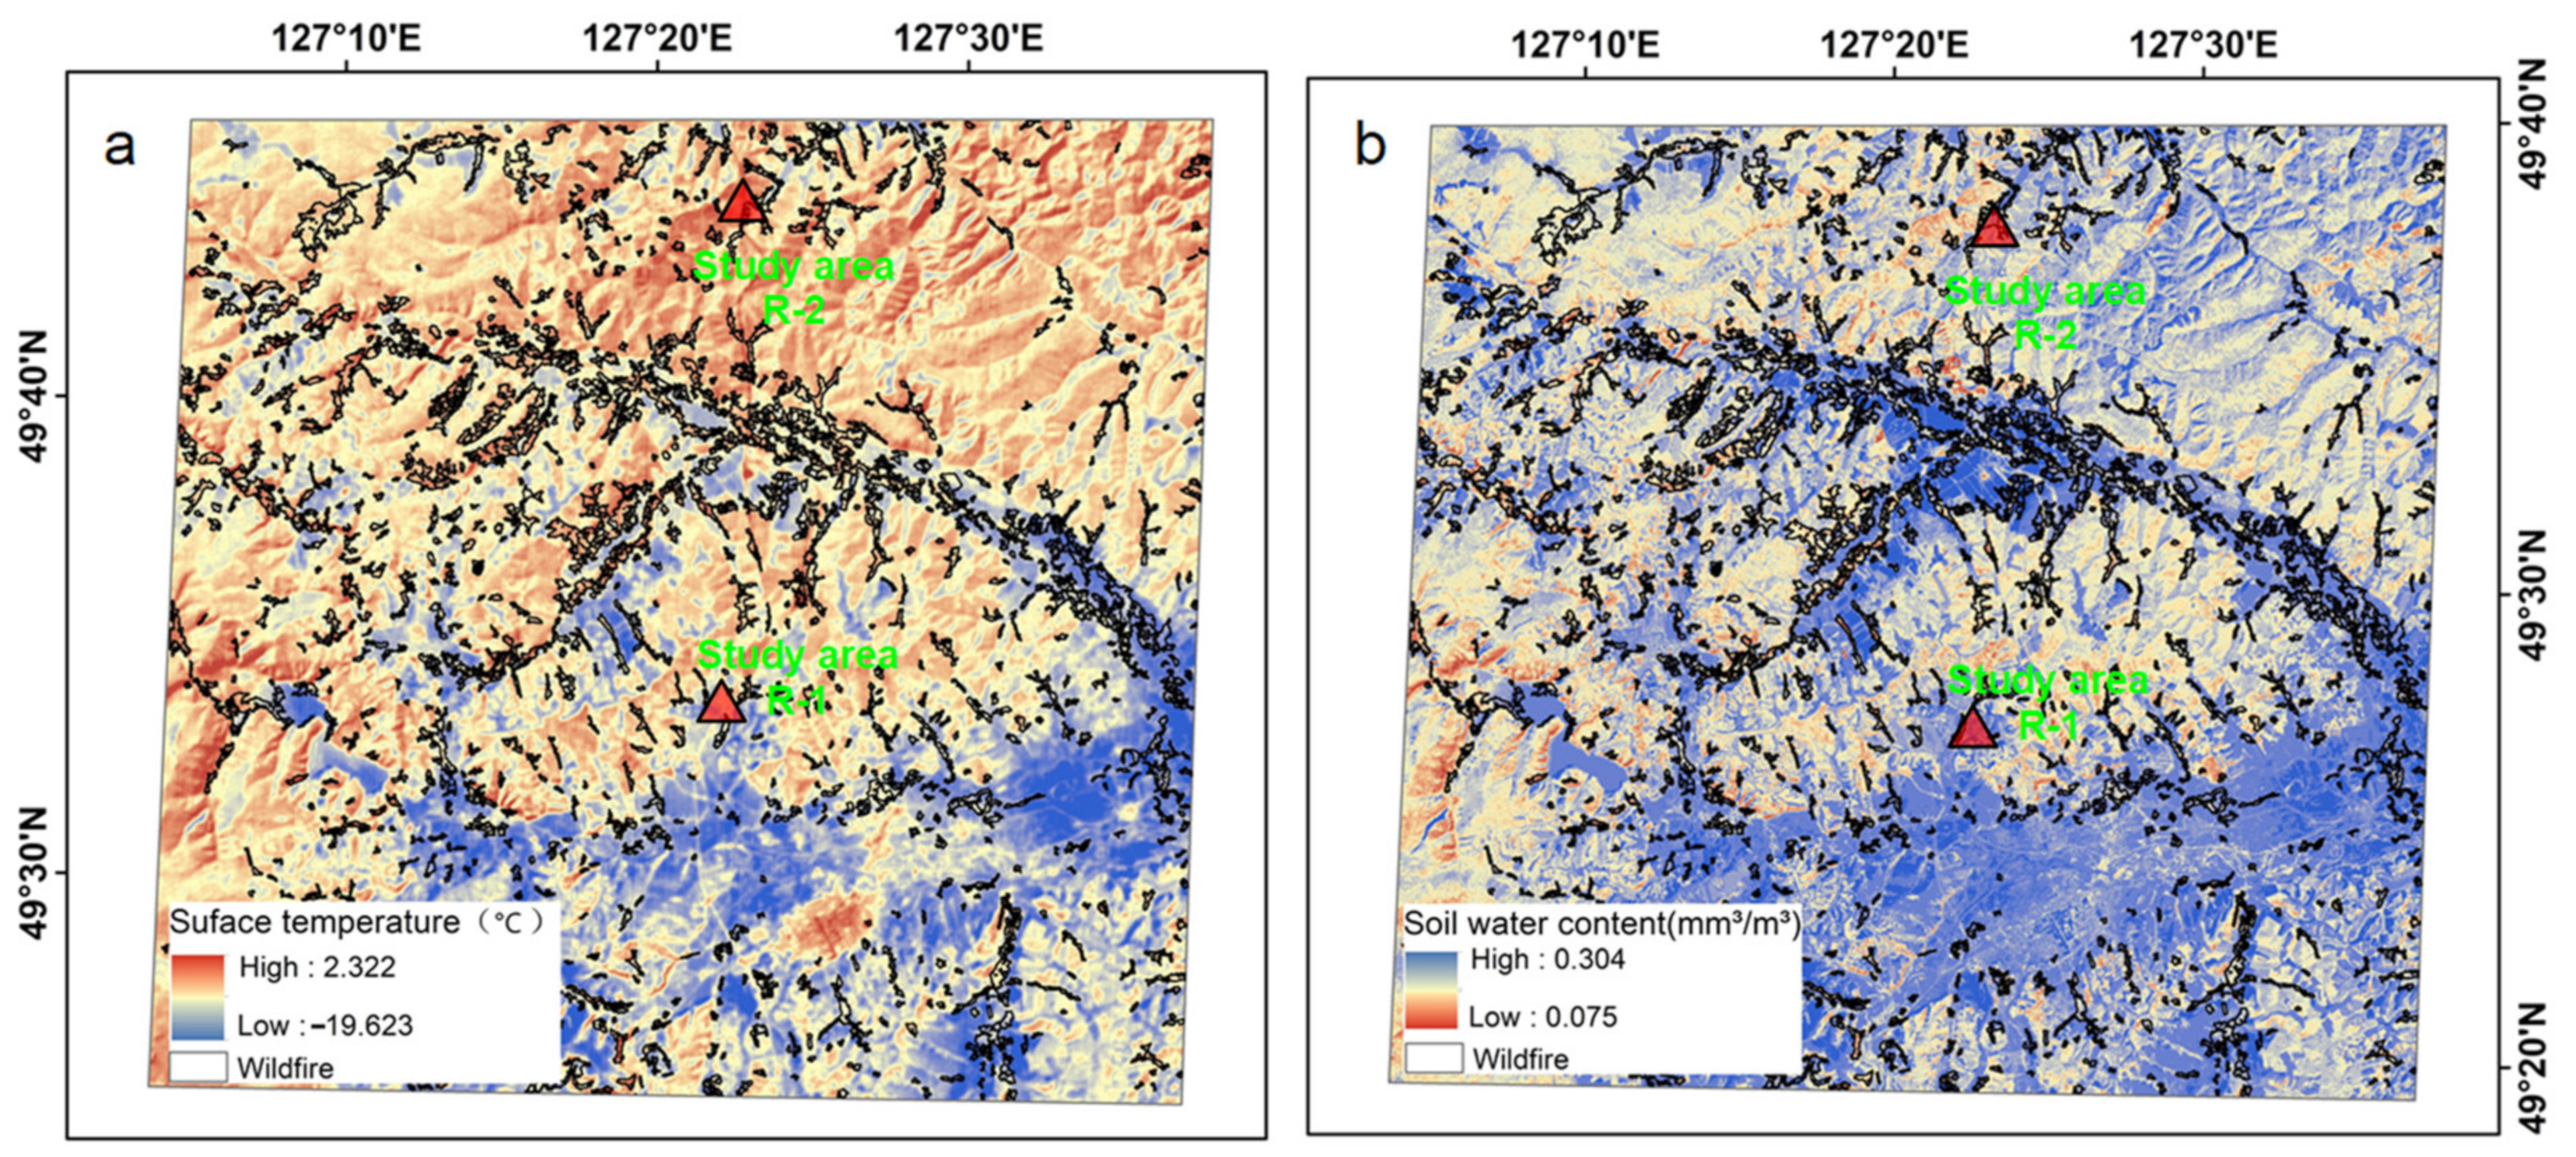
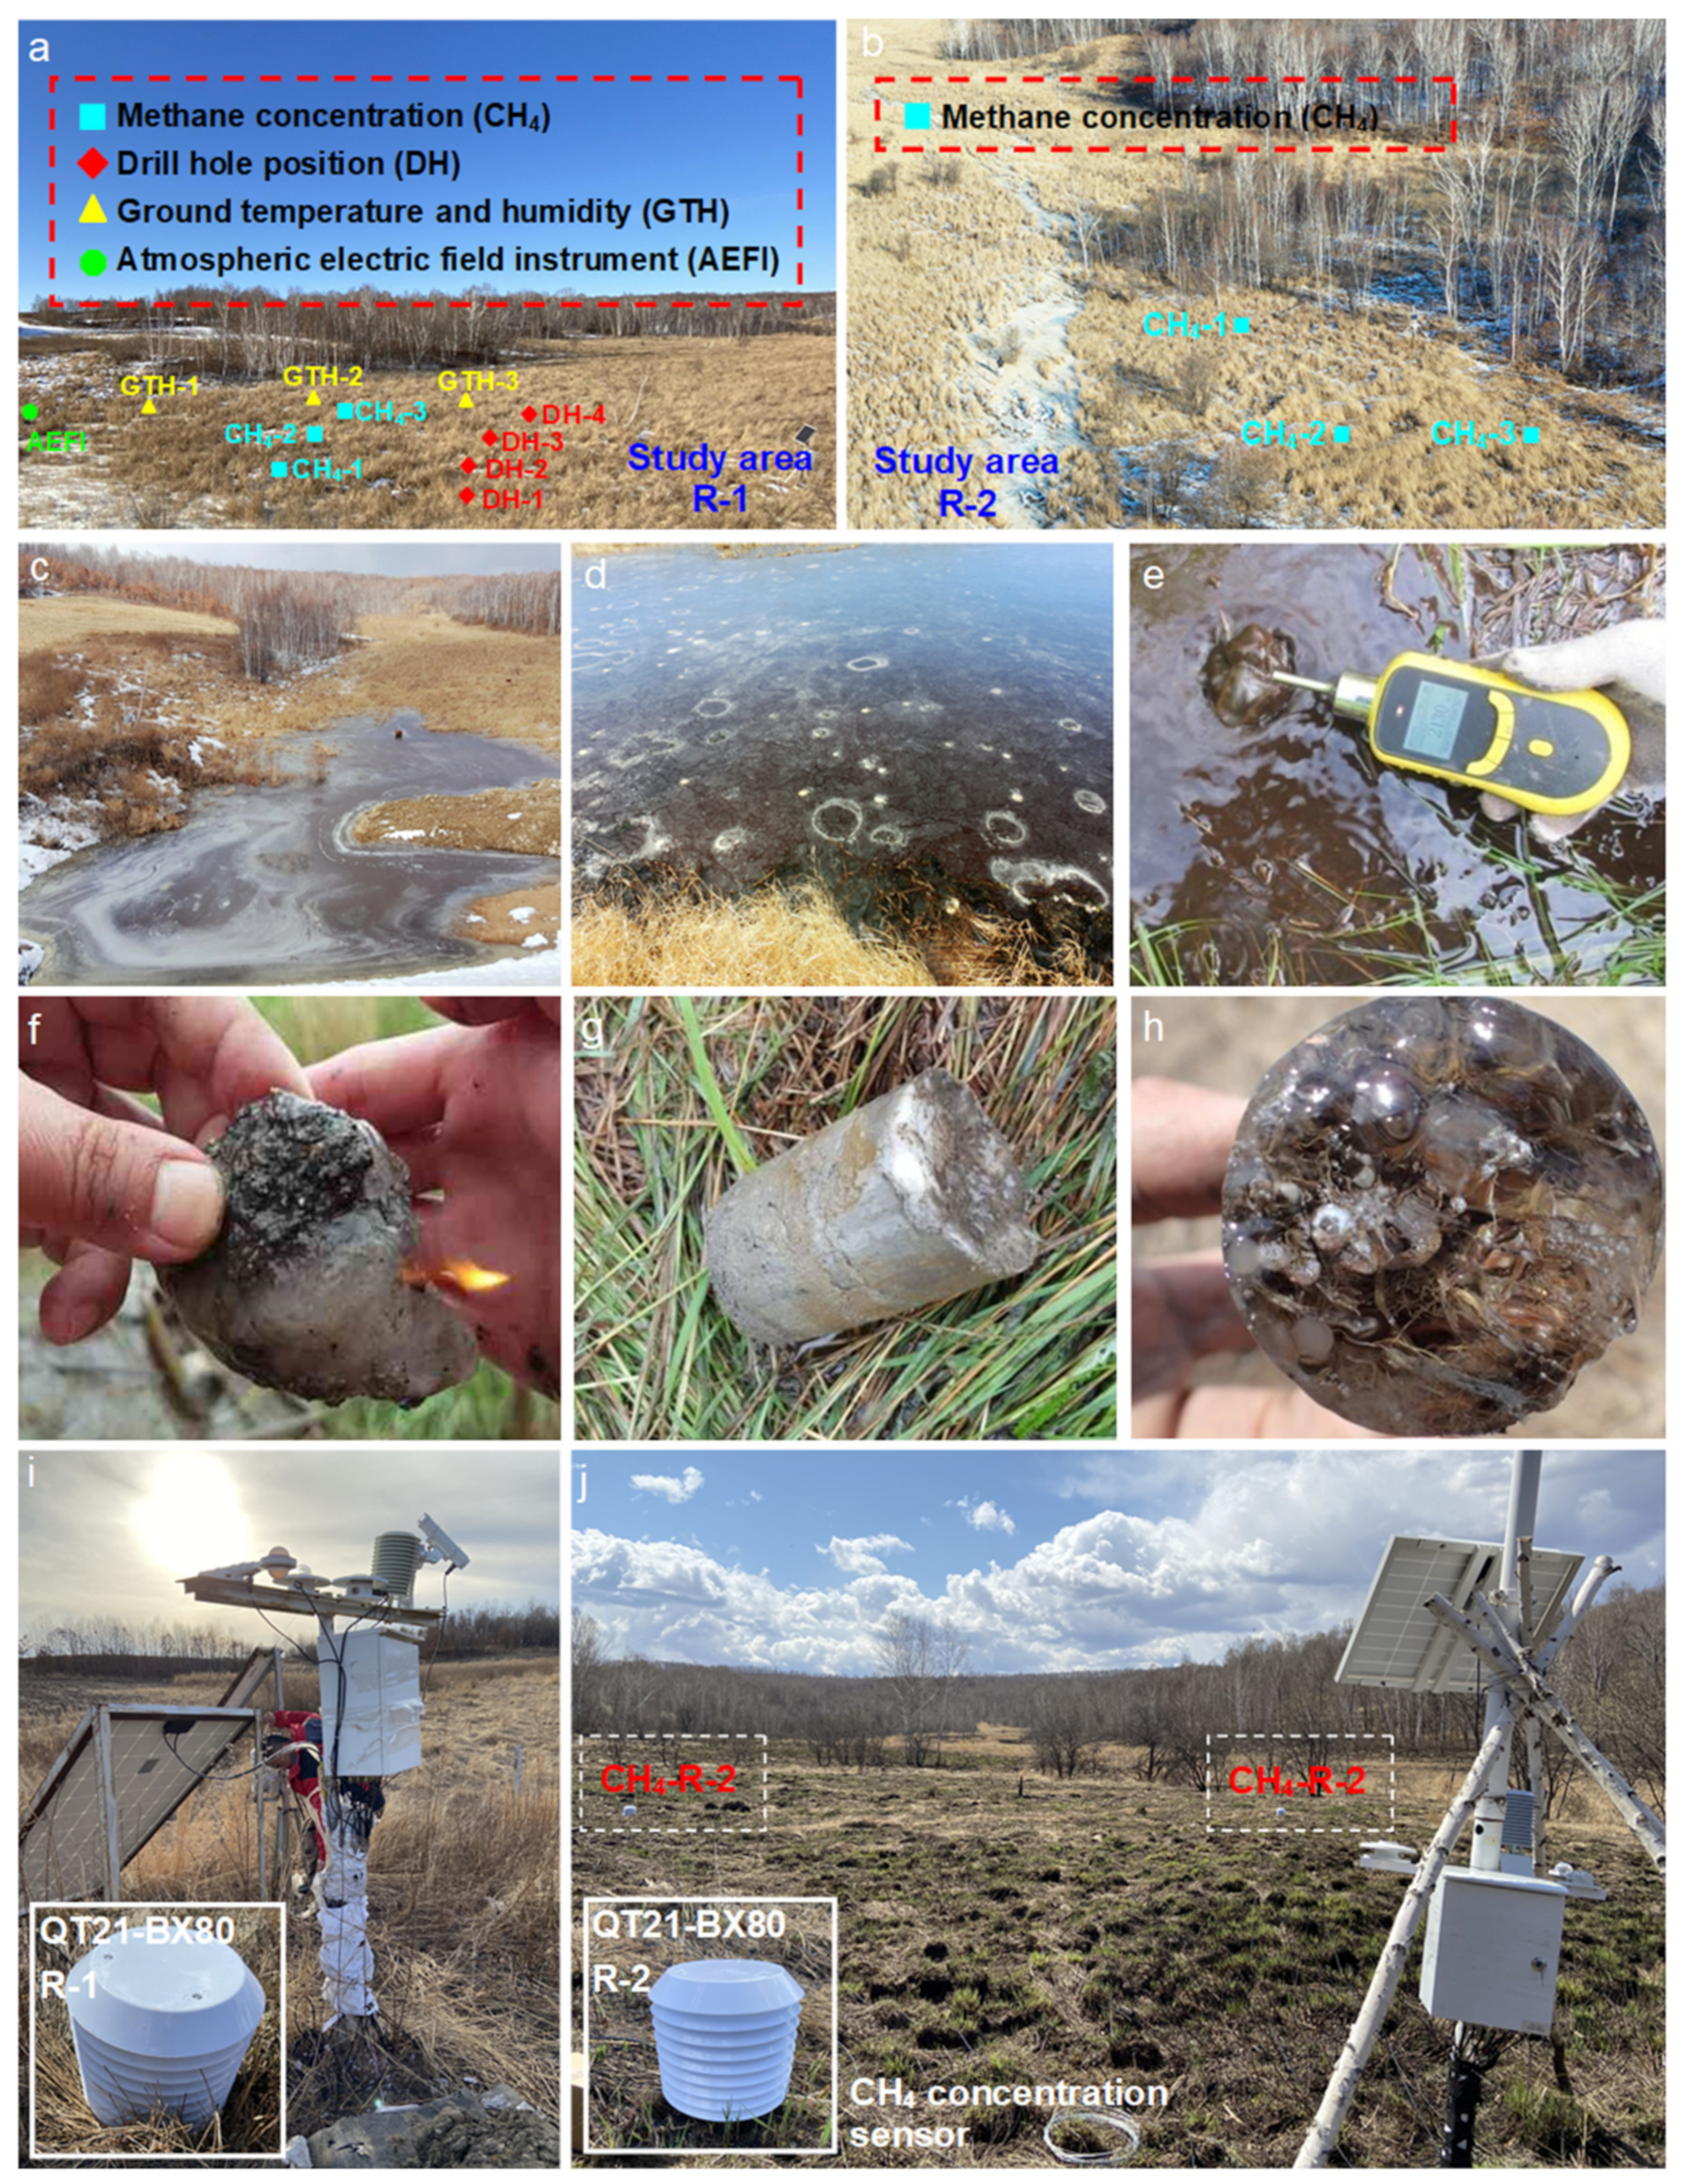
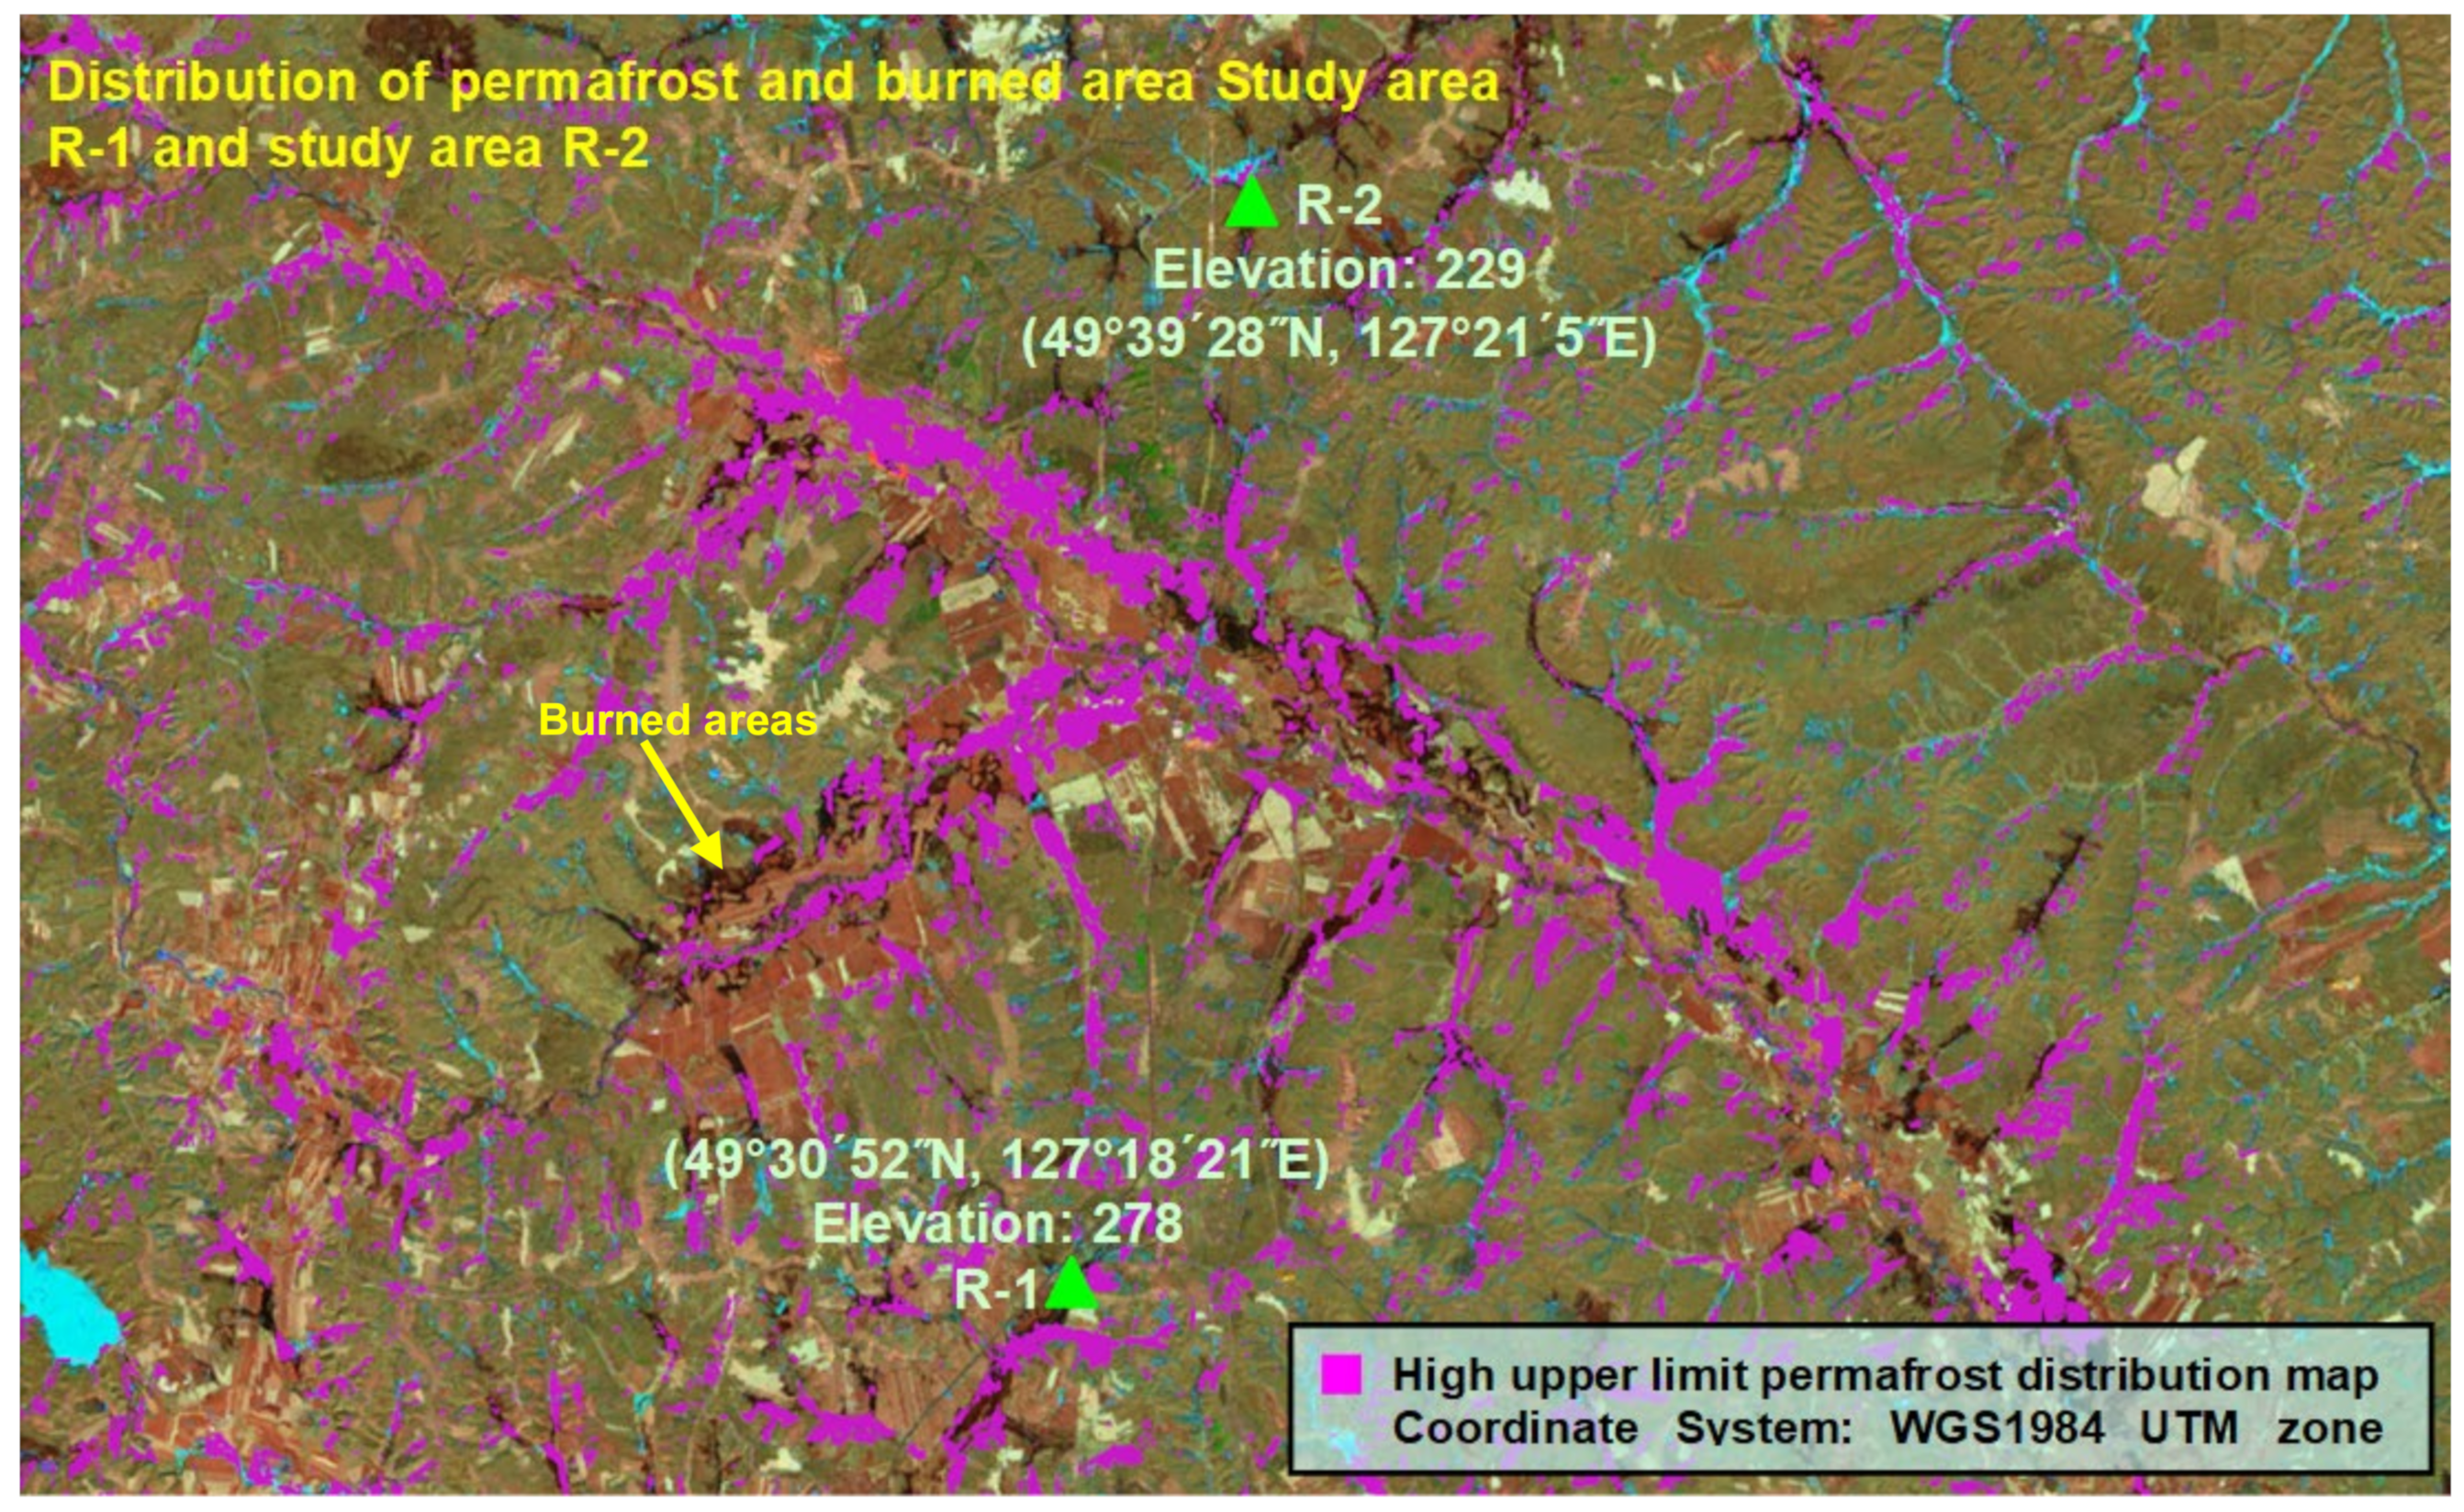
2. Study Area Descriptions

In this paper, the permafrost swamp area of the K153–K183 section of the Bei’an-Heihe Expressway in the Xiao Xing’an Mountains on the edge of the Sunwu-Jiayin basin in China (to the north, this area is connected with the Breya-Gaya basin in Russia) was selected as the study area; its geographical location is between 49°30′57″ N and 49°41′50″ N and between 127°17′31″ E and 127°21′24″ E. In the vicinity of the study area, many wildfires occur in the humid swamp and wetland regions every spring, even though the burning areas include plant residue floating on water bodies (Figure 1b–d), as shown in Figure 1. This area contains low mountain and hilly landforms, with an elevation of 110–755 m. In high-elevation areas, cold temperate coniferous forests and broad-leaved mixed forests can be found. Thick peat soils are distributed on the land surface in this region. Swamp wetlands and permafrost are mostly distributed in relatively low-lying areas and flood areas, with thicknesses of approximately 5–10 m. The average ground temperature is −0.5~−5 °C, and the melted permafrost area exceeds 80%. In the low-lying swamp wetland area, the surface vegetation is mostly water-loving vegetation such as carex tato, moss, shrubs, and trees, and is densely distributed. The surface layer has accumulated water all the year round. The accumulated water mainly comes from air precipitation and spring water exposed in the mountain. The humus and peat in the surface soil layer are thick, and the thickness is generally between 0.5 and 2.0 m [25,52]. In addition, the area is located in the Xiaoxing’an Mountains, mainly natural forest farms, with less population activities, and is in the fire protection area. The permafrost swamp on the left sides of the k161 + 300~k161 + 900 and k177 + 400~k177 + 800 sections of the Bei’an-Heihe Expressway was selected for analysis in this study; the study areas R-1 (49°30′52″ N, 127°18′21″ E; elevation of 278 m) and R-2 (49°39′28″ N, 127°21′5″ E; elevation of 229 m) were established (parallel options; this region did not affect each other). Monitoring equipment (used to observe parameters including the atmospheric electric field, air temperature, ground temperature, methane concentration, and pore water pressure) was arranged in study area R-1 to monitor changes in relevant parameters since June 2015. In January 2018, monitoring equipment used to record the methane concentration and air temperature was added in study area R-2 to monitor these parameters in real time.
In this paper, we adopted a meteorological monitoring system (http://www.qixiangshuju.com) (accessed on 1 June 2021) and a ground soil physical parameter monitoring system (http://www.hzjly.cn) (accessed on 28 May 2021) to monitor meteorological data in real time on site. In January 2009, a monitoring system was set up in study area R-1, and in January 2019, a monitoring system was set up in study area R-2. The meteorological station model was GD24-YCXQ; this model is mainly composed of a data acquisition host, data analysis system, data transmission system, Internet of Things sensors, general packet radio service (GPRS) wireless transmission system, and solar power supply system. As the meteorological element values changed, the output power of each sensor element also changed, and the data collector controlled by the central processing unit (CPU) collected data in real time. Following the linearization and quantification processing steps, the data were converted from process quantities to element quantities, and then the data were filtered to obtain the value of each meteorological element. The ambient temperature of the meteorological station ranged from −30~70 °C, and 64 GB of data were stored each hour. This system mainly included a land surface methane concentration sensor (QT21-BX80-CH4) and an air temperature sensor (GD51-KWSY). For the methane concentration sensors, the measurement range was 0~1000 ppm, the measurement accuracy was ±1% (F.S.), the resolution was 0.1 ppm, the temperature range was −25~45 °C, and the observation position was located on the land surface. For the air temperature sensors, the measurement range was −30~120 °C, the measurement accuracy was ±0.2 °C, the resolution was 0.1 °C, the working temperature range was −40~75 °C, and the observation position was located 1.3 m above the land surface. In the ground soil physical parameter monitoring system, a soil pore water pressure sensor (KXR-3034) and a soil temperature and humidity sensor (HJ6-FM-TWB) were used to monitor the relevant parameters. The soil pore water pressure sensor was a vibrating wire pore water pressure sensor; the measurement range was −1.0~1.0 MPa, the measurement accuracy was ±0.05% (F.S.), the resolution was 0.01 kPa, and the temperature range was −25~60 °C. The pore water pressure sensor used a 4~20-mA output, and the output current signal was converted into actual pore water pressure values. The formula used to calculate the KXR-3034 vibrating wire pore water pressure is shown in Equation (1), where P is the pressure value measured by the pore water pressure sensor (MPa), K is the sensitivity coefficient (MPa/Hz2, with values of 1.229, 1.181, and 1.001), f0 is the initial frequency value (with values of 1684.3, 1436.3, and 1207.6), fi is the working frequency value, and the observation position is 1 m below the land surface.
P = K f i 2 f 0 2
The soil temperature and humidity sensor had a measurement range of −30~120 °C (under humidity conditions of 0~100%), measurement accuracies of ±0.2 °C (±2% under humidity conditions of 0~50% and ±3% under humidity conditions of 50–100%), a resolution of 0.1 °C (±0.1%), and a working temperature range of −40~75 °C, the instruments were buried at depths of 0.5 m (No. 1), 1 m (No. 2), and 1.5 m (No. 3). In addition to the methane concentration sensor, we also used an SKZ1050-CH4 handheld methane detector to detect the methane concentrations on the land surface within the study area. The measurement ranges of this instrument included a lower explosive limit (LEL) of 0~100%, a measurement accuracy of ±2% (F.S.), and a resolution of 0.1% LEL.
An EL-EFM1.0 atmospheric electric field instrument was used to monitor the atmospheric electric field within a 15 km radius near the study area. This instrument was directly installed on the ground and monitored the thunder cloud electric charge (or atmospheric electrostatic field strength). The sensitivity of the atmospheric electric field instrument was less than 50 V/m, the electric field resolution was less than 5 V/m, the response time was 1 s, the working temperature was −40~70 °C, the working humidity was 0~100%, and the observation position was located 1.5 m above the land surface.

3. Results

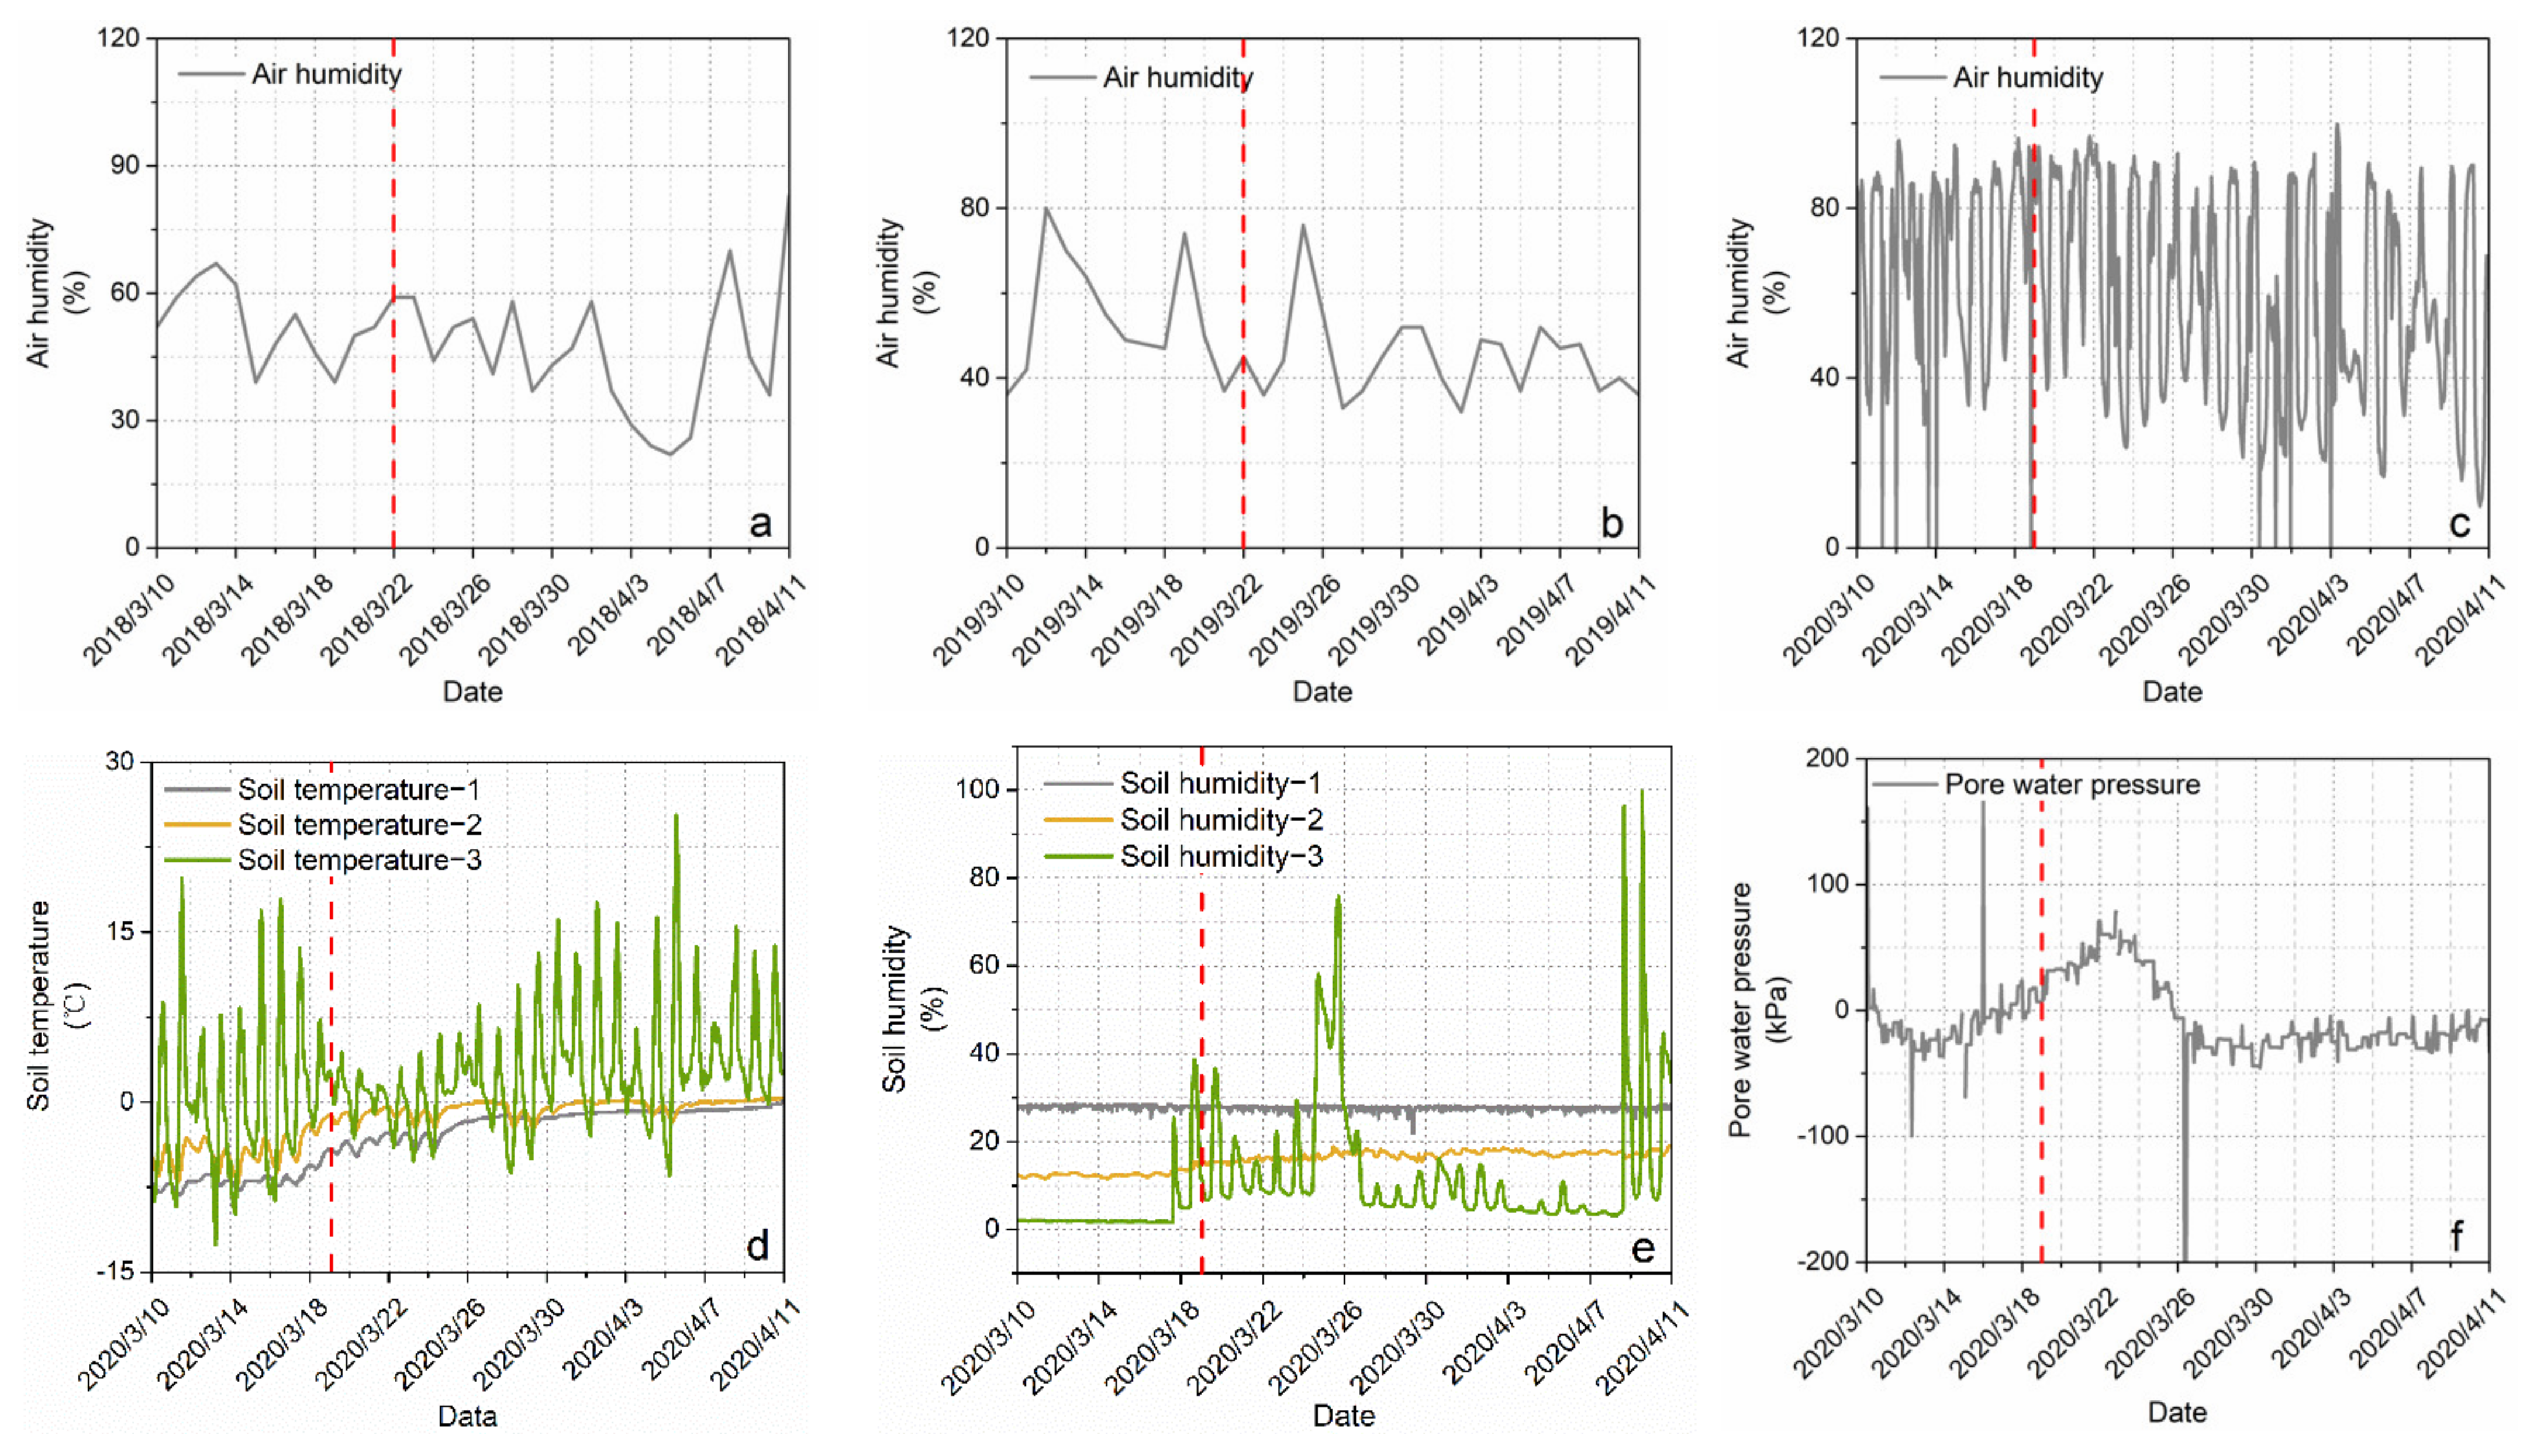
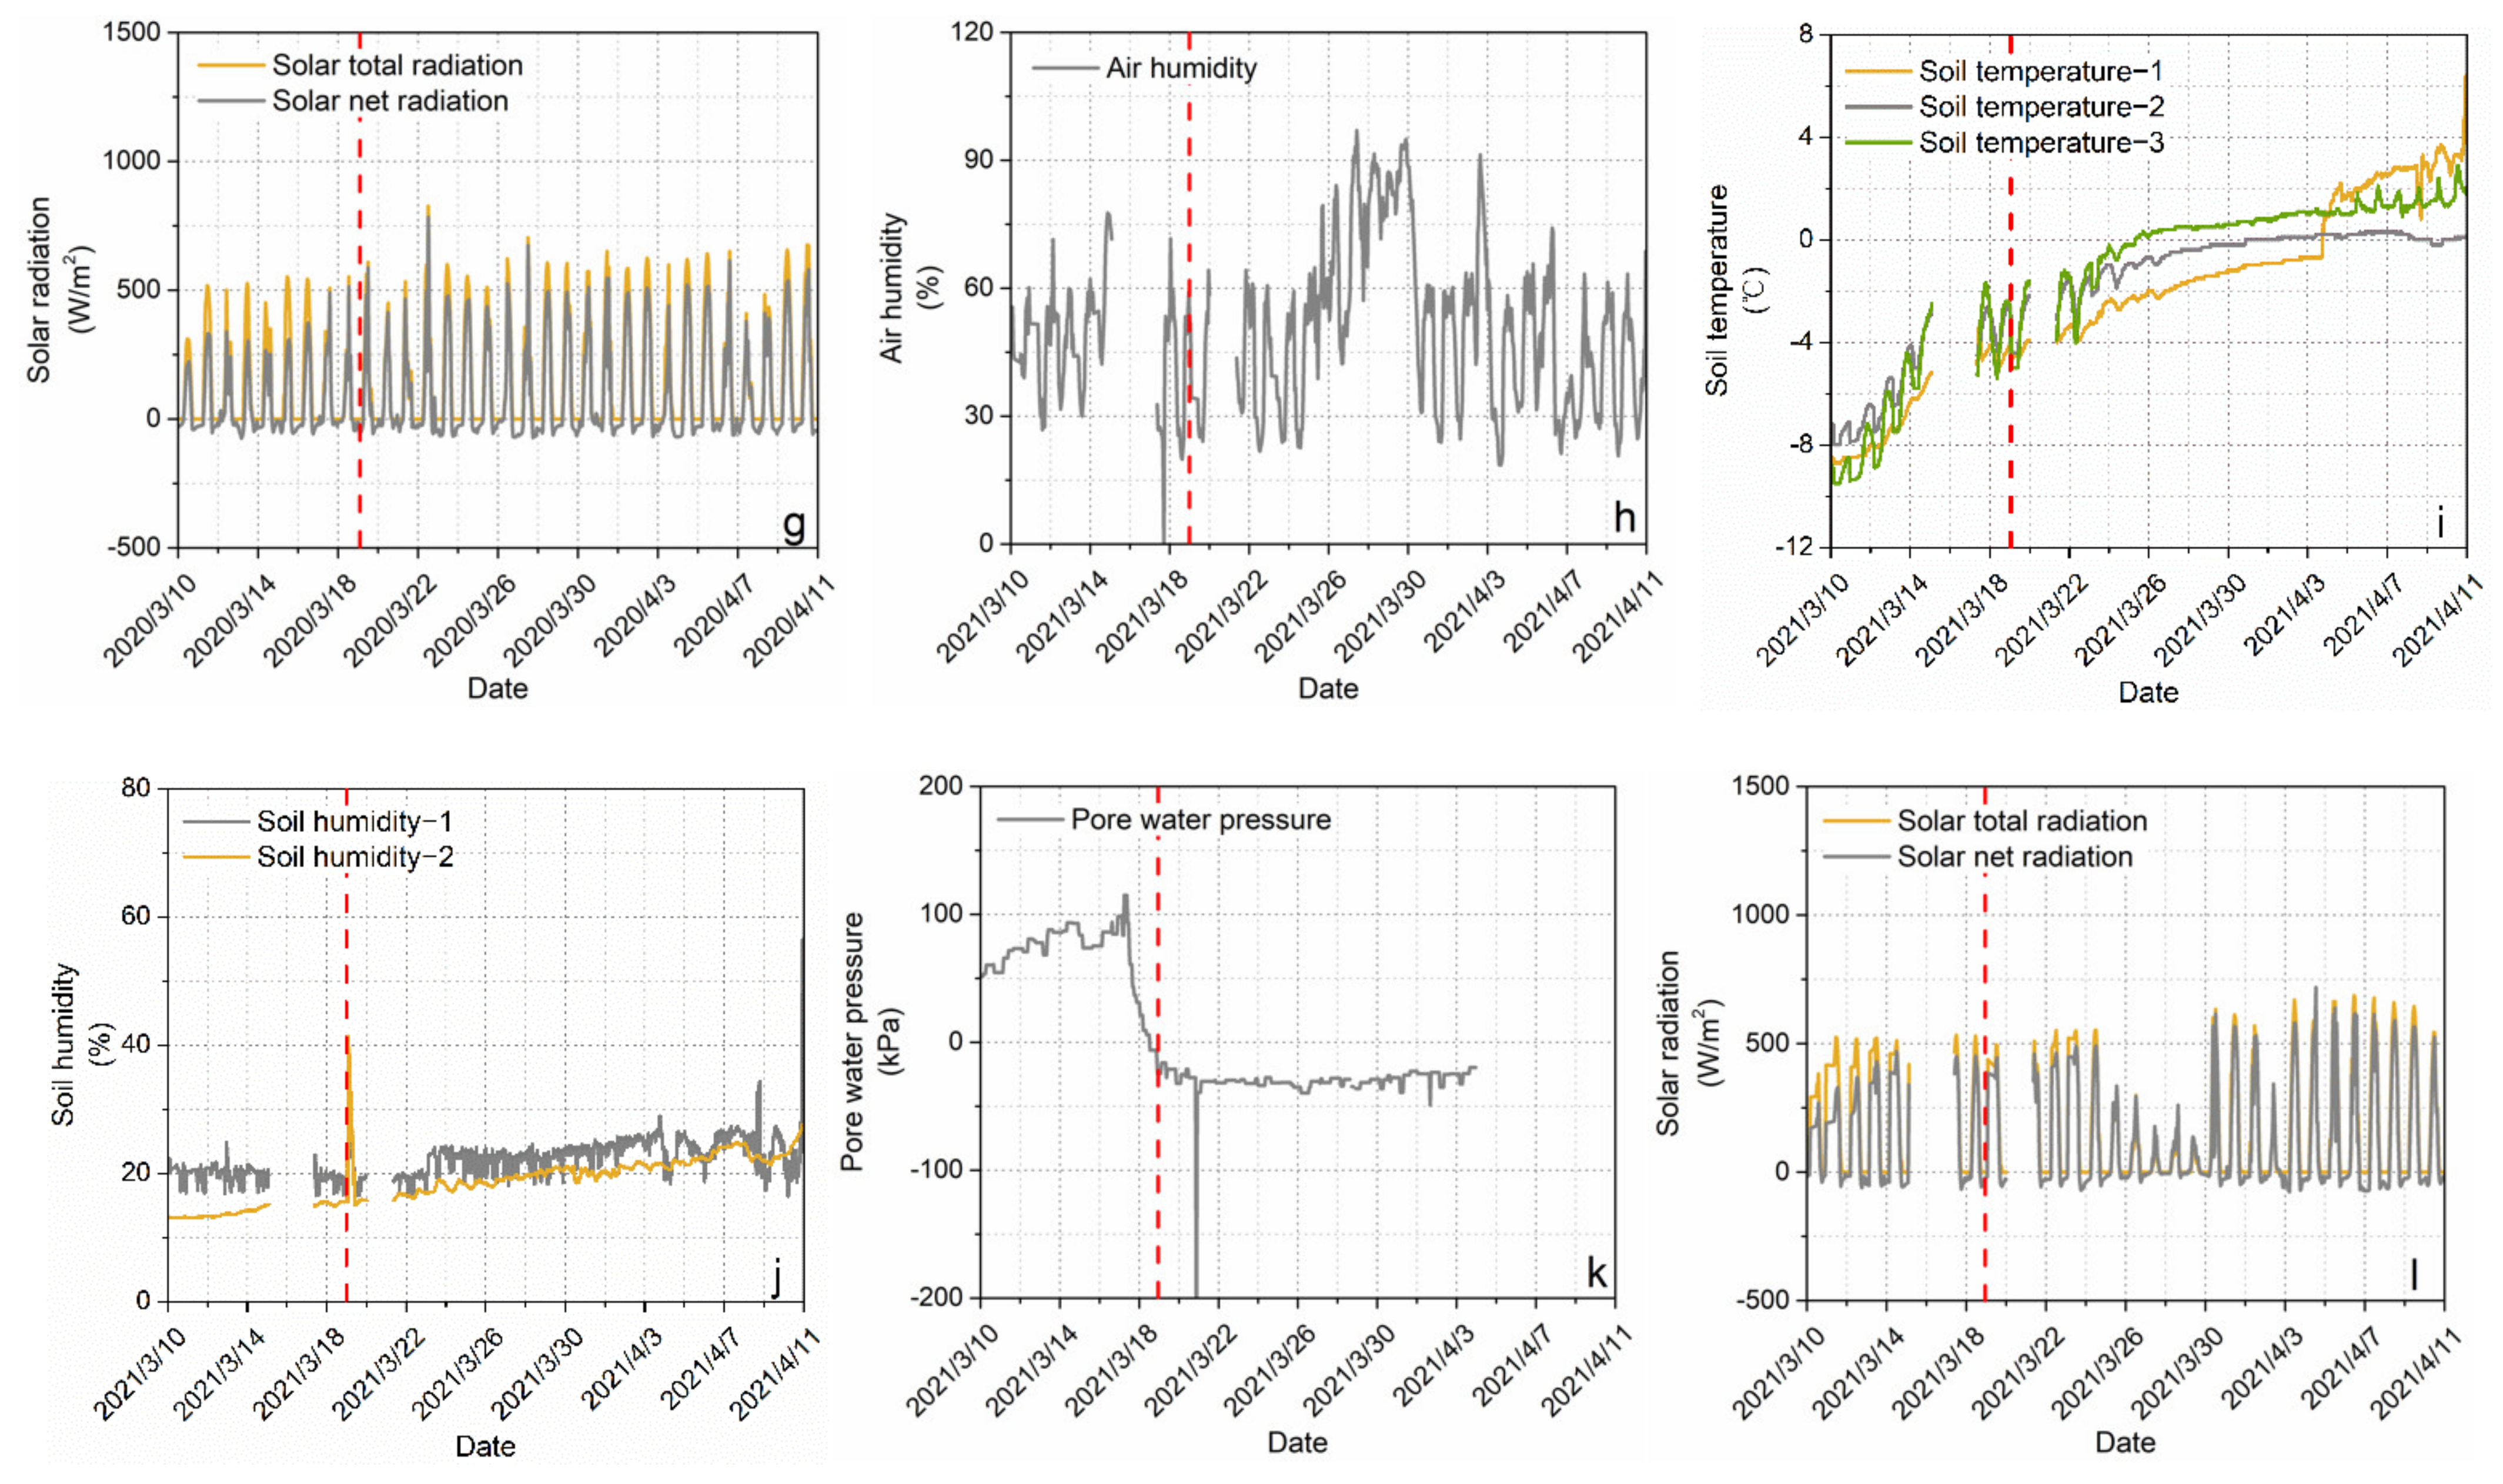
3.1. Methane Emissions from Permafrost Regions in Northeast China

We obtained remote sensing images of burned areas, land surface temperatures, and land surface humidity conditions near the study area through the use of remotely sensed data (Figure 2). The combustion areas were mostly concentrated in the low-lying swamp wetland areas with low land surface temperatures (blue areas) and high humidity (blue areas) rather than in the areas with high air temperatures and low humidity. Therefore, air temperatures and humidity are not the main factors causing wildfires in swamp wetlands within degraded permafrost areas in Northeast China. Owing to the comprehensive influence of climate, terrain, vegetation, and other factors, the distribution of permafrost in the high-latitude area of Northeast China is characterized by low-lying and shady slopes, and the degradation of this permafrost decreases from high to low temperatures and from sunny slopes to shaded slopes [25]. Among these variables, the air temperatures in Northeast China exhibit an overall upwards trend, the thickness of the permafrost layer in valley swamp wetlands in the study area has gradually decreased, and the degradation rate has accelerated significantly since 2004 [25]. The carbon pool stored in the permafrost layer in the lower swamp wetlands has gradually been disturbed and entered the atmosphere in the form of methane gas (see video-5 and video-6).
Through on-site monitoring and drilling, we found that many methane gas leakage points (as shown in Figure 3) appear when the frozen layer gradually thaws each spring. The methane concentrations are very high at these leakage points, and owing to the isolation of the frozen surface in permafrost areas, most of the methane cannot be immediately released into the atmosphere in winter [22]. In the thawing season of the following year, the methane is expected to be released over a very short time, thus forming an emission explosion (at this time, the methane concentration at the leakage point is greater than 10,000 ppm, reaching the upper limit of the SKZ1050-CH4 methane handheld detector, and the igniting gas at the leakage point can form flames with heights of 1.5 m). Therefore, the methane gas concentrations at these points are very high, and the emission pressures are also high. This methane gas mainly includes in situ microbially produced methane, methane transported by wetland groundwater, methane hydrate stored in the frozen layer, and thermogenic methane produced at underground depths (e.g., at coal seams).
We monitored the methane concentrations on undamaged natural land surfaces and found that methane gas emissions change seasonally. The annual methane gas release process can be mainly divided into three stages, including a high-concentration, short-term emission stage (March to May); a high-concentration, long-term stable emission stage (June to August); and a very-high-concentration, short-term emission stage (September to November), as shown in Figure 4. In the process by which methane gas migrates, the pressure gradient is an important driving force. The size of the pressure gradient directly determines the speed at which methane gas enters the atmosphere through the soil layer. When methane gas enters the atmosphere, the difference between the pore water pressure and atmospheric pressure determines the speed at which the methane gas enters the atmosphere; that is, when the atmospheric pressure is small and the pore water pressure is large, methane gas may enter the atmosphere more easily. In addition, when the surface layer gradually freezes in winter, suction is generated, and the suction causes the water in the unfrozen soil to be attracted to the freezing front along the temperature gradient and freeze to form segregated ice, thus creating suction and dehydration processes at different locations, and this suction also accelerates the transport of methane gas.
Compared with the air methane emission law of the Qinghai Tibet Plateau (Waliguan), it is found that the annual air methane concentration on the Qinghai Tibet Plateau has obvious bimodal seasonal variation characteristics. The first peak appears in summer and the second peak appears in winter. In the study area, the largest total methane emission is in summer, which is consistent with the observation results of Waliguan. However, the maximum surface methane concentration occurs in spring, while the total methane emission and concentration in autumn and winter are relatively small [25].
From March to May each year (during the high-concentration, short-term emission stage), as the snow on the ground melts, the maximum annual land surface methane concentrations appear. The high concentrations of methane gases entering the land surface at this stage may be an important factor leading to differences in the frequency of seasonal wildfires, the peak seasonal wildfire seasons occurring in spring and autumn, and the monthly maximum seasonal wildfire activity occurring in spring in the permafrost zones in Northeast China and Southeast Siberia [25,41,42,43].
The high methane emission rates measured during the spring thawing period may be caused by several factors: after the generation of methane in winter, the ice blocks the movement of oxygen [53], resulting in insufficient methane oxidation under the ice [54] and the outbreak of methane emissions [26,55]. Many studies have found that wintertime methane emissions are very important, and that wintertime emissions may contribute 2.32~4.62% to the annual methane budget [56]. One previous study even concluded that the contribution of winter methane fluxes to the annual methane budget was 21% [53]. Based on the ground temperature sensitivity of methane emissions in the same area considered herein calculated in a previous study [57], wintertime methane emissions were estimated to account for 18% of the annual budget. After being converted into unit emissions, the wintertime methane average emission rate at the southern edge of the permafrost region in Northeast China was found to be approximately 23% of that in the growing season. The relatively low wintertime methane oxidation also contributes to methane outbreaks. The frozen surface isolates oxygen and prevents the oxidation of methane in the soil. In addition, the methane produced under ice in winter is stored in soil and water, and only a small portion of this methane is oxidized [58,59]; when the frozen surface is completely thawed in the following spring, the stored methane is released into the atmosphere over a short period. The methane emission rate in the spring thawing period can thus reach more than three orders of magnitude greater than the methane emission peak during the growing season [22]. In addition to microbial methane production, methane transported by wetland groundwater, methane hydrate stored in the frozen layer, and thermogenic methane produced deep underground (e.g., in coal seams) also release large amounts of methane gas that are blocked by the soil by the frozen layer.
We further used Sentinel-2 L1C satellite images to obtain the wildfire-burned area on 24 March 2021 in the study area, and compared the wildfire distribution characteristics with the permafrost distribution area (Figure 5). The distribution of wildfires in the spring of 2021 was consistent with the permafrost areas, further confirming the correlation between wildfires and permafrost in the study area.

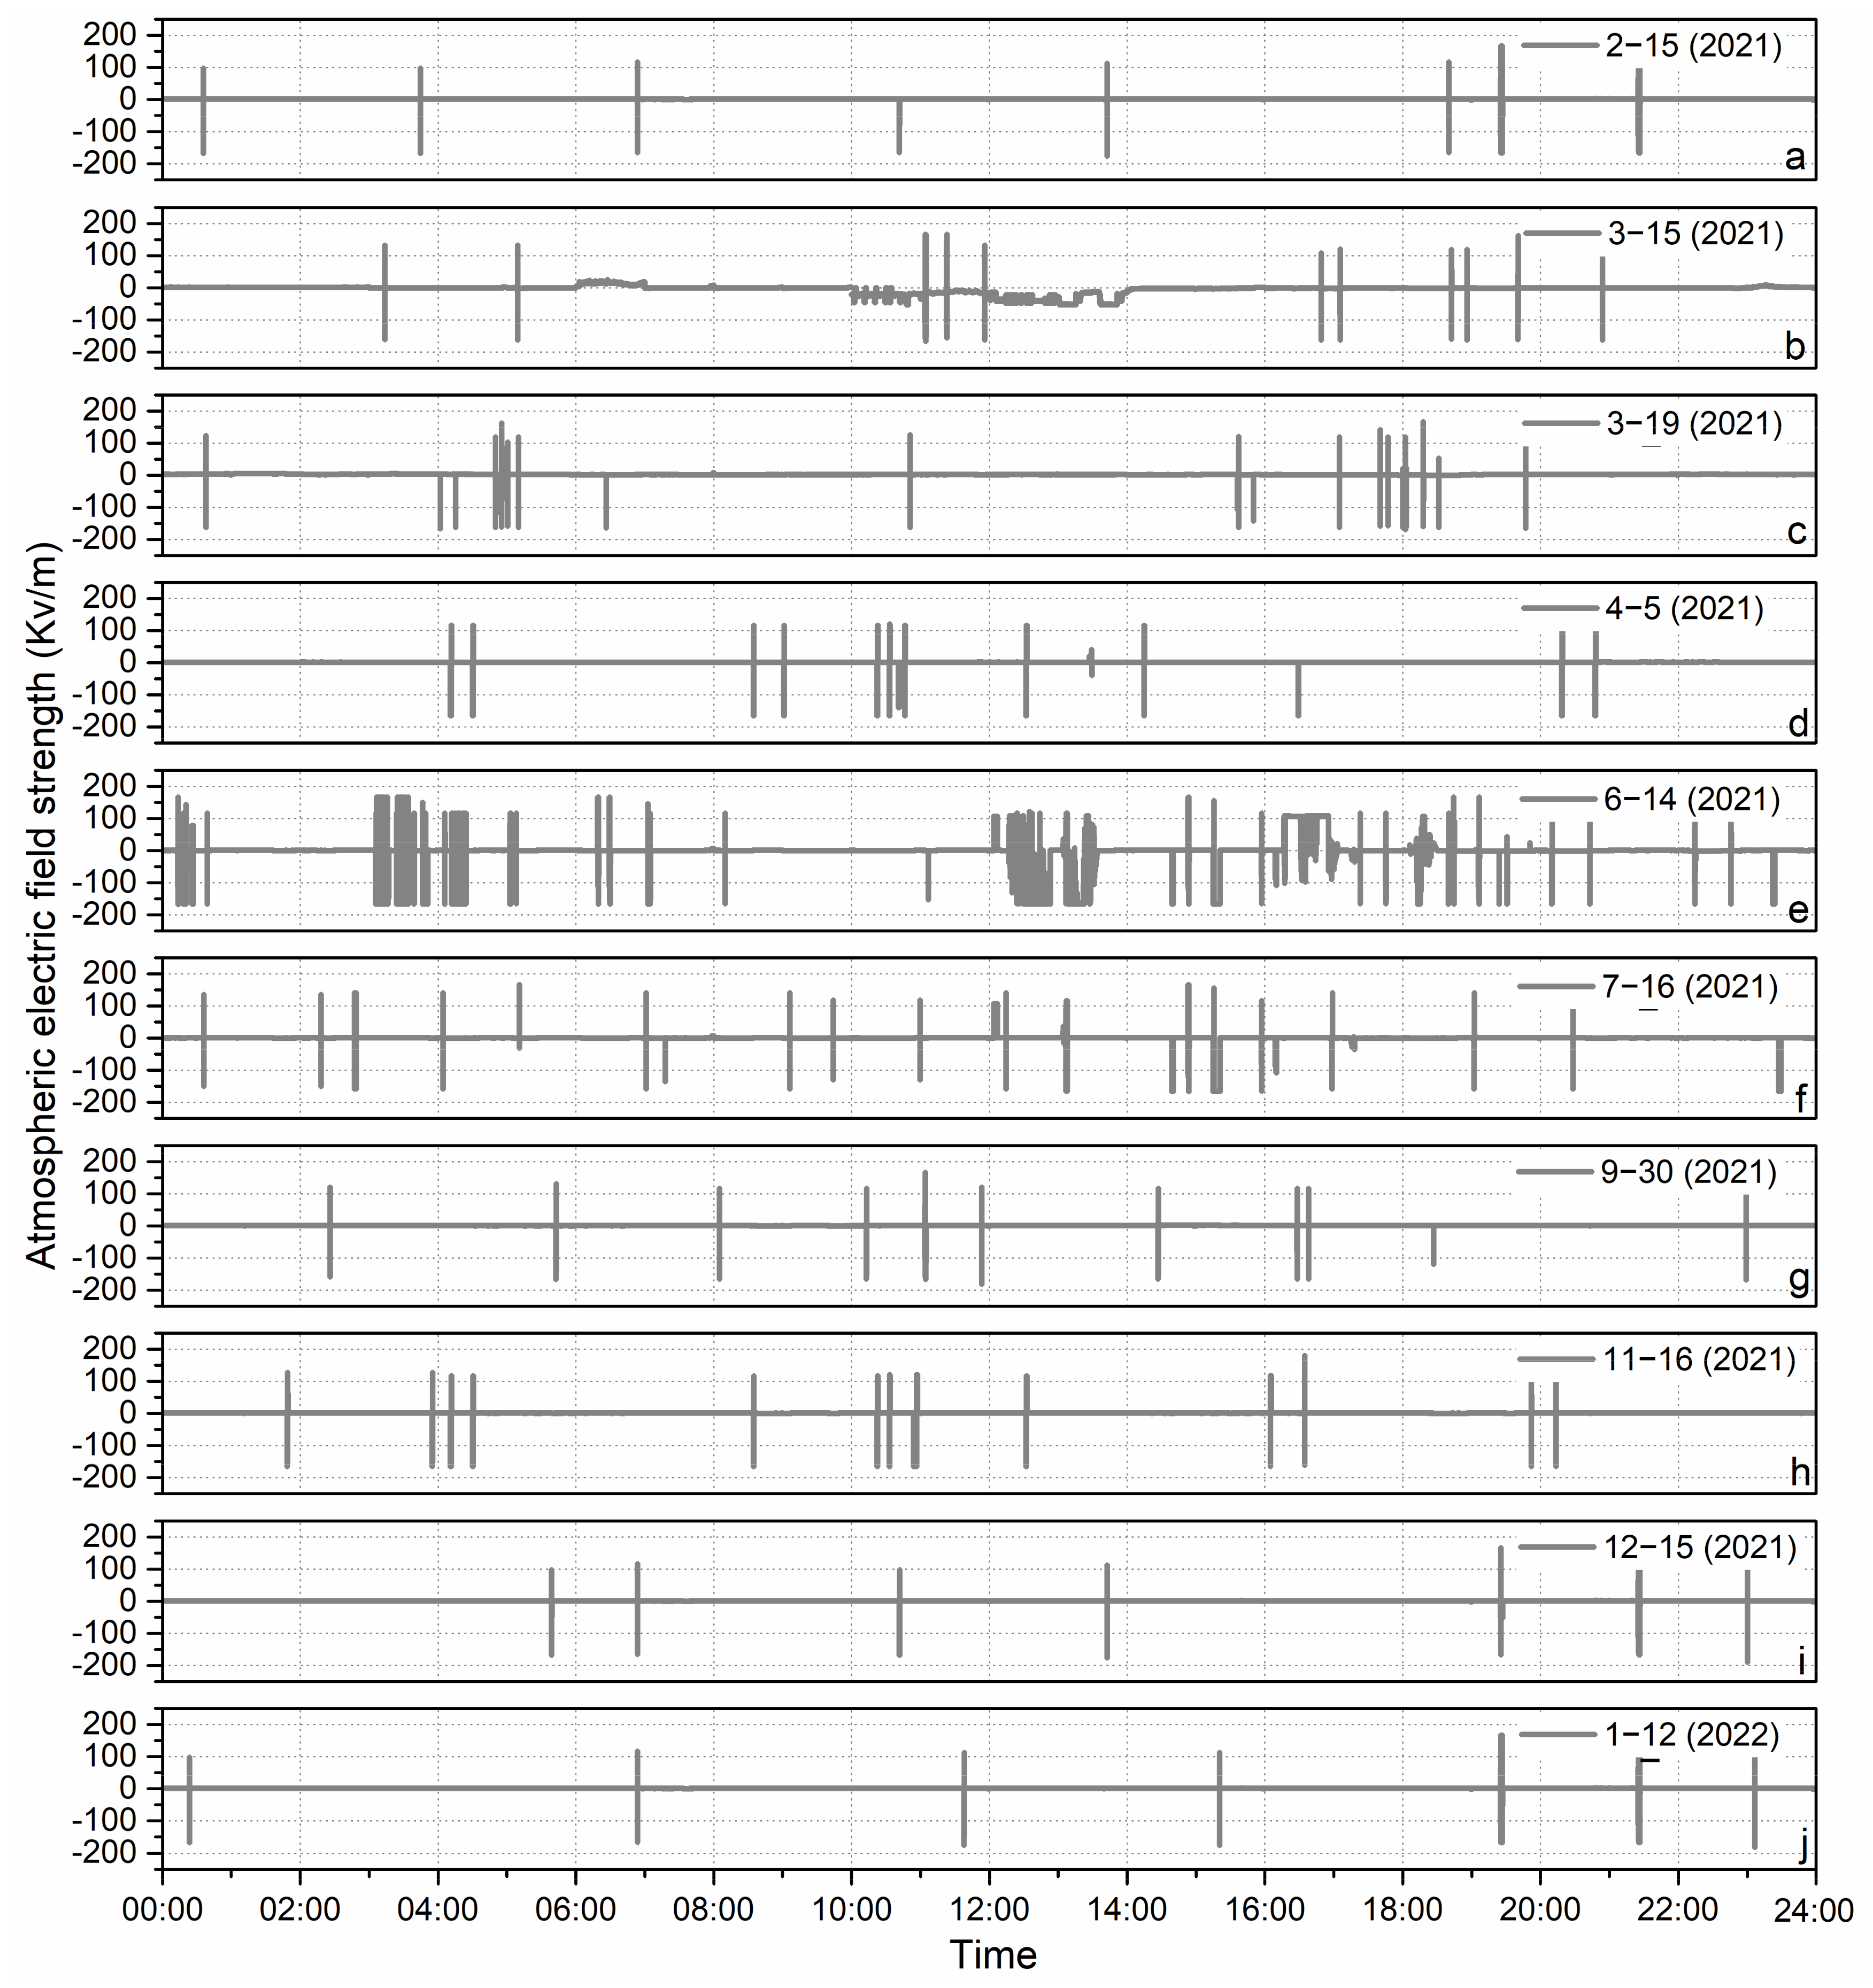
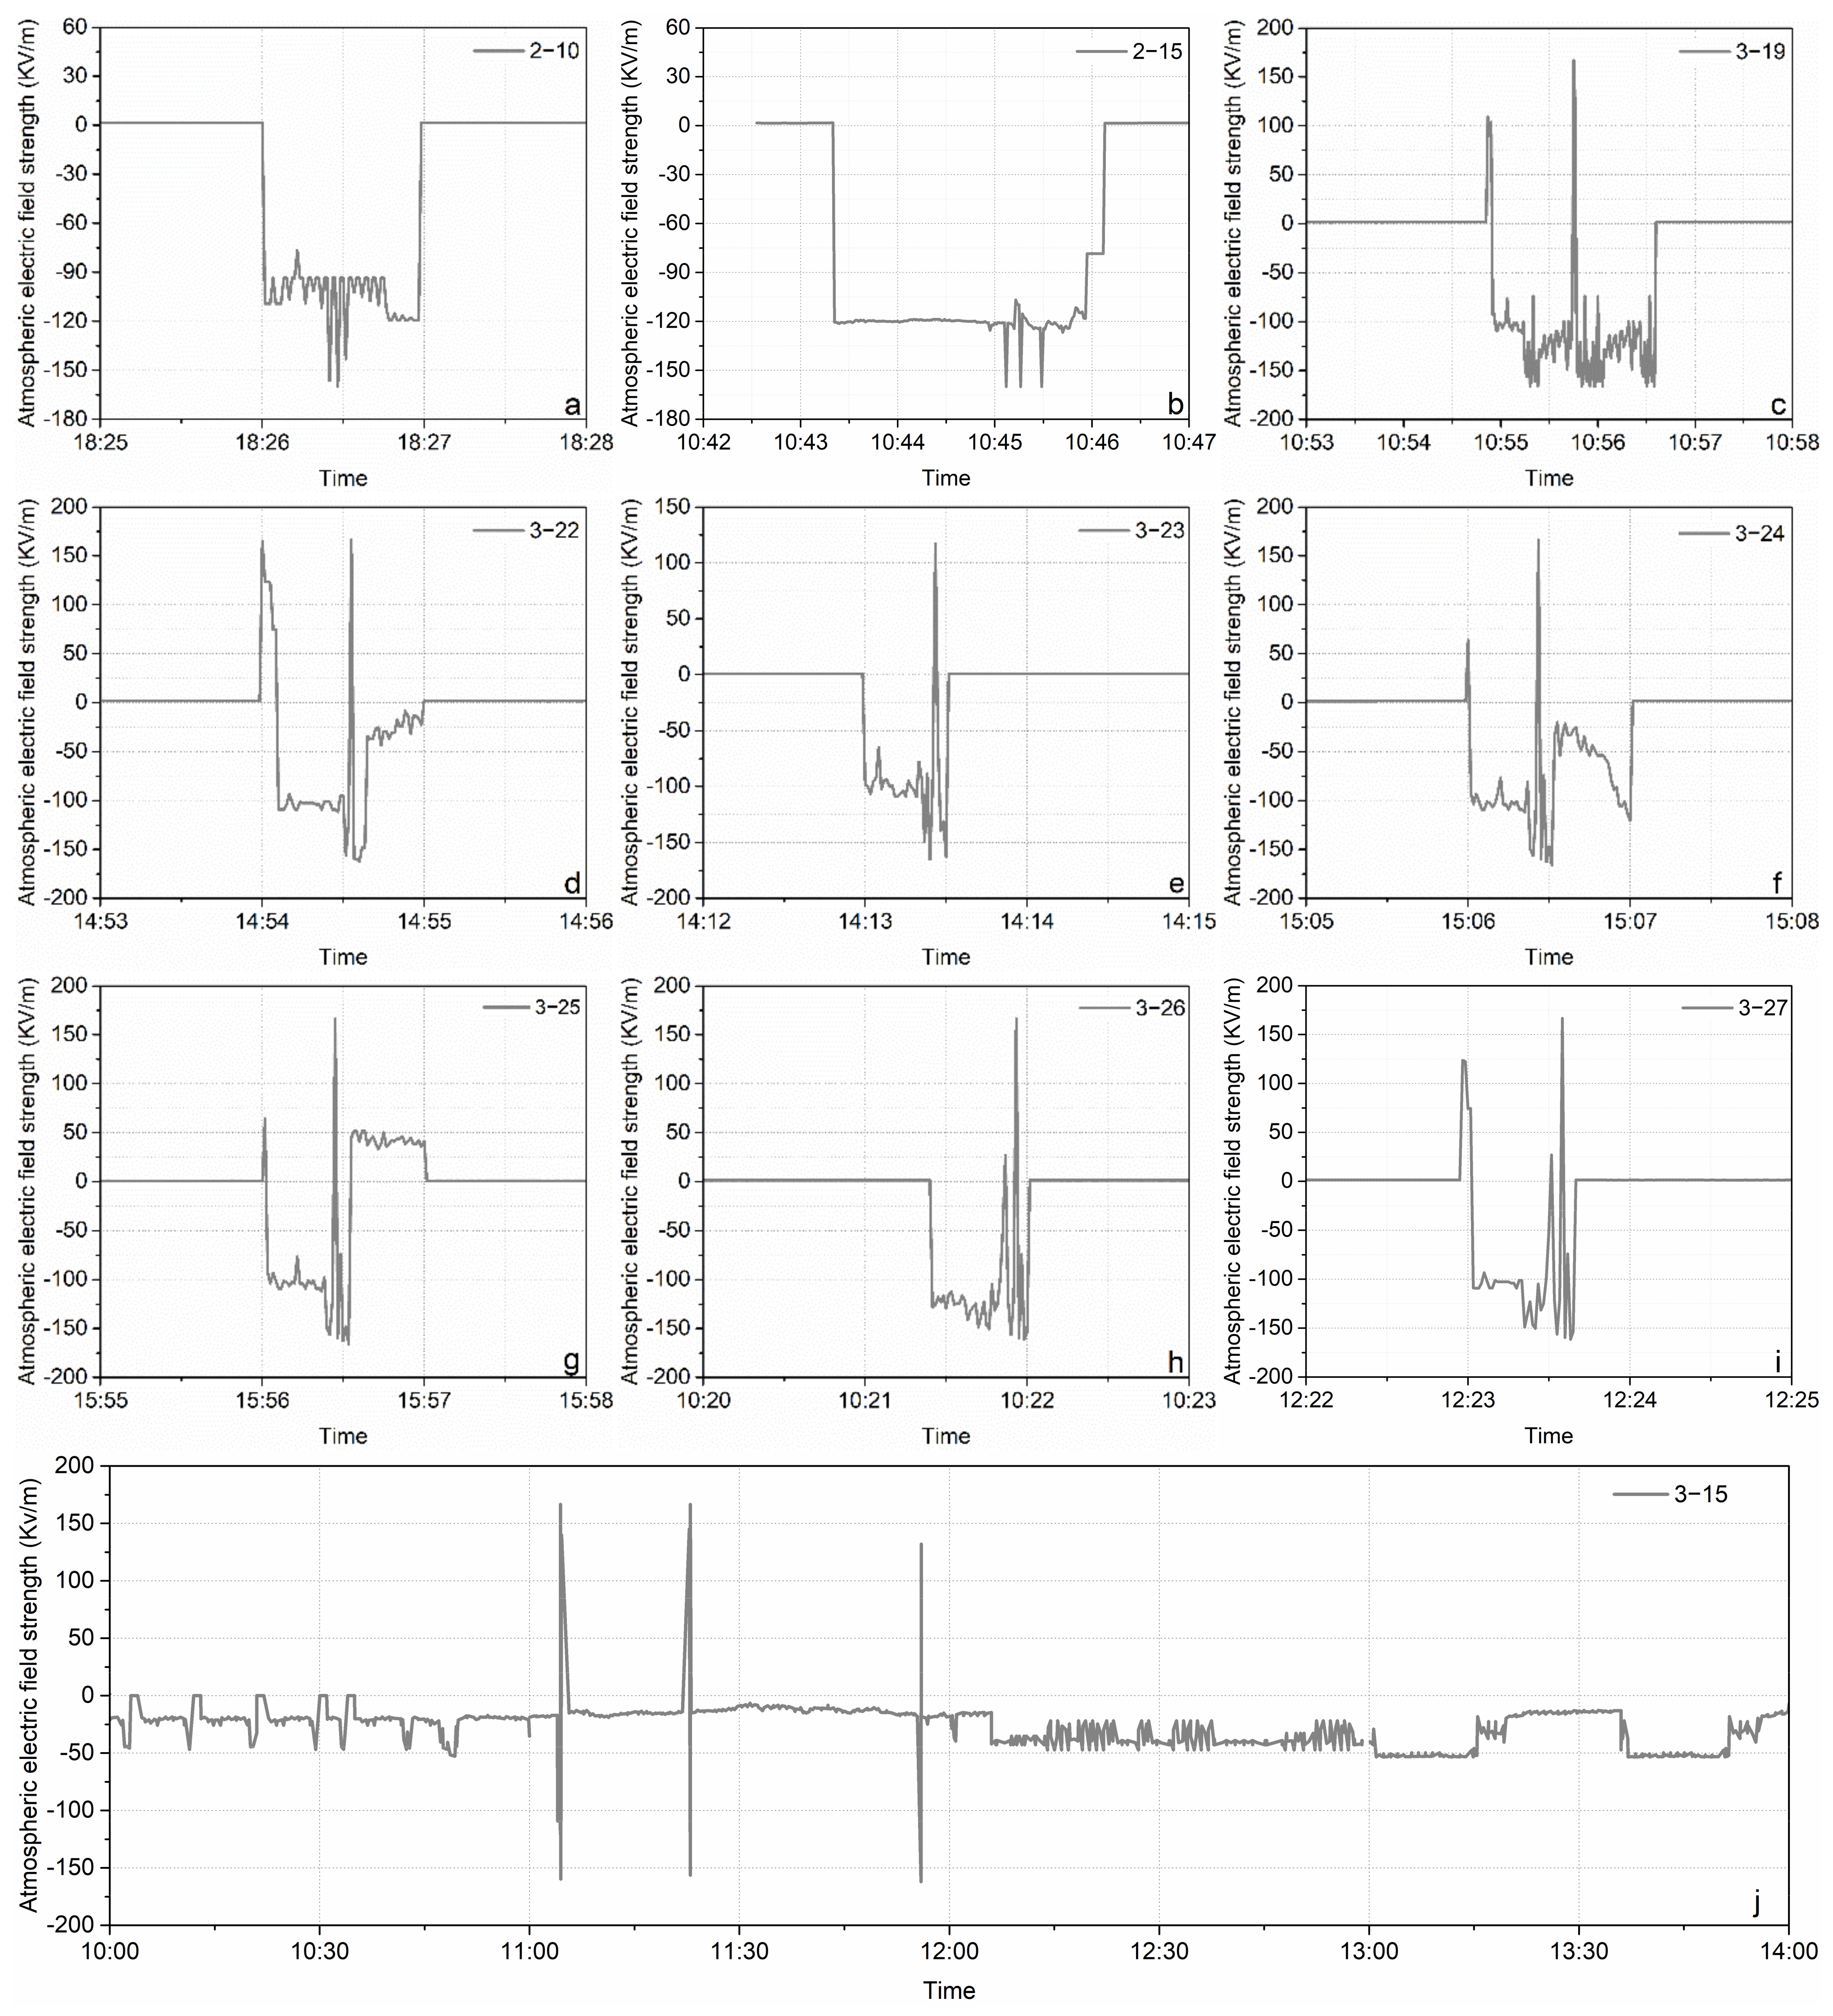
3.2. Atmospheric Electrodischarge and Static Electricity Formation Mechanisms and Near-Surface Atmospheric Electric Fields Associated with the Methane Emission Process in Permafrost Areas

Lightning is an important cause of forest fires. The process by which fires are generated through lightning strikes is related to geographical factors, and the location of lightning strikes is selective to the environment [20]. There are two types of lightning strike selection areas. One involves the prominent geographical location of an area; that is, the selectivity of lightning strikes is mainly determined by the relative height factor. The other area involves the soil resistivity of the underlying surface being relatively small; that is, the selectivity of lightning strikes is mainly determined by the soil resistivity factors of the underlying surface, and swamp wetlands, grass ponds, and so on are areas with high lightning strike incidence frequencies [60,61,62,63].
Lightning is related to the breakdown of the air medium; in a thunderstorm cloud, electric charges are separated, thus the upper part of the cloud has a positive polarity while the lower part has a negative polarity [59,60,61]. This electric charge separation is mainly caused by the noninductive electrification mechanism; that is, the collisions between ice crystals and sleet, between ice crystals and ice crystals, and between ice crystals and water droplets cause electrons to transfer from small particles to large particles. Under the actions of the vertical airflow and gravity, positively electrically charged particles move upwards with the updraft, while negatively electrically charged particles move downwards [64]. The negative electric charge at the bottom of the thunderstorm cloud induces a positive electric charge on the ground facing the thunderstorm cloud. When the electric field strength between the thunderstorm cloud and the ground reaches the breakdown electric field strength of humid air (approximately 3.3 × 10⁵ V/m), the negative electric charge leaves the thunderstorm cloud and enters the air, forming a stepped leader. The ground-induced positive electric charge gradually accumulates and develops from objects (trees, etc.) high above the ground to the air, thus forming a positive electric charge flow column. As the average electric field strength is inversely proportional to the distance, the electric field between the highest object on the ground and the stepped leader is the strongest. When a positive electric charge flow column connects with a stepped leader, an electrodischarge channel is formed and an air electrodischarge phenomenon is then generated, as shown in Figure 6. Figure 6 shows that the electrodischarge process can be divided into three main stages. In the first stage (Figure 6a), when the frozen layer and snow are not melted, the positive electric charge on the ground gradually accumulates in high places (trees, etc.), thus forming a positive electric charge flow column and contacting the stepped leader in the air to induce electrodischarge. In the second stage (Figure 6b), after the frozen layer and snow melt, the positive electric charge on the ground gradually accumulates in high places (trees, etc.), thus forming a positive electric charge flow column. The methane gas released from the ground strengthens the positive electric charge flow column and makes contact with the stepped leader, thereby enhancing the air electrodischarge phenomenon. In this process, extensive positive electric charges are present on the ground, so the near-ground atmospheric electric field is mainly positive. In the third stage (Figure 6c), after the frozen layer and snow melt further, the positive electric charges on the ground gradually accumulate in high places (trees, etc.) to form a positive electric charge flow column. The methane gas released from the ground strengthens the positive charge flow column and makes contact with the stepped leader, thereby enhancing the air electrodischarge phenomenon. With the release of methane, the positive electric charges gradually enter the atmosphere, causing the positive electric charges on the ground to gradually decrease, and the atmospheric electric field near the ground becomes mainly negative.
In addition, studies have shown that solids, liquids, and even gases can become electrically charged as a result of contact separation [65,66]. This is because gas is also composed of molecules and atoms. When air flows, molecules and atoms “contact and separate” and become electrified [66,67,68,69,70,71,72]. In the gas–solid phase, as a result of friction between solid particles and gas particles and collisions between particles, gas particles and solid particles obtain a certain electric charge. When two substances with different electric charges make contact with each other, the electric field intensity between them increases, and the “air barrier” between the two substances becomes ionized, thus forming a conductive channel [73,74,75]. The positive and negative electric charges on the two substances attract each other through this conductive channel, thus resulting in the neutralization of positive and negative electric charges. At the same time, during the neutralization process of electric charges with different properties, their electric potential energy in the electric field disappears. According to the law of energy conservation, this electric potential energy must be transformed into heat energy and released [76,77]. In the spring, when the frozen layer on permafrost land surfaces gradually melts, the methane gas accumulated under the frozen layer is quickly released into the atmosphere. During the rapid movement of methane gas in soils, the gas rubs against materials such as soil particles and plant residue, and the extranuclear electrons eliminate the bondage, resulting in positively charged methane gas gradually entering the atmosphere. With the gradual release of methane gas, the positive electric charges released from the ground gradually increase in number, and a positive electric charge flow column gradually increases and strengthens to make contact with the negative electric charge in the cloud near the ground to form an electrodischarge channel and strengthen the electrodischarge phenomenon, as shown in Figure 6. The gradual accumulation of land surface electric charges further causes static electricity to accumulate in soils, gases, and plant residue, among others. In addition, compared with air, methane gas has a higher flammability and electrical conductivity, so the continuous near-ground air electrodischarge and gradual accumulation of static electricity on the land surface cause methane gas, plant residue, and other combustibles to ignite in the near-ground air.
To further verify the friction-induced electrification process between gas and soil, we carried out indoor gas–solid friction tests and studied the effects of different factors on the charge movements. When air enters a soil, it causes friction between the air and soil, and the soil moves with the air, further causing friction between the soil particles and air particles, thus resulting in the electrification of the soil and the air owing to the acquisition or loss of electrons. With these air movements, the electric charge moves rapidly and accumulates in the upper part of the soil, as shown in Figure 7.
We conducted ventilation tests on the study soils under different conditions and obtained the corresponding electric quantity change curves, as shown in Figure 8. Figure 8a shows that, with gradual friction between gas and soil, the electric quantity in the soil gradually increases. Figure 8b shows that, within a certain range, with an increase in the particle size and roughness, the electric quantity of the soils increases faster with time (that of fine gravel soil > sandy soil > clay); this is consistent with the findings shown in Figure 8d,e, but when the roughness was further increased, the electric quantity of the soil decreased. Figure 8c shows that, as the wind speed gradually increases, the speed at which the soil electric quantity increases gradually accelerates. Figure 8f,g shows that, as the friction time between particles increases, the electric quantity in the soil gradually increases and then stabilizes. Figure 8h,i shows that, as the soil moisture decreases, the air and soil become more easily electrically charged, and the electric charge amount becomes greater following friction. Figure 8j–l shows that, following ventilation in soil, the electric quantity changes in both the vertical and horizontal directions, and the change is greater in the vertical direction than in the horizontal direction; additionally, the electric quantity generated by the dispersed flow ventilation mode is the lowest, the electric quantity generated by the semi circulation ventilation mode is larger, and the electric quantity generated by the circulation ventilation mode is the largest. In summary, when air is introduced into soils, the injection causes friction between gases and solids, between gases and gases, and between solids and solids, leading to electric charge movements and voltage changes, ultimately causing the accumulation of charges and the formation of static electricity.

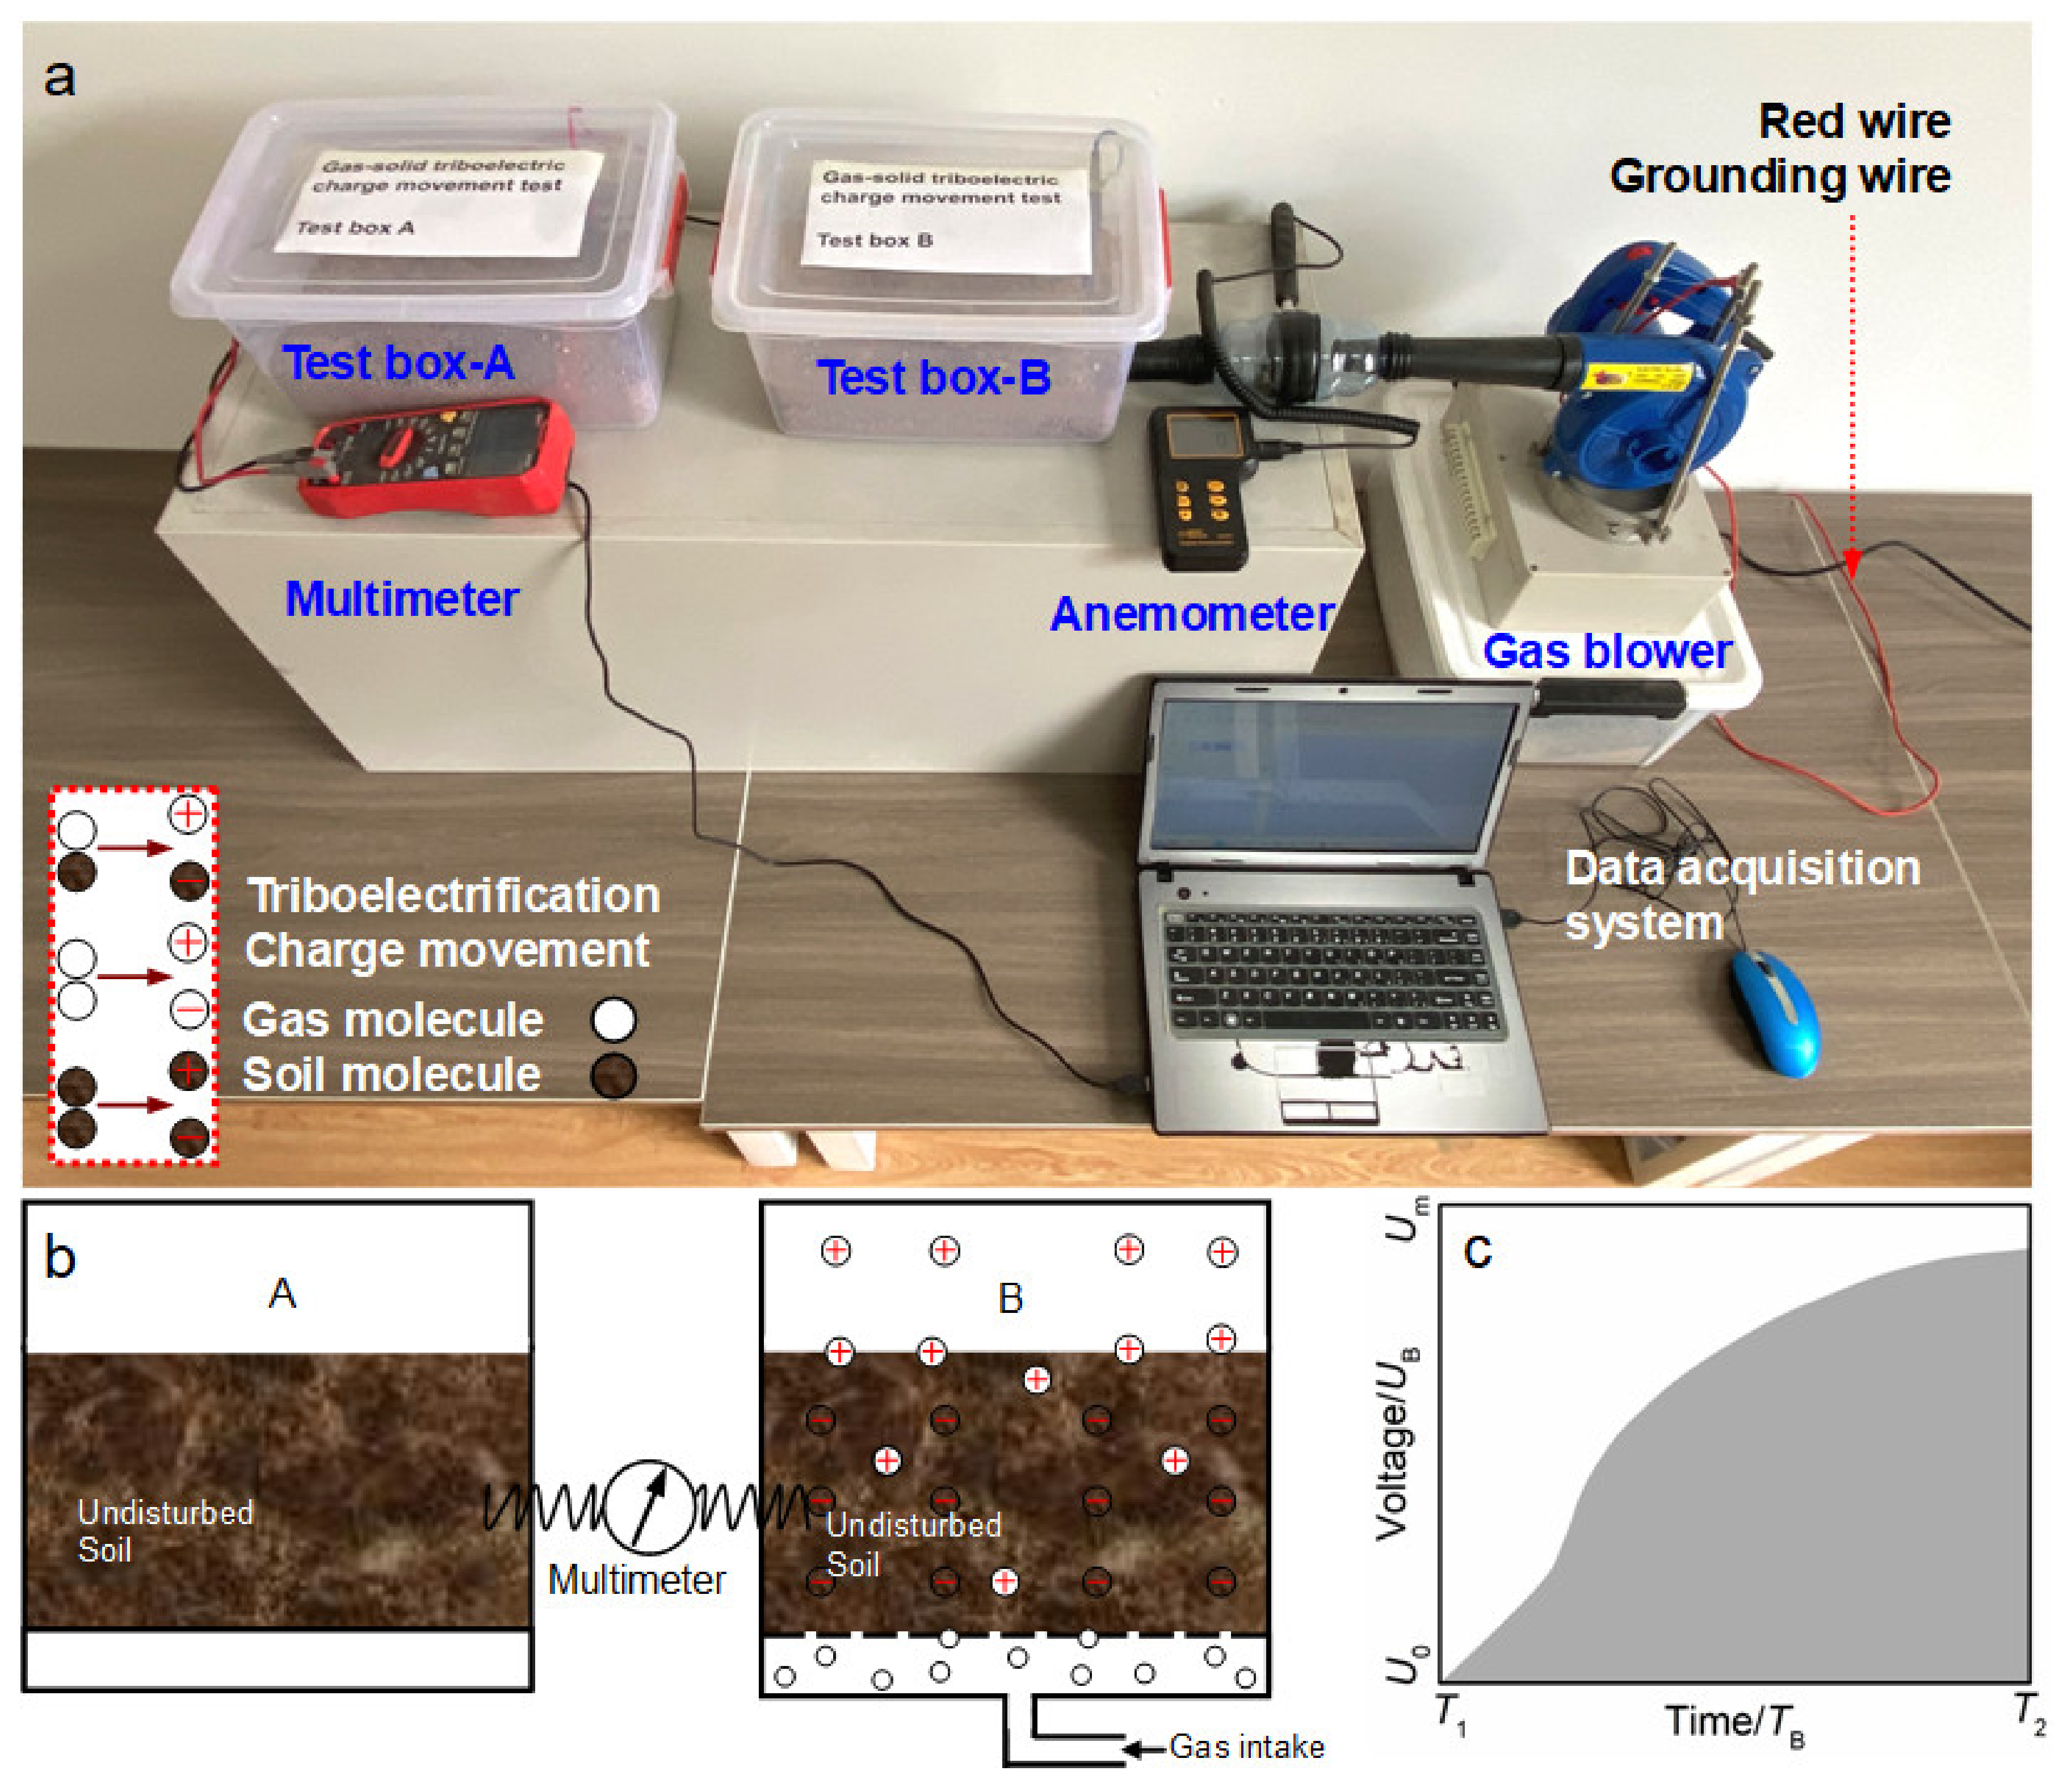
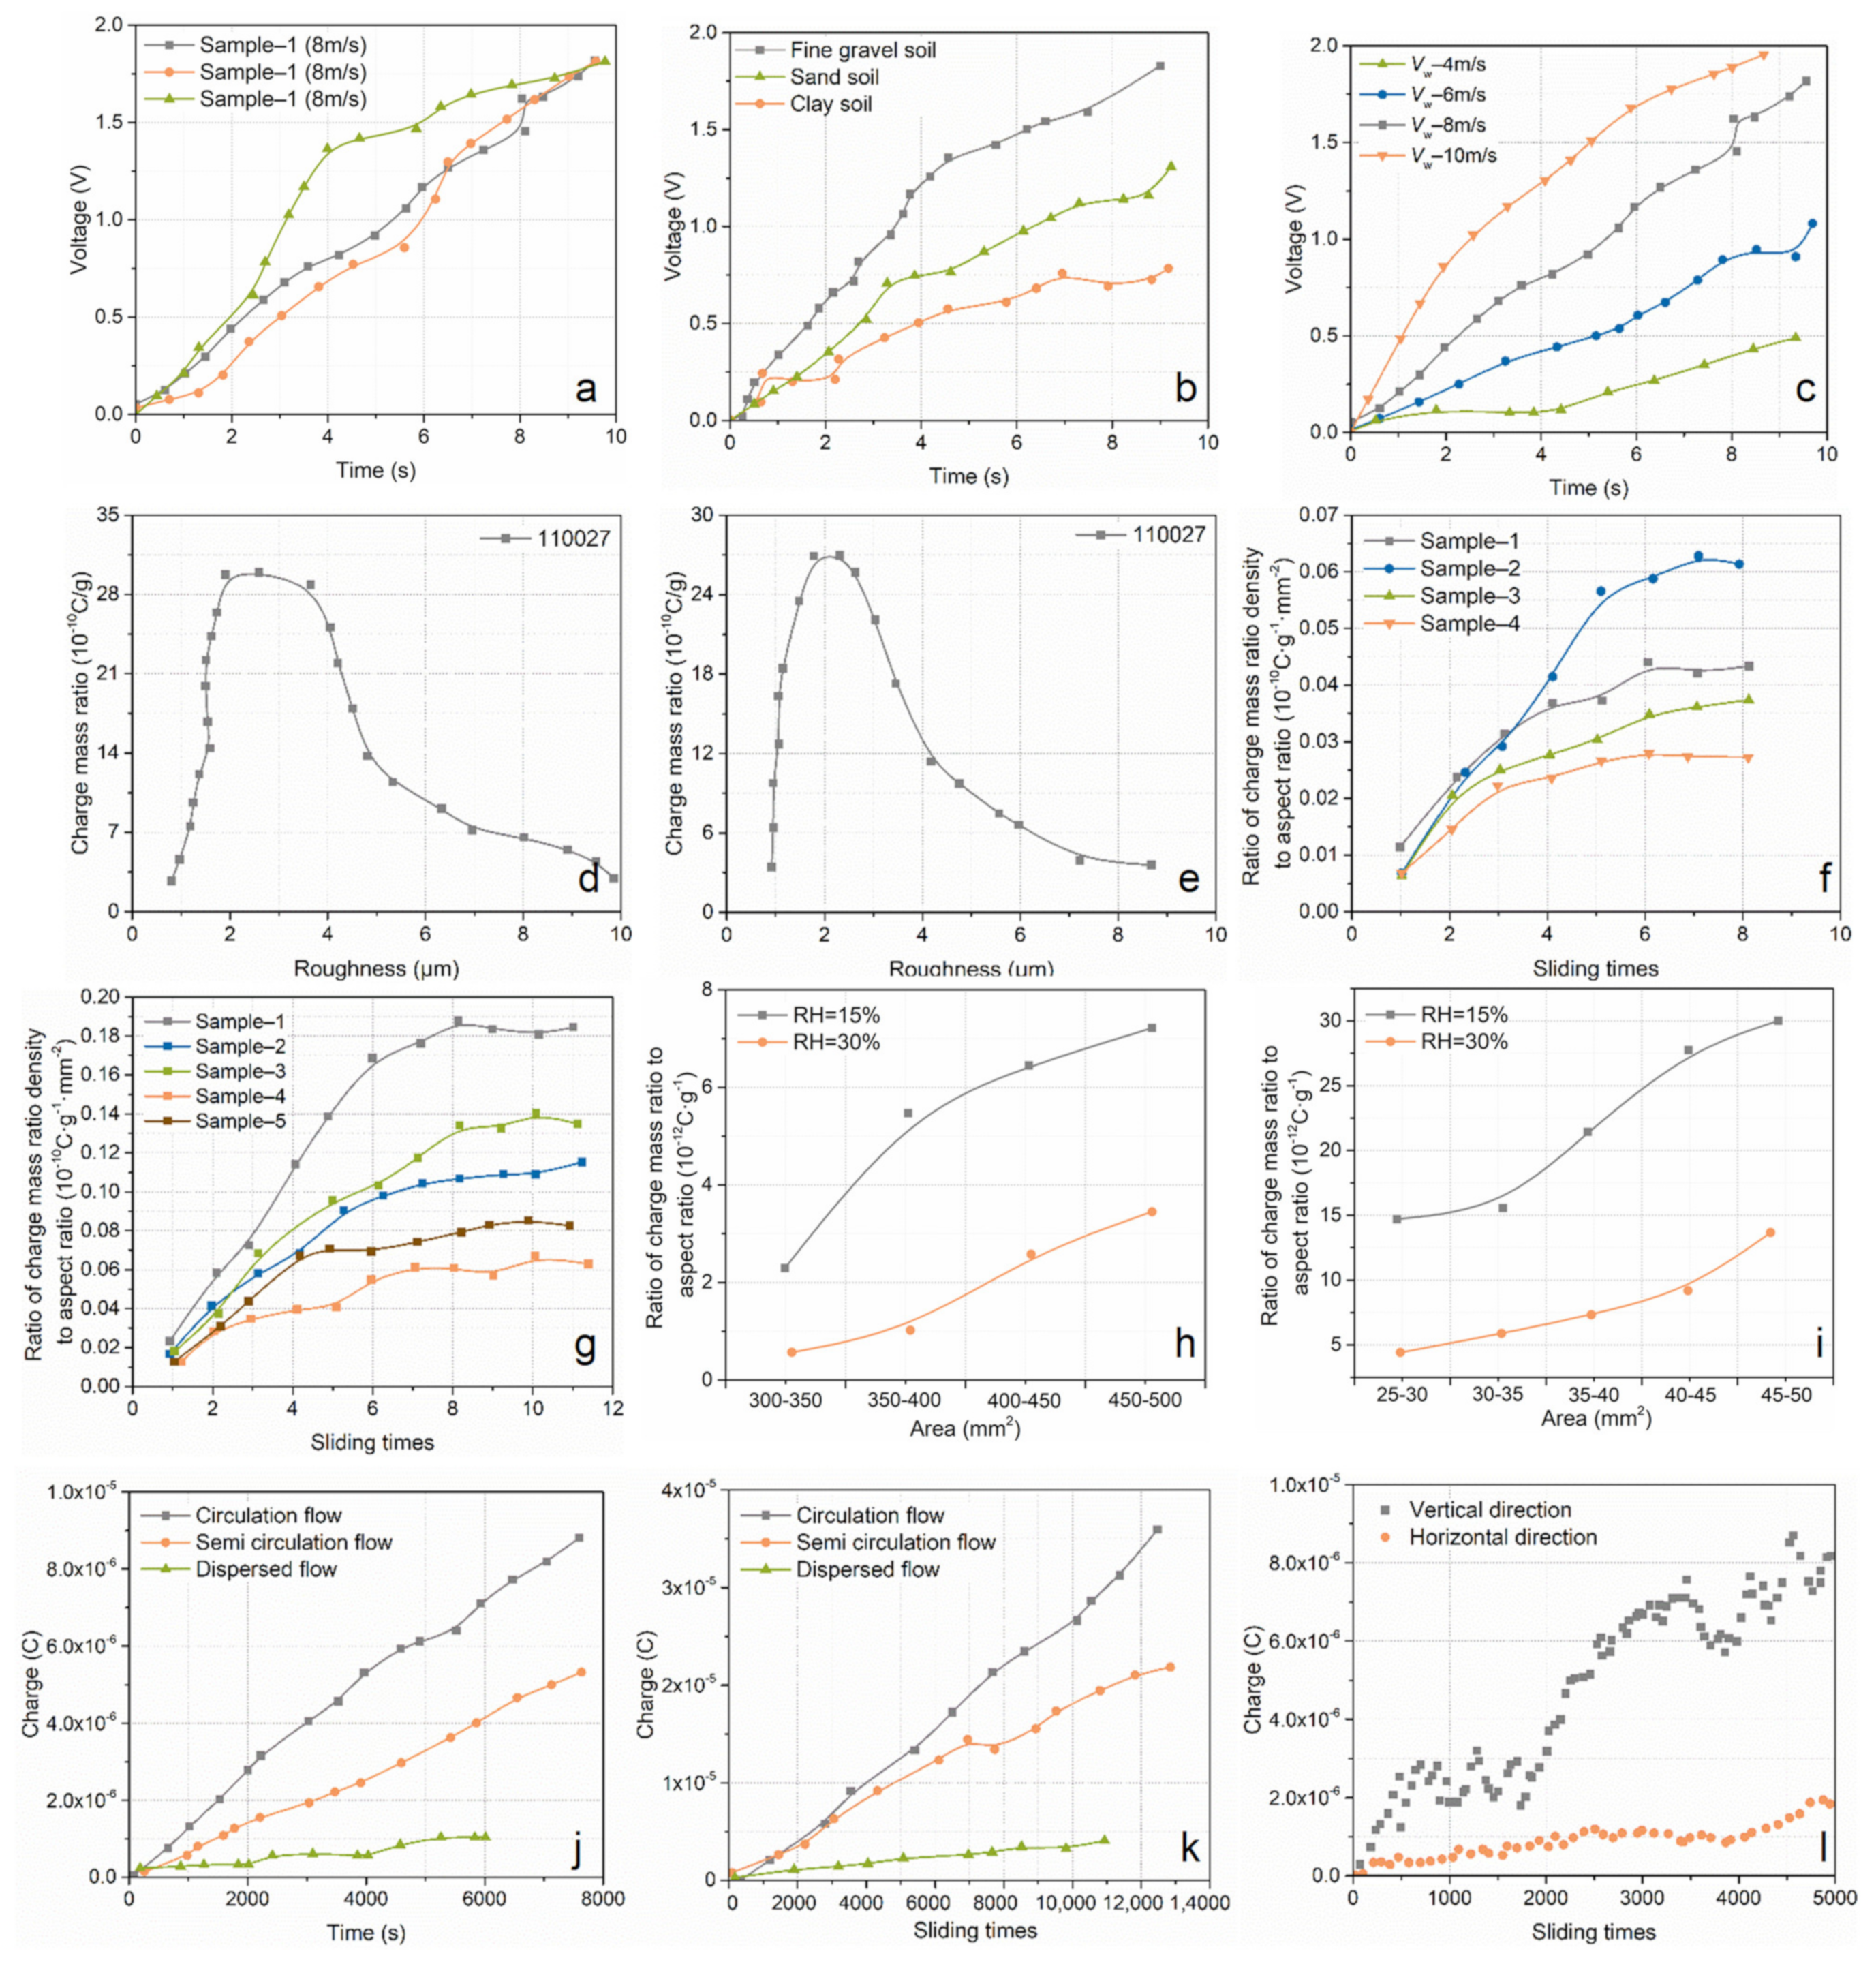
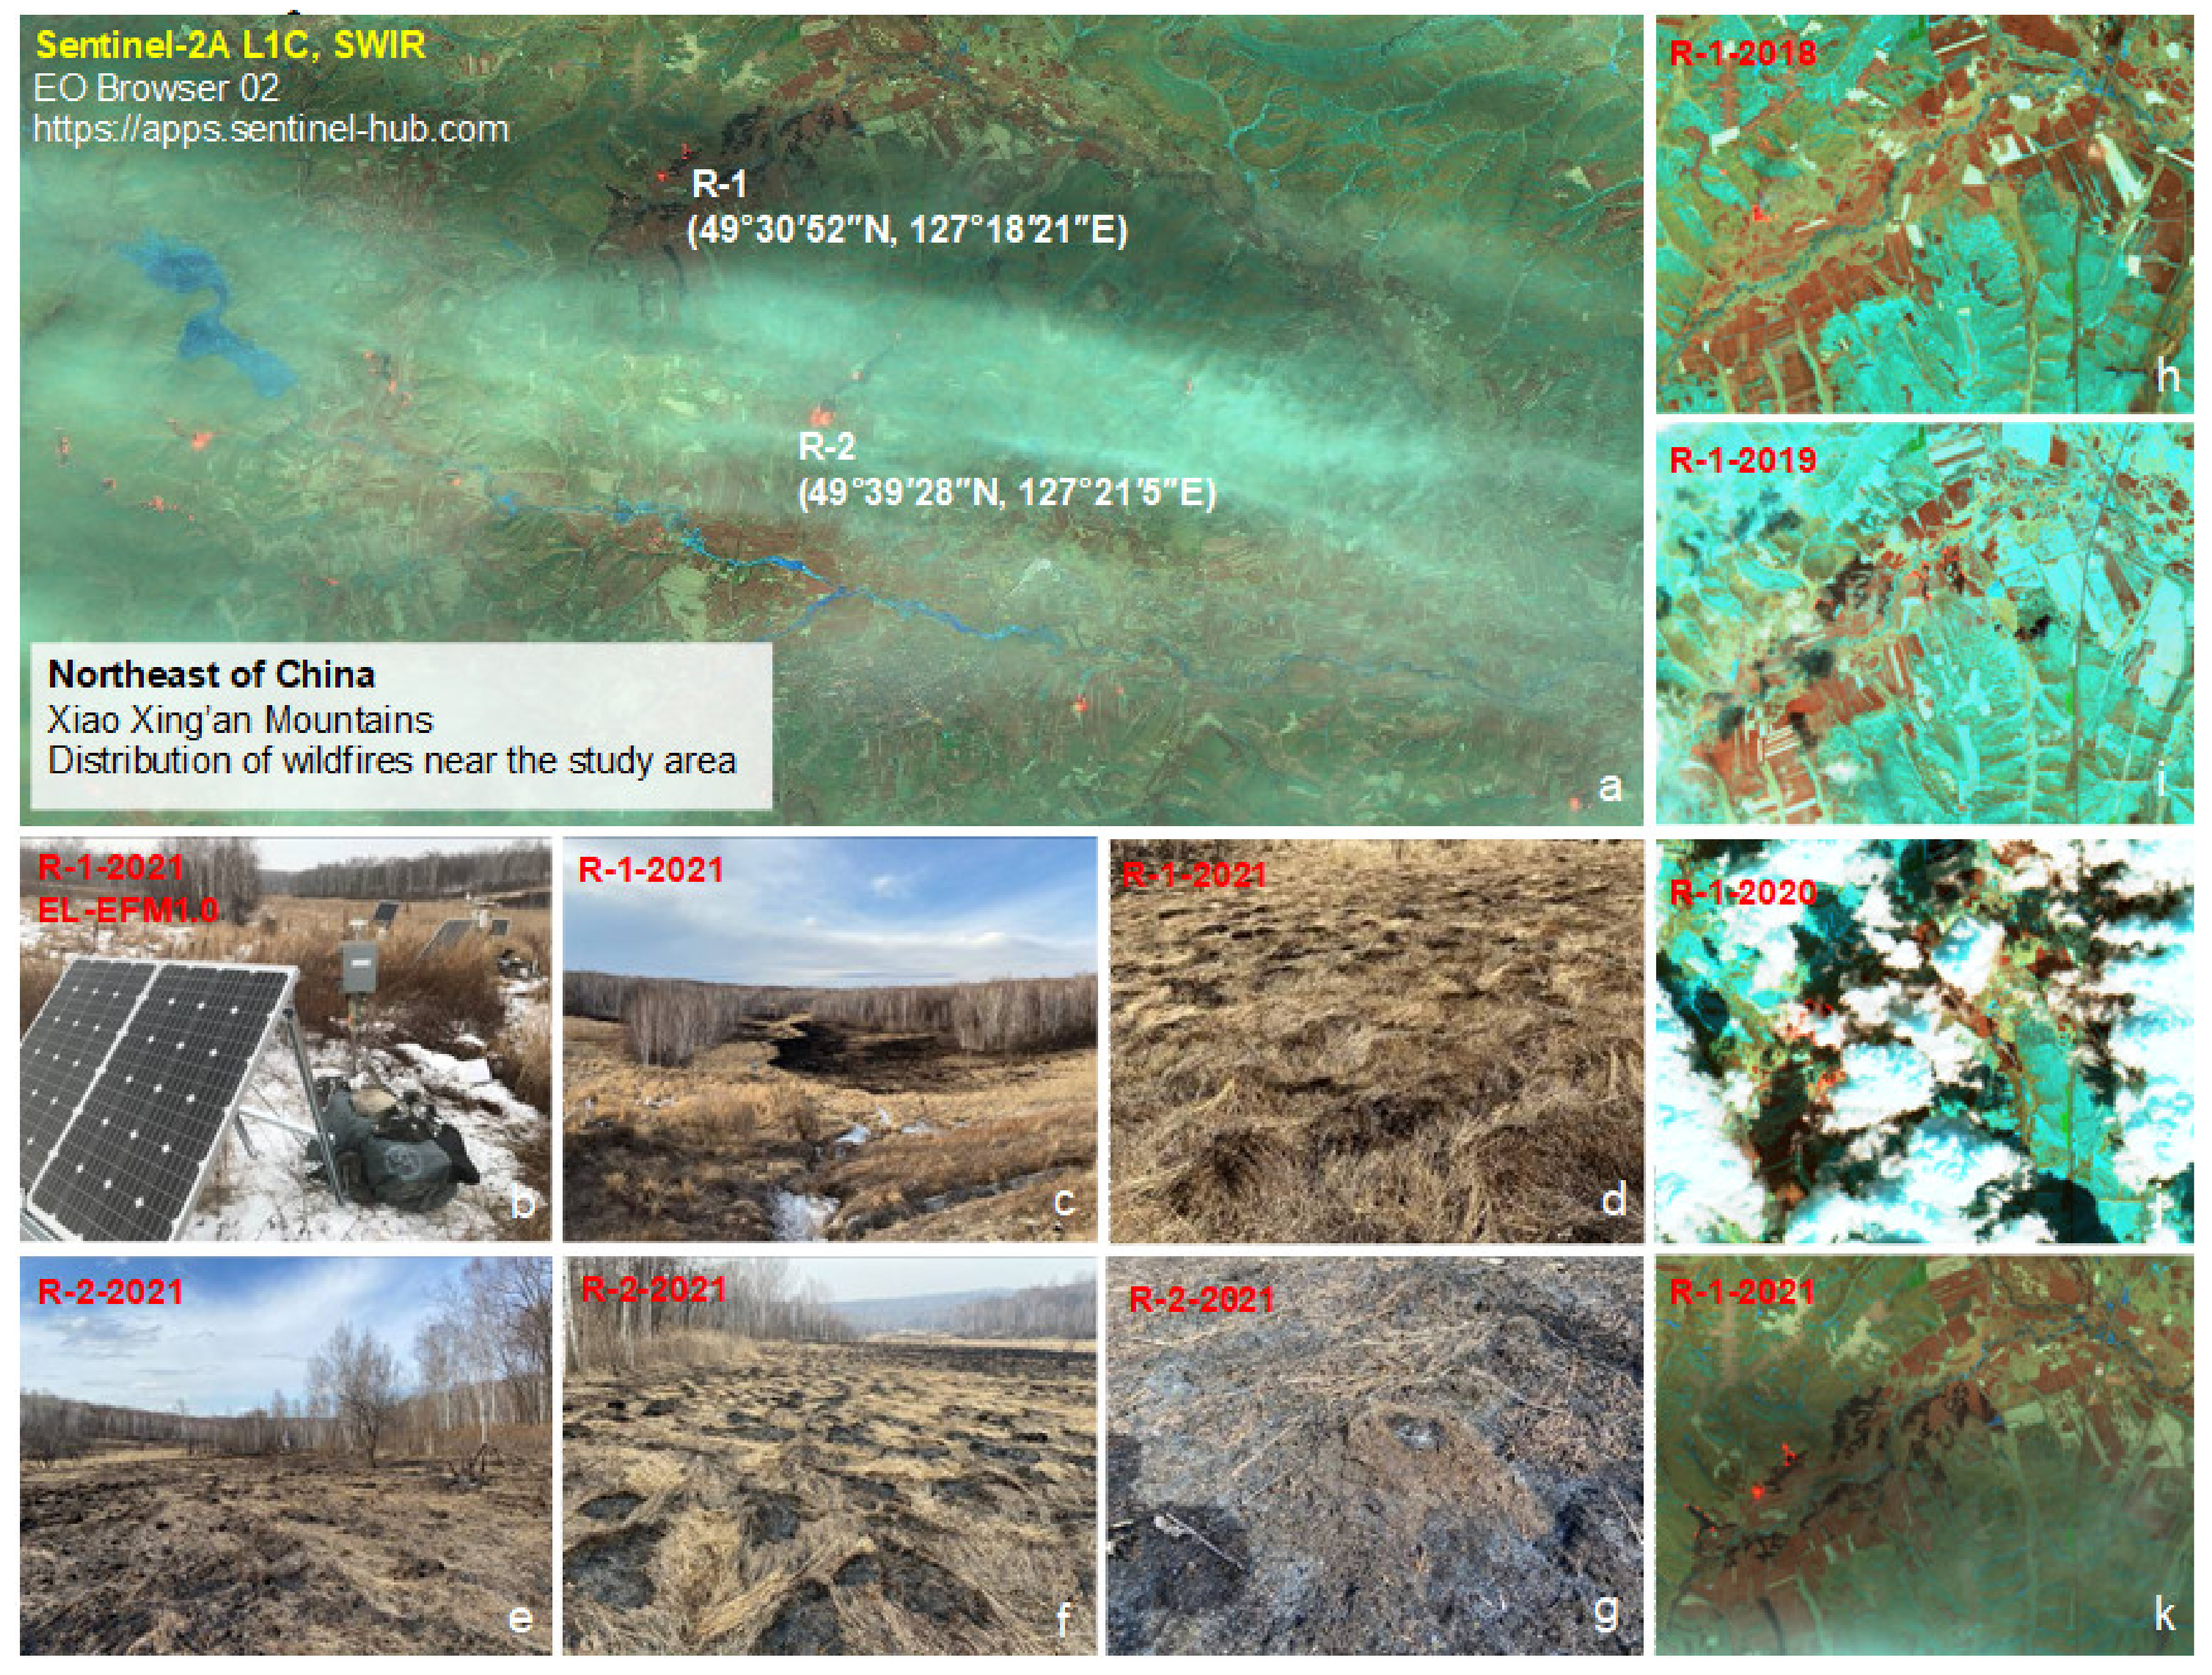
3.3. Analyses of the Characteristics of Burned Sites, Changes in the Atmospheric Electric Field, and Related Monitoring Data in the Study Area

Northeast China has a northern temperate monsoon climate [79]. East or southeast winds prevail in the region in summer. Because cyclones from Baikal Lake and Mongolia have more chances to form peak surfaces on mountain ridges in this region, the electrodischarge and thunderstorm formation processes between electrically charged clouds and the ground occur often, not only causing thunderstorms, but also causing the ground temperature to increase and the relative humidity to decrease, thus promoting the drying of the ground cover; this process is often accompanied by strong winds. Therefore, although the lightning activity in the central area north of 51° N is not sufficiently concentrated, there are many thunderstorms, especially dry thunderstorms, in this region, and this is one of the main reasons behind the formation of lightning fires [80]. There are three lightning fire distribution zones in Northeast China [80,81]; the southwest zone is called the Hulunbuir League, that is, the area south of 51° N, where lightning fires account for 18% of the total number of fires in this area; the east zone is a grassy marshland containing Xingan Larix gmelinii, birch forests, and Mongolian oak forests in the Heihe area (the study area considered in this article); and the north zone is located in the mountainous hinterland at an elevation of 800 m and in areas within Larix gmelinii-Pinus pumila forests and Pinus sylvestris-Pinus pumila forests on the mountaintops north of 51° N—these areas correspond to the concentrated lightning fire areas. By analysing the spatial distribution of lightning fires over many years, it can be seen that, the higher the latitude, the more lightning fires occur in forested areas, and lightning fires in the northern region account for approximately 38% of the total number of forest fires in these zones [80,81,82]. According to the locations of accumulated wildfires in Northeast China from 2000 to 2018, as obtained from the fire management department, the locations of wildfires in Northeast China are mainly concentrated in the permafrost distribution area; compared with the continuous permafrost area, the fire locations in degraded permafrost areas within the study area (in the Sunwu-Jiayin basin in Northeast China) are more densely distributed [25]. In addition, the annual carbon emissions maps of fires in different regions and sources indicate global fire carbon emissions mainly involve grassland and bush fires, agricultural waste burning, boreal forest fires, and tropical forest deforestation and degradation. Grassland and bush fire activities have changed relatively little in recent years, and the area of agricultural waste burning has decreased, while boreal forest fires, especially those in northern North America and Siberia in northern Asia, have increased rapidly in recent years (data from http://globalfiredata.org/pages/data/) (accessed on 1 January 2020).
To further observe the atmospheric electrodischarge process in the study area, we installed an EL-EFM1.0 atmospheric electric field instrument and monitoring equipment to monitor the atmospheric electric field and wildfire in the study area in real time. The wildfire and atmospheric electric field instruments utilized in the study area are shown in Figure 9.
Figure 9 shows that a large number of fires appeared near the study area on 19 March (there were basically no fires on the ground near the study area before 19 March), and the burned areas were mostly distributed in low-lying valley swamp areas (Figure 9). Carex tato is widely distributed in study areas R-1 and R-2, and the overall fire situation mainly involved the incomplete combustion of C. tato on the land surface. The root system of C. tato, which is higher than the land surface, has a higher degree of combustion, and when these root systems are located at the edges of land surface water bodies, they have a lower degree of combustion in the form of patchy dispersed combustion or even no combustion (Figure 9f). This is because the snow and frozen layer have not completely melted in early spring and because many pore channels exist in the root system of C. tato. Therefore, as the ground temperature increases, the methane gas under the frozen layer is first discharged into the atmosphere from this part of the study area (the pore channels in the root system of C. tato). However, because of the low concentration of methane gas in this region, C. tato is not fully burned and is instead blackened. In addition, many similar micro-volcanic areas can be found in the study area (Figure 9g); in these regions, C. tato is more heavily burned and looks grey because the methane gas under the frozen layer has broken through the weak soil layer and because the methane concentration exiting the pores is relatively high, leading to the different combustion degrees. We further obtained the combustion situation near study area R-1 from 2018 to 2021 form Sentinel-2 imagery (Figure 9h–k) and collected air humidity, soil temperature, soil humidity, pore water pressure, and solar radiation information in study area R-1 from 10 March to 10 April each year from the meteorological station, as shown in Figure 10. Wildfires occurred in study area R-1 around 20 March 2018–2021 (Figure 9h–k). Figure 10 shows that, during the period from 10 March to 10 April each year, the daily air humidity greatly increased, while low values appeared during the wildfires on 20 March. The floating air humidity further strengthened atmospheric convection, thus promoting the movement of electric charges and strengthening the generation of the electrodischarge phenomenon in the air (Figure 10a–c,h). From 10 March to 10 April, the soil humidity and soil temperature showed overall upwards trends. During this period, the frozen layer and snow gradually melted, the difference between the total radiation and net radiation gradually decreased (Figure 10g,l), the net radiation on the land surface increased, and methane gas gradually moved to the land surface (Figure 10d,e,i,j). The pore water pressure showed a trend of first increasing and then decreasing (Figure 10f,k). This change trend was related to the accumulation and release of methane gas under the frozen layer (Figure 10f,k). In addition, we investigated the permafrost distribution in the study area and found that the wildfire degree is positively correlated with the permafrost distribution [25].
According to the air temperature, snow, and lightning weather conditions, we selected the atmospheric electric field curves of the study area on 15 February 2021, 15 March 2021, 19 March 2021, 5 April 2021, 14 June 2021, 16 July 2021, 30 September 2021, 16 November 2021, 15 December 2021, and 12 January 2022, as shown in Figure 11. When the air temperature is negative in winter, the frozen layer and snow on the land surface do not melt, the gas exchange between the ground and the atmosphere is relatively low, the atmospheric convection is relatively weak, and the electric charge movement is relatively small. Therefore, the atmospheric electric field is relatively small and undergoes limited large short-term fluctuations (Figure 11a,j). In spring, when the air temperature becomes positive for the first time, the snow and frozen layer at the land surface begin to melt, and the methane gas stored under the frozen layer begins to release. The gas exchange between the ground and the atmosphere thus increases, atmospheric convection increases, and the electric charge movement increases rapidly (Figure 11b–d). On 19 March, the air temperature continued to increase, the air electrodischarge gradually increased and became more concentrated, and combustion occurred in many areas within the study area (Figure 11c). A wildfire occurred in study area R-1 between 06:59:38 and 15:33:34 (Figure 12k,l); this fire was related to the long-term electrodischarge conditions from 10:53:10 to 10:58:26 on 19 March (Figure 12c), and the methane gas released after the snow and frozen layer melted was ignited because of the air electrodischarge. In summer, the air temperatures are high; the maximum air temperature on 16 July was 31 °C, causing increased water evaporation and methane release, a larger ground-atmosphere exchange rate, and relatively high atmospheric electrodischarge. Under these conditions, a thunderstorm occurred on 14 June, coinciding with the most intensive atmospheric electrodischarge. In autumn, the air temperatures are relatively high and the ground-atmosphere exchange rate is relatively large, so greater atmospheric electrodischarge occurs. We further selected the local change curve of the atmospheric electric field (Figure 12). During the concentrated electrodischarge process in spring, the atmospheric electric field changes mainly include positive–negative changes, negative changes, positive–negative–positive–negative changes, and negative–positive–negative changes. The negative electric field persists over the long term, mainly because of the uneven electric charge distribution caused by electric charge movements, as shown in Figure 12.
In addition, studies have shown that high mixed gas pressures and methane gas contents reduce the ignition temperature of methane gas within a certain range [25,83], thereby promoting the combustion of methane gas. When methane gas is combined with aerosols (such as dust, sulfate, black carbon, and other atmospheric particles), the warming potential of methane is increased [84,85,86]. The presence of aerosols further improves the influence of methane gas on atmospheric warming and increases the occurrence of wildfires. Therefore, the gradual degradation of permafrost areas and the gradual release of methane gas have become important factors inducing wildfires in permafrost areas.

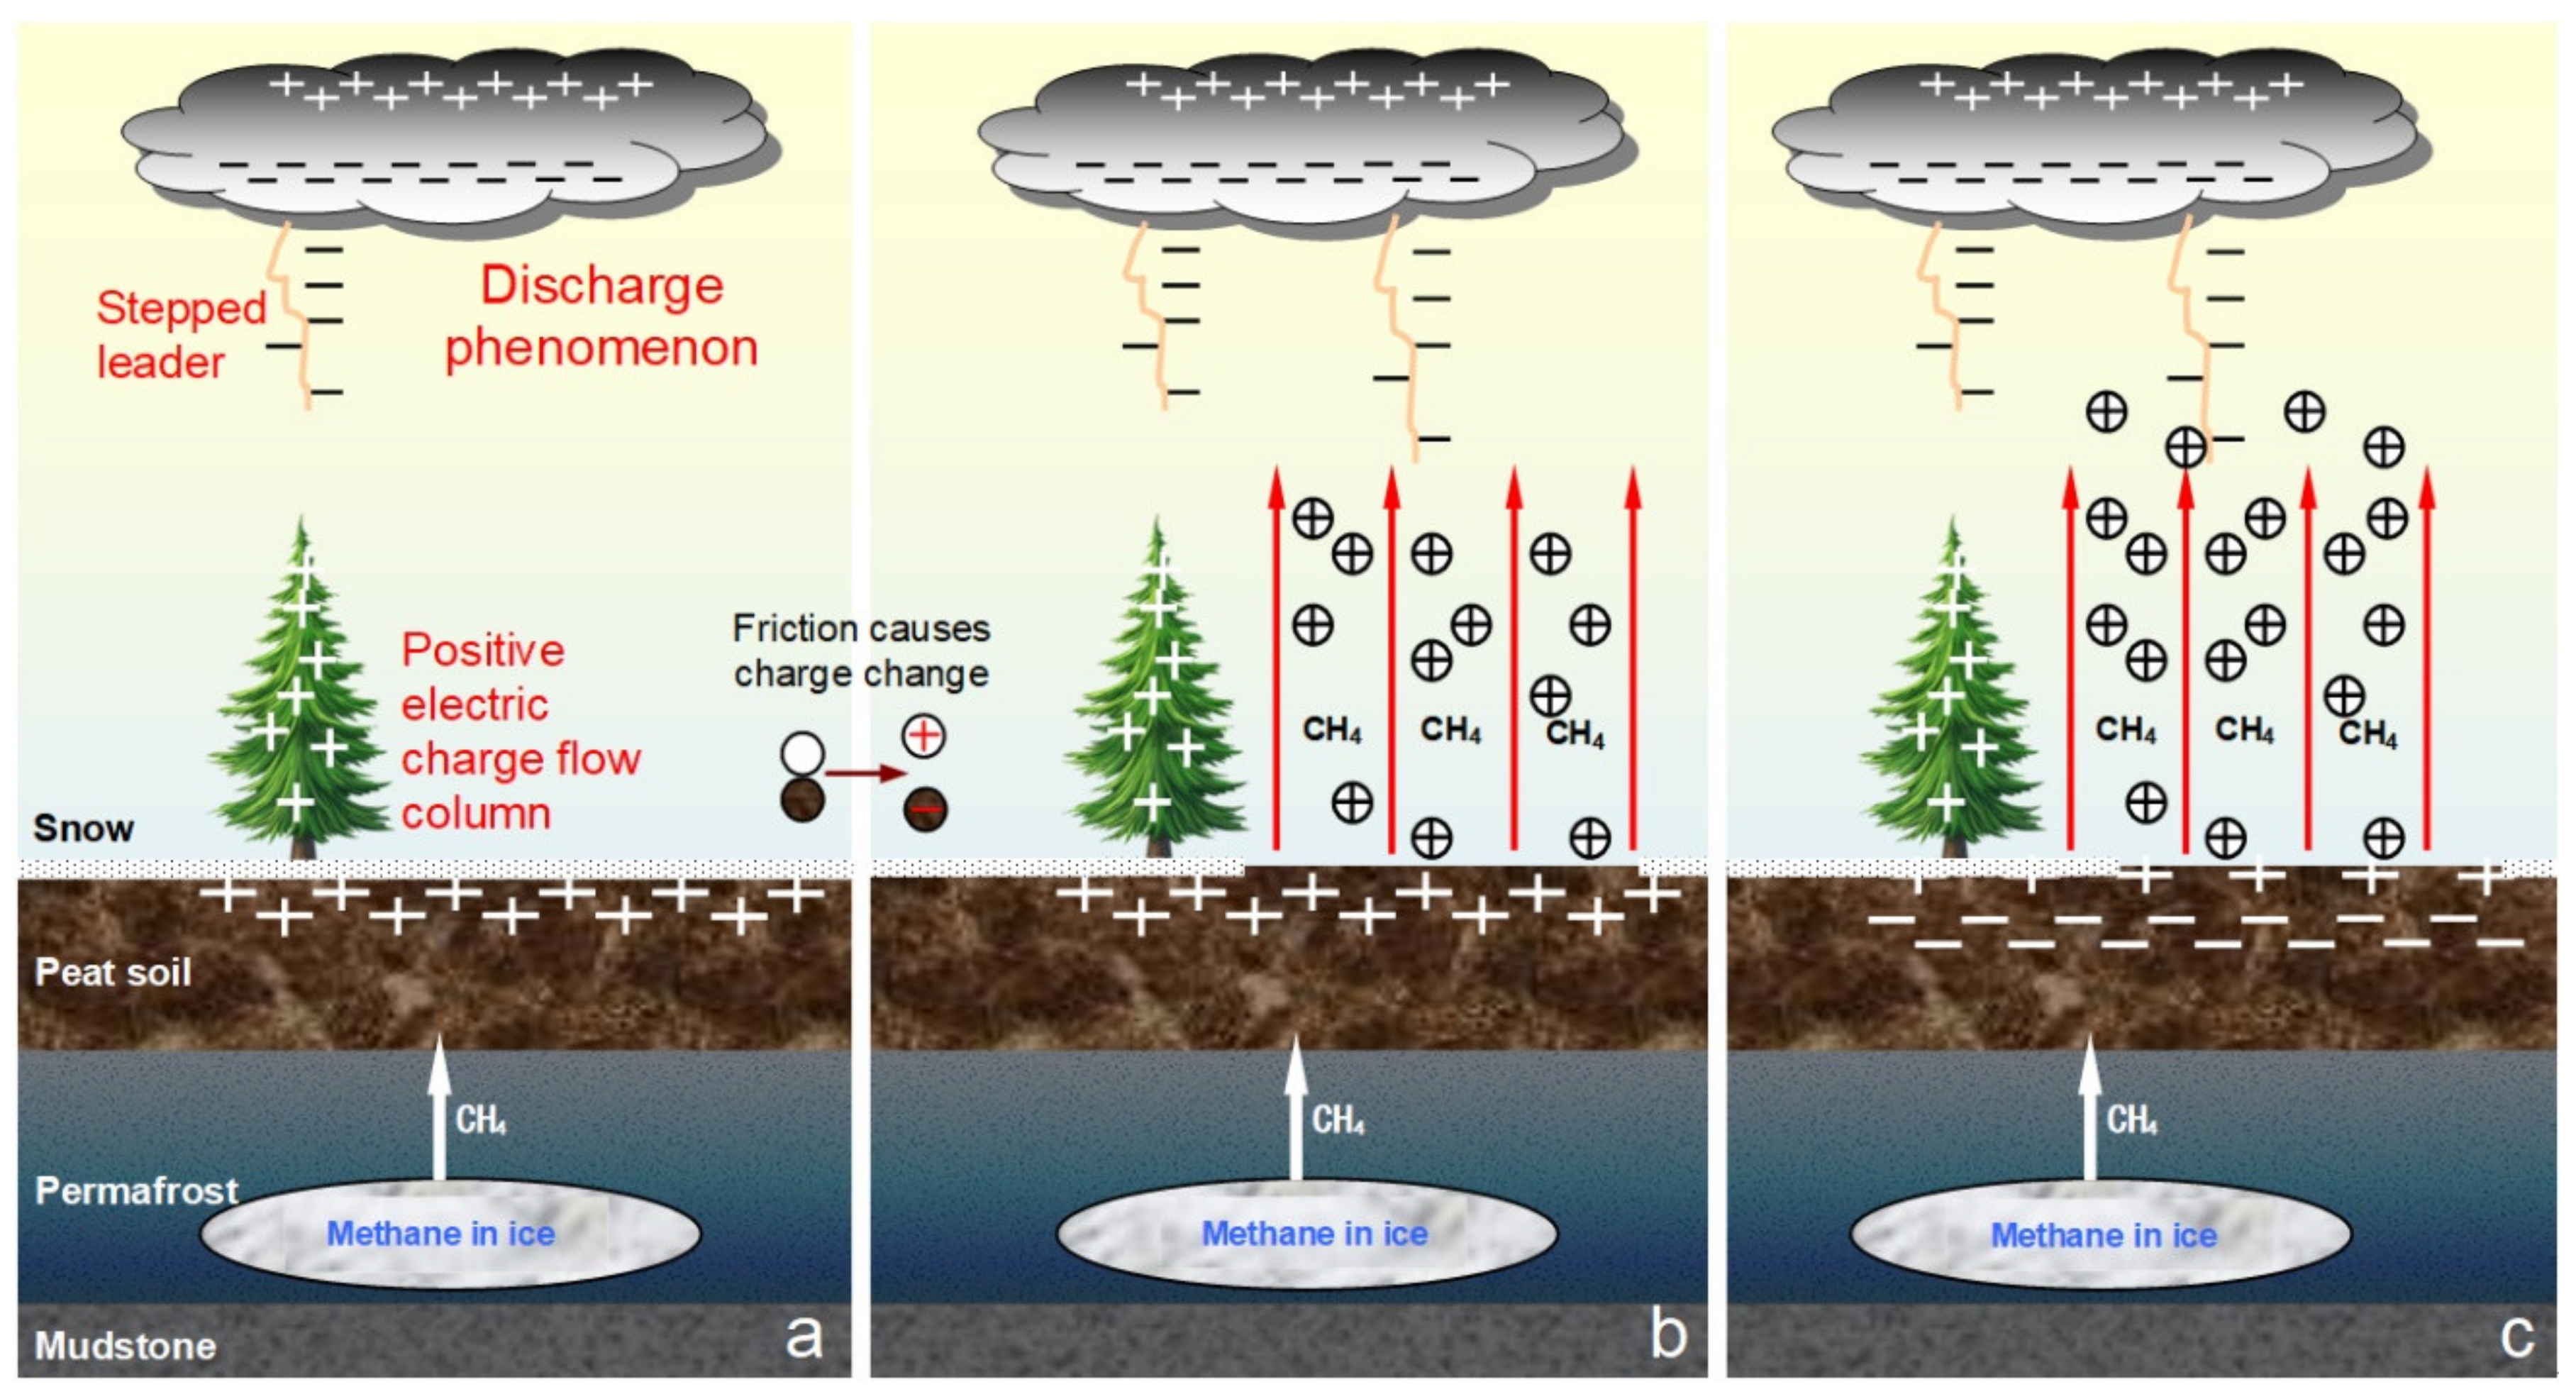
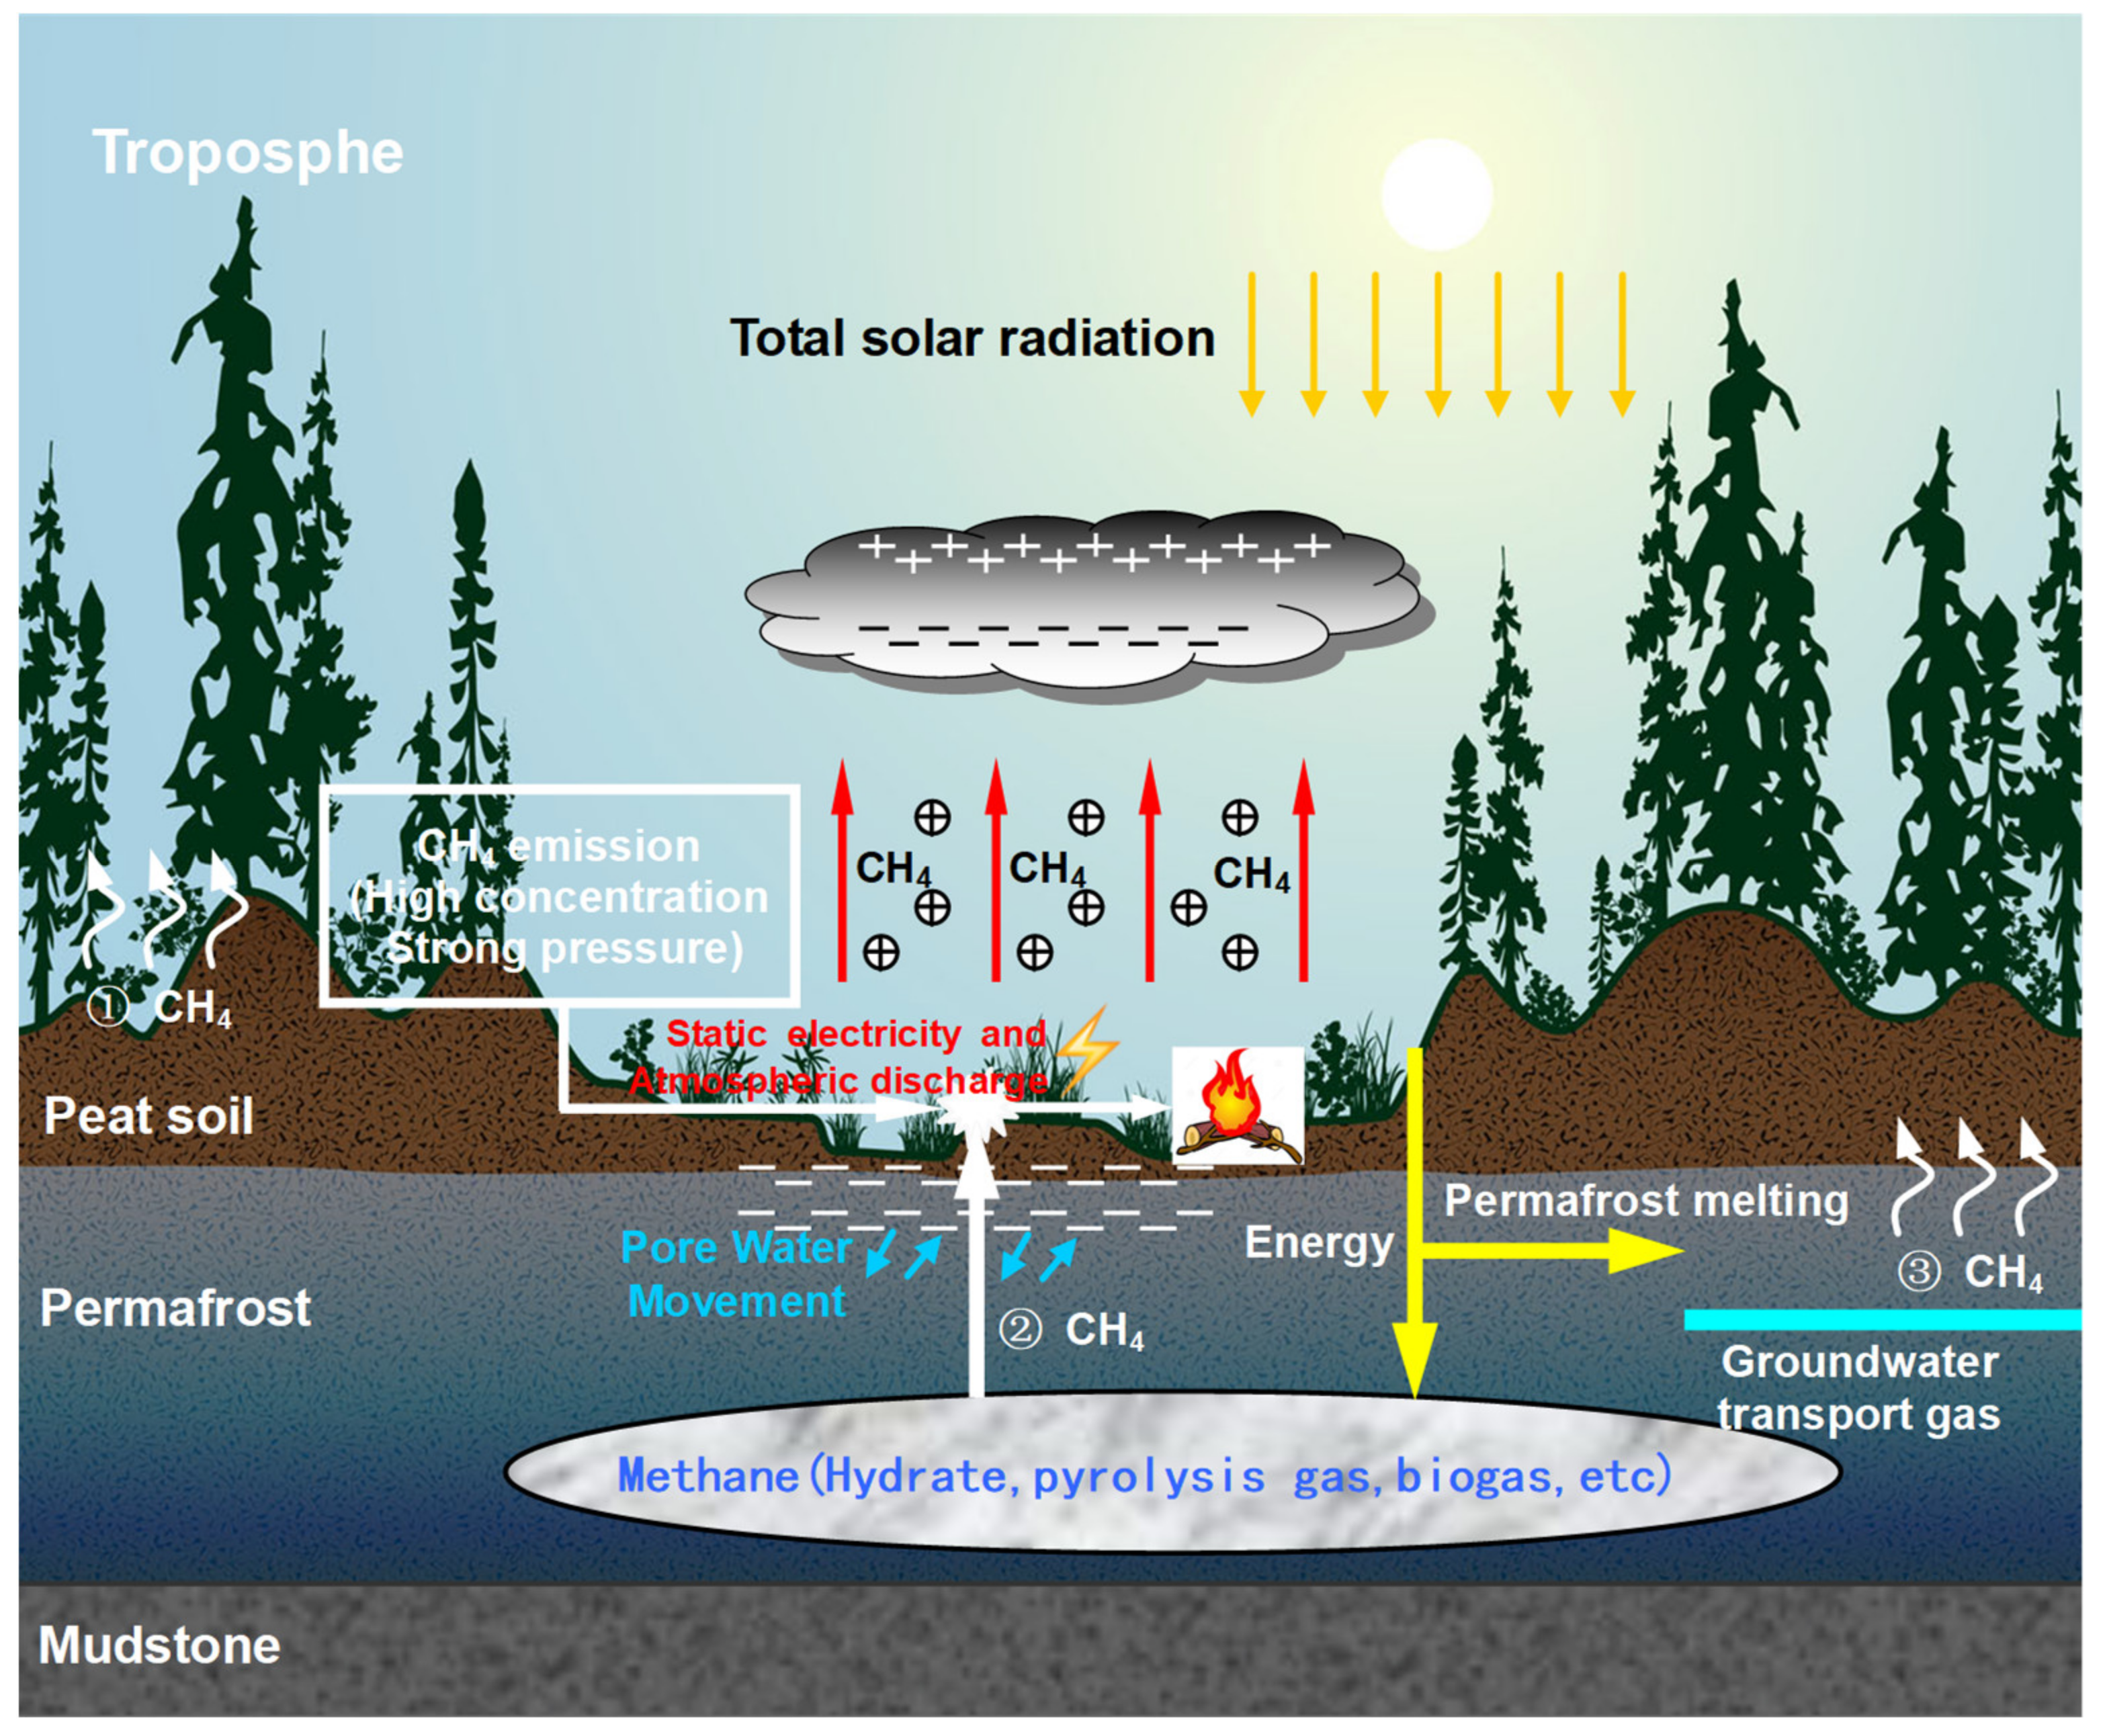
4. Establishment of the Conceptual Model

To better describe the process by which methane gas is emitted in permafrost areas and the mechanism by which methane emissions promote wildfires, we further established a conceptual model of this process and the lightning–wildfire–vegetation feedback mechanism associated with permafrost, as shown in Figure 13. In the model, the soil layer structure at different depths was simplified from top to bottom; in the thicker peat soil, permafrost layer (mainly gravels and sandy clays), and gravel mudstone layer, certain carbon reserves exist in the permafrost layer, and the distribution of these reserves is relatively uneven. The permafrost layer is gradually degraded, and the carbon stored in the permafrost is thus disturbed to form methane gas. This methane gas then gradually migrates to the land surface under the action of the pressure gradient and accumulates under the frozen layer at the land surface. This methane gas mainly includes in situ microbially produced methane, methane transported by wetland groundwater, methane hydrate stored in the frozen layer, and thermogenic methane produced at underground depths (e.g., at coal seams).
Methane gas accumulates under the frozen layer in spring at high pressures and concentrations. The rapid upwards movement of gas molecules leads to mutual friction among methane gas, soil particles, and plant residue, resulting in the methane molecules adopting positive electric charges. In the process by which methane gas enters the atmosphere, the positively charged methane gas forms an electric field with other negatively charged molecules or the negative electric charges in near-ground clouds and produces a charge neutralization reaction, thus resulting in an electrodischarge phenomenon similar to the electrodischarge process that occurs during volcanic eruptions. Transient clusters are crucial for electrical discharges in monodispersed fine particle jets. These clusters are formed and break up through the densification and rarefaction of particle-laden jets [87]. The lifetime of a cluster is regulated by the turbulence time scale and modification during the flow evolution process [88]. In addition to the radial acceleration of particles owing to the expanding gas, the cluster generation and disruption processes provide the necessary conditions for particle electrification through collisions, the local concentration, and the consequential separation of electric charges, thus creating the electric potential gradient necessary to generate electrostatic discharges. In a very similar fashion, during the impulsive explosion that occurred at Sakurajima volcano in Japan, frequent and relatively short discharges were observed near the crater concomitant to the explosion, while longer and more luminous lightning discharges were observed tens of seconds later, when the plume was hundreds of metres high and expanding through the convective intake of air (i.e., in the 8 February 2010 eruption) [87]. The gradually formed atmospheric electrodischarge and static electricity phenomena act together with the external environment (e.g., increased air temperatures and decreased humidity), eventually leading to the ignition of the high-concentration methane gas in the surface air and plant residue as well as other combustibles, eventually spreading to form large-scale wildfires and forest fires. Finally, the lightning–wildfire–vegetation feedback mechanism associated with permafrost is enhanced.

5. Discussion

Owing to environmental factors, the thickness of the permafrost layer in the northern Xiao Xing’an Mountains in Northeast China is gradually decreasing [52,90,91], and the carbon stored in this permafrost layer is gradually entering the atmosphere in the form of methane gas. In the degraded permafrost area in the northern Xiao Xing’an Mountains in Northeast China, the combustion area is mostly concentrated in low-lying swamp regions with low air temperatures and high humidity rather than in areas with high temperatures and low humidity. The methane gas released from these areas may have accelerated the occurrence of local wildfires; this methane gas mainly includes in situ microbially produced methane, methane transported by wetland groundwater, methane hydrate stored in the frozen layer, and thermogenic methane produced at underground depths (e.g., at coal seams). We determined that a large methane source in the degraded permafrost area in Northeast China results from spring thawing; the maximum hourly emission rate is 48.6 g C m−2h−1, three orders of magnitude greater than the methane emission rate regularly observed during the growing season. In some sporadically observed “hot spots”, the spring thawing effect results in a large methane source of 31.3 ± 10.1 g C m−2h−1, approximately 80% of the annual methane emissions previously calculated in the same study area [22]. In addition, the methane concentrations measured at undamaged natural land surface leakage points in spring can reach more than 2000 ppm, while the methane concentrations at boreholes can reach more than 10,000 ppm, and the leakage speed and pressure are large under these conditions. The rapid upwards movement of methane gas molecules stored underground leads to mutual friction among methane gas, shallow surface soil particles, water vapour, and plant residue, causing different molecules to carry different electric charges. In the process by which methane gas enters the atmosphere, positively charged methane gas forms an electric field with other negatively charged molecules or with the negative electric charges in near-ground clouds, thus producing a charge neutralization reaction that results in an electrodischarge phenomenon similar to the electrodischarge process associated with volcanic eruptions.
Lightning electrodischarges are often observed during explosive volcanic eruptions and are commonly associated with the formation of ash plumes [92]. Their occurrence appears to be independent of the magma composition, eruption type, and plume height [92]. Increasingly sophisticated lightning mapping arrays have shown that lightning discharges are ubiquitously produced within three plume regions, each of which is governed by very distinct dynamics: (1) the gas-thrust region immediately above the vent, (2) the convection-driven rising column extending several kilometres above the vent, and (3) the neutrally buoyant umbrella region. Existing models of electrical charging within the convective column have suggested that volcanic plumes may behave as “dirty thunderstorms” and are thus able to produce lightning discharges such as those commonly observed in thunderstorms [93]. As such, the presence of hydrometeors within a volcanic plume has been assigned a decisive role in the generation of volcanic lightning [94]. Thus, the combined action of static electricity and atmospheric electrodischarge further causes the local temperatures to rise and ultimately promotes the combustion of high-concentration methane gas, plant residue, and other combustibles in the air near the ground. In addition, the higher near-ground mixed-gas pressure and methane gas content reduce the ignition temperature of methane gas within a certain range and promote the combustion of methane gas. When methane gas is combined with aerosols (such as dust, sulfate, and black carbon), the warming potential of methane is increased. The presence of aerosols further improves the impact of methane gas on atmospheric warming and increases the occurrence of wildfires. In addition, lightning played a key role in the recent forest fires recorded in northern North America near the Arctic tree line. The increased impact of lightning is considered when assessing lightning–wildfire feedbacks [95,96,97]. A recent study pointed out that the lightning frequency in the Arctic (Siberia) is greater than it was a decade ago and that this frequency may double soon. This study elucidated another possible change in the Earth’s climate under global warming [35]. Lightning occurs because convective storm clouds are full of tumbling airflows caused by the presence of warm air; these air flows constantly collide with ice crystals and transfer electric charges. Once the electric charge separation reaches a certain threshold, a lightning strike is released. Some researchers have predicted that more convective storms and lightning will occur worldwide in the future owing to the rising air and ocean temperatures caused by global warming [98]. In permafrost regions, permafrost is gradually degenerating. In addition to the evaporation of water and the movement of air, the methane gas released from the permafrost will further accelerate this convection phenomenon and lead to electric charge movements. Maracaibo Lake is one of the largest lightning generators in the world; this lake is surrounded by towering mountain peaks, inducing conflicts between warm and cold air masses and promoting the development of thunderstorms. The collisions between the cool night breezes that flow down from the mountains and the warm tropical water associated with the lake produce approximately 297 nights of thunderstorms on the lake each year [88,89,90,91]. In addition to these factors, it is also believed that the unique concentration and intensity of lightning in this region can be attributed to the large amount of methane in the ground in this area. The Maracaibo Basin is located on one of the largest oil fields in the world, and these oil fields produce large amounts of methane gas. Theoretically, this methane may seep into the atmosphere and increase electrical conductivity, thereby supporting the development of thunderstorms and lightning. In the degraded permafrost area of Northeast China, swamp wetlands are mainly distributed in low-lying valleys and are associated with relatively low terrain and extensive methane emissions, similar to the terrain of Maracaibo Lake. Historically, wildfires in California have been caused by lightning, drought, high air temperatures, and other natural causes. In recent years, the dry weather in California has caused extensive tree mortality, and pests are also present among the withered trees; therefore, the dead tinder allows fires to spread rapidly. Together, the impacts of climate change (e.g., on the atmospheric electrodischarge process), transmission lines, and various static electricity effects, together with the “Santa Ana winds” and dead trees, have caused the losses and casualties this year to be particularly serious [98,99,100,101,102]. The literature also suggests that, in forested regions, if objects rub against each other and generate static electricity or static electricity over a period of time, this process can cause combustion or ignite a fire [101,102,103].
In addition, because forest ecosystems have been altered owing to the changing climate, some forests have been transformed from carbon sinks to carbon sources, and a large amount of methane gas has been released from dying trees [104,105,106,107,108]. In coastal forests, these transformations are more obvious. Research has shown that seawater exposure increases the soil salinity around submerged trees, resulting in an increased methane content in the trunks and soils and a decreased oxygen content; the higher the wood density, the higher the methane concentration in the stem [105,106]. The methane gas released after gradually accumulating in trees may be electrically charged following friction, thus forming static electricity and a partial electrodischarge phenomenon. With the enhancement of static electricity and the partial electrodischarge phenomenon, the methane gas and dry trees may be ignited. For example, the Sierra Nevada in California has experienced a series of disastrous wildfires in recent decades [109,110]; these wildfires have coincided with the springtime and summertime warming caused by climate change [111,112]. From the end of the winter of 2019 to the summer of 2020, devastating fires occurred across a large area of eastern Australia, causing vast losses of life and property. Although flammable vegetation types and seasonal climate conditions cause eastern and northern Australia to be one of the most fire-prone areas in the world, the fires that occurred from 2019 to 2020 were still unprecedented in history, indicating that the fire risk in Australia may be underestimated under the influence of climate warming [112,113,114]. Therefore, with the changes that are occurring in the global climate, the increased humidity and methane emissions in degraded permafrost areas will cause increases in the intensity of atmospheric convection, air friction, air electrodischarge and static electricity, and wildfire occurrences.

6. Conclusions

Although the permafrost degradation process and the process by which large amounts of methane gas are released into the atmosphere, thus accelerating global warming, have been explored in many studies, few of these studies explained the methane emission process or the associated wildfire mechanism. Therefore, we monitored the changes in the atmospheric electric field, air temperature, methane concentration, soil temperature, and pore water pressure in the northwest section of the Xiao Xing’an Mountains in China, within the degraded permafrost zone on the southern edge of the Eurasian permafrost region, and combined these data with relevant satellite remote sensing data to analyse the variation laws and influencing factors of methane concentrations and atmospheric electric fields. Then, through indoor gas–solid friction tests, we simulated the electric potential difference caused by the friction between gas and soil particles and verified the charging effect of methane gas due to friction in the rapid emission process. The following conclusions were drawn from this work.
In spring, as the surface frozen layer thaws and the snow in the study area gradually melts, the high-concentration, high-pressure methane gas stored under the frozen layer is rapidly released into the atmosphere. The annual maximum surface methane concentration (the methane concentration at the concentrated leakage point can reach more than 10,000 ppm, and the pressure is high as well) appears in the study area every spring (March–May).
The rapid upwards movement of methane gas molecules stored underground leads to mutual friction among methane gas, surface shallow soil particles, water vapour, and plant residue, causing different molecules to carry different electric charges. In the process by which methane gas enters the atmosphere, the positively charged methane gas forms an electric field with other negatively charged molecules (such as surface soil and vegetation molecules) or negative electric charges the near-ground clouds, thus producing a charge neutralization reaction resulting in an electrodischarge phenomenon similar to that observed during the volcanic eruption process. In addition, with the gradual accumulation of positive electric charges in the air, electrically charged methane near the land surface forms positively electrically charged aerosols with water molecules and dust, thus accelerating convection, further accelerating the movement of electric charges and enhancing the electrodischarge phenomenon. Therefore, the gradually accumulated surface static electricity and atmospheric electrodischarge further ignite combustibles such as near-surface, high-concentration methane gas and plant residue.
The relatively high pressures and concentrations associated with this process reduce the ignition temperature of the methane gas. Therefore, the gradual degradation of permafrost and the release of large amounts of methane gas into the atmosphere promote the lightning–wildfire–vegetation feedback mechanism associated with permafrost and increase the risk of wildfires in degraded permafrost areas owing to friction electrification.

Author Contributions

Data curation: C.Z. and L.Q.; Formal analysis: Z.X. and Y.G.; Funding acquisition: W.S.; Investigation: W.S., Z.X. and Y.G.; Methodology: Z.X.; Project administration: W.S.; Data acquisition: Z.X. and Y.G.; Supervision: W.S.; Validation: W.S.; Visualization: Z.X. and Y.G.; Writing—original draft: Z.X.; Writing—review and editing: W.S. All authors have read and agreed to the published version of the manuscript.

Funding

We thank the National Natural Science Foundation of China (Grant No. 41641024) and Science and the Technology Project of Heilongjiang Communications Investment Group (Grant No. JT-100000-ZC-FW-2021-0182) for providing financial support and the Field scientific observation and research station of the Ministry of Education-Geological environment system of permafrost area in Northeast China (MEORS-PGSNEC).

Institutional Review Board Statement

Not applicable.

Informed Consent Statement

Not applicable.

Data Availability Statement

Related data are available upon reasonable request.

Conflicts of Interest

The authors declare no conflict of interest.

References

  1. Isaksen, I.S.A.; Gauss, M.; Myhre, G.; Anthony, K.M.W.; Ruppel, C. Strong atmospheric chemistry feedback to climate warming from Arctic methane emissions. Glob. Biogeochem. Cycles 2011, 25, GB2002. [Google Scholar] [CrossRef]
  2. Walter, K.M.; Zimov, S.A.; Chanton, J.P.; Verbyla, D.; Chapin, F.S. Methane bubbling from Siberian thaw lakes as a positive feedback to climate warming. Nature 2006, 443, 71–75. [Google Scholar] [CrossRef] [PubMed]
  3. Xu, X.; Tian, H. Methane exchange between marshland and the atmosphere over China during 1949–2008. Glob. Biogeochem. Cycles 2012, 26, GB2006. [Google Scholar] [CrossRef]
  4. Xu, X.F.; Tian, H.Q.; Zhang, C.; Liu, M.L.; Ren, W.; Chen, G.S.; Lu, C.Q.; Bruhwiler, L. Attribution of spatial and temporal variations in terrestrial methane flux over North America. Biogeosciences 2010, 7, 3637–3655. [Google Scholar] [CrossRef] [Green Version]
  5. Schuur, E.A.G.; McGuire, A.D.; Schädel, C.; Grosse, G.; Harden, J.W.; Hayes, D.J.; Hugelius, G.; Koven, C.D.; Kuhry, P.; Lawrence, D.M.; et al. Climate change and the permafrost carbon feedback. Nature 2015, 520, 171–179. [Google Scholar] [CrossRef] [PubMed]
  6. Dallimore, S.R.; Collett, T.S. Intrapermafrost gas hydrates from a deep core hole in the Mackenzie Delta, Northwest Territories, Canada. Geology 1995, 23, 527–530. [Google Scholar] [CrossRef]
  7. Yakushev, V.; Chuvilin, E. Natural gas and gas hydrate accumulations within permafrost in Russia. Cold Reg. Sci. Technol. 2000, 31, 189–197. [Google Scholar] [CrossRef]
  8. Hugelius, G.; Strauss, J.; Zubrzycki, S.; Harden, J.W.; Schuur, E.A.G.; Ping, C.-L.; Schirrmeister, L.; Grosse, G.; Michaelson, G.J.; Koven, C.D.; et al. Estimated stocks of circumpolar permafrost carbon with quantified uncertainty ranges and identified data gaps. Biogeosciences 2014, 11, 6573–6593. [Google Scholar] [CrossRef] [Green Version]
  9. Wang, X.; Li, X.; Hu, Y.; Lv, J.; Sun, J.; Li, Z.; Wu, Z. Effect of temperature and moisture on soil organic carbon mineralization of predominantly permafrost peatland in the Great Hing’an Mountains, Northeastern China. J. Environ. Sci. 2010, 22, 1057–1066. [Google Scholar] [CrossRef]
  10. Burke, S.A.; Wik, M.; Lang, A.; Contosta, A.R.; Palace, M.; Crill, P.M.; Varner, R.K. Long-Term Measurements of Methane Ebullition From Thaw Ponds. J. Geophys. Res. Biogeosci. 2019, 124, 2208–2221. [Google Scholar] [CrossRef]
  11. Yun, H.; Wu, Q.; Zhuang, Q.; Chen, A.; Yu, T.; Lyu, Z.; Yang, Y.; Jin, H.; Liu, G.; Qu, Y.; et al. Consumption of atmospheric methane by the Qinghai–Tibet Plateau alpine steppe ecosystem. Cryosphere 2018, 12, 2803–2819. [Google Scholar] [CrossRef] [Green Version]
  12. Kharuk, V.I.; Ponomarev, E.I. Spatiotemporal characteristics of wildfire frequency and relative area burned in larch-dominated forests of Central Siberia. Russ. J. Ecol. 2017, 48, 507–512. [Google Scholar] [CrossRef]
  13. Zhou, Y.W. Frozen Soil in China; Science Press: Beijing, China, 2000. (In Chinese) [Google Scholar]
  14. Chunjiao, W.; Monan, S.; Zhaoguang, H.; Wei, S. Multi-spectral remote sensing based land surface temperature retrieval and isolated permafrost zone segmentation. Infrared Laser Eng. 2015, 44, 1390–1396. (In Chinese) [Google Scholar]
  15. Wei, Z.; Jin, H.; Zhang, J.; Yu, S.; Han, X.; Ji, Y.; He, R.; Chang, X. Prediction of permafrost changes in Northeastern China under a changing climate. Sci. China Earth Sci. 2011, 54, 924–935. [Google Scholar] [CrossRef]
  16. Sun, G.Y. Discussion on the symbiotic mechanisms of swamp with permafrost-Taking Da-Xiao Hinggan Mountains as examples. J. Glaciol. Geocryol. 2000, 22, 309–316. (In Chinese) [Google Scholar]
  17. Guo, D.X.; Wang, S.L.; Lu, G.W.; Dai, J.B.; Li, E.Y. Division of permafrost regions in Daxiao Hinggan Ling northeast China. J. Glaciol. Geocryol. 1981, 3, 1–9. (In Chinese) [Google Scholar]
  18. Jin, H.; Yu, Q.; Lü, L.; Guo, D.; He, R.; Yu, S.; Sun, G.; Li, Y. Degradation of permafrost in the Xing’anling Mountains, northeastern China. Permafr. Periglac. Process. 2007, 18, 245–258. [Google Scholar] [CrossRef]
  19. Zuo, H.C.; Lu, S.H.; Hu, Y.Q. Variations trend of yearly mean air temperature and precipitain in China in the last 50 years. Plateau Meteorol. 2004, 23, 238–244. (In Chinese) [Google Scholar]
  20. Ren, G.Y.; Guo, J.; Xu, M.Z. Climate changes of China’s mainland over the past half century. Acta Meteorol. Sin. 2005, 63, 942–956. (In Chinese) [Google Scholar]
  21. He, W.; Bu, R.C.; Xiong, Z.P.; Hu, Y.M. Characteristics of temperature and precipitation in Northeastern China from 1961 to 2005. Acta Ecol. Sin. 2013, 33, 519–531. (In Chinese) [Google Scholar] [CrossRef]
  22. Song, C.; Xu, X.; Sun, X.; Tian, H.; Sun, L.; Miao, Y.; Wang, X.; Guo, Y. Large methane emission upon spring thaw from natural wetlands in the northern permafrost region. Environ. Res. Lett. 2012, 7, 034009. [Google Scholar] [CrossRef] [Green Version]
  23. IPCC. Summary for Policymakers. In Climate Change 2021: The Physical Science Basis. Contribution of Working Group I to the Sixth Assessment Report of the Intergovernmental Panel on Climate Change; Cambridge University Press: Cambridge, UK, 2021; in press. [Google Scholar]
  24. Shvidenko, A.Z.; Schepaschenko, D.G. Climate change and wildfires in Russia. Contemp. Probl. Ecol. 2013, 6, 50–61. [Google Scholar] [CrossRef]
  25. Shan, W.; Xu, Z.; Guo, Y.; Zhang, C.; Hu, Z.; Wang, Y. Geological methane emissions and wildfire risk in the degraded permafrost area of the Xiao Xing’an Mountains, China. Sci. Rep. 2020, 10, 21297. [Google Scholar] [CrossRef] [PubMed]
  26. Tokida, T.; Mizoguchi, M.; Miyazaki, T.; Kagemoto, A.; Nagata, O.; Hatano, R. Episodic release of methane bubbles from peatland during spring thaw. Chemosphere 2007, 70, 165–171. [Google Scholar] [CrossRef] [PubMed]
  27. Klein, A. Volcano Eruption in Tonga Was a Once-in-a-Millennium Event. News Scientist. 2022. Available online: https://www.newscientist.com/article/2304822-volcanoeruption-in-tonga-was-a-once-in-a-millennium-event/ (accessed on 17 January 2022).
  28. Ye, L.; Kanamori, H.; Rivera, L.; Lay, T.; Zhou, Y.; Sianipar, D.; Satake, K. The 22 December 2018 tsunami from flank collapse of Anak Krakatau volcano during eruption. Sci. Adv. 2020, 6, eaaz1377. [Google Scholar] [CrossRef] [PubMed] [Green Version]
  29. Kaponig, M.; Mölleken, A.; Nienhaus, H.; Möller, R. Dynamics of contact electrification. Sci. Adv. 2021, 7, eabg7595. [Google Scholar] [CrossRef] [PubMed]
  30. Anderson, R.; Gathman, S.; Hughes, J.; Björnsson, S.; Jónasson, S.; Blanchard, D.C.; Moore, C.B.; Survilas, H.J.; Vonnegut, B. Electricity in Volcanic Clouds. Science 1965, 148, 1179–1189. [Google Scholar] [CrossRef] [PubMed]
  31. Sides, I.R.; Edmonds, M.; MacLennan, J.; Swanson, D.A.; Houghton, B.F. Eruption style at Kīlauea Volcano in Hawai‘i linked to primary melt composition. Nat. Geosci. 2014, 7, 464–469. [Google Scholar] [CrossRef]
  32. Greason, W.D. Investigation of a Test Methodology for Triboelectrification. J. Electrost. 1999, 49, 245–256. [Google Scholar] [CrossRef]
  33. Ning, L.; Jian, L.; Yang, S.; Wang, J.; Ren, J.; Wang, J. Effect of carbon black on triboelectrification electrostatic potential of MC nylon composites. Tribol. Int. 2010, 43, 568–576. [Google Scholar] [CrossRef]
  34. Wang, H.; Chen, Q.; Zhang, X.; Tan, Z.; Wang, S.; Zhou, N. Effect of chemical conditioning on the triboelectrification of coal and mineral particles. Min. Sci. Technol. 2010, 20, 421–424. [Google Scholar] [CrossRef]
  35. Chen, Y.; Romps, D.M.; Seeley, J.T.; Veraverbeke, S.; Riley, W.J.; Mekonnen, Z.A.; Randerson, J.T. Future increases in Arctic lightning and fire risk for permafrost carbon. Nat. Clim. Chang. 2021, 11, 404–410. [Google Scholar] [CrossRef]
  36. Finney, D.L. Lightning threatens permafrost. Nat. Clim. Chang. 2021, 11, 379–380. [Google Scholar] [CrossRef]
  37. Veraverbeke, S.; Rogers, B.M.; Goulden, M.L.; Jandt, R.; Miller, C.E.; Wiggins, E.B.; Randerson, J.T. Lightning as a major driver of recent large fire years in North American boreal forests. Nat. Clim. Chang. 2017, 7, 529–534. [Google Scholar] [CrossRef]
  38. Witze, A. The Arctic is burning like never before—And that’s bad news for climate change. Nature 2020, 585, 336–337. [Google Scholar] [CrossRef] [PubMed]
  39. Price, C. Lightning applications in weather and climate research. Surv. Geophys. 2013, 34, 755–767. [Google Scholar] [CrossRef]
  40. Williams, E. Lightning and climate: A review. Atmos. Res. 2005, 76, 272–287. [Google Scholar] [CrossRef]
  41. Christian, H.J.; Blakeslee, R.; Boccippio, D.J.; Boeck, W.L.; Buechler, D.E.; Driscoll, K.T.; Goodman, S.J.; Hall, J.M.; Koshak, W.J.; Mach, D.M.; et al. Global frequency and distribution of lightning as observed from space by the Optical Transient Detector. J. Geophys. Res. Earth Surf. 2003, 108, 1–15. [Google Scholar] [CrossRef]
  42. Albrecht, R.I.; Goodman, S.J.; Buechler, D.E.; Blakeslee, R.; Christian, H.J. Where Are the Lightning Hotspots on Earth? Bull. Am. Meteorol. Soc. 2016, 97, 2051–2068. [Google Scholar] [CrossRef]
  43. Kim, Y. Effect of forest fire on the fluxes of CO2, CH4 and N2O in boreal forest soils, interior Alaska. J. Geophys. Res. Earth Surf. 2003, 108, D18154. [Google Scholar] [CrossRef]
  44. Holzworth, R.H.; Brundell, J.B.; McCarthy, M.P.; Jacobson, A.R.; Rodger, C.J.; Anderson, T.S. Lightning in the Arctic. Geophys. Res. Lett. 2021, 48, e2020GL091366. [Google Scholar] [CrossRef]
  45. Hu, K.; Lu, R.; Wang, D. Seasonal climatology of cut-off lows and associated precipitation patterns over Northeast China. Arch. Meteorol. Geophys. Bioclimatol. Ser. B 2009, 106, 37–48. [Google Scholar] [CrossRef]
  46. Hu, P.Y.; Chen, C.L.; Lin, H.F.; Xu, S.; Kong, L.; Liu, Q.; Ji, Y.; Zhao, Z. Definition and characteristics analysis of the intensity of Northeast Cold Vortex. J. Meteorol. Environ. 2021, 37, 100–105. (In Chinese) [Google Scholar]
  47. Lifu, S.; Mingyu, W.; Zhongqi, L. The fire environment mechanism of lighting fire formed for Daxing’an Mountains. Sci. Silvae Sin. 2003, 39, 94–99. (In Chinese) [Google Scholar]
  48. Zhao, Y.H.; Kang, X.G.; Guo, G.M. Spatial and temporal distribution of lightning fire in Northeast China based on LIS/OTD grid data. Chin. J. Ecol. 2009, 28, 715–720. (In Chinese) [Google Scholar]
  49. Feng, J.W.; Shen, H.; Liang, D. Study on the occurrence law of forest lightning fire. Acta Sci. Nat. Univ. Sunyatseni 2021, 60, 131–137. (In Chinese) [Google Scholar]
  50. Rogers, B.M.; Soja, A.J.; Goulden, M.L.; Randerson, J.T. Influence of tree species on continental differences in boreal fires and climate feedbacks. Nat. Geosci. 2015, 8, 228–234. [Google Scholar] [CrossRef]
  51. Ma, K.; You, L.; Liu, J.; Zhang, M. A Hybrid Wetland Map for China: A Synergistic Approach Using Census and Spatially Explicit Datasets. PLoS ONE 2012, 7, e47814. [Google Scholar] [CrossRef] [PubMed] [Green Version]
  52. Guo, Y.; Shan, W.; Zhang, C.; Hu, Z.; Wang, S.; Gao, J. Monitoring of permafrost degradation along the Bei’an-Heihe Expressway in China. Bull. Eng. Geol. Environ. 2020, 80, 1–10. [Google Scholar] [CrossRef]
  53. Dise, N.B. Winter fluxes of methane from Minnesota peatlands. Biogeochemistry 1992, 17, 71–83. [Google Scholar] [CrossRef]
  54. Melloh, R.A.; Crill, P.M. Winter methane dynamics beneath ice and in snow in a temperate poor fen. Hydrol. Process 1995, 9, 947–956. [Google Scholar] [CrossRef]
  55. Helbig, M.; Quinton, L.W.; Sonnentag, O. Warmer spring conditions increase annual methane emissions from a boreal peat landscape with sporadic permafrost. Environ. Res. Lett 2017, 12, 115009. [Google Scholar] [CrossRef] [Green Version]
  56. Hao, Q.J.; Wang, Y.S.; Song, C.C.; Huang, Y. Contribution of winter fluxes to the annual CH4, CO2 and N2O emissions from freshwater marshes in the Sanjiang Plain. J. Environ. Sci. 2006, 18, 270–275. [Google Scholar]
  57. Song, C.; Xu, X.; Tian, H.; Wang, Y. Ecosystem-atmosphere exchange of CH4 and N2O and ecosystem respiration in wetlands in the Sanjiang Plain, Northeastern China. Glob. Chang. Biol. 2009, 15, 692–705. [Google Scholar] [CrossRef]
  58. Le Mer, J.; Roger, P. Production, oxidation, emission and consumption of methane by soils: A review. Eur. J. Soil Biol. 2001, 37, 25–50. [Google Scholar] [CrossRef]
  59. Roslev, P.; King, G.M. Regulation of methane oxidation in a freshwater wetland by water table changes and anoxia. FEMS Microbiol. Ecol. 1996, 19, 105–115. [Google Scholar] [CrossRef]
  60. Price, C.; Rind, D. The impact of a 2×CO2 climate on lightning-caused fires. J. Clim. 1994, 7, 1484–1494. [Google Scholar] [CrossRef] [Green Version]
  61. Yin, S.N.; Wang, D.C.; Shan, T.L.; Han, X.Y.; Gao, B.; Wang, M.X. Temporal and spatial distribution characteristics of forest fires caused by three main fire sources in Heilongjiang Province. For. Sci. 2021, 6, 115–124. (In Chinese) [Google Scholar] [CrossRef]
  62. Kolmašová, I.; Santolík, O.; Kašpar, P.; Popek, M.; Pizzuti, A.; Spurný, P.; Borovička, J.; Mlynarczyk, J.; Manninen, J.; Macotela, E.L.; et al. First Observations of Elves and Their Causative Very Strong Lightning Discharges in an Unusual Small-Scale Continental Spring-Time Thunderstorm. J. Geophys. Res. Atmos. 2020, 126, e2020JD032825. [Google Scholar] [CrossRef]
  63. Taylor, A.R. Ecological aspects of lightning in forests. Proc. Tall Timbers Fire Ecol. Conf. 1974, 13, 455–482. [Google Scholar]
  64. Yang, J.; He, Q.J.; Zhong, L.H. Research Progress of Lightning Discharges Between Thundercloud Top and Lower Ionosphere. Meteorol. Environ. Sci. 2018, 41, 117–127. (In Chinese) [Google Scholar]
  65. Zhang, J.Y.; Coote, M.L.; Clampi, S. Electrostatics and Electrochemistry: Mechanism and Scope of Charge-Transfer Reactions on the Surface of Tribocharged Insulators. J. Am. Chem. Soc. 2021, 143, 3019–3032. [Google Scholar] [CrossRef] [PubMed]
  66. Harper, J.S.M.; Cimarelli, C.; Dufek, J.; Gaudin, D.; Thomas, R.J. Inferring Compressible Fluid Dynamics From Vent Discharges During Volcanic Eruptions. Geophys. Res. Lett. 2018, 45, 7226–7235. [Google Scholar] [CrossRef] [Green Version]
  67. Zhu, Y.; Jiang, S.Y. Analysis of Electrostatic Signal in Gas Solid Two Phase Flow. Comput. Simul. 2016, 33, 192–196. (In Chinese) [Google Scholar]
  68. Hasegawa, T.; Komori, C.; Matsuyama, T. Microscale gap breakdown induced by toner triboelectrification. Adv. Powder Technol. 2015, 26, 42–48. [Google Scholar] [CrossRef]
  69. Pan, S.H.; Yin, N.A.; Zhang, Z.N. Time-& Load-Dependence of Triboelectric Effect. Sci. Rep. 2018, 8, 2470. [Google Scholar] [CrossRef] [PubMed] [Green Version]
  70. Grosshans, H.; Papalexandris, M.V. Direct numerical simulation of triboelectric charging in particle-laden turbulent channel flows. J. Fluid Mech. 2017, 818, 465–491. [Google Scholar] [CrossRef]
  71. Zhang, X.; Zheng, Y.; Wang, D.; Rahman, Z.U.; Zhou, F. Liquid–solid contact triboelectrification and its use in self-powered nanosensor for detecting organics in water. Nano Energy 2016, 30, 321–329. [Google Scholar] [CrossRef]
  72. Zhao, Y.; Fang, J.; Wang, Y.; Shen, Y.; Yao, J.; Wang, C.-H. Experimental investigation of surface roughness effect on electrostatics generation. Powder Technol. 2019, 357, 33–45. [Google Scholar] [CrossRef]
  73. Morrow, R.; Blackburn, T.R. The stepped nature of lightning, and the upward connecting streamer. J. Phys. D Appl. Phys. 2002, 35, 69–73. [Google Scholar] [CrossRef]
  74. Tian, Y.; Qie, X.; Lu, G.; Jiang, R.; Wang, Z.; Zhang, H.; Liu, M.; Sun, Z.; Feng, G. Characteristics of a bipolar cloud-to-ground lightning flash containing a positive stroke followed by three negative strokes. Atmos. Res. 2016, 176–177, 222–230. [Google Scholar] [CrossRef]
  75. Wan, H.J.; Wei, G.H.; Chen, Y.Z. Distribution features of the electric field and charge density in the lightning leader channe. Chin. J. Ship Res. 2005, 10, 55–59. (In Chinese) [Google Scholar]
  76. Li, X.; Tao, J.; Wang, X.; Zhu, J.; Pan, C.; Wang, Z.L. Networks of High Performance Triboelectric Nanogenerators Based on Liquid-Solid Interface Contact Electrification for Harvesting Low-Frequency Blue Energy. Adv. Energy Mater. 2018, 8, 1800705. [Google Scholar] [CrossRef]
  77. Sun, Q.-X.; Zhuang, J.-H.; Liu, B.-C.; Shen, Z.-X. Triboelectrification in moving particle flow. Acta Phys. Sin. 2022, 71, 084501. (In Chinese) [Google Scholar] [CrossRef]
  78. Fang, J.; Zhao, Y.L.; Yao, J.; Wang, C.H. Experimental investigation of electrostatic generation of coal granules. J. Univ. Chin. Acad. Sci. 2020, 37, 220–227. (In Chinese) [Google Scholar]
  79. Lin, Q.Z.; Zhu, J.P.; Wang, Q.A. Study on forest fire caused by lightning strike. Fire Saf. Sci. 1999, 8, 15–21. (In Chinese) [Google Scholar]
  80. Sun, D.; Yao, S.R.; Han, H.J. Overview of lightning fire formation, distribution and monitoring. For. Fire Prev. 2006, 2, 11–14. (In Chinese) [Google Scholar]
  81. Zheng, H.N.; Di, X.Y.; Yao, S.R. Forest Fire in Northeast China; Northeast Forestry University Press: Harbin, China, 2001. (In Chinese) [Google Scholar]
  82. Shu, Y.; Zhou, M.; Zhao, P.W.; Zhang, H.; Guo, J.Y.; Guan, L.J. Dead fuel load on the surface and its influencing factors after lightning fire interference in the Genhe river of the great Hinggan Mountains. J. Ecol. Environ. 2021, 30, 2317–2323. (In Chinese) [Google Scholar] [CrossRef]
  83. Williams, F.A. Combustion-Theory; Taylor & Francis Inc.: London, UK, 1994. [Google Scholar]
  84. Katharine, S. Aerosols make methane more potent. Nature 2009, 66, 1–3. [Google Scholar] [CrossRef]
  85. Shindell, D.T.; Faluvegi, G.; Koch, D.M.; Schmidt, G.A.; Unger, N.; Bauer, S.E. Improved Attribution of Climate Forcing to Emissions. Science 2009, 326, 716–718. [Google Scholar] [CrossRef] [PubMed] [Green Version]
  86. Arneth, A.; Unger, N.; Kulmala, M.; Andreae, M.O. Clean the Air, Heat the Planet? Science 2009, 326, 672–673. [Google Scholar] [CrossRef]
  87. Cimarelli, C.; Alatorre-Ibargüengoitia, M.A.; Kueppers, U.; Scheu, B.; Dingwell, D. Experimental generation of volcanic lightning. Geology 2014, 42, 79–82. [Google Scholar] [CrossRef] [Green Version]
  88. Burton, T.M.; Eaton, J.K. Fully resolved simulations of particle-turbulence interaction. J. Fluid Mech. 2005, 545, 67–111. [Google Scholar] [CrossRef]
  89. Strack, M.; Hayne, S.; Lovitt, J.; McDermid, G.J.; Rahman, M.M.; Saraswati, S.; Xu, B. Petroleum exploration increases methane emissions from northern peatlands. Nat. Commun. 2019, 10, 2804. [Google Scholar] [CrossRef] [Green Version]
  90. Melloh, R.A.; Crill, P.M. Winter methane dynamics in a temperate peatland. Glob. Biogeochem. Cycles 1996, 10, 247–254. [Google Scholar] [CrossRef]
  91. Perkins, S. You’re more likely to get struck by lightning here than anywhere else on Earth. Science, 2016. [Google Scholar] [CrossRef]
  92. McNutt, S.R.; Williams, E.R. Volcanic lightning: Global observations and constraints on source mechanisms. Bull. Volcanol. 2010, 72, 1153–1167. [Google Scholar] [CrossRef]
  93. Thomas, R.J.; Krehbiel, P.R.; Rison, W.; Edens, H.E.; Aulich, G.D.; Winn, W.P.; McNutt, S.R.; Tytgat, G.; Clark, E. Electrical Activity During the 2006 Mount St. Augustine Volcanic Eruptions. Science 2007, 315, 1097. [Google Scholar] [CrossRef] [PubMed]
  94. Alatorre-Ibargüengoitia, M.A.; Scheu, B.; Dingwell, D.B. Influence of the fragmentation process on the dynamics of Vulcanian eruptions: An experimental approach. Earth Planet. Sci. Lett. 2011, 302, 51–59. [Google Scholar] [CrossRef]
  95. Kochtubajda, B.; Flannigan, M.D.; Gyakum, J.R.; Stewart, R.E.; Logan, K.A.; Nguyen, T.-V. Lightning and Fires in the Northwest Territories and responses to future climate change. Arctic 2006, 59, 211–221. [Google Scholar] [CrossRef]
  96. Dissing, D.; Verbyla, D.L. Spatial patterns of lightning strikes in interior Alaska and their relations to elevation and vegetation. Can. J. For. Res. 2003, 33, 770–782. [Google Scholar] [CrossRef]
  97. Justino, F.; Bromwich, D.H.; Schumacher, V.; Dasilva, A.; Wang, S.-H. Arctic Oscillation and Pacific-North American pattern dominated-modulation of fire danger and wildfire occurrence. NPJ Clim. Atmos. Sci. 2022, 5, 1–13. [Google Scholar] [CrossRef]
  98. Price, C.; Rind, D.J. Possible implications of global climate change on global lightning distributions and frequencies. J. Geophys. Res. Atmos. 1994, 99, 10823–10831. [Google Scholar] [CrossRef]
  99. Rivera-Huerta, H.; Safford, H.D.; Miller, J.D. Patterns and trends in burned area and fire severity from 1984 to 2010 in the sierra de san pedro martir, baja california, Mexico. Fire Ecol. 2016, 12, 52–72. [Google Scholar] [CrossRef]
  100. Minnich, R.A. Fire mosaics in southern-california and northern baja california. Science 1983, 219, 1287–1294. [Google Scholar] [CrossRef] [Green Version]
  101. Liu, J.C.; Tang, B.; Zou, Y. GIS-Based Spatial and Temporal Distribution Characteristics and Factor Analysis of Forest Fires-Taking California, USA as An Example. J. Northeast. For. Univ. 2020, 48, 70–74. (In Chinese) [Google Scholar]
  102. Bendix, J.; Hartnett, J.J. Asynchronous lightning and Santa Ana winds highlight human role in southern California fire regimes. Environ. Res. Lett. 2018, 13, 074024. [Google Scholar] [CrossRef]
  103. Zhang, J.-L.; Bi, W.; Wang, X.-H.; Wang, Z.-B.; Li, D.-F. Lightning-caused fire, its affecting factors and prediction: A review. J. Appl. Ecol. 2013, 24, 2674–2684. (In Chinese) [Google Scholar]
  104. Mahaney, W.C.; Milber, M.W. Lightning-induced mineral/chemical changes in red pine (Pinus resinosa). Palaeogeogr. Palaeoclimatol. Palaeoecol. 2011, 309, 367–373. [Google Scholar] [CrossRef]
  105. Underwood, E. Why mountainous upland forests emit so much methane. EOS 2017, 98, 79–82. [Google Scholar] [CrossRef]
  106. Sidder, A. Coastal flooding enhances methane buildup in forests. J. Geophys. Res. Biogeosci. 2021, 102, 123–132. [Google Scholar] [CrossRef]
  107. Zhuang, J.J.; Tian, Y. Dynamics of methane and other greenhouse gases flux in forest ecosystems in China. J. Environ. Sci. Health Part A-Toxic/Hazard. Subst. Environ. Eng. 2020, 56, 241–247. [Google Scholar] [CrossRef]
  108. Mazzola, V.; Perks, M.P.; Smith, J.; Yeluripati, J.; Xenakis, G. Seasonal patterns of greenhouse gas emissions from a forest-to-bog restored site in northern Scotland: Influence of microtopography and vegetation on carbon dioxide and methane dynamics. Eur. J. Soil Sci. 2020, 72, 1332–1353. [Google Scholar] [CrossRef]
  109. Miller, J.D.; Safford, H. Trends in wildfire severity: 1984 to 2010 in the Sierra Nevada, Modoc Plateau, and southern Cascades, California, USA. Fire Ecol. 2012, 8, 41–57. [Google Scholar] [CrossRef]
  110. Peterson, D.A.; Hyer, E.; Campbell, J.; Fromm, M.D.; Hair, J.W.; Butler, C.F.; Fenn, M.A. The 2013 Rim Fire: Implications for Predicting Extreme Fire Spread, Pyroconvection, and Smoke Emissions. Bull. Am. Meteorol. Soc. 2015, 96, 229–247. [Google Scholar] [CrossRef]
  111. Westerling, A.L.; Gershunov, A.; Brown, T.J.; Cayan, D.R.; Dettinger, M.D. Climate and Wildfire in the Western United States. Bull. Am. Meteorol. Soc. 2003, 84, 595–604. [Google Scholar] [CrossRef] [Green Version]
  112. Westerling, A.L.; Hidalgo, H.G.; Cayan, D.R.; Swetnam, T.W. Warming and earlier spring increase western U.S. forest wildfire activity. Science 2006, 313, 940. [Google Scholar] [CrossRef] [PubMed] [Green Version]
  113. Chen, B.; Jin, Y.; Scaduto, E.; Moritz, M.A.; Goulden, M.L.; Randerson, J.T. Climate, Fuel, and Land Use Shaped the Spatial Pattern of Wildfire in California’s Sierra Nevada. J. Geophys. Res. Biogeosci. 2021, 126, e2020JG005786. [Google Scholar] [CrossRef]
  114. Shi, G.; Yan, H.; Zhang, W.; Dodson, J.; Heijnis, H.; Burrows, M. Rapid warming has resulted in more wildfires in northeastern Australia. Sci. Total Environ. 2021, 771, 144888. [Google Scholar] [CrossRef]
Figure 1. Spatial coverage rate of swamp wetlands in China (data from Mao K. et al. [51]). (a) Distribution of swamplands in Heilongjiang Province of China at ca. 49.5 degrees north. (b,c) Degraded permafrost areas containing swamp wetlands near the study area; many wildfires occur in these relatively humid swamp wetlands every spring. (d) Degraded permafrost area containing swamp wetlands in study area R-1; extensive water can be observed in summer.
Sustainability 14 09193 g001
Figure 2. Distribution characteristics of the burned area, land surface temperatures, and land surface humidity near the study area (data from https://glovis.usgs.gov/ and https://apps.sentinelhub.com/) (accessed on 28 May 2021). (a) Distribution characteristics of the burned areas and land surface temperatures near the study area. (b) Distribution characteristics of the burned areas and land surface humidity conditions near the study area.
Sustainability 14 09193 g002
Figure 3. On-site monitoring and methane gas emissions in study areas R-1 and R-2. (a) Location of the ground temperature and humidity sensor, land surface methane concentration sensor, atmospheric electric field instrument, and drill hole in study area R-1. (b) Location of the land surface methane concentration sensor in study area R-2. (c) Winter ice layer in a swamp within study area R-1. (d) Winter ice layer and a large number of methane bubbles under the ice layer in a swamp within study area R-1. (e) Methane leakage point formed by the melting of frozen soil in spring near the study area, at a concentration of 2130 ppm determined using the SKZ1050-CH4 handheld methane detector. (f) Combustion of ice containing methane (methane-like hydrate). (g) Ice cores containing methane bubbles found by drilling. (h) Ice cores containing methane bubbles found by drilling. (i) Locations of the meteorological station and land surface methane concentration sensor (QT21-BX80-CH4) in study area R-1. (j) Locations of the meteorological station and land surface methane concentration sensor in study area R-2.
Sustainability 14 09193 g003
Figure 4. Monitored parameters in study areas R1 and R2. (a) Air temperature and pore water pressure at 1 m underground in study area R-1. (b) Air humidity in study area R–1. (c) Atmospheric pressure in study area R–1. (d) Land surface methane concentrations in study areas R–1 and R–2.
Sustainability 14 09193 g004
Figure 5. Distribution of permafrost and burned areas near study area R-1 and study area R-2 in Xiao Xing’an Mountains, Heilongjiang Province (24 March 2021). The pink area is the distribution area of permafrost; the data were obtained from https://glovis.usgs.gov/ [14] (accessed on 28 May 2021). The black brown areas are burned areas and the red areas indicate the locations at which fires began.
Sustainability 14 09193 g005
Figure 6. Conceptual model of the electric charge changes associated with methane gas. (a) When the frozen layer and snow are not melted, the positive electric charge on the ground gradually accumulates in high places (trees, etc.), thus forming a positive electric charge flow column and contacting the stepped leader in the air to induce electrodischarge. (b) After the frozen layer and snow melt, the positive electric charge on the ground gradually accumulates in high places (trees, etc.), thus forming a positive electric charge flow column. The methane gas released from the ground strengthens the positive electric charge flow column and contactsmakes contact with the stepped leader, thereby enhancing the air electrodischarge phenomenon. (c) In the third stage, after the frozen layer and snow melt further, the positive electric charges on the ground gradually accumulate in high places (trees, etc.) to form a positive electric charge flow column. The methane gas released from the ground strengthens the positive charge flow column and contactsmakes contact with the stepped leader, thereby enhancing the air electrodischarge phenomenon.
Sustainability 14 09193 g006
Figure 7. Schematic diagrams of indoor gas–solid friction tests. (a) Photo of indoor gas–solid friction tests; test box A was static, and test box B was subjected to a ventilation test in which, after the soil was filled with gas, in addition to the friction between gas molecules and soil molecules, friction between gas molecules and gas molecules and between solid molecules and solid molecules was also induced. (b) Diagram displaying the mechanism by which indoor gas–solid friction tests were performed; when the gas underwent friction with the soil, the particles were electrically charged owing to the separation of the extranuclear electrons. (c) Voltage variation curve between the two test boxes with gas entry time. In addition, to prevent the influence of the blower on the electric charge data, we subjected the blower to an anti-static treatment.
Sustainability 14 09193 g007
Figure 8. Electric quantity change curves obtained through gas–solid friction tests. (a) Voltage changes derived in three identical specimens with time (wind speed: 8 m/s, humidity: 10%, sandy soil). (b) Voltage changes derived in three different specimens with time (wind speed: 8 m/s, humidity: 10%, clay, sandy soil, fine gravel soil). (c) Voltage changes derived at different wind speeds (wind speed: 4 m/s, 6 m/s, 8 m/s, and 10 m/s, humidity: 10%, sand soil). (d) Effect of the particle surface roughness on the static electricity quantity (humidity RH = 5%, 110,027 pulverized coal particles). (e) Effect of the particle surface roughness on the static electricity quantity (humidity RH = 15%, 110,027 pulverized coal particles). (f) Effects of friction and the sliding time on the static electricity quantity (particle shape: triangular; different colours represent different particles). (g) Effects of friction and the sliding time on the static electricity quantity (particle shape: trapezoid; different colours represent different particles). (h) Relationship between static electricity and the contact area under different humidity conditions (log). (i) Relationship between static electricity and the contact area under different humidity conditions (biochar). (j) Static electricity conditions under different flow ventilation modes in the vertical direction (the dispersed flow ventilation mode, the semi circulation ventilation mode, and the circulation ventilation mode). (k) Static electricity conditions under different flow ventilation modes in the horizontal direction (the dispersed flow ventilation mode, the semi circulation ventilation mode, and the circulation ventilation mode). (l) Static electricity under different flow ventilation modes in the vertical and horizontal directions (the dispersed flow ventilation mode, the semi circulation ventilation mode, and the circulation ventilation mode) [78,79].
Sustainability 14 09193 g008
Figure 9. On-site photos of the wildfire and atmospheric electric field instruments in the study area. (a) Wildfire that occurred near the study area on 19 March 2021, as obtained from Sentinel 2 (SENTINEL-2 L1C) imagery; the red area is the wildfire area, and the black area is the burned area. (b) EL-EFM1.0 atmospheric electric field instrument on-site photo. (c) Burned area in study area R-1 on 19 March 2021. (d) Details of the burned area in study area R-1 on 19 March 2021. (e) Burned area in study area R-2 on 19 March 2021. (f) Details of the burned area in study area R-2 on 19 March 2021. (g) Details of the burned area in study area R-2 on 19 March 2021, similar micro-volcanic areas. (h) Wildfire in study area R-1 on 22 March 2018, as obtained from Sentinel 2 (SENTINEL-2 L1C) imagery. (i) Wildfire in study R-1 on 22 March 2019, as obtained from Sentinel 2 (SENTINEL-2 L1C) imagery. (j) Wildfire in study area R-1 on 19 March 2020, as obtained from Sentinel 2 (SENTINEL-2 L1C) imagery. (k) Wildfire in study area R-1 on 19 March 2021, as obtained from Sentinel 2 (SENTINEL-2 L1C) imagery.
Sustainability 14 09193 g009
Figure 10. Changes in air humidity, soil humidity, soil temperature, pore water pressure, and solar radiation in study area R-1 from 10 March to 10 April 2018–2021. (a) Air humidity in 2018. (b) Air humidity in 2019. (c) Air humidity in 2020. (d) Soil temperature in 2020. (e) Soil humidity in 2020. (f) Pore water pressure in 2020. (g) Solar radiation in 2020. (h) Air humidity in 2021. (i) Soil temperature in 2021. (j) Soil humidity in 2021. (k) Pore water pressure in 2021. (l) Solar radiation in 2021. The red dotted line indicates the wildfire date.
Sustainability 14 09193 g010aSustainability 14 09193 g010b
Figure 11. Change curves of the atmospheric electric field. (a) Change curve of the atmospheric electric field on 15 February 2021, at which time the overall air temperature was negative and the snow and frozen layer had not melted. (b) Change curve of the atmospheric electric field on 15 March 2021, at which time the air temperature was gradually increasing and becoming positive, the snow and frozen layer were gradually melting, and snow was present from 10:00:00 to 14:00:00. (c) Change curve of the atmospheric electric field on 19 March 2021, at which time the air temperature was further increasing, the snow and frozen layer had further melted, and wildfires had occurred in study areas R-1 and R-2. (d) Change curve of the atmospheric electric field on 5 April 2021, at which time the air temperature had further increased and the air electrodischarge was more concentrated. (e) Change curve of the atmospheric electric field on 14 June 2021, at which time thunderstorm weather was occurring and the air electrodischarge was relatively high and concentrated. (f) Change curve of the atmospheric electric field on 16 July 2021, at which time the air temperature had increased in summer, the ground-atmosphere exchange was enhanced, and relatively great air electrodischarge was occurring. (g) Change curve of the atmospheric electric field on 30 September 2021. (h) Change curve of the atmospheric electric field on 16 November 2021. (i) Change curve of the atmospheric electric field on 15 December 2021, at which time the air temperature was low, convection was reduced, and the atmospheric electrodischarge was reduced. (j) Change curve of the atmospheric electric field on 12 January 2022, at which time the air temperature was low, convection was reduced, and the atmospheric electrodischarge phenomenon was reduced.
Sustainability 14 09193 g011
Figure 12. Local change curves of atmospheric electric field changes. (a) Atmospheric electric field changes on 10 February 2021. (b) Atmospheric electric field changes on 15 February 2021. (c) Atmospheric electric field changes on 19 March 2021. (d) Atmospheric electric field changes on 22 March 2021. (e) Atmospheric electric field changes on 23 March 2021. (f) Atmospheric electric field changes on 24 March 2021. (g) Atmospheric electric field changes on 25 March 2021. (h) Atmospheric electric field changes on 26 March 2021. (i) Atmospheric electric field changes on 27 March 2021. (j) Atmospheric electric field changes on 15 March 2021, at which time the air temperature had gradually increased to a positive value, the snow had begun to melt, snowfall occurred from 10:00:00 to 14:00:00, and the atmospheric electric field fluctuated significantly. (k) On-site photo taken in study area R-1 at 06:59:38 on 19 March 2021. (l) On-site photo taken in study area R-1 at 15:33:34 on 19 March 2021; in this photo, it can be seen that wildfires occurred between 06:59:38 and 15:33:34. (m) On-site photo taken in study area R-1 at 14:30:36 on 15 March 2021, at which time a large amount of snow had appeared on the site after the snowfall event from 10:00:00 to 14:00:00.
Sustainability 14 09193 g012aSustainability 14 09193 g012b
Figure 13. Conceptual model of methane emissions and their impact on wildfires in permafrost areas [89]. The top of the soil layer consists of relatively thick peat soil, the bottom layer is a permafrost layer that contains a certain amount of carbon that is gradually degraded and disturbed to form high-concentration methane gas, and the bottom layer is mudstone.
Sustainability 14 09193 g013
Publisher’s Note: MDPI stays neutral with regard to jurisdictional claims in published maps and institutional affiliations.

