1. Introduction
Future aircraft will be designed differently to make them more sustainable [
1]. They will be lighter, and more likely, the thrust will be generated using propellers, opening opportunities for battery power and reduction of environmental emissions [
2,
3]. Changes in the design of aircraft will mean that the noise and vibration experienced by passengers in aircraft will be different from that experienced in current aircraft. The aviation industry is stepping towards innovative technologies to improve comfort by reducing perceived discomfort for both crew and passengers due to noise and vibration inside the aircraft cabin. Turboprop (propeller passenger aircraft) are more fuel efficient than jets but generate more noise and vibration inside the cabin resulting in discomfort amongst both crew members and passengers [
4,
5]. Optimization of aircraft cabin noise levels and vibration magnitudes is essential to enhance the comfort of the passengers. The comfort perception of passengers in air vehicle environments is an essential consideration for aircraft cabin design, not only for wellbeing but also because a willingness to use similar aircraft again for traveling is influenced by human comfort [
6,
7].
Aircraft noise and vibration are closely linked such that the vibration caused by engines causes noise. This leads to a multi-modal environment affected by exposure to both noise and vibration.
Table 1 shows the human response to discomfort from different combinations of modalities, i.e., noise level and vibration magnitude. These can combine in different ways to dictate the human response.
As the relationship between noise-induced and vibration-induced discomfort is not fully known, it is possible that the human response to a combination of noise and vibration signals is
additive: any increase in either modality causes a linear increase in overall discomfort. The human response could also be
synergistic, where changes in one modality increase overall discomfort non-linearly. Finally, the human response could be
antagonistic, where increases in one modality reduce the sensitivity to other modalities causing a masking effect [
8].
Previous studies have shown that subjective ratings of noise and vibration can be matched to generate a level of equivalence [
9], although this has not been demonstrated for signals representative of the turboprop aircraft environment. There is an inevitable lack of ecological validity for laboratory studies that aim to determine feelings of discomfort. In the real environment, other factors such as seat design and legroom may be a higher priority for comfort rating than the noise and vibration [
10,
11]. However, studies that have compared noise ratings in a laboratory and aircraft cabin showed similar results in both settings for the modality of interest, indicating that conclusions obtained in the laboratory are transferrable to the aircraft [
12]. Some simulator studies have adjusted atmospheric conditions in addition to the noise [
13]. In addition, the act of administering questionnaires changes the aircraft experience (‘Hawthorne Effect’), although there have been attempts to use behavioral observation as an alternative measure [
14].
The aim of the research study in this article is to map how individual human comfort perception varies with different combinations of noise and vibration, specifically for turboprop aircraft stimuli. The research study presented in this article has been designed to test interaction effects and seek values for noise and vibration equivalence. The rest of the paper is divided into different sections. The materials and methods used in the study are in
Section 2.
Section 3 shows the results, while the discussion is illustrated in
Section 4. Lastly,
Section 5 lists the conclusions.
2. Materials and Methods
Eighteen volunteers (12 male, 6 female; 19–52 years) participated in a laboratory experiment at Nottingham Trent University, UK. The study was approved by the NTU Research Ethics Committee, and all participants provided written informed consent. Previous repeated-measures design laboratory studies of perception of noise and vibration have used participant sample studies of around 12 [
15]. Ethical considerations mean that there is a need to ensure a balance of scientific rigor and demands on participants (time and residual risk); therefore, the number of participants used in this study was 18.
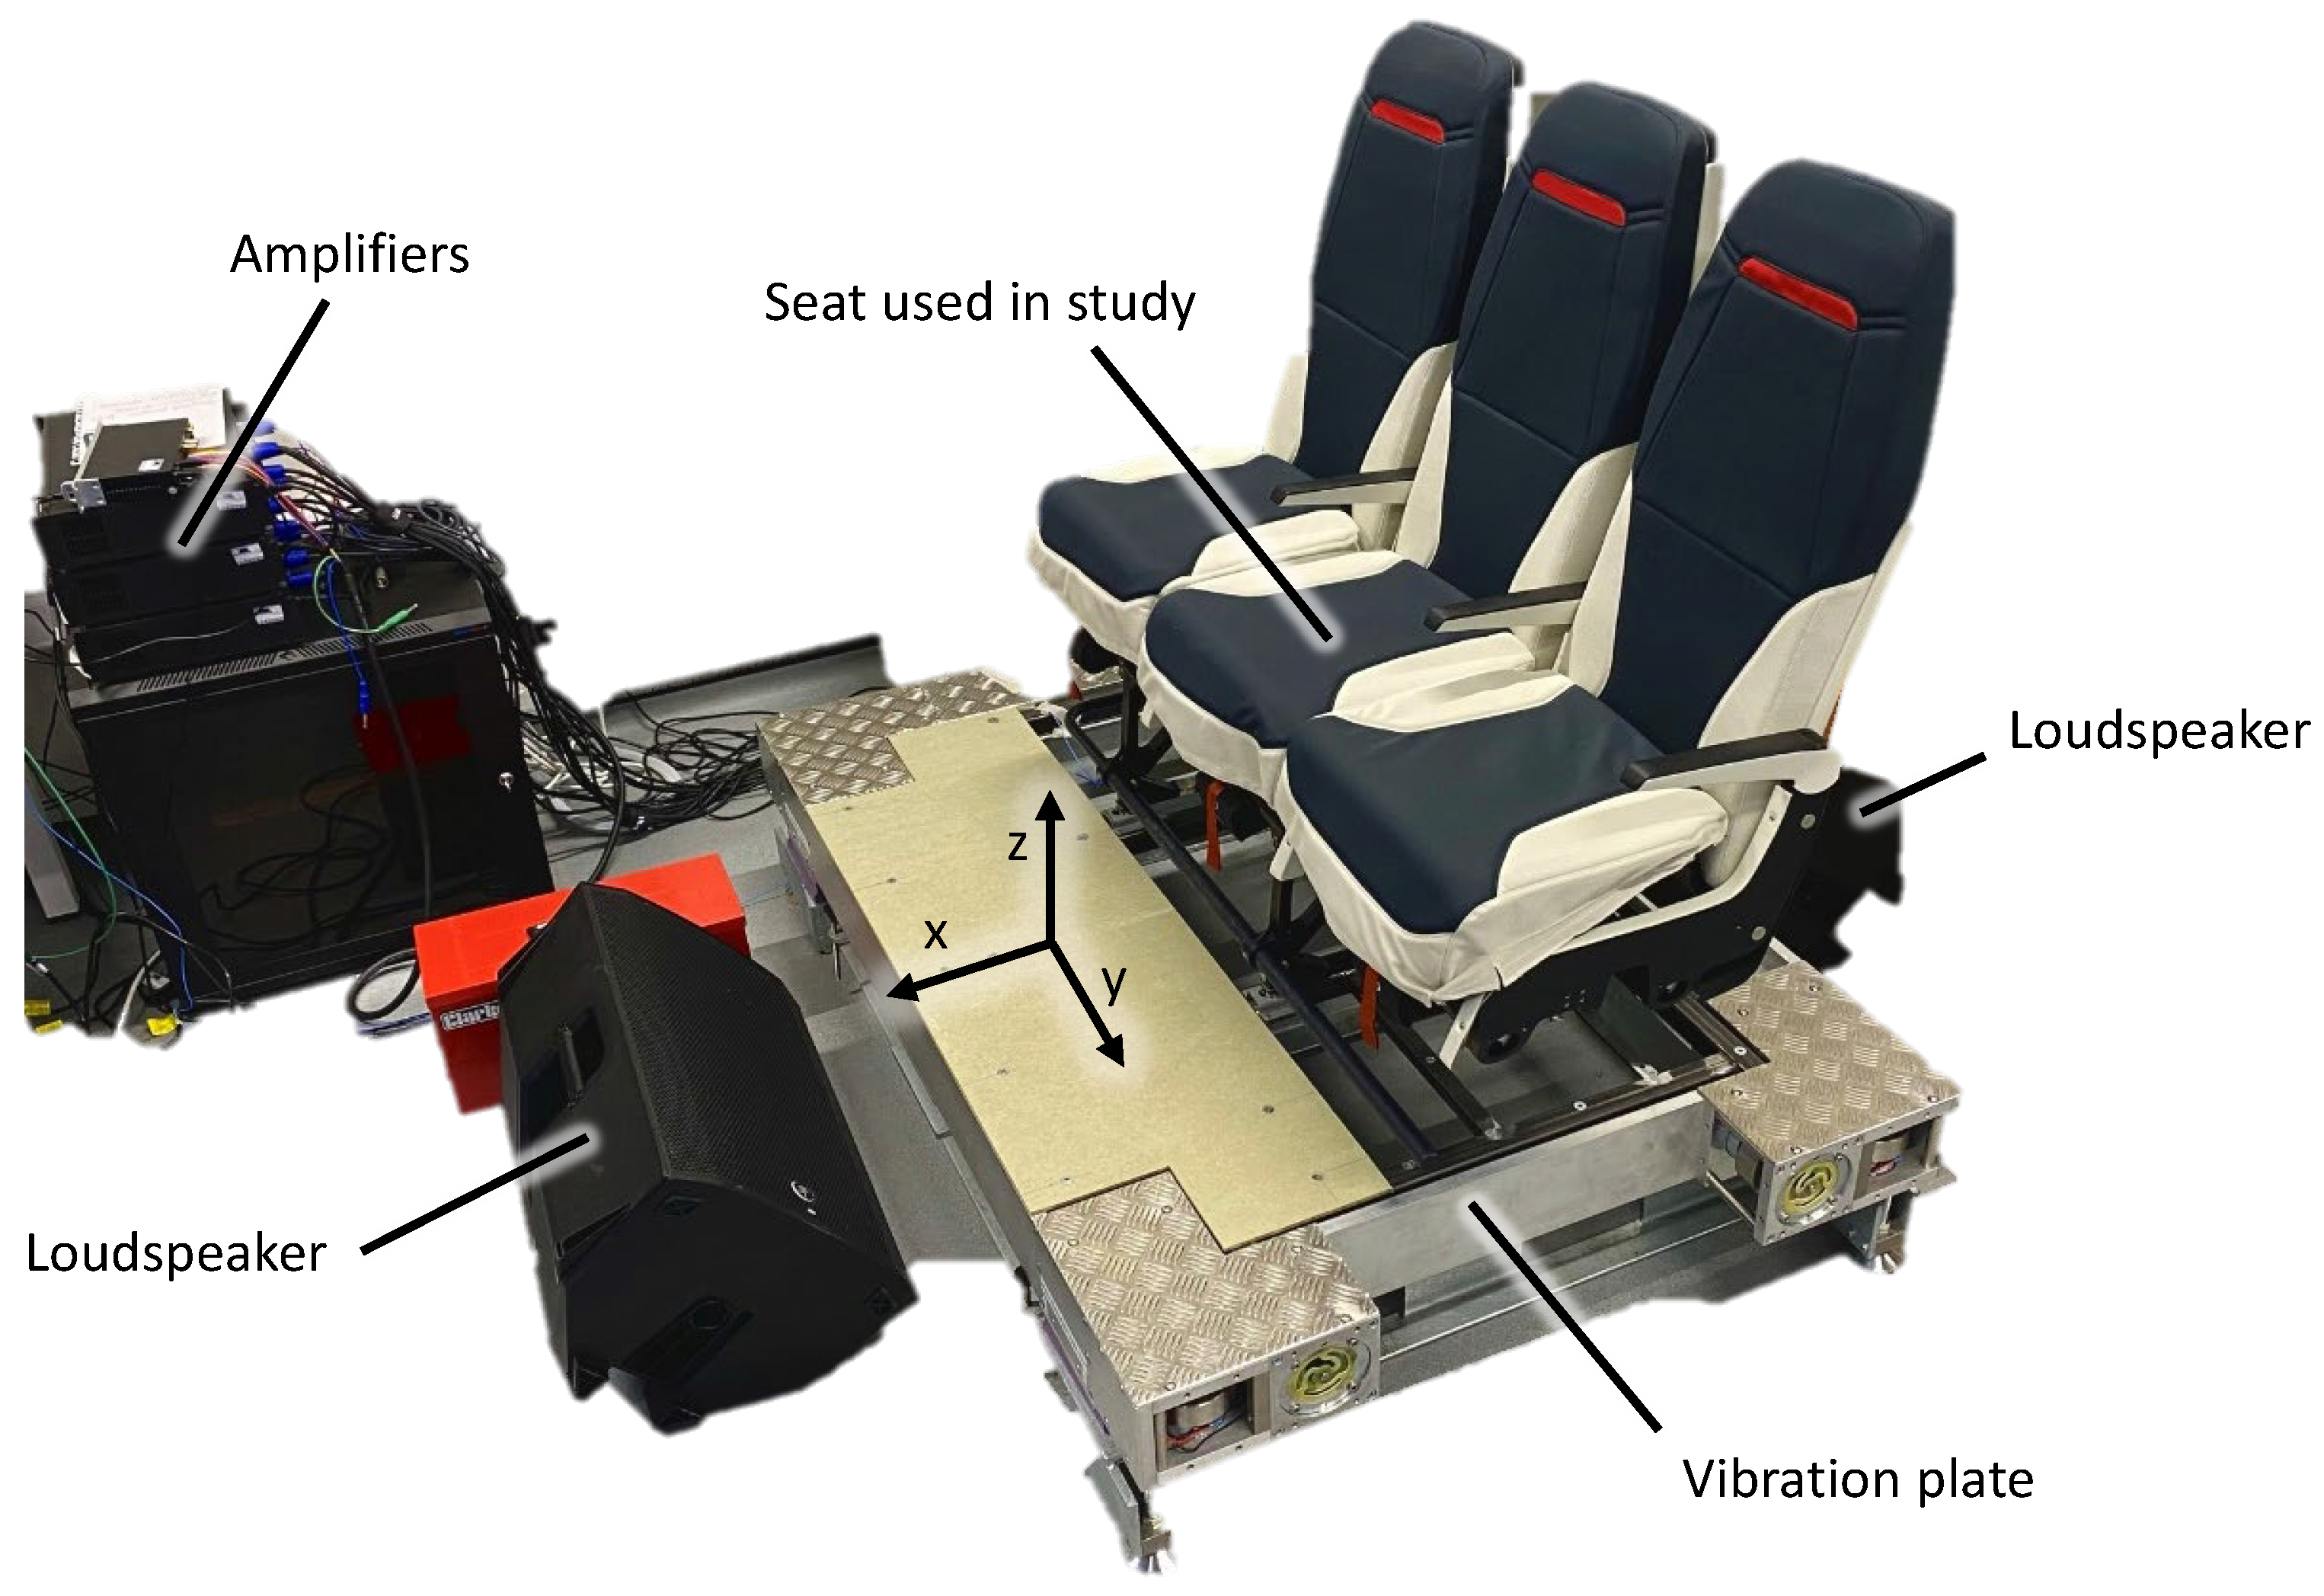
Each volunteer/participant was asked to sit on a prototype aircraft seat which was mounted on a shaker platform, as shown in
Figure 1.
The aircraft seat was part of a triple economy set; it is noted that the vibration on the seat is affected by the seat transmissibility, and therefore, vibration was measured on the seat surface [
16]. A familiarization protocol was used where participants were exposed to examples of the stimuli before the test began and were trained on how to use the subjective rating scales. During this process, the calibration of the noise and vibration was checked using a Larson Davis HVM100 vibration meter and RSPro 1352 sound level meter. After familiarizing with the seat and environment, calibration equipment was removed from the seat so that the equipment would not influence the comfort ratings. The volunteer was then exposed to 16 combinations of 10–15 s stimuli comprising synthesized noise and vibration representative of those experienced in a DASH 8-300 turboprop during the cruise phase (10,000 feet), with engine speed of 1000 rpm. The vibration stimulus was synthesized from data presented in [
6], which were measured at the seat mounting point. The vibration measured on the seat surface is shown in
Figure 2.
Noise stimuli used during the laboratory experiment research work was a reproduction of a sample of turboprop noise that had been measured in the passenger seat of the DASH 8-300 aircraft. The frequency spectrum of the noise is shown in
Figure 3.
Several research studies have been conducted to analyze the noise levels inside the aircraft cabin. For example: in 1999, NIOSH conducted several noise surveys and health risk assessments and found that noise levels exceeded 85 dB(A) [
17]. In 2018, a study of sound levels measured on 200 flights on Airbus A321s found an average noise level of 83.5 dB(A) [
18]. The noise levels were seen to be 60–65 dB(A) prior to takeoff and 80–85 dB(A) and 75–80 dB(A) during flight and landing, respectively. In this paper, we were specifically wanting to consider the range of noise levels experienced in a turboprop, as they are anecdotally reported as being higher than those experienced in jets. There are little published data on turboprop noise exposures, and so a variety of noise levels have been used to cover the expected range in this paper that will help designers understand the human comfort perception in turboprop aircraft cabin in context to vibration, thus enabling them to design a sustainable aircraft improving human comfort. Therefore in this paper, for each stimulus, noise was presented at either 72, 78, 84, or 90 dB(A).
By using the dB(A) measurement, low and high frequencies are attenuated in comparison to the linear dB measurement. Aircraft noise might be considered more uncomfortable than indicated by the A-weighting for passengers. The applicability of the A-weighting was considered outside the scope of this study.
Vibration was simultaneously presented at either 0.50, 0.67, 0.83, or 1.00 m/s
2 r.m.s. (r.s.s. bandlimited) comprising a multi-tonal signal with a vibration spectrum as shown in
Figure 2. Waveforms were synthesized separately for the x-, y-, and z-axes. The levels of vibration were selected in order to span the range expected across all flight phases for current and future turboprop aircraft. The order of stimuli was randomized to counterbalance order effects.
After each stimulus combination, participants were required to rate their perceived discomfort from noise, perceived discomfort from vibration, and their overall discomfort. Both noise and vibration ratings were based on the ISO 2631-1 scale:
Not comfortable (rating score 1),
a little uncomfortable (rating score 2),
fairly uncomfortable (rating score 3),
uncomfortable (rating score 4),
very uncomfortable (rating score 5) and
extremely uncomfortable (rating score 6) [
19].
Overall discomfort was assessed using an adapted 100-point Borg CR-100 scale, with verbal anchors comprising
No discomfort at all (rating score 0),
Just noticeable discomfort (rating score 2),
Very little discomfort (rating score 7),
Little discomfort (rating score 12),
Moderate discomfort (rating score 25),
High discomfort (rating score 45),
Very high discomfort (rating score 70),
Extreme discomfort (rating score 90),
Maximal (rating score 100) [
20]. Participants were also required to select whether they would choose to reduce the noise or the vibration to improve comfort. This question used a forced choice protocol. Data were analyzed using MATLAB R2020a. The software was sourced by Nottingham Trent University, UK. Validity of the statistical framework was determined using Shapiro–Wilk test within each data set. A critical value of 0.05 was used to indicate significance. Where indicated by the Shapiro–Wilk test, non-parametric data analysis was conducted. Data were also analyzed using a parametric approach where Shapiro–Wilk indicated validity and where this method was desirable to compare results with those in the literature [
19].
3. Results
Participants were each exposed to 16 combinations of noise and vibration and gave four responses to each combination. Shapiro–Wilk tests were conducted for each of the 64 data sets. For subjective noise rating data, 5 out of 16 had properties of normality; for subjective vibration data, 4 out of 16 had properties of normality (p > 0.05, Shapiro–Wilk). For overall discomfort data, 13 out of 16 had properties of normality (p > 0.05, Shapiro–Wilk); all overall discomfort data had a Shapiro–Wilk p-value > 0.025. Therefore, ratings of noise and vibration discomfort were analyzed using non-parametric statistics. Overall ratings of discomfort were analyzed using a parametric framework to maintain consistency with curve fitting for modeling.
3.1. Ratings of Noise Discomfort
Noise discomfort tended to increase with noise level for each vibration magnitude, shown in
Figure 4.
As expected, an increase in noise level corresponded to an increase in noise ratings. The full range of the noise rating scale was used, with 9% giving the lowest possible discomfort rating (‘1’) and 14% giving the highest possible discomfort rating (‘6’).
Friedman analysis of variance showed a significant effect of noise (p < 0.0001) on noise discomfort at each vibration magnitude, but no effect of vibration (p = 0.46, 0.33, 0.70, 0.30 at 0.50, 0.67, 0.83 and 1.00 m/s2 respectively). Wilcoxon tests confirmed a change in noise ratings at 72 dB and 90 dB for each of the vibration magnitudes (p < 0.0001). There were no differences in ratings of noise with vibration presented at 0.5 m/s2 and 1.0 m/s2 (p = 0.56, 0.72, 0.97, 0.99 at 72, 78, 84, 90 dB(A) respectively) showing that there was no cross-modal effect from vibration affecting the noise ratings.
3.2. Ratings of Vibration Discomfort
Ratings of vibration discomfort had a general trend of increasing with vibration magnitude for each noise level, shown in
Figure 5.
The subjective rating score for vibration was assigned the highest possible value (‘6’) less than 1% of the time; 22% of subjective vibrating ratings were the lowest possible value (‘1’).
Friedman analysis of variance showed a significant effect of vibration (p < 0.0001) but no effect of noise (p = 0.17, 0.96, 0.88, 0.92 at 72, 78, 84, 90 dB(A) respectively). Wilcoxon tests confirmed a change in vibration ratings at 0.5 and 1.0 m/s2 for each of the noise levels (p < 0.05). There were no differences in ratings of vibration with noise presented at 72 dB(A) and 90 dB(A) (p = 0.99, 0.89, 0.99, 0.60 at 0.50, 0.67, 0.83, 1.00 m/s2 respectively) showing that there was no cross-modal effect from noise affecting vibration ratings.
3.3. Ratings of Overall Discomfort
Across all responses from all participants, the mean overall discomfort score was 31.4, corresponding to mid-way between the verbal descriptors ‘moderate discomfort’ and ‘high discomfort, having discomfort values of 25 and 45, respectively.
Ratings of overall discomfort generally increased with both noise and vibration, shown in
Figure 6 and
Table 2.
Whilst a two-way ANOVA (analysis of variance) showed a significant main effect of noise (
p < 0.0001) it did not reach significance for vibration (
p = 0.23) and there was no significant interaction (
p = 0.99). Post hoc
t-tests confirmed a significant change in overall ratings at 72 dB(A) and 90 dB(A) for each of the vibration magnitudes (
p < 0.005). Overall ratings of discomfort significantly increased with vibration at 72, 78 and 84 dB(A) (
p < 0.05); the trend approached but did not reach significance at 90 dB(A) (
p = 0.056). There were systematic increases apparent in the mean data for each (combined) increase in noise and vibration, listed in
Table 2.
3.4. Preference for Changing Modality
Participants were asked whether they would choose to reduce noise or vibration to improve their comfort. For the highest level of noise, almost all participants stated that they would prefer to reduce the noise level, irrespective of the vibration magnitude, as shown in
Figure 7. At the highest magnitude of vibration and lowest level of noise, 22% still stated that they would prefer to reduce the noise level. Equivalence (i.e., 50% selection contour) occurred on a contour from 72.0 dB(A) and 0.58 m/s
2 to 81.0 dB(A) and 1.0 m/s
2.
3.5. Linear Model of Overall Discomfort
A two-stage linear interpolation method was used to generate a linear model of the overall discomfort for all combinations of noise and vibration. This type of parametric modeling was used in order to maintain compatibility with previous studies that used different variables, including fatigue [
21,
22]. Alternative approaches may be more efficient (e.g., minimum square error (MSE)).
The regression model was fitted to the mean data, thereby reducing the influence of outliers. Stage one of the model generated four model elements, one for each magnitude of vibration. Stage two used the elements from Stage one and modeled those in order to generate a single linear model. The expression allows for the prediction of the overall discomfort from noise and vibration within the measured range:
where
V is the vibration magnitude,
N is the noise level, and
φ is the overall rating of discomfort. The comfort model from Equation (1) is illustrated in
Figure 8 and has an r.m.s. error of 8.9%.
4. Discussion
As expected, ratings of noise discomfort increased with the noise level, and ratings of vibration discomfort increased with vibration magnitude. In this study, there was no evidence of a cross-modal interaction whereby the magnitude of the stimulus in one modality affects the response to another stimulus in another modality. This differs from some other studies using, for example, steering wheel vibration [
21], where a small cross-modal effect was observed for impulsive signals.
For ratings of overall discomfort, the increase in each modality (noise level or vibration magnitude) caused an increase in human response. The relationship between the noise level/vibration magnitude ratings showed an additive relationship rather than a synergistic or antagonistic relationship. As the statistical modeling showed that there was no significant cross-modal interaction, the overall comfort model could be simplified to eliminate the N ∗ V term, where N denotes noise level, and V denotes vibration magnitude.
Hence, the modification of the comfort model to only consider additive terms has a marginal impact on the r.m.s. error (8.5%); therefore, the expression becomes:
The preference for reducing noise or vibration showed a relationship such that an equivalence contour could be drawn. The preference data showed a similar trend to Fleming and Griffin [
22], who used short uniaxial vertical sinusoids at 10 Hz on a hard rigid seat and a 1 kHz pure tone auditory signal. Fleming and Griffin showed equivalence at 80 dB SPL and 0.4 m/s
2; however, the present study showed less sensitivity to vibration, which could be due to the seating condition used in the present study and the effect of multi-axial vibration.
The present study listed in this article did not adjust the frequency content of the vibration signal. Whilst ISO 2631-1 indicates that the human response to vibration is dominated by low-frequency vibration, other studies have shown that higher frequency components can be more important than indicated in ISO 2631-1 [
23,
24]. As turboprop aircraft vibration is dominated by high-frequency tonal components, this should be studied in the future. Similarly, this study did not adjust the frequency content of the noise signal. The perception of noise in an aircraft has been shown to change primarily with level but also with spectral content for jets [
10]. It would be expected that the perception of sound for turboprop noise would also be affected by the frequency content, and, therefore, this should also be studied in the future. Discomfort ratings considered in this study were, by design, focused on noise and vibration. It is known that discomfort in aircraft is affected by many factors that were not used as independent variables here. These factors include climate, seat design, physical space, and air quality [
10,
25].
The comfort model for the sustainable design of the turboprop aircraft cabin in this present study is developed based on a single noise and vibration stimulus type derived from measurements of noise and vibration in turboprop aircraft. Therefore, the model is optimized for such applications; there are no equivalents for jets. The comfort model was developed using a single prototype seat with no other passengers in the vicinity. Future studies should consider these factors to improve the ecological validity of the findings and to test the model in a real aircraft cabin.
The future developments in sustainable propulsion for aircraft will change the experience of passengers in the aircraft cabin. This study has shown that passenger perception of noise and vibration are both important, but there is a level at which they are considered to cause equivalent discomfort. To ensure an effective impact on the reduction of environmental emissions from aviation, the reputation of propeller aircraft will need to improve. Improved reputation will improve passenger satisfaction, and therefore propeller aircraft will be in a better position to increase market share. The comfort model developed from this study will enable manufacturers to understand the perception of passengers and predict consumer responses. Sustainable aircraft design can then be holistically optimized for emissions and human comfort perception.
Aircraft workers (e.g., cabin crew) are exposed to noise and vibration in the cabin during every flight. For a regional aircraft, this will comprise multiple legs per day. Increases in noise/vibration levels that could occur due to the adoption of new propeller technologies could cause a risk to wellbeing and health [
26]. The crew is exposed to vibration and noise at different positions in the cabin (standing vs. sitting); this should be evaluated and assessed in future studies.
A further application of this work is in improving the environment of personal air transport, such as ‘drone taxi’ concepts that are already prototyped [
27]. These also employ propeller propulsion systems in vertical lift + cruise, vectored thrust, or wingless multicopter configurations [
28]. There are sustainability advantages of personal air transport in some settings due to the point-to-point nature of flight, and there is no need for infrastructure construction between landing sites eliminating a source of embedded energy. Being propeller-driven, these are likely to cause passengers to experience high noise levels and tonal vibration, and, therefore, models to predict passenger response will be necessary to enable design optimization for comfort and widespread acceptance.
5. Conclusions
This study showed that discomfort associated with simulated turboprop aircraft noise increased with an increase in noise levels and that discomfort associated with simulated turboprop vibration increased with an increase in vibrations levels.
However, no cross-modal effect exists between the two forms of stimuli, i.e., no cross-modal effect has been found between noise and vibration. Overall discomfort was affected by the exposure to both noise and vibration, showing an additive relationship. When asked which modality (noise or vibration) was more important for improvements in comfort, participants stated a preference for noise to be reduced if it is greater than 80 dB(A) for vibration up to 1.0 m/s2 r.m.s. Participants stated a preference for vibration to be reduced in order to improve their comfort if the noise level was less than 80 dB(A) and vibration magnitude greater than 0.7 m/s2 r.m.s.
This study proposed a human comfort model in the context of noise and vibration for the sustainable design of the turboprop aircraft cabin. This comfort model will benefit the aircraft manufacturers in understanding the human comfort perception and the relative importance of noise and vibration in an aircraft cabin. This, in turn, will help aircraft designers to produce future aircraft to be more sustainable and widely accepted by passengers.


