Article

Development and Evaluation of a Prototype Self-Propelled Crop Sprayer for Agricultural Sustainability in Small Farms

by
Abdul Ghafoor
1,
Fraz Ahmad Khan
1,2,*,
Farzaneh Khorsandi
2,*,
Muhammad Azam Khan
1,
Hafiz Muhammad Nauman
1 and
Muhammad Usman Farid
3
1
Department of Farm Machinery and Power, University of Agriculture, Faisalabad 38000, Pakistan
2
Department of Biological and Agricultural Engineering, University of California, Davis, CA 95616, USA
3
Department of Structures & Environmental Engineering, University of Agriculture, Faisalabad 38000, Pakistan
*
Authors to whom correspondence should be addressed.
Sustainability 2022, 14(15), 9204; https://doi.org/10.3390/su14159204
Submission received: 26 May 2022 / Revised: 30 June 2022 / Accepted: 22 July 2022 / Published: 27 July 2022
(This article belongs to the Special Issue Sustainable Use of Chemicals and Materials in Agriculture Practice)

Abstract

:
In most Asian countries, farmers have smallholdings ranging from one to two hectares. The tractor-mounted boom sprayers cannot practically be used in small size farms with divided plots and complex terrain. To cope with these issues, a prototype self-propelled crop sprayer was developed, including a 20-hp engine, 300 L liquid tank, and hydraulically-controlled spray boom with eight hollow cone nozzles. The spray symmetry of the hollow cone nozzle was evaluated under four pressures (2.5, 3, 3.5, and 4 bar) in the laboratory. The operating parameters of the sprayer, such as forward speed (4, 6, and 8 km h−1), spray height (40, 55, and 70 cm), and pressure (3, 5, and 7 bar) were optimized by measuring three spray characteristics including droplet density, coverage percentage, and Volume Median Diameter (VMD) in the cotton field. The results revealed that the nozzle spray was symmetrical at 2.5 and 3 bar pressure as the R2 value was higher than 0.96. The field test result showed that in all treatments, treatments T14 (6 km h−1, 55 cm, 5 bar) and T22 (8 km h−1, 55 cm, 3 bar) were suitable for spraying medium-to-low concentration solution (post-emergence herbicides and fungicides) and high concentration solution (insecticides and pre-emergence herbicides), respectively. The spray characteristics at treatments T14 and T22 were 64.7 droplets cm−2, 26.7%, 230 µm, and 39 droplets cm−2, 14.9%, and 219.8 µm respectively. The field efficiency of the sprayer was 61%. The spraying cost per unit area was 55–64% less compared to manual labor cost. In conclusion, a prototype self-propelled crop sprayer is an efficient and environment-friendly technology for small farms. Operating the sprayer at the optimal parameters also saves operational costs and time.

1. Introduction

Nearly 55% of the world’s population lives in Asia, 58% of which depends on agriculture for a livelihood. However, the Asian region holds 20% of the world’s agricultural land. In most Asian countries like China, Japan, Thailand, and India, the average land holding ranges from only one to two hectares. At the same time, the number of small-size holdings has increased significantly [1]. Likewise, in other Asian countries, such as Pakistan, the average farm size is 2.6 hectares [2]. Small farmers have less than two hectares, operating 64 percent of the 8.26 million total farms in a country [3]. Most of the population in the country is directly or indirectly linked to the agriculture sector. Unfortunately, crop productivity is much lower in Pakistan than in most developed and developing countries. Many factors are contributing to lower productivity in the country. One of the significant factors is poor farm mechanization or lack of mechanization. It is inevitable that the use of agricultural machinery not only increases crop productivity but also helps to reduce the cost of production and time of operation [4,5]. Among various farm practices, crop protection against various diseases, insects, pests, and weeds has significant importance to ensure both quality and quantity of produce. Pesticides and application methods are the two factors that play an important role in controlling the attack of insects and pests and contribute to better quality and production. The application of pesticides is approximately three million tons per year worldwide [6]. Pakistan is the second largest overall pesticide user country in South Asian countries [7].
Selecting appropriate equipment for pesticide applications is crucial [8]. The excessive application of agrochemicals affects the quality of products and causes losses and environmental pollution. Thus, it is important to ensure the application of the optimum volume of agrochemicals to reduce losses and environmental degradation [9,10,11,12,13]. The off-target losses, the spray quantity retained by the plant [9], uniform coverage and deposition, the position and nozzle type [9], and application rate [14] depends on the type of spray equipment [9].
In recent years, self-propelled crop sprayers have emerged on the market equipped with spray booms. These sprayers move between the crop rows, allowing better control of variables such as travel speed, boom height, and pressure. A self-propelled sprayer provides uniform distribution of spray [15], more effective application with lower ground losses, and also lowers exposure risk for the operators [16,17]. Recently, several studies have been conducted to design and develop the self-propelled sprayer. Chen et al. [18] designed and developed the large high-clearance self-propelled sprayer chassis. Qiu et al. [19] designed and developed a novel crawler-type multi-channel air-assisted self-propelled sprayer for pesticide application in hilly orchards. Ma et al. [20] designed and developed the jet-type remote control self-propelled spraying machine for orchards.
Numerous studies have been conducted to optimize the field performance of the sprayers. Qiu et al. [19] evaluated the performance of a self-propelled orchard sprayer. The authors found that the mean droplet deposition in the front, middle, and rear of the canopy was 32.9%, 50.3%, and 78.1%, respectively, and the spray coverage uniformity was 19.4%, while the reduction in spray drift was 26.8%. Cai et al. [21] studied the performance of variable-rate orchard sprayers. The effect of different travel speeds and canopy grid volume on the spray performance were evaluated in this study. The authors found that the effect of travel speed (1, 1.2, and 1.4 m s−1) was non-significant on mean coverage uniformity. The authors also found that the uniformity of coverage decreased with increasing grid width from 0.14 to 0.28 m. Penido et al. [22] studied the performance of the self-propelled sprayer in the tomato fields. The authors found that the coefficient of variation for droplet density, spray coverage, and spray deposition was 18.70%, 15.13%, and 16.68%, respectively. The authors concluded that the spraying was viable with this sprayer. Teejet® [23] found that for pesticide application, the ground sprayer’s optimum travel speed was between six and eight km h−1. Teejet® [24] reported that the maximum recommended spray heights are 40 cm, 60 cm, and 75 cm with spray angles of 110°, 80°, and 65° for nozzles at 50 cm constant spacing, respectively. Sánchez-Hermosilla et al. [25] studied the spray pressure and found that at 20 bar pressure, the mean deposition was lower compared to 10 bar and 15 bar spray pressure.
Mostly two types of sprayers are used in Asian countries for the application of agrochemicals and these sprayers are tractor-mounted and manual knapsack sprayers [26,27]. The manual-knapsack sprayers have disadvantages like heavy losses to the ground, uneven distribution, poor spray coverage [28], and higher pesticide exposure to the operators [17]. The tractor-operated sprayers have considerably lower pesticide exposure and higher spray deposition, but these sprayers cannot practically be used in small size farms with divided plots and complex terrain. Therefore, there is a need to develop an efficient spraying system to solve the existing issues. Thus, this study was carried out for the development and evaluation of a prototype self-propelled crop sprayer for spraying on small farms. In field testing, the operating parameters of the sprayer were optimized by measuring the spray characteristics.

2. Materials and Methods

2.1. Development of Sprayer

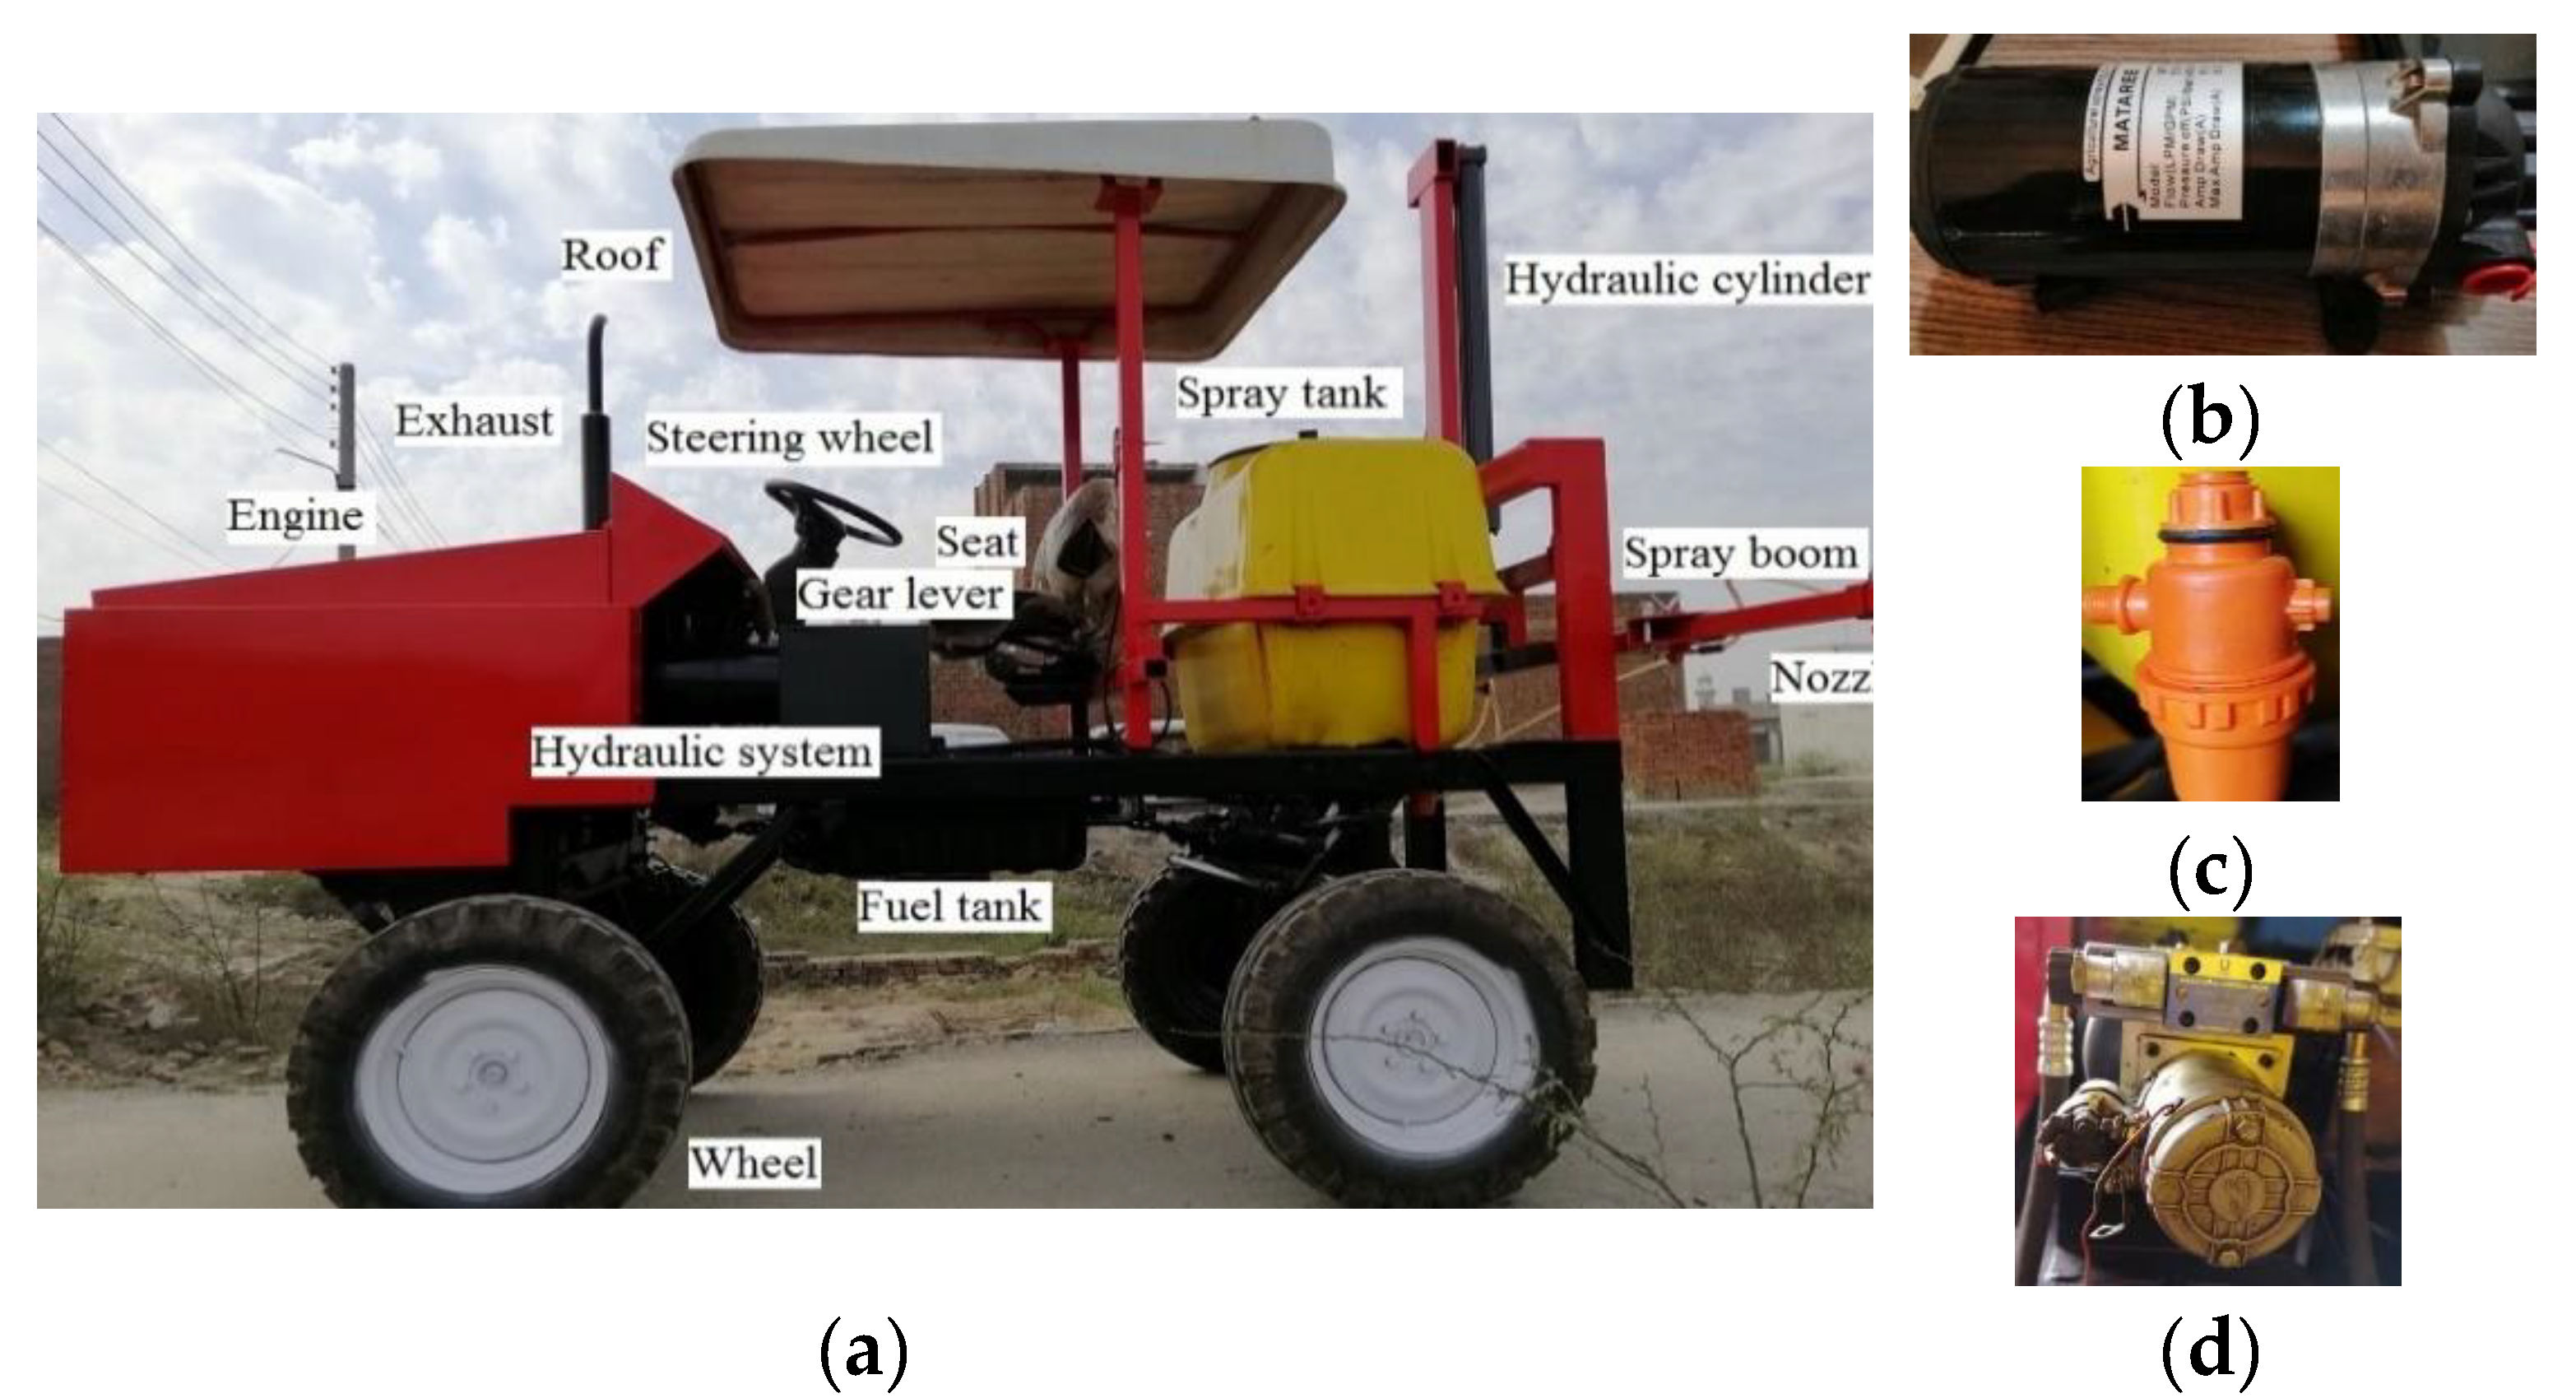
The main components of the sprayer were the frame (material grade SAE-4130), engine (model 2105D), hydraulic system (model 121613-08L), liquid storage tank, electrical spray pump (model BYT-7A111), spray boom, and nozzles (HC8002) (Figure 1 and Figure 2). The detailed specifications of the sprayer are given in the table (Table 1).
The frame was fabricated with mild steel (grade SAE-4130). The frame width and length were 1017 and 2845 mm, respectively. A 20-hp engine was used to drive the sprayer. The engine specifications are given in Table 1. To control the direction and motion of the sprayer, a directional and hydraulic brake control system was installed. To control the spray boom movement, a hydraulic system was installed having a flow rate of 5.6 L min−1, operated with a 12-V battery.
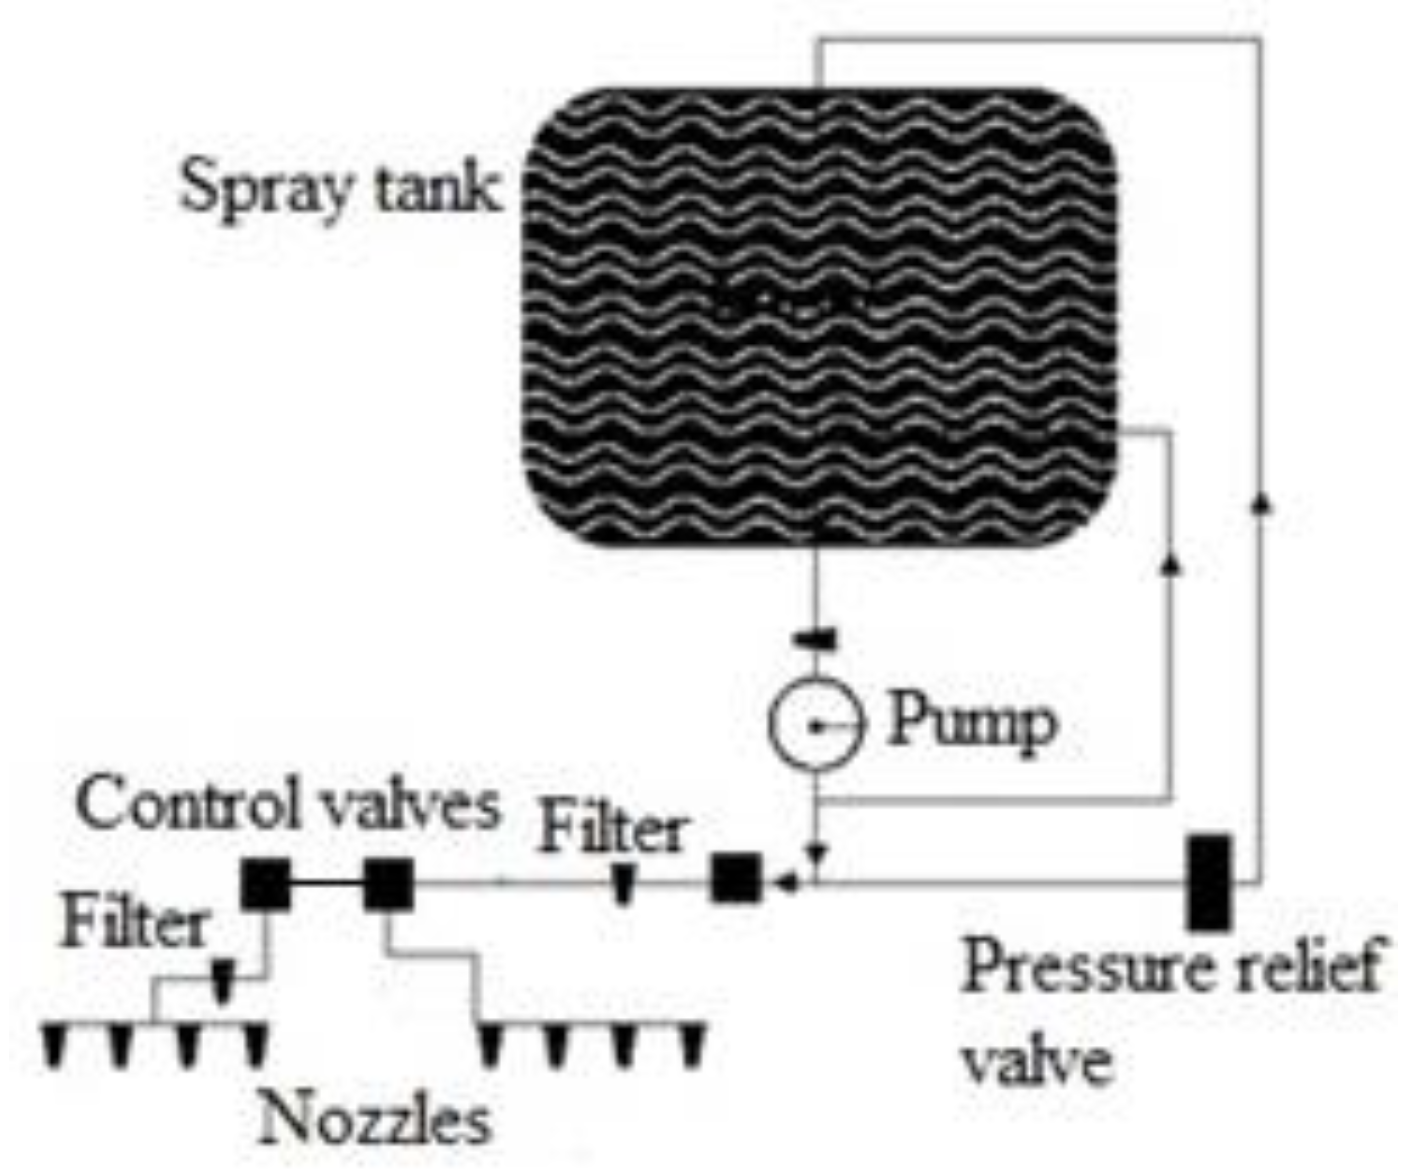
A 300 L liquid storage tank was used with diaphragm spray pumps having a maximum discharge capacity of 22 L min−1. The spray pumps were installed underneath the liquid storage tank to protect them from severe weather. To remove dust particles from the spray solution, four filters (50-mesh size) were installed before pumps. A 6 m horizontal spray boom with 8 hollow-cone nozzles (Size 15 × 7 mm, ASJ- HC8002) was attached with a spraying mechanism. The single nozzle flow rate at 3 bar pressure was 0.8 L min−1. The spraying mechanism is shown in Figure 3.

2.1.1. Power Sizing

The engine size was calculated from the tractive load. The tractive load consisted of rolling resistance, gradient resistance, and air resistance. The tractive load was calculated using Equations (1)–(4).
F t = ( R r + R g + R a ) ×   R f
R r =   µ   ×   M   ×   g
R g =   M w × Sin θ
R a = 0.5 ×   ρ   ×   A   × V 2
where Ft is the tractive load (N), R r is the rolling resistance (N), R g is the gradient resistance (N), R a is the air resistance (N), Rf is the resistance factor for road resistance (1.17) [29], µ is the coefficient of rolling resistance for medium-hard soil (0.06) [30], M is the mass of the machine (1090 kg), g is the acceleration of gravity (9.81 m s−2), Mw is the weight of the machine (10692.9 N), θ is the steepness of the soil (assuming 30°), ρ is air density (1.225 kg m−3), A is the area exposed to air (1.65 m2), V is the machine speed (13.88 m s−1). From the above equations, R r = 642   N , R g = 5346.45   N , R a = 195.43   N , the tractive load was 7235 N.
After calculating the tractive load, total torque, sprayer speed, and power was calculated using Equations (5)–(7).
T   = F t ×   R n   ×   I g ×   η
N = V D × 0.001885
P   = 2 π ×   N ×   T 60
where T is the total torque (N-m), Ft is the tractive load (N), R is the wheel radius (m), n is the no. of the driving wheel, Ig is the gear ratio, ɳ is the gear mechanical efficiency (%), N is the speed (rpm), V is the linear speed (50 km h−1), D is the wheel diameter (76.22 cm) at 2 bar pressure, P is the total power (W), So, using Ft = 7235 N, R = 0.38 m, n = 4, Ig = 2.50, ɳ = 90% the total torque was 305.5 N-m. From Equations (6) and (7), the total power required was 11,127.54 W, and power in hp was 11 , 127.54 / 746 = 15   hp .

2.1.2. Sizing of Hydraulic System for Spray Boom Movement

The hydraulic system was designed to control the spray boom movement. The system was designed for lifting 390 kg weight and design assumptions are flow pressure of 103.42 bar, pump speed of 1000 rpm, pump displacement of 3.77 cm3, cylinder blind area diameter of 2.5 cm, cylinder rod diameter of 1.27 cm, the cylinder stroke length of 76.2 cm and stroke time of 4.63 s.

Hydraulic Pump Force Calculations

The force required to drive the pump was calculated using Equations (8) and (9).
p opt = p s ×   p d 1000
F   =   p opt ×   p   × 0.002564  
where p opt is the pump output flow (L min−1), ps is the pump speed (1000 rpm), pd is the pump displacement (3.77 cm3), F is the force (hp), p is the pressure (103.42 bar), so, using above equations, the force required to drive the hydraulic pump was 1.0 hp.

Hydraulic Cylinder Calculations

The net cylinder area was calculated using Equations (10)–(12).
A nca =   A b A re  
A b = π r 2  
A re = π r 2  
where Anca is the net cylinder area (cm2), Ab is the cylinder blind area (cm2), Are is the cylinder rod end area (cm2), r is the radius (cylinder blind = 1.27 cm, cylinder rod = 0.635), π = 3.142857. From above equations, Ab = 5.096 cm2, Are = 1.264 cm2, the net cylinder area was 3.832 cm2. After calculating the net cylinder area, the cylinder output force was calculated using Equation (13).
F opt =   P   ×   A nca
where F opt is the cylinder output force (kg), P is the pressure (bar), Anca is the net cylinder area (cm2). So, using P = 103.42 bar, Anca = 3.832 cm2, the cylinder output force was 396 kg.

2.1.3. Turning Radius Calculation

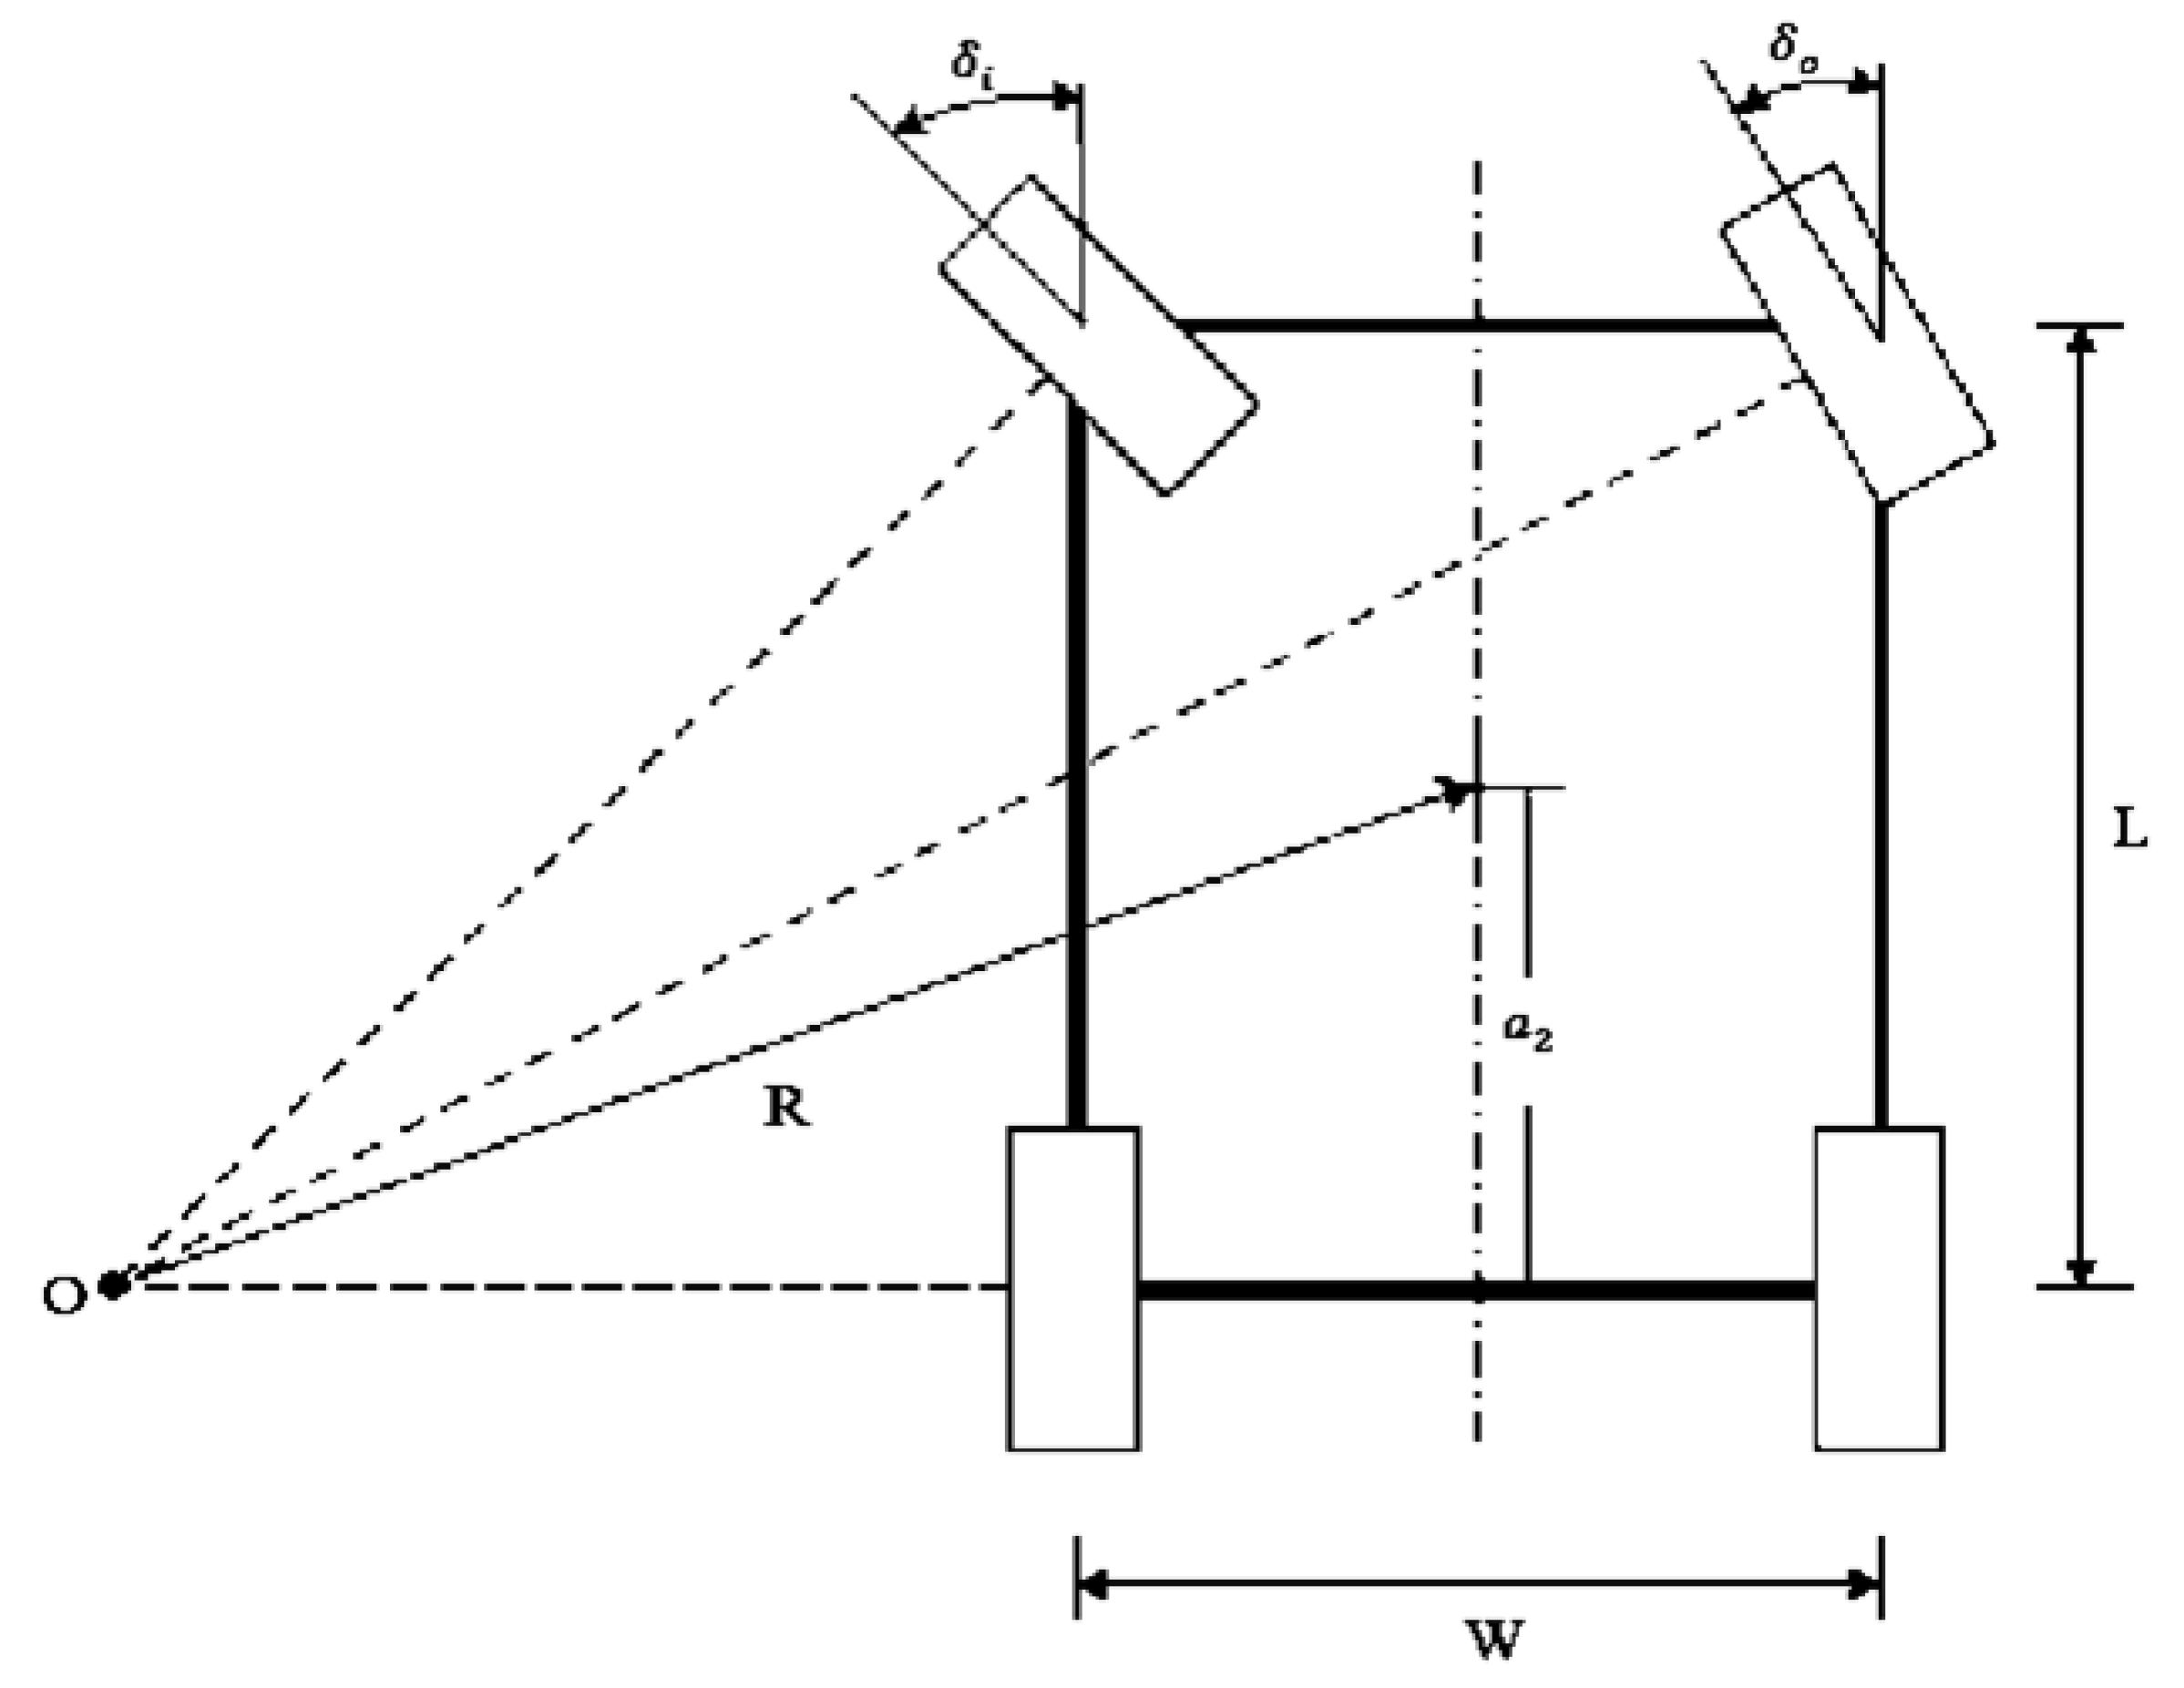
Ackermann’s principle was used to calculate the turning radius of the sprayer. According to the Ackermann principle, the difference between outer and inner turn angles is equal to the ratio of track width and wheelbase of the vehicle (Equation (14)). This principle is used to avoid the sideway slip of the wheels during the turning of the vehicle. The turning radius was calculated using Equations (15) and (16) [18]. The schematic diagram of Ackermann geometry is shown in Figure 4.
Cot δ o Cot δ i = W L
R = a 2 2 + L 2 Cot 2 δ
Cot δ = ( Cot δ o +   Cot δ i ) 2
where δ o is the outer wheel angle ( 25 o ) , δ i is the inner wheel angle ( 40 o ), W is the track width of the sprayer (1676 mm), L is the wheelbase (1753 mm), R is the minimum turning radius (mm), and a 2 is the distance from the center of the sprayer to the rear axle (876.5 mm). So, the minimum turning radius of the sprayer was 3056 mm.

2.1.4. Spray Pump Calculations

The pump capacity was calculated using Equation (17).
C = A R ×   W   ×   S 600  
where C is the pump capacity (L min−1), AR is the application rate (L ha−1), W is the application width (m), and S is the speed of the machine (km h−1). So, using AR = 150 L ha−1, W = 6 m, S = 15 km h−1, the pump capacity was 22 L min−1.

2.2. Laboratory Evaluation

A study was performed to evaluate the effect of spray pressure on the spray symmetry of a hollow cone nozzle. This analysis was carried out to ensure the good performance of the nozzle before field testing so that better quality field results can be obtained.

Experimental Design

This study was carried out in the spray laboratory at the Agricultural Mechanization Research Institute, Multan-Pakistan. The spray test bench (Figure 5) was used in this study. The four different spray pressures (2.5, 3, 3.5, and 4 bar) were used to study the spray symmetry of the nozzle. In spray symmetry analysis, the sprayed liquid reaches the spraying area of the test bench and falls along the grooves into 41 containers with the same volume positioned serially at equal intervals (5 cm) from each other. Each measurement determines the liquid amount collected in the consecutive containers and is expressed in milliliters. The capacity of a single container is 200 mL. With the spray symmetry analysis during the experiment, the spray spectrum for a single nozzle covered approx. 25 containers. The experimental reading was taken when the zero-positioned container filled up to 100 mL. The pressure for each treatment was adjusted and measured with a pressure-regulated valve and pressure gauge, respectively. The pressure gauge is shown in Figure 5a. The experiment was repeated three times for each pressure to get more accurate spray symmetry results.

2.3. Field Evaluation

2.3.1. Experimental Site

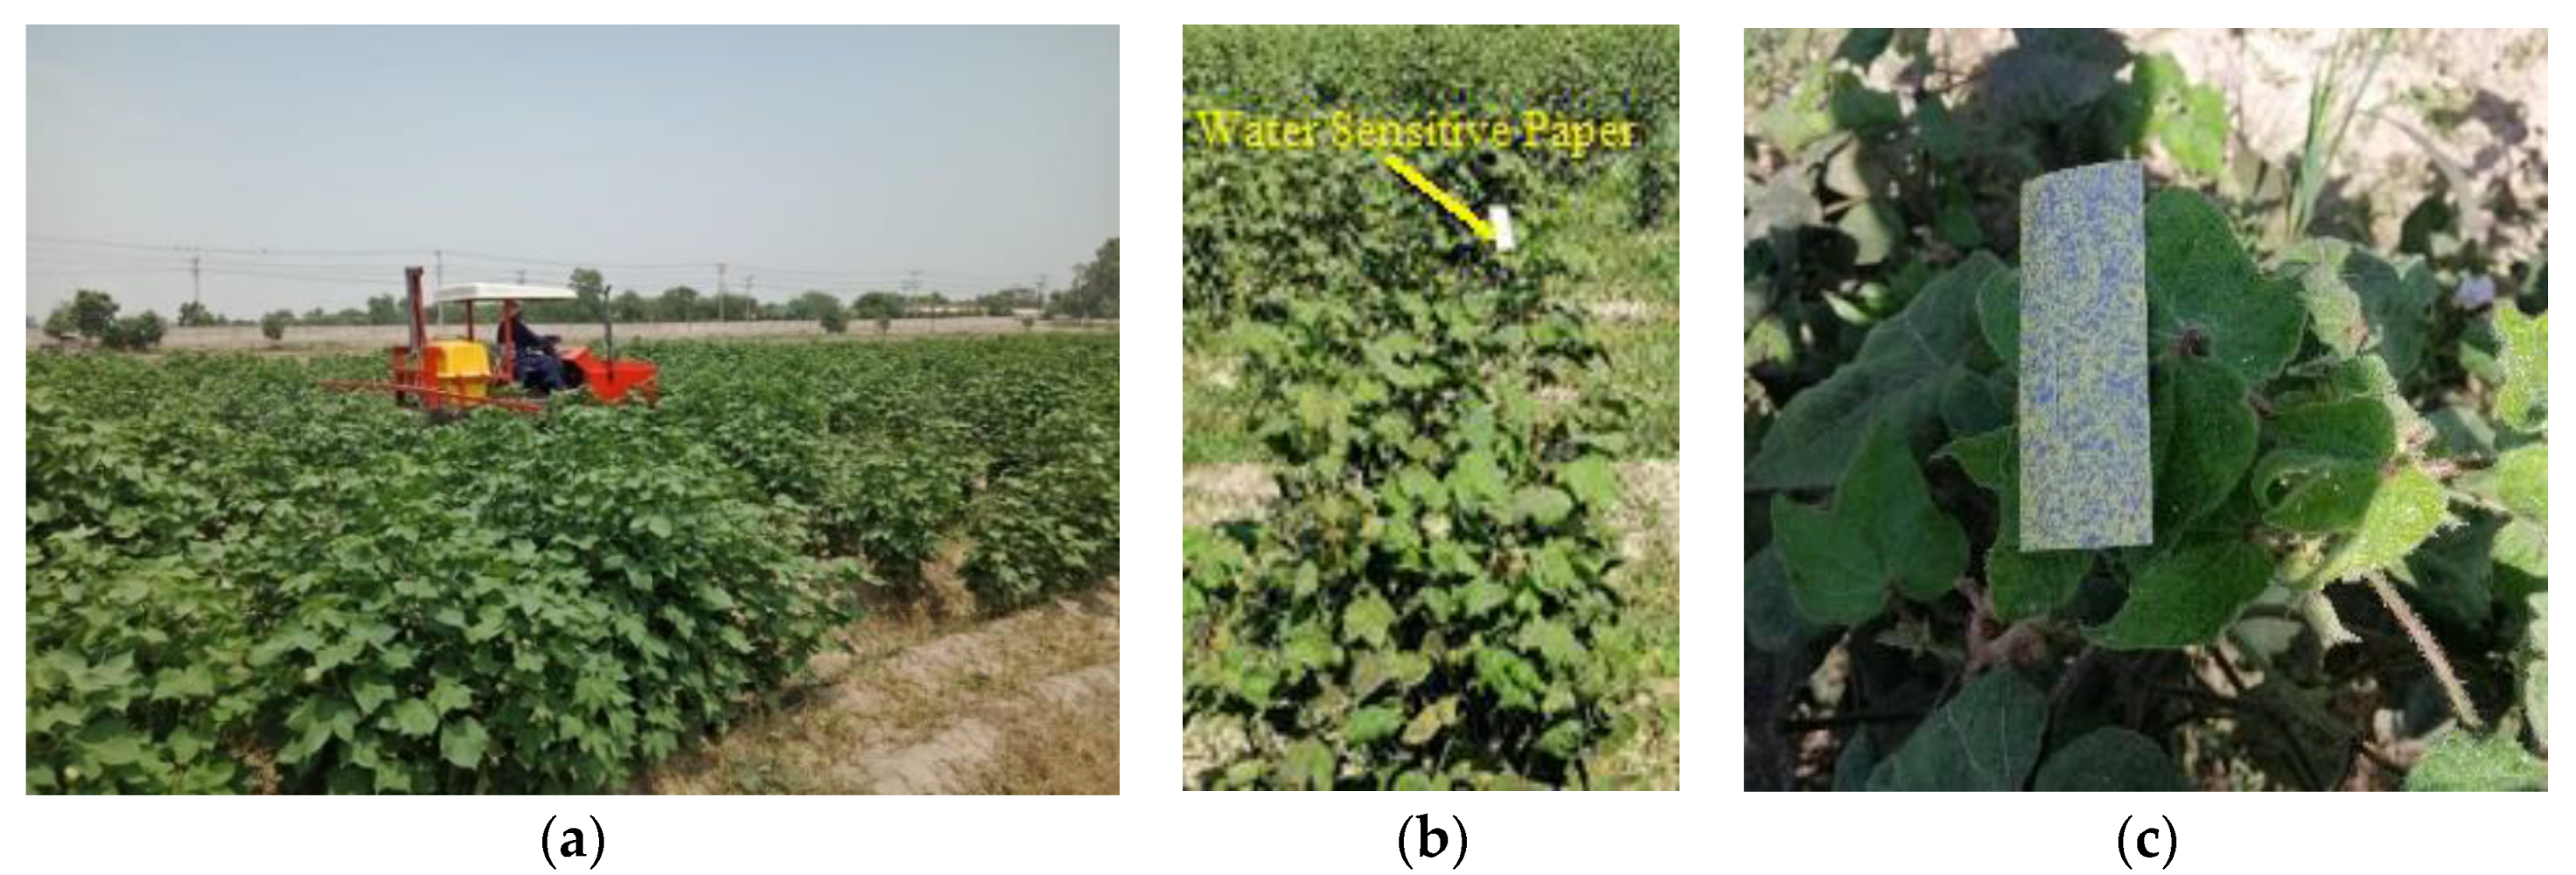
The sprayer was tested in the cotton field (Figure 6). The test was carried out at the research station (31°26′25″ N, 73°04′13″ E) located at the University of Agriculture Faisalabad-Pakistan. The number of plants per acre, the distance between plants, the distance between rows, and the average height of the plants were 35,000, 20 cm, 60 cm, and 60–70 cm, respectively. The atmospheric parameters were collected with a digital Kestrel device (model NK-5500, Shawnee On Delaware, PA, USA) in this study. During the experiment, the wind speed, temperature, and humidity were observed from 10:00 AM to 6:00 PM. The minimum and maximum wind speed, temperature, and relative humidity were 4.7–6.5 km h−1, 24–43 °C, and 36–47.4%, respectively.

2.3.2. Experimental Design

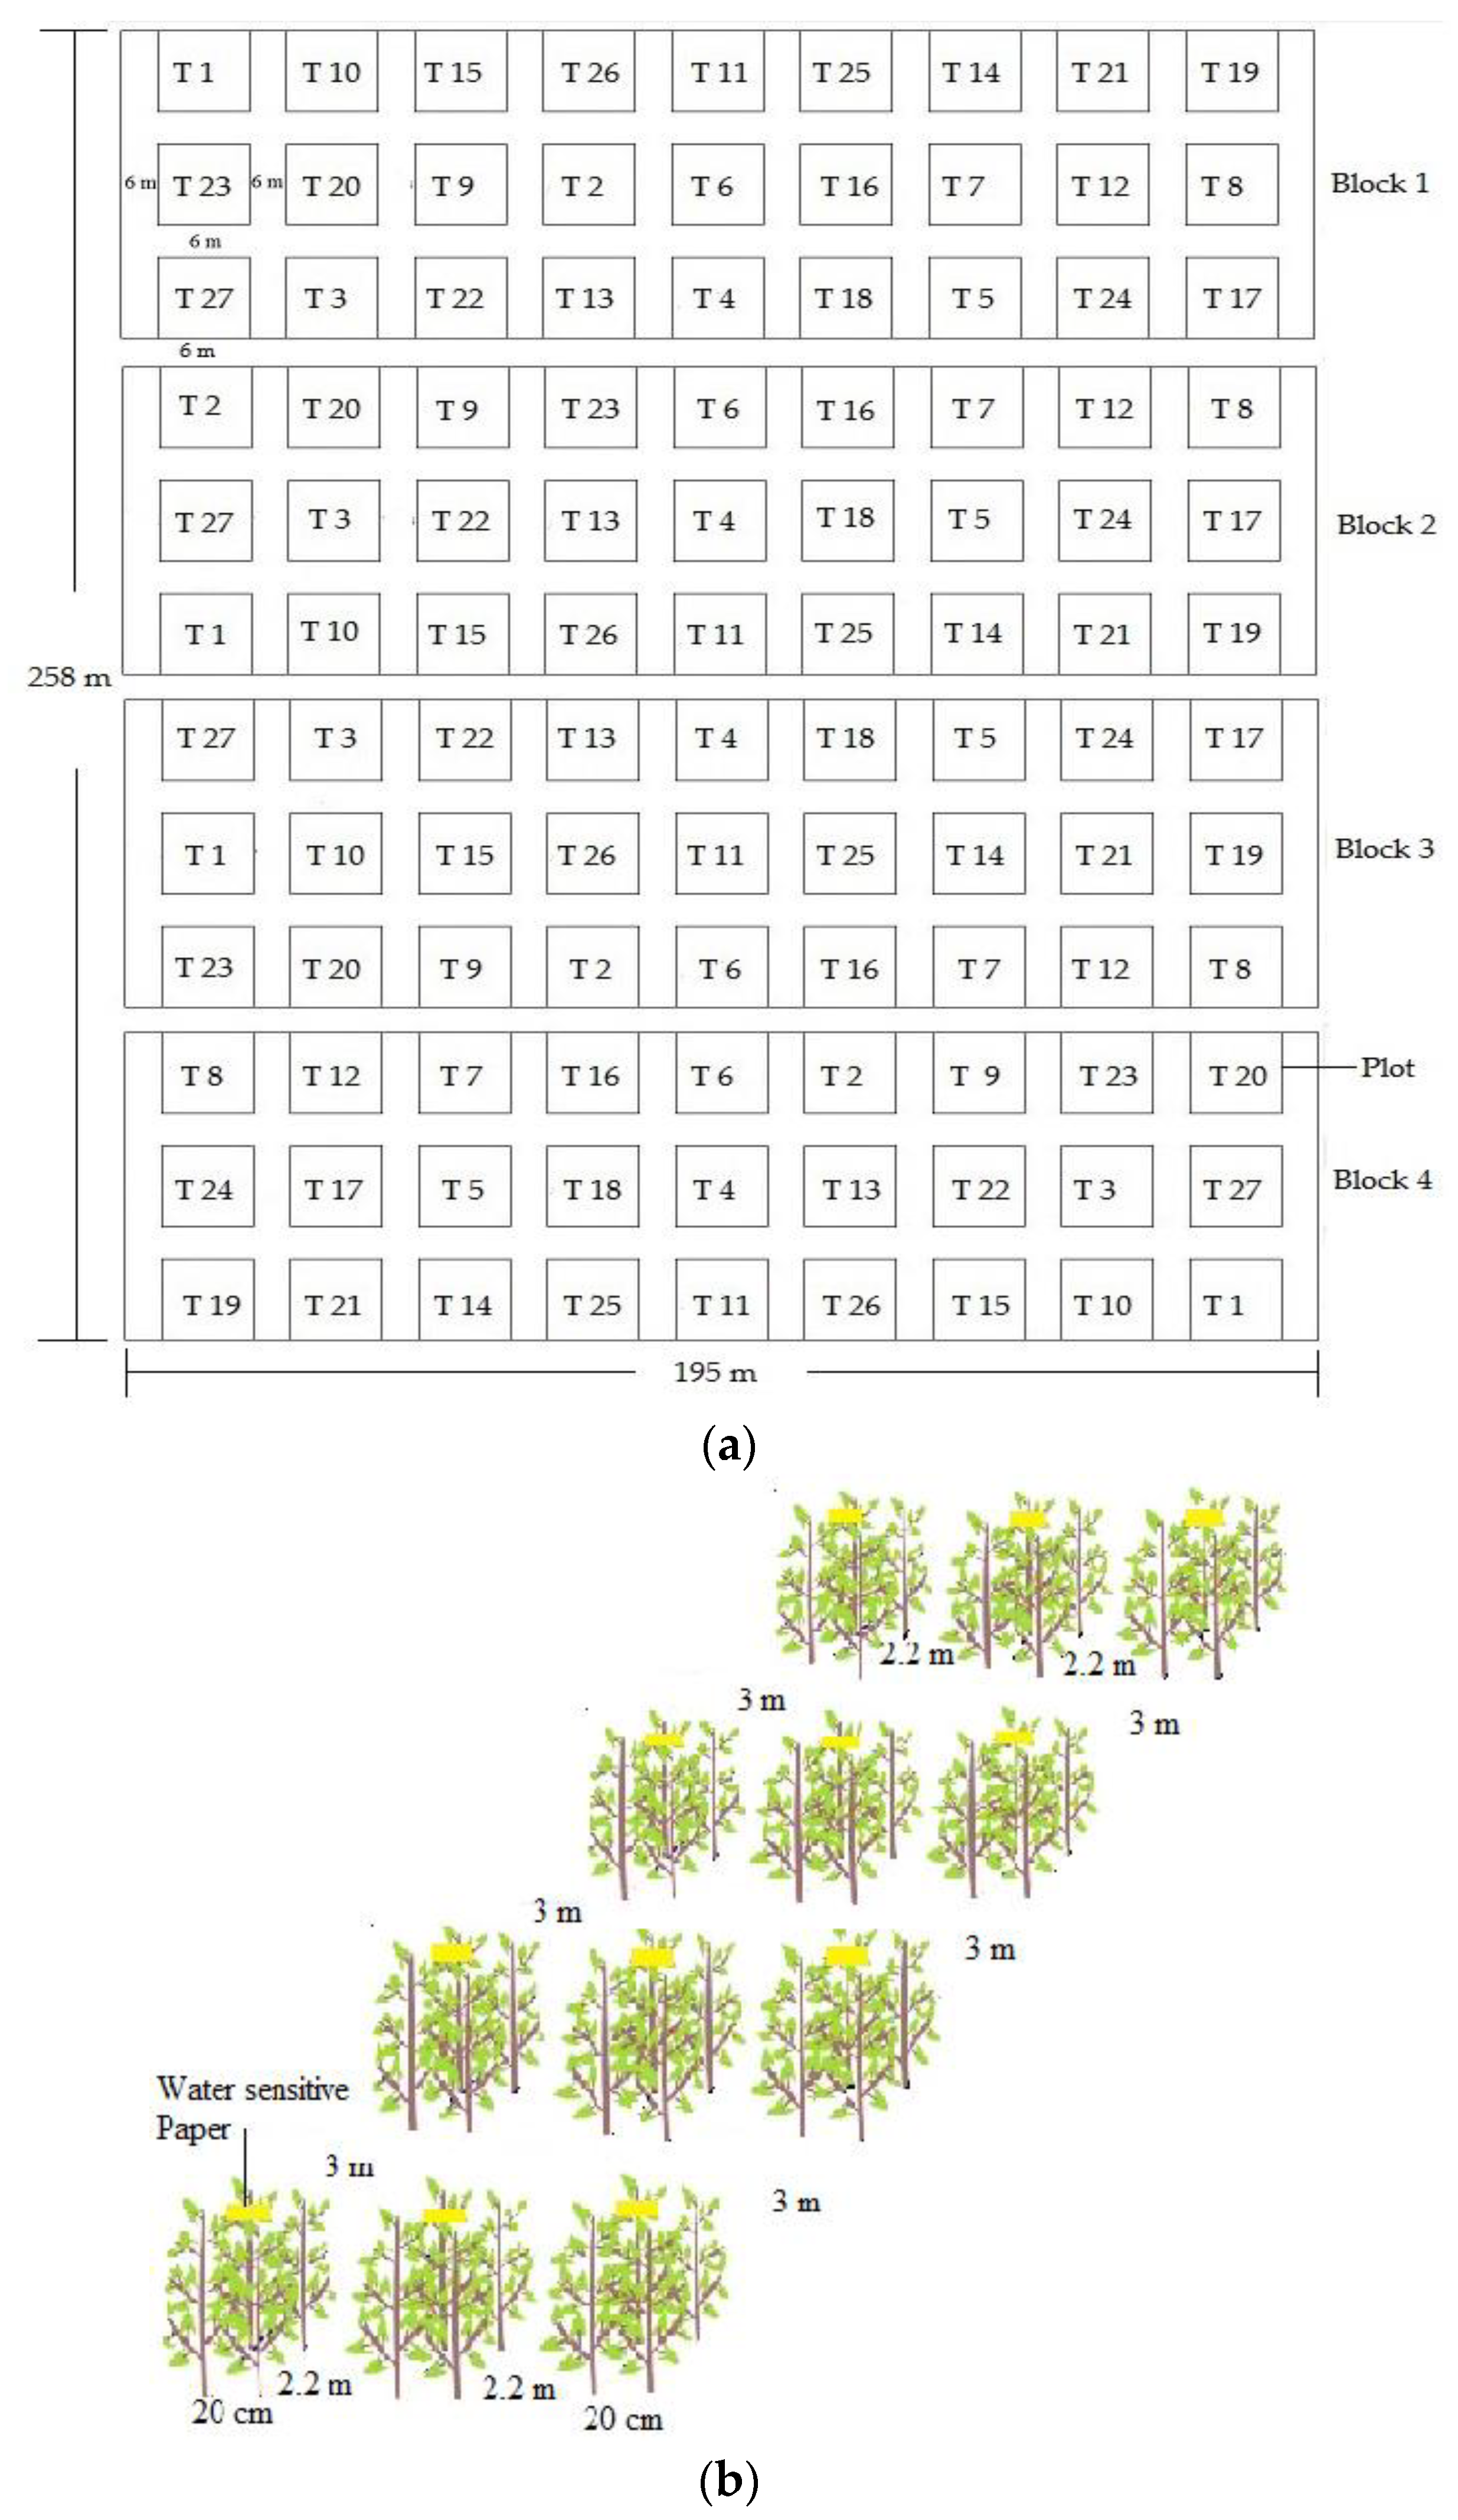
The experiment consists of twenty-seven spray treatments. In each treatment three variables such as forward speed, spray height, and spray pressure were used in a combination. All treatments are given in Table 2. The three spray characteristics were evaluated. The spray characteristics were evaluated in a 258 m × 195 m area (Figure 7a). In the experimental area, spray treatments were planned as a randomized complete block design with four replications, resulting in four blocks each with twenty-seven plots corresponding to different spray treatments. Each plot was a 15 m × 15 m area. To avoid drift problems, six-meter buffer zones were provided between plots (Figure 7a). Before each spray treatment application, water-sensitive papers (WSPs) (25 × 75 mm) were placed at the top of the plants in each plot (Figure 7b). In each plot, three crop lines were selected (2.2 m apart) and four WSPs were placed at each crop line along the direction of travel. In each crop line, WSP was 3 m apart (Figure 7b). WSPs were arranged at the center of the plots, to avoid cross-contamination between plots. The WSPs were used to evaluate the spray characteristics.
Freshwater was used in all spray treatments as a spraying material. Using a measuring tape and a stopwatch, the speed was calibrated. Measuring tape was also used to adjust the spraying height before each treatment and it was controlled with a hydraulic system of the sprayer. The spray pressure was measured with a pressure gauge, and it was controlled with a pressure regulation valve.
WSPs were collected after 35–45 s of spraying from each plot. After collection, separate labeled bags were used to store the WSPs. The label of each bag contained information like location, treatment, and replication. All sampling bags were stored in the light-proof seal container after collection. Immediately after storage, a light-proof container was transported to the laboratory for analysis. There were twelve WSPs for each plot (Figure 7b).
Using a 600-dpi scanner and Depositscan software [31], all WSPs were scanned and analyzed in the laboratory. Depositscan software was used to analyze the spray characteristics by measuring the droplet deposits in the digital image. In the Depositscan software, the formula used to convert the spot area to the droplet diameter is given in Equations (18)–(20).
d   = 0.95 ds   0.910
where
ds = 4 A π
and A is the spot area (µm2) obtained from ImageJ. However, the software is enabled to consider the impact of the spread factor [32], therefore, to determine the droplet diameter (Dv0.1, Dv0.5, and Dv0.9) from the stain diameter, the following equation was used [33].
D   = 0.5507   d     0.00009 d 2
where D is the droplet size (µm), and d is the stain diameter on the WSP (µm).

2.3.3. Data Analysis

The data was processed through the different tests before analysis of variance. The equality of variance across the data was analyzed using Levene’s test (Table 3). The normal distribution of data was analyzed using the Kolmogorov-Smirnov test (p < 0.05) (Table 4). The residual analysis was performed for analyzing the residual distribution across the data. The residuals distribution across the data was normal (Figure 8). The analysis of variance (ANOVA) was performed, and means were compared using Duncan’s test at 95% confidence of interval with SPSS v28.0 (SPSS Inc., an IBM Company, Chicago, IL, USA).

2.4. Field Efficiency

The field efficiency was used to evaluate the sprayer’s working performance. It was calculated in a separate field at the 6 km h−1 forward speed. The 6 km h−1 forward speed was used because sprayer performance was better at this speed. A skilled driver operated the sprayer. The spraying area and the total time were recorded in this study. The total spraying time included time to refill the spray tank and the turning time of the sprayer. Other parameters, such as time for adding chemicals, time for mixing chemicals, time for minor repairing, etc., were not included in this study because they are more effective in large-scale applications. Three experiments were conducted. The field efficiency was calculated using the formula (Equation (21)).
FE   = EFC   TFC × 100
where FE is the field efficiency (%), EFC is the effective field capacity (ha h−1), and TFC is the theoretical field capacity (ha h−1).

2.5. Economic Analysis

The cost analysis of the machine was carried out to determine the cost of spraying per unit area. The cost of spraying per unit area was calculated using two categories: fixed cost and variable cost. The fixed costs include depreciation and interest, and variable costs include labor, repair, and fuel charges.

3. Results and Discussion

3.1. Laboratory Evaluation

Effect of Pressure on Spray Symmetry of Nozzle

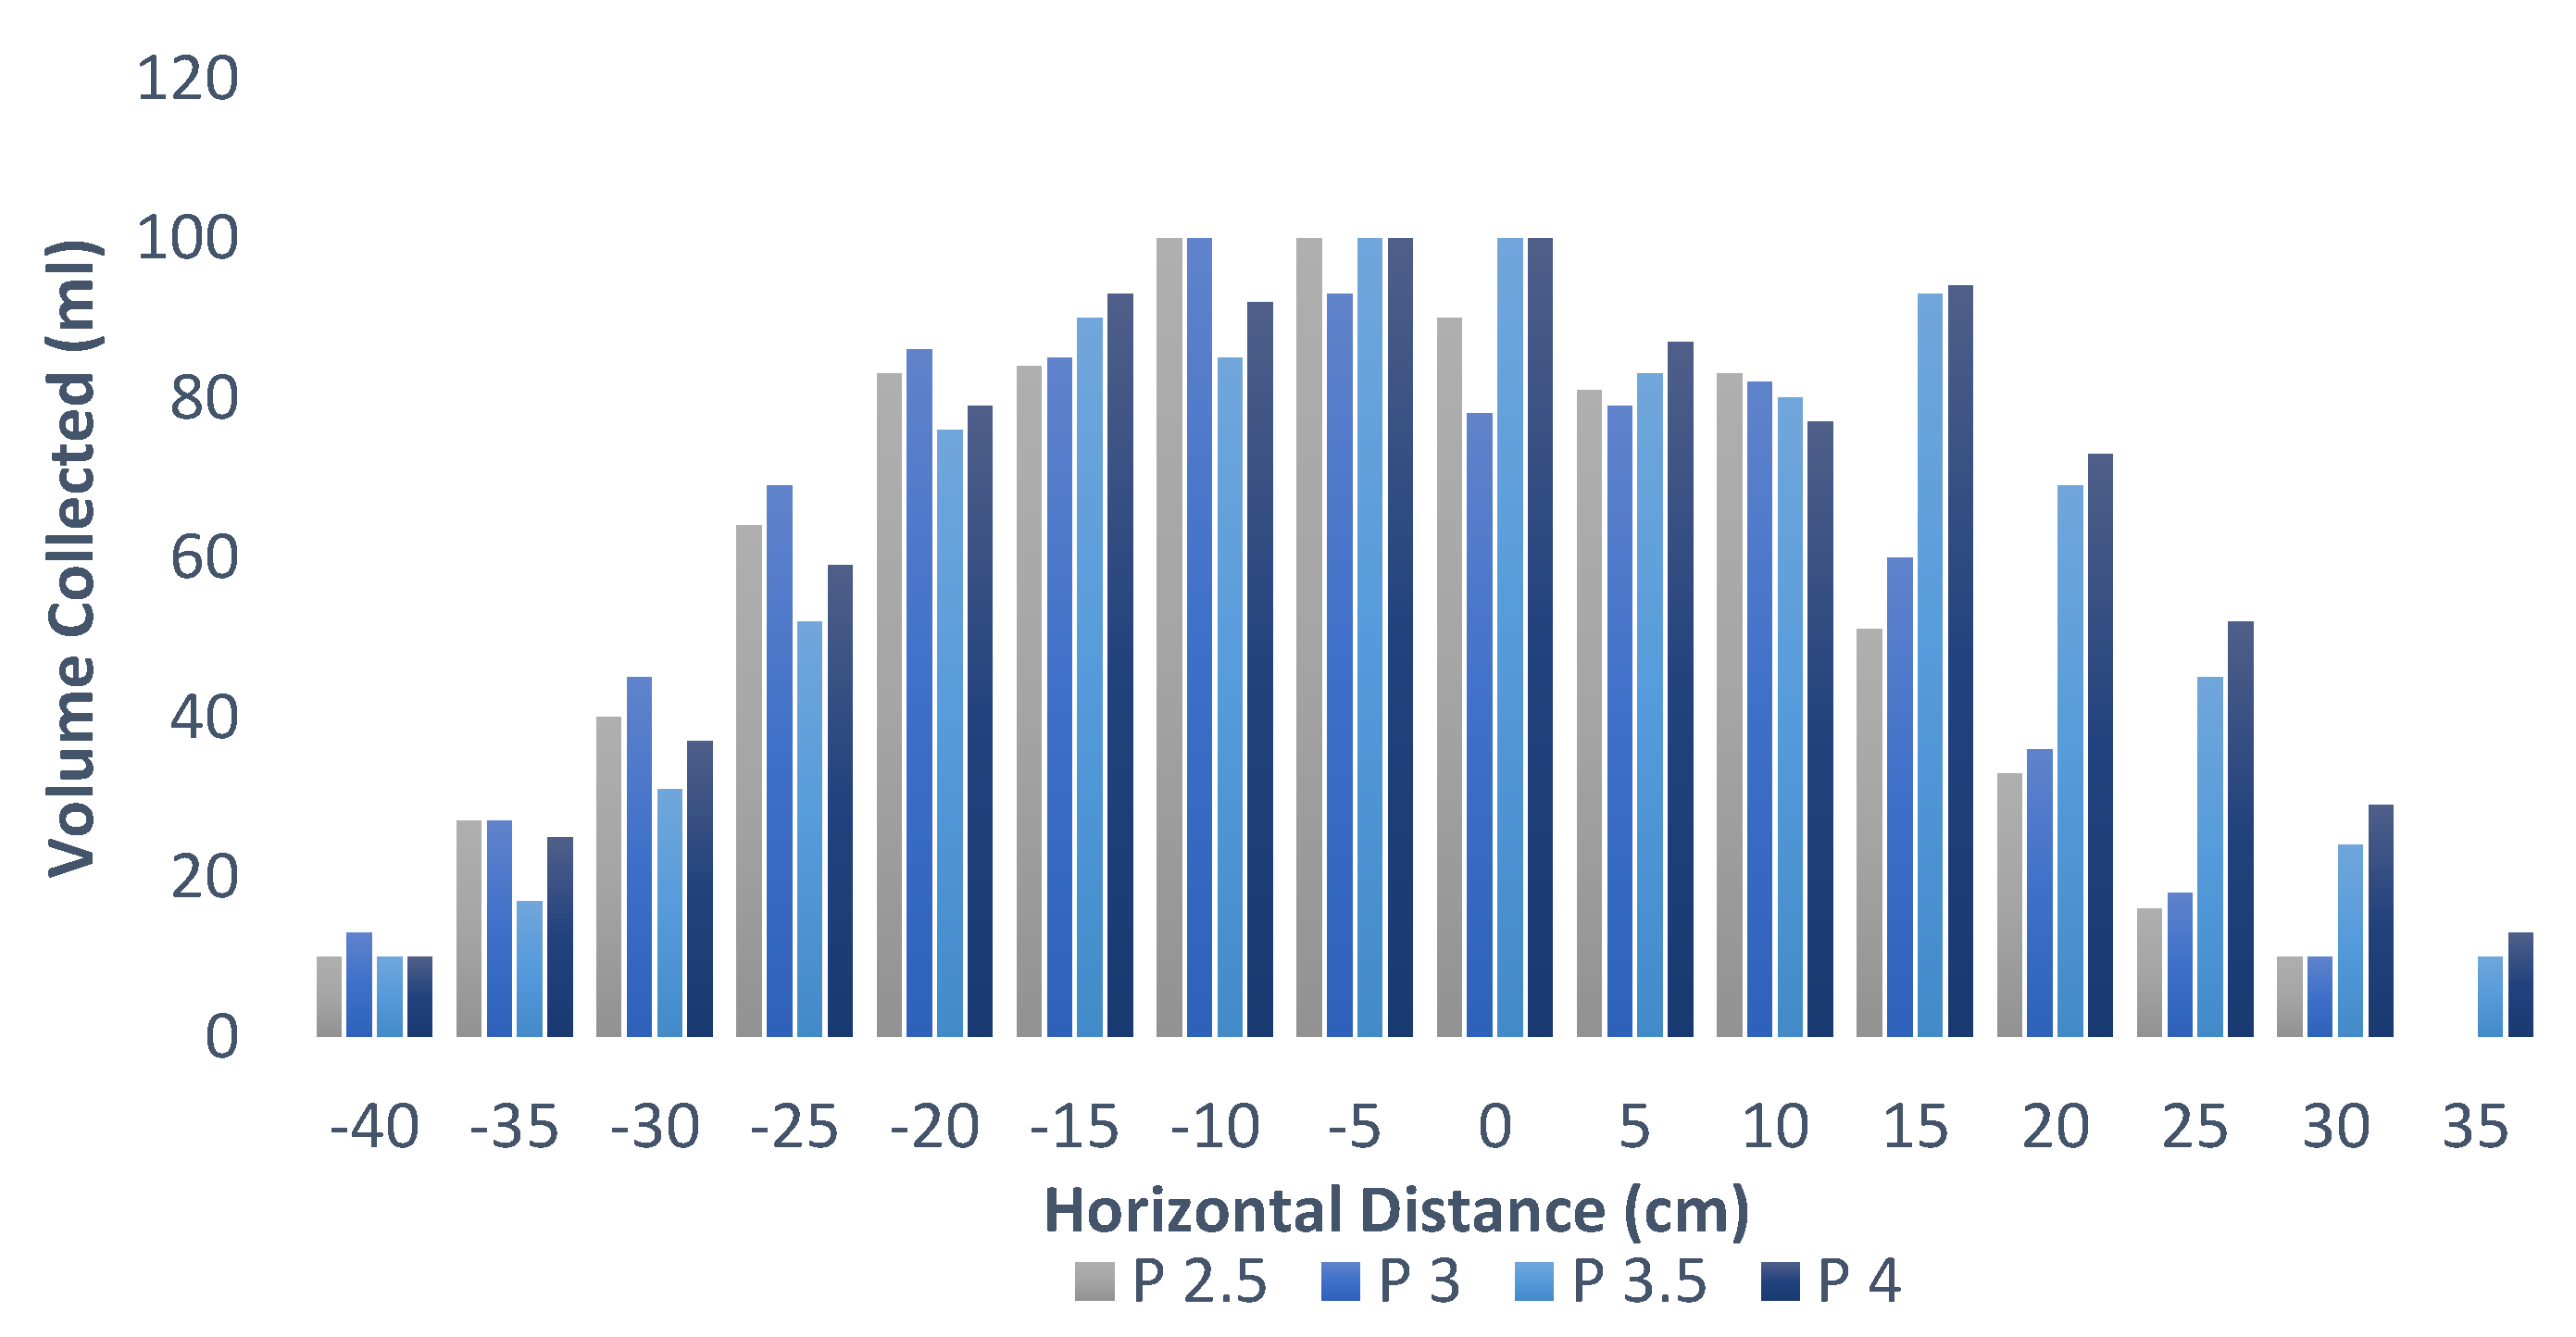
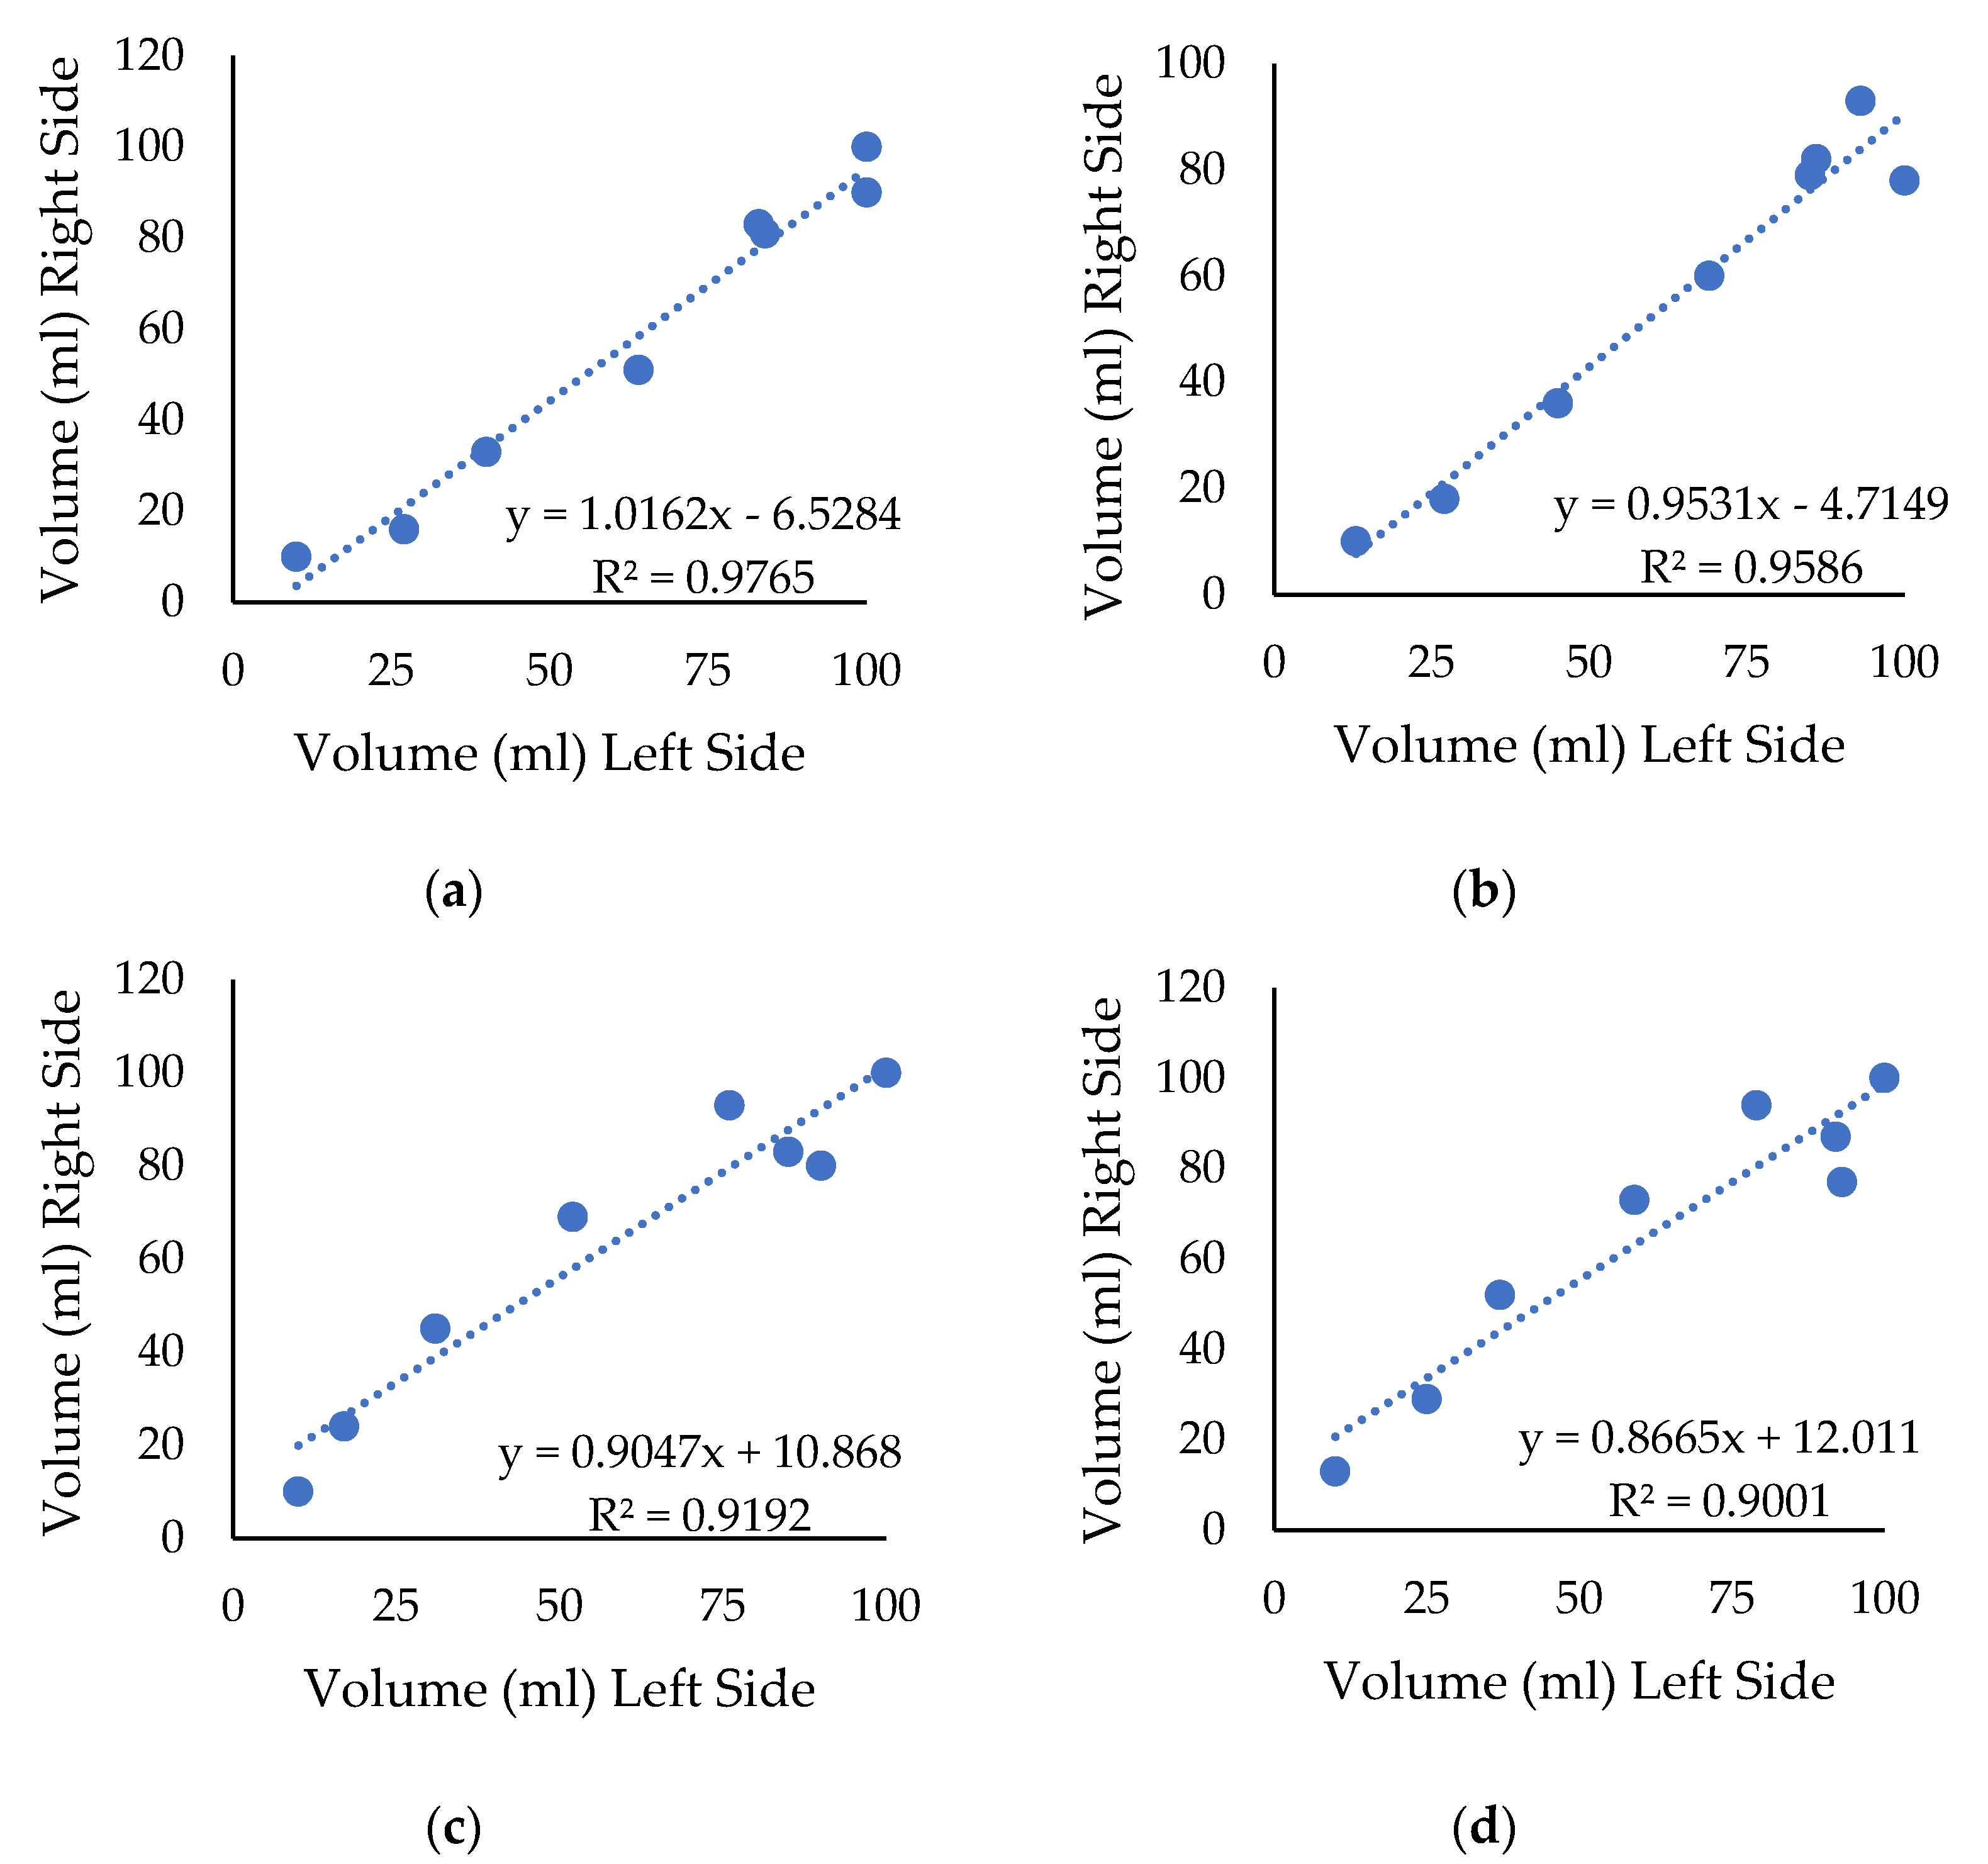
The spray symmetry analysis was used to observe the spray volume distribution on either side of the nozzle. Spray symmetry of hollow cone nozzle at different pressure is shown in figures (Figure 9 and Figure 10). Figure 9 shows the volumetric distribution comparison at different pressures. The coefficient of variation (CV) for the entire spray width was 63.49, 59.08, 65.70, and 64.89 % for 2.5, 3, 3.5, and 4 bar pressure, respectively, which was quite high as it depends on the width of the spray. As spray width decreases, its CV would be reduced. In Figure 10, the coefficient of determination (R2) value was 0.98, 0.96, 0.92, and 0.90 at 2.5, 3, 3.5 and 4 bar pressure, respectively. The R2 value describes the percentage of the variance for a response variable that is explained by an independent variable in a model. The R2 value indicated that 98, 96, 92, and 90% of the variability of response could be explained by the model at 2.5, 3, 3.5, and 4 bar pressure, respectively.
If the R2 value is higher than 0.96, the spray will possibly be considered symmetrical [34,35,36]. The results showed that the spray was symmetrical at 2.5 and 3 bar pressure as the R2 value was higher than 0.96 compared to 3.5 and 4 bar pressure.

3.2. Field Evaluation

The results of spray characteristics of the sprayer are discussed in this section.

3.2.1. Effect of Spray Treatments on Droplet Density of Sprayer

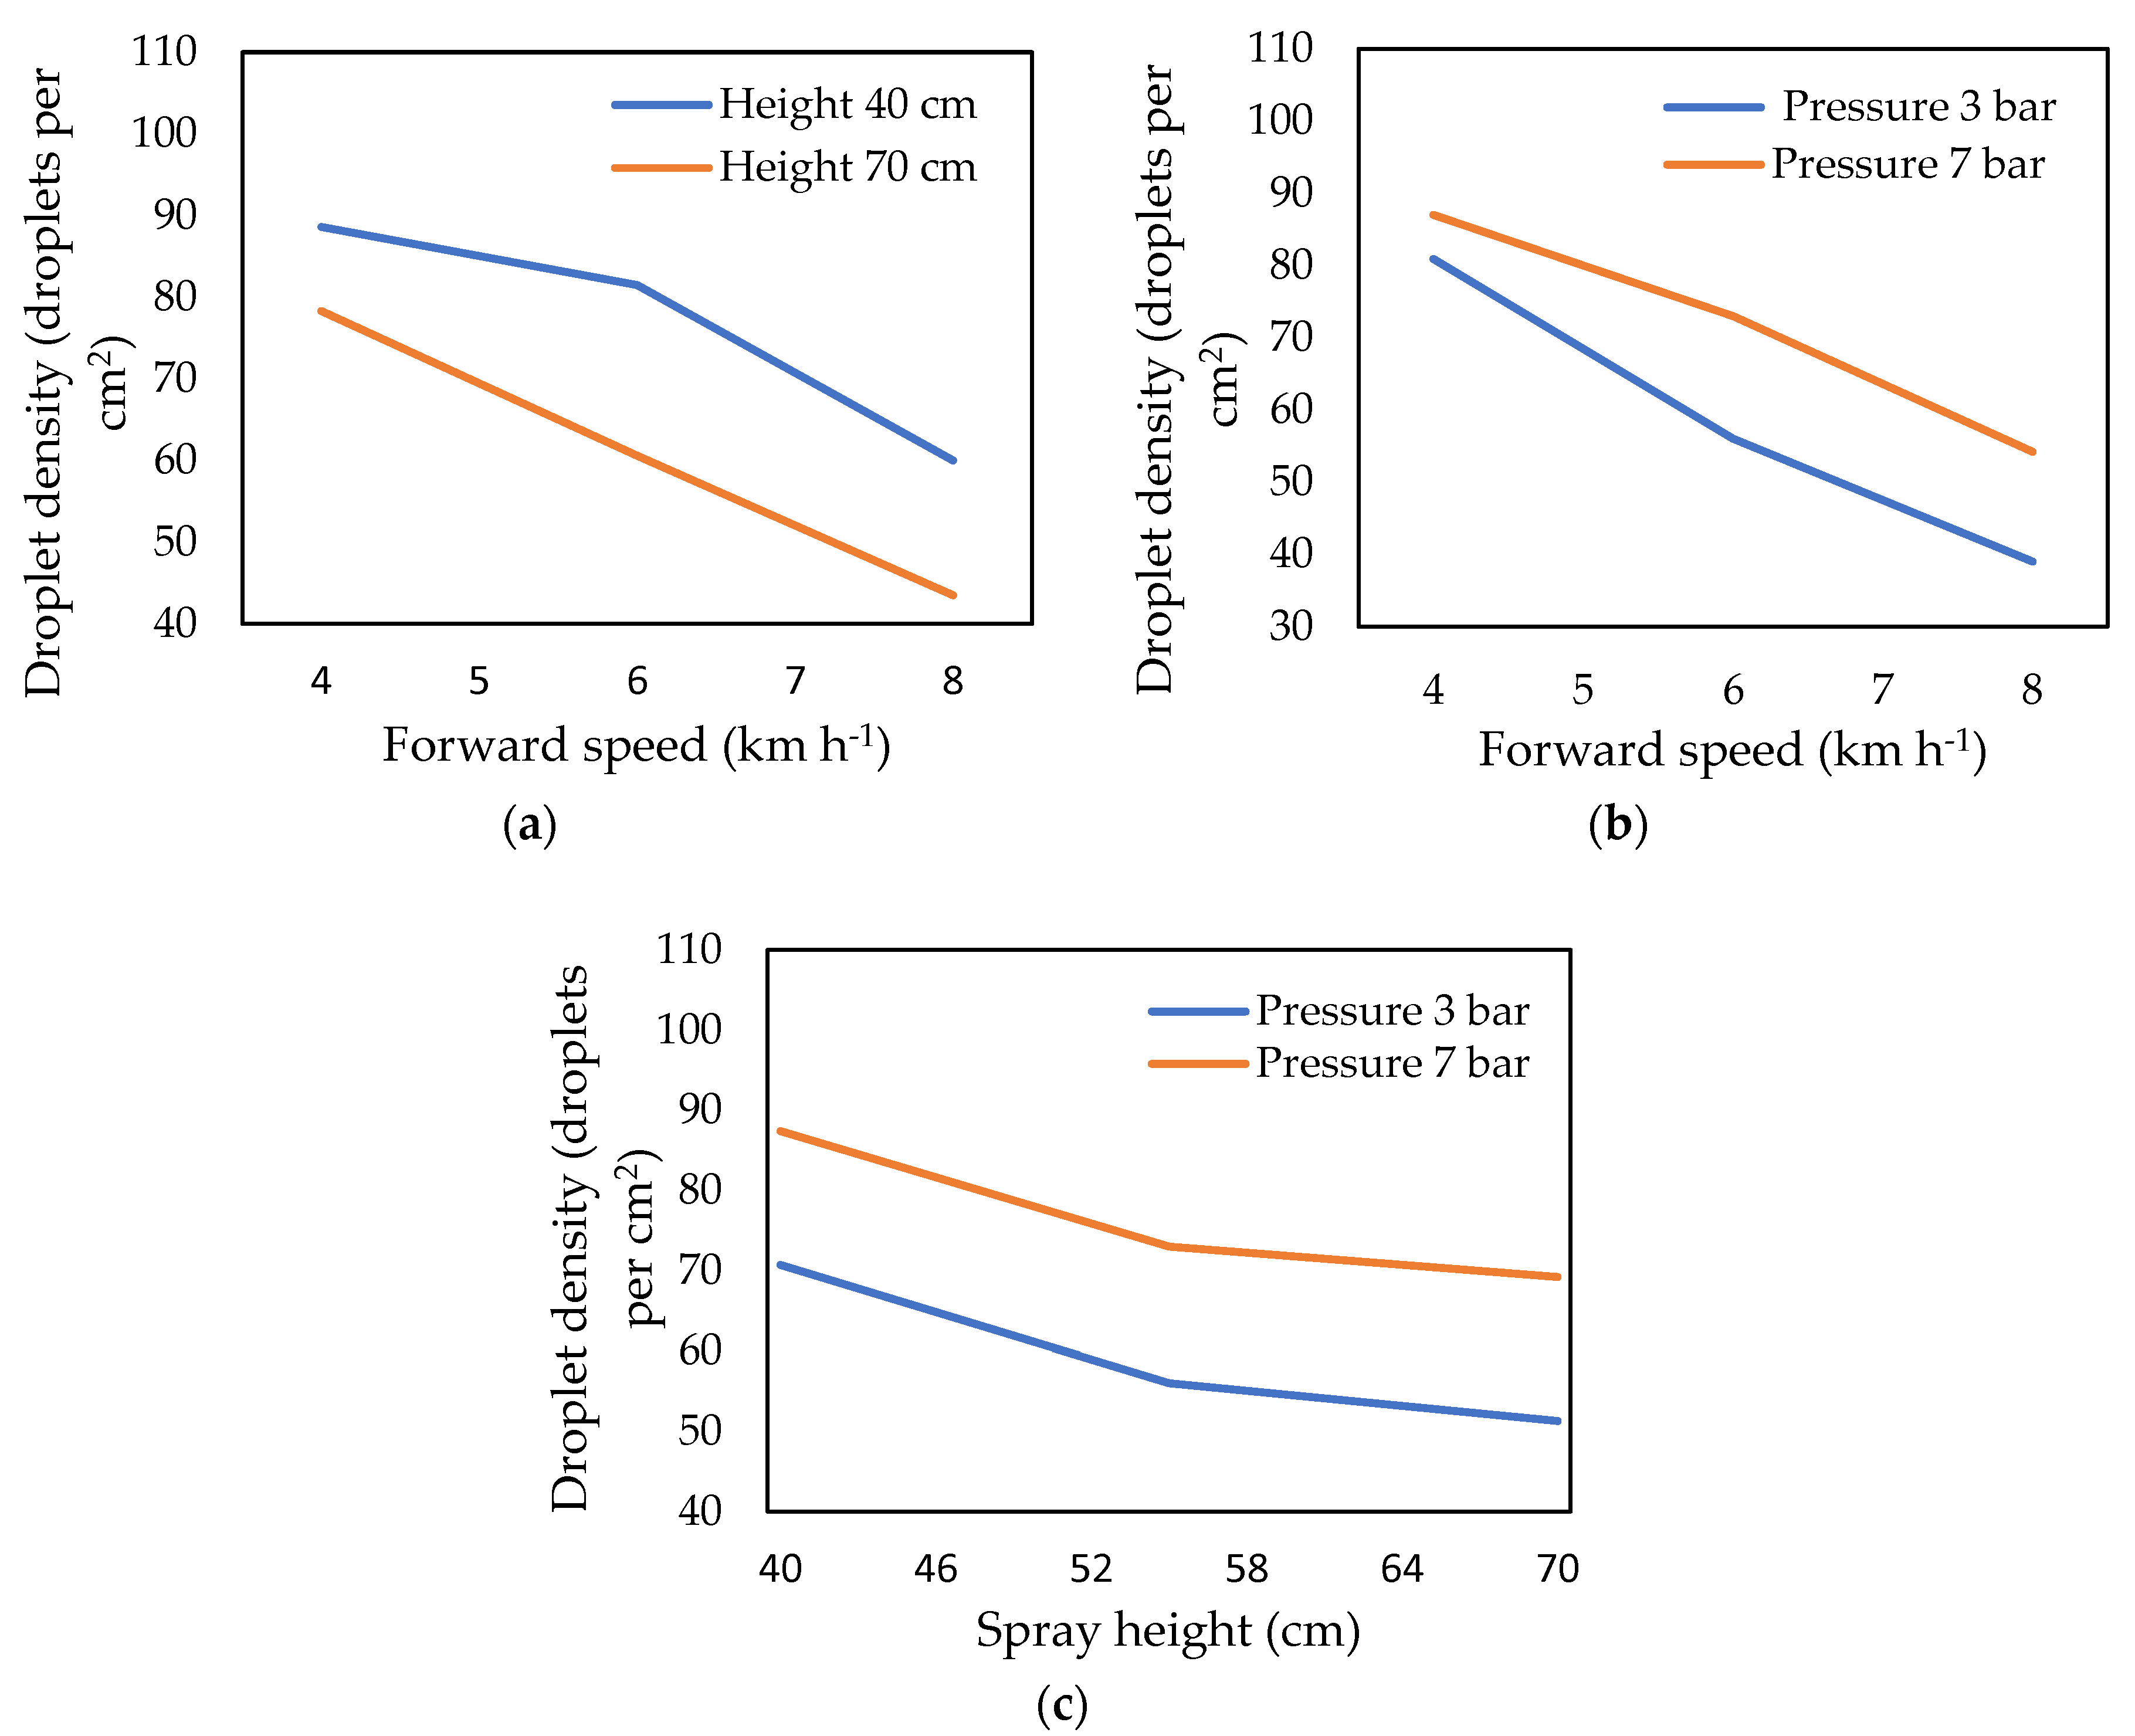
The droplet density of spray liquid was measured at different spray treatments (Table 5). The maximum and minimum droplet density values were 97.4 and 31.3 droplets per cm2 at treatment T3 (4 km h−1, 40 cm, 7 bar) and T25 (8 km h−1, 70 cm, 3 bar), respectively. Figure 11a showed that by increasing the speed from 4 to 8 km h−1 in treatment T2 (4 km h−1, 40 cm, 5 bar) and T20 (8 km h−1, 40 cm, 5 bar), the droplet density was decreased up to 32.3% while height and pressure were kept constant. This 32.3% decrease in droplet density was due to variation in spray application rate, as doubling the forward speed at constant pressure, cuts the spray application rate in half [37].This decrease could also be due to boom movement and air turbulence near nozzles at high speed. Similarly, a 44.5% decrease in droplet density was observed in T8 (4 km h−1, 70 cm, 5 bar) and T26 (8 km h−1, 70 cm, 5 bar) for increasing the speed from 4 to 8 km h−1 at a constant height and pressure. The droplet density rate change (12.2%) between 32.3% (between T2 and T20) and 44.5% (between T8 and T26) was due to the height effect (40 cm to 70 cm). Likewise, in treatments, T2 and T8 when height changed from 40 cm to 70 cm at a constant speed and pressure, an 11.6% decrease was observed in droplet density. Based on the results, we concluded that as forward speed and spray height increased, the value of droplet density decreased. Carroll [38] reported that as forward speed increased, the droplet density decreased. Khan et al. [39] also reported that the droplet density decreases as forward speed and spray height increase. Figure 11b showed that in treatment T4 (4 km h−1, 55 cm, and 3 bar) and T6 (4 km h−1, 55 cm, and 7 bar) when pressure increased (3 bar to 7 bar), the value of droplet density was increased up to 7.1%. Likewise, when spray pressure increased from 3 bar to 7 bar at constant forward speed (8 km h−1) and spray height (55 cm) in treatments T22 and T24, the droplet density was increased to 28%. This increase in droplet density was due to an increase in application rate with pressure. Carroll [38] reported that the application rate increases with an increase in pressure. It is concluded that as the value of pressure increased, the value of droplet density also increased. Khan et al. [39] reported the same trend. Figure 11c showed that the change in the droplet density was very little or less than 1% in treatments T10 and T18 when both height and pressure increased at the same time at a constant speed of 6 km h−1.
The results showed that 15% of droplet density values from all treatments lie in the 20–40 droplets cm−2 range, 48% values from all treatments lie in 40–70 droplets cm−2, and 37% values from all treatments lie in 70–100 droplets cm−2. This revealed that more than 60% of data lie in the recommended range reported by Zhu et al. [31] (Table 5). The results also showed that the effect of treatments was significant at a 95% confidence interval. The effect of crop block and interaction was insignificant (Table 6). The mean comparison results showed that treatment T3, T8, T14, T16, T22, and T25 means were significantly different at a 95% confidence interval (Table 5).

3.2.2. Effect of Spray Treatments on Coverage Percentage of Sprayer

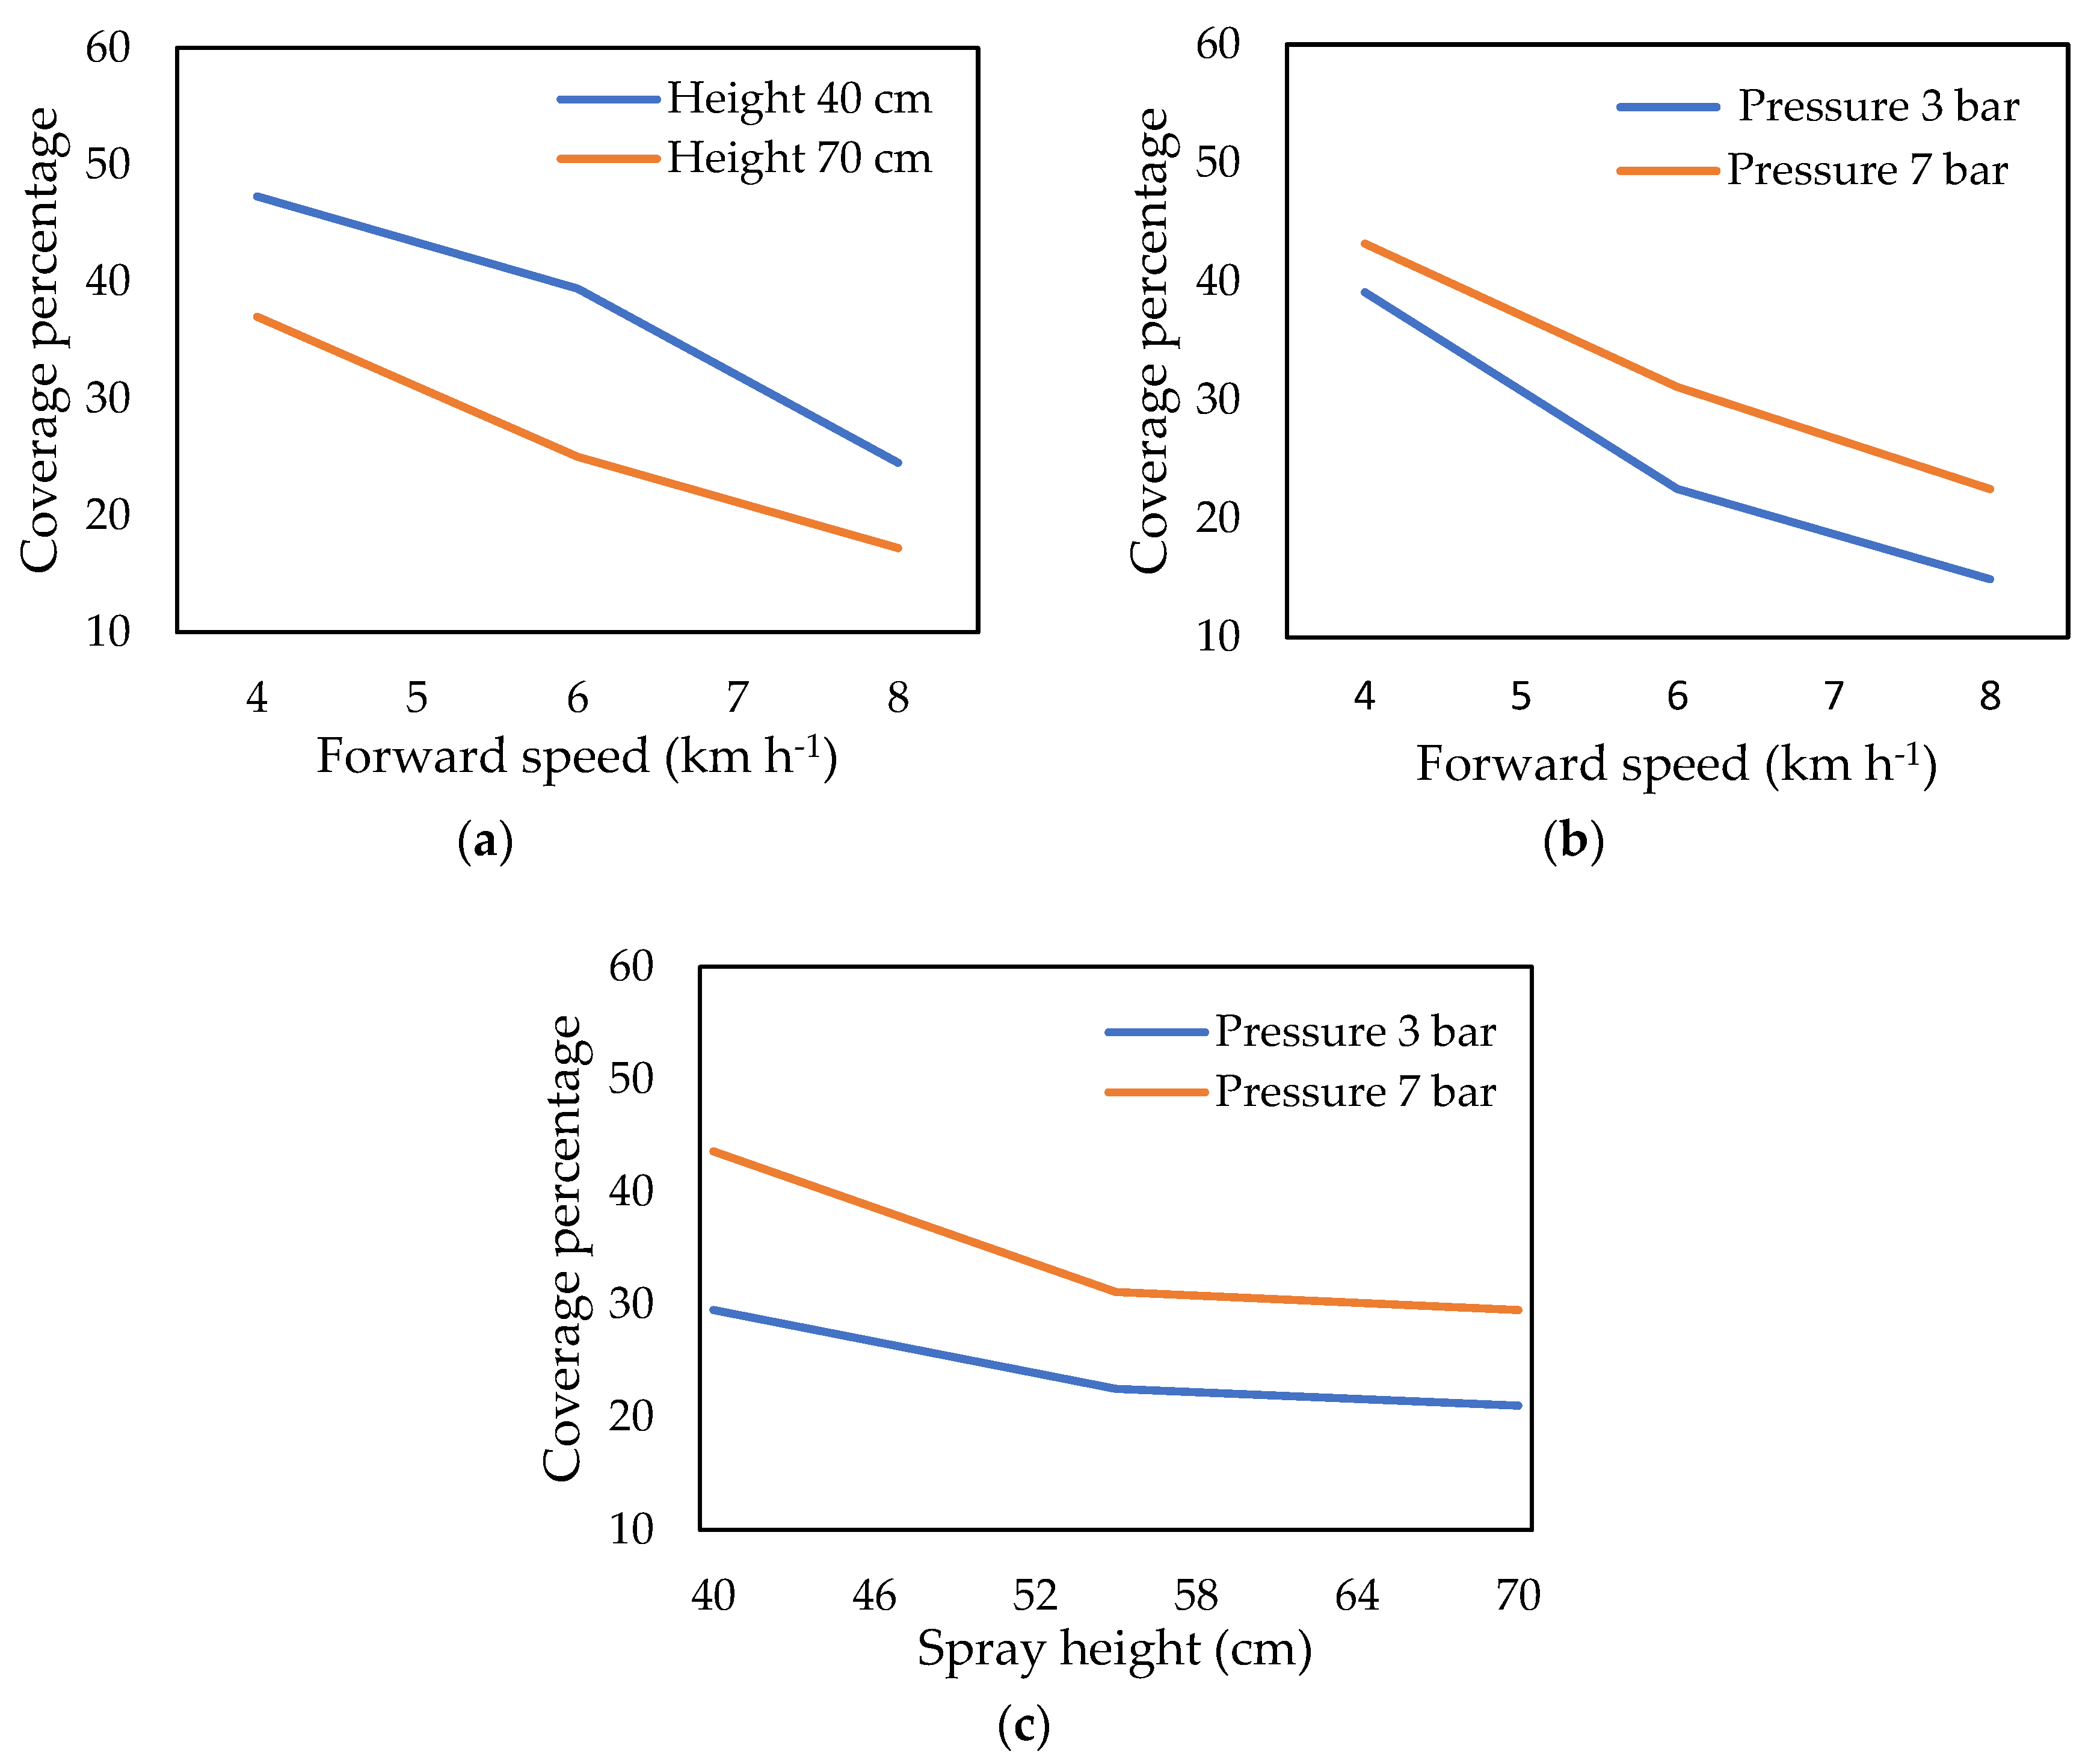
The coverage percentage of spray liquid was measured at different spray treatments (Table 7). The rate of coverage percentage is dependent on spray volume, nozzle type, and spray angle. The different hydraulic nozzles have different coverage values [40]. The large spray angle nozzles have high coverage percentage [40]. Various studies showed that the coverage percentage was low at low spray volume and vice versa [41]. Sayinci et al. [40] reported that fine droplet-producing nozzles (multirange, standard flat-fan, narrow cone standard, hollow cone nozzle) generally had high coverage percentage. The maximum and minimum coverage percentages for T3 and T25 were 55.9 and 13.1%, respectively. Figure 12a showed that, in treatment T2 (4 km h−1, 40 cm, and 5 bar) and T20 (8 km h−1, 40 cm, and 5 bar), when forward speed increased but other factors were kept constant, the value of coverage percentage was decreased up to 48.2%. In treatments T8 and T26, when spray height was set at a high level (70 cm), speed changed from 4 to 8 km h−1, and pressure was kept constant at 5 bar, the value of coverage percentage was decreased to 53.5%. When spraying height changed (40 to 70 cm), the coverage percentage was decreased to 21.8% in treatment T2 (4 km h−1, 40 cm, and 5 bar) and T8 (4 km h−1, 70 cm, and 5 bar). The results showed that the forward speed and spray height significantly (α = 0.05) affect the coverage percentage in quite a similar way. A significant reduction was found in the coverage percentage when the speed and height were increased. Sayinci et al. [40] reported a similar trend as forward speed and height become higher, the value of coverage percentage decreases. Koszel [42] observed increasing coverage percentage by decreasing forward speeds (5, 7, and 9 km h−1) in a standard flat-fan nozzle. Nansen et al. [43] reported the same trend as forward speed increased, the coverage percentage decreased. Khan et al. [39] also reported that with increasing forward speed and spray height the coverage percentage was decreased. Figure 12b depicted that the value of coverage percentage was increased by 9.5% when pressure increased (3 to 7 bar) in treatment T4 and T6 at the constant speed and height. Similarly, in treatments T22 and T24 when pressure changed from 3 bar to 7 bar at constant speed and height (8 km h−1 and 55 cm), the coverage percentage was increased to 33.8%. This showed that the coverage percentage increased as the value of spray pressure increased. Various studies reported the same trend. Ranta et al. [44] concurred with the same results. Carroll [38] reported the same results. Khan et al. [39] also reported that as pressure increases, the coverage percentage also increases. According to Figure 12c, when both spray height and pressure increased at the same time in the treatments T10 and T18 (40 to 70 am and 3 to 7 bar) at a constant speed, there was no effect on coverage percentage.
The results revealed that 26%, 55.5%, and 18.5% coverage percentage values from all treatments lie in the 10–20%, 20–40%, and 40–55% range, respectively. This showed that 74% of data have high coverage percentage values (Table 7). The results also showed that the effect of treatments was significant at a 95% confidence interval. The effect of crop block and interaction was insignificant (Table 8). The mean comparison results showed that treatment T2, T3, and T8 means were significantly different from one another at a 95% confidence interval (Table 7).

3.2.3. Effect of Spray Treatments on VMD of Sprayer

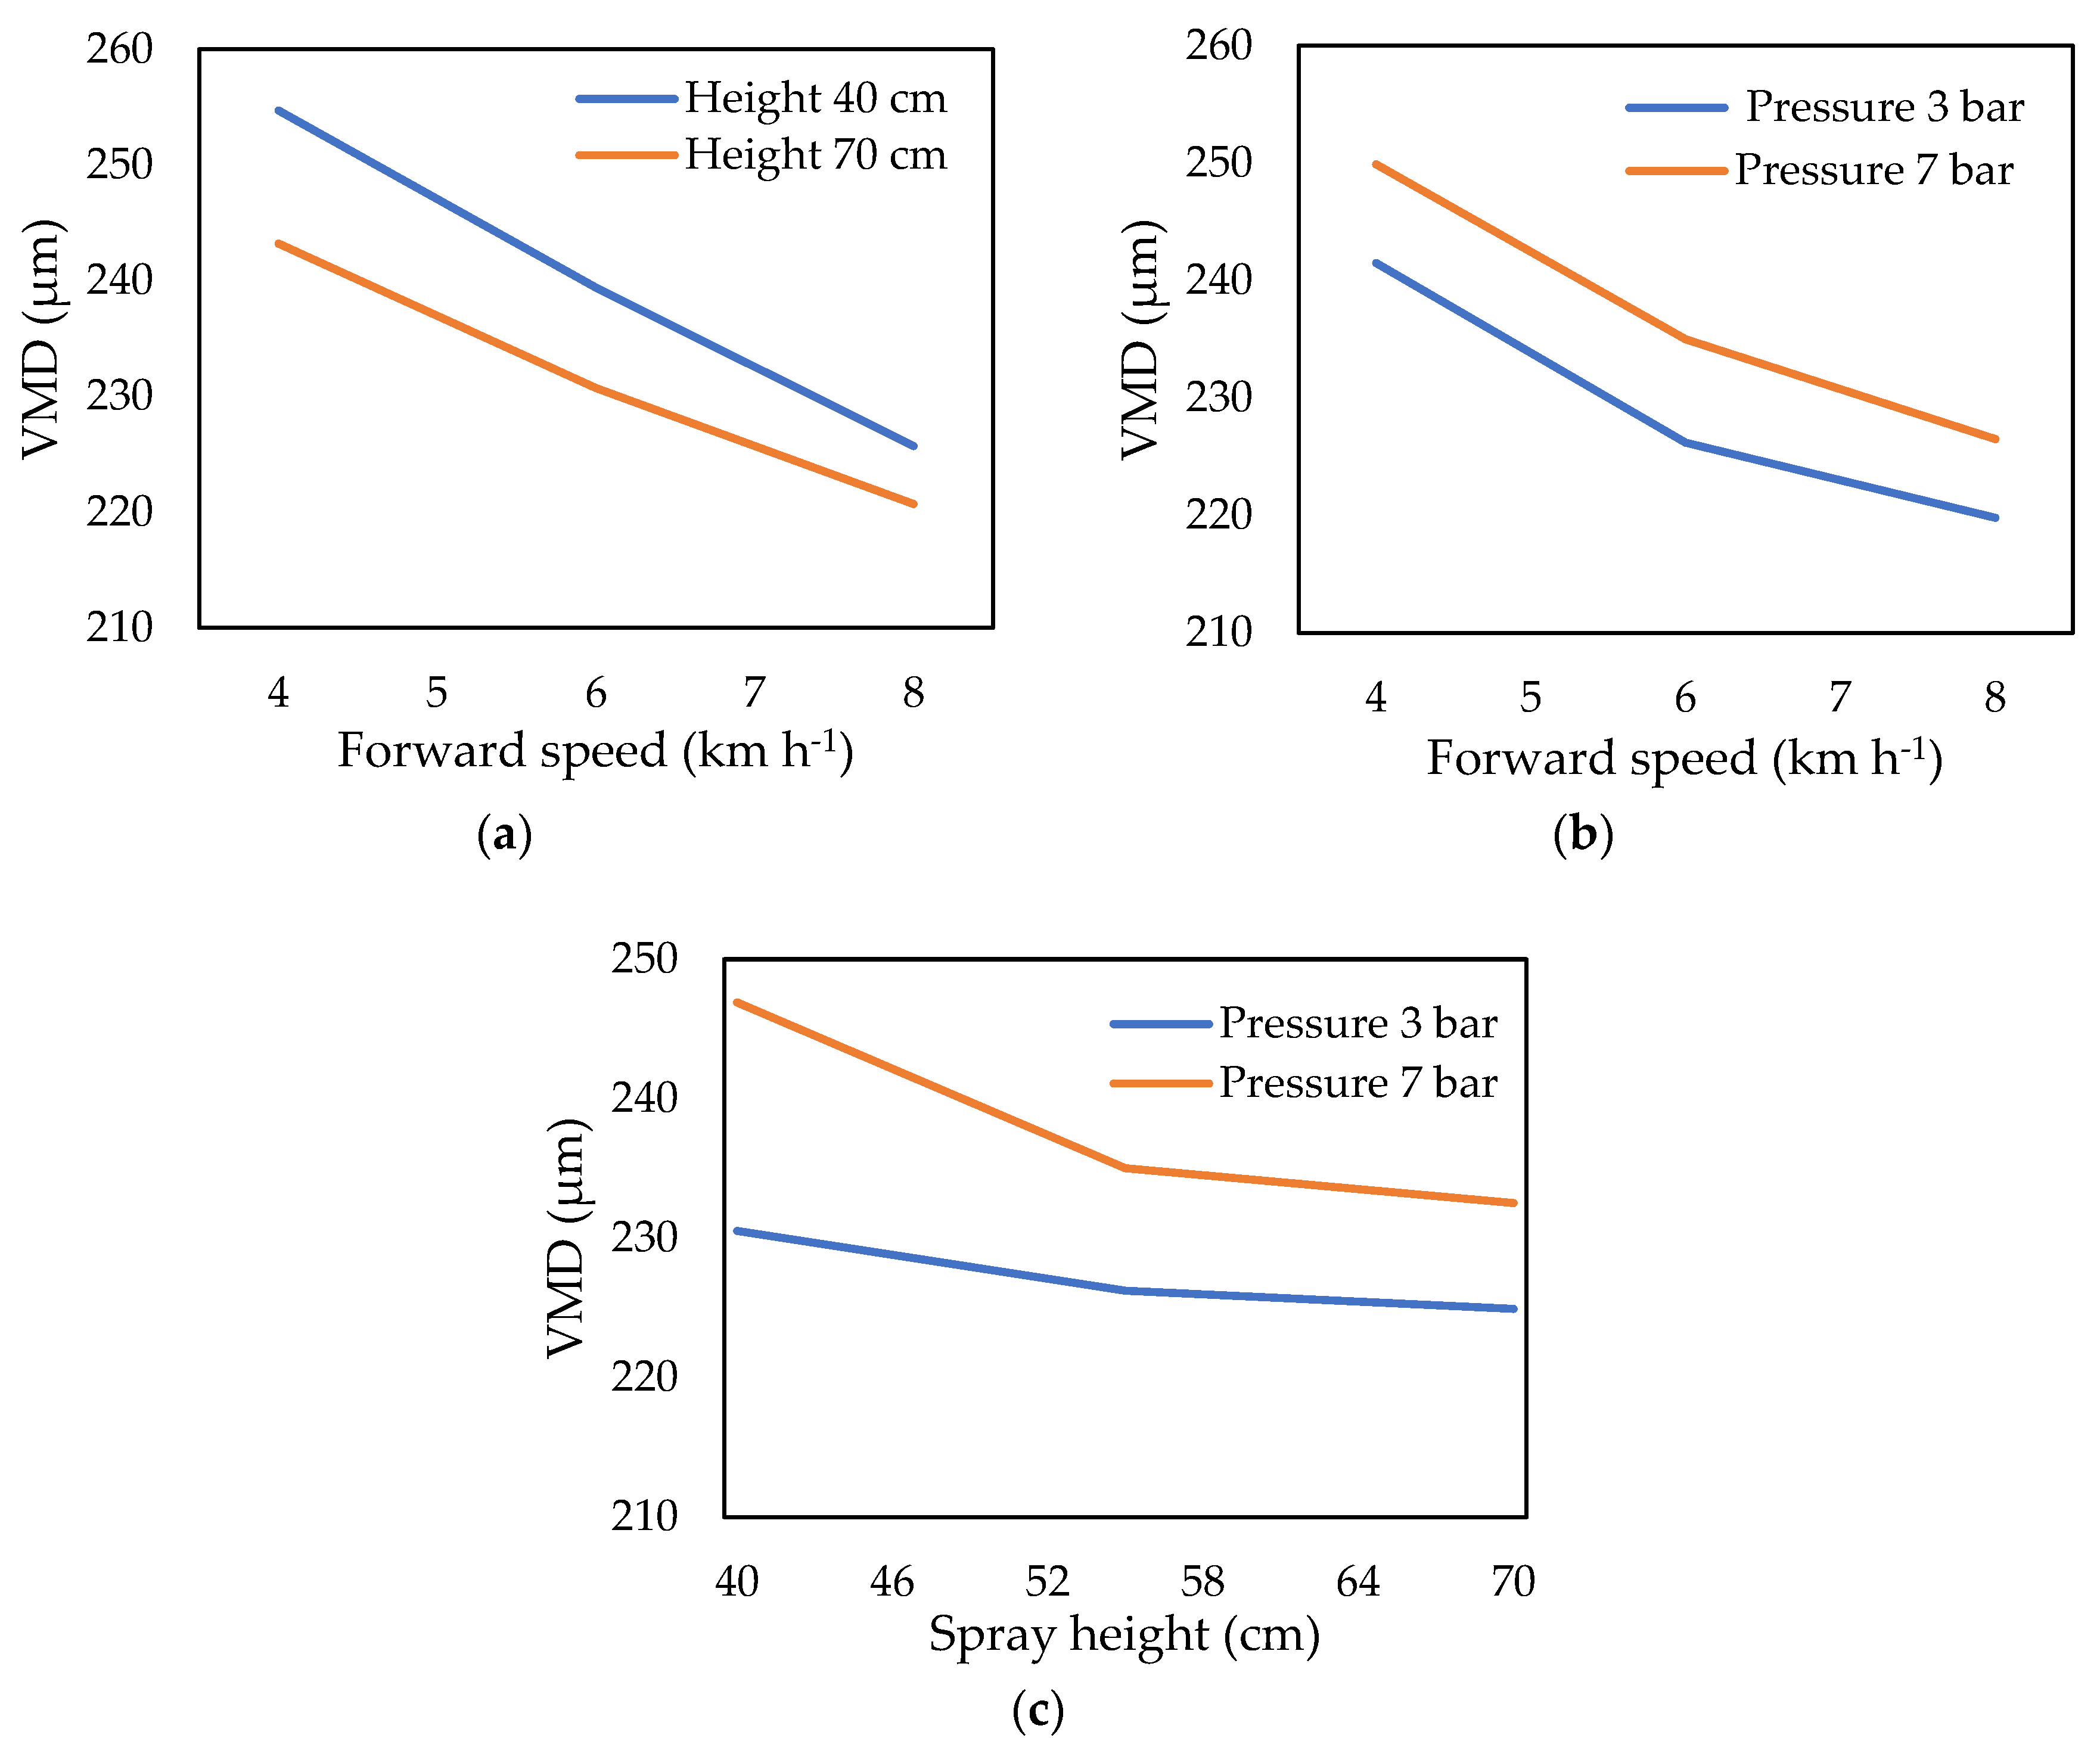
The VMD of spray liquid was measured at different spray treatments (Table 9). The VMD is dependent on nozzle orifice size and spray pressure. VMD increased with a large orifice-size nozzle [40]. Teejet [45] studied that VMD decreases with increasing pressure. The maximum and minimum VMD was found for T3 and T25, which were 261.4 and 217.1 µm, respectively. Figure 13a showed that the VMD was decreased to 11.4% in treatments T2 and T20 when forward speed increased (4 km h−1 to 8 km h−1) at the constant height (40 cm) and pressure (5 bar). A 4.5% decrease was also observed in VMD when height increased (40 cm to 70 cm) while other parameters were kept constant at 4 km h−1 and 5 bar in treatments T2 and T8 concluding that the VMD decreased as speed and height increased. Shirwal et al. [46] reported the same trend. Azizpanah et al. [47] observed the smaller diameters of droplets with increasing the spray height. Khan et al. [39] also reported that VMD decreases as forward speed and spray height increase. Figure 13b showed that when pressure increased (3 to 7 bar), a 3.4% increase was observed in VMD at the constant speed and height (4 km h−1 and 55 cm) in treatments T4 and T6. Similarly, a 3% increase was observed in treatments T22 and T24 when forward speed and spray height were kept constant at 8 km h−1 and 55 cm, respectively. This shows that the VMD increases a small amount with increasing pressure. Khan et al. [39] concurred with the same results. Ranta et al. [44] found that the VMD increases as pressure increases (3 to 5 bar) and then decreases at 7 bar pressure and again increases at 9 bar pressure. Figure 13c depicted that there was little change in the VMD from 230.5 µm to 232.5 µm when both height and pressure were changed simultaneously in treatments T10 and T18 at a constant speed (6 km h−1).
The results showed that 63% and 37% of experimental data of VMD from all treatments fall in fine and medium size class, respectively (Table 9). This showed that all treatment values are within the recommended range defined by ASABE [48]. The results also showed that the effect of treatments was significant at a 95% confidence interval. The effect of crop block and interaction was insignificant (Table 10). The mean comparison results showed that treatment T2, T3, T4, T6, T8, T11, and T25 means were significantly different at a 95% confidence interval (Table 9).

3.3. Optimization of Spraying Parameters

The spraying parameters (forward speed, spray height, and pressure) were optimized using spray characteristics such as droplet density, coverage percentage, and VMD. The droplet density should be within or more than the recommended range. The recommended droplet density range is 20–30 droplets per cm2 for pre-emergence herbicides and insecticides and 40–70 droplets per cm2 for fungicides and post-emergence herbicides [31,49,50]. To obtain satisfactory results, the coverage percentage should be high or good enough. Nansen et al. [41] reported that the same type of nozzles could not always provide the maximum coverage percentage due to the effect of boom height, traveling speed, application rate, and weather conditions. Additionally, to maximize the coverage percentage, coarse spray nozzles could be selected as some studies suggested. Due to these reasons, the optimization of spraying parameters based on coverage percentage results is difficult. For effective spray, the VMD must be within the fine and medium class as too large a droplet results in reducing deposition, but it provides good coverage, and on the other side, drift is higher for small-sized droplets. The VMD classifications [48] are extremely fine (<60 µm), very fine (61–105 µm), fine (106–235 µm), medium (236–340 µm), coarse (341–403 µm), very coarse (404–502 µm), extremely-coarse (503–665 µm), and ultra-coarse (>665 µm). The most widely used spray classes are the fine and medium size spray classes which are used for the application of herbicides, fungicides, and insecticides [48]. Based on VMD and droplet density results, the optimal spray treatments were T14 (6 km h−1, 55 cm, 5 bar) and T22 (8 km h−1, 55 cm, 3 bar) for applying medium-to-low concentration solution (post-emergence herbicides and fungicides) and high concentration solution (insecticides and pre-emergence herbicides) respectively. The values of spray characteristics at treatments T14 and T22 were 64.7 droplets cm−2, 26.7%, 230 µm, and 39 droplets cm−2, 14.9%, and 219.8 µm, respectively. At both spray treatments, the coverage percentage was also good enough.

3.4. Field Efficiency

The theoretical field capacity was found to be 3.6 ha h−1. The effective field capacity was found to be 2.19 ha h−1. The field efficiency was thus found to be 61% (Table 11).

3.5. Economic Analysis

Economic analysis is the most important parameter to check the feasibility of a machine. The newly developed self-propelled efficient sprayer purchase price was estimated to be $3000, and its useful life is supposed to be ten years for 1500 h per year. The calculations are shown in the table (Table 12).
The spraying cost by using manual labor with a knapsack sprayer was $4 to $5 per hectare in Pakistan per literature and survey report [51].

4. Conclusions

In this study, a crop sprayer was developed and tested for efficient spraying. The spray symmetry, droplet density, coverage percentage, and VMD were evaluated in this research both in the laboratory and in a cotton field. The results concluded that the hollow cone nozzle spray was symmetrical at 2.5 and 3 bar pressure compared to 3.5 and 4 bar pressure as the R2 value was higher than 0.96. The operating parameter such as speed, height, and pressure significantly affected the spray characteristics of the sprayer at a 95% confidence interval. The optimal spray treatments were T14 (6 km h−1, 55 cm, 5 bar) and T22 (8 km h−1, 55 cm, 3 bar) for applying medium-to-low concentration solution (post-emergence herbicides and fungicides) and high concentration solution (insecticides and pre-emergence herbicides), respectively. The spray characteristics at treatments T14 and T22 were 64.7 droplets cm−2, 26.7%, 230 µm, and 39 droplets cm−2, 14.9%, and 219.8 µm respectively. The field efficiency of the sprayer was 61% in the cotton crop at 6 km h−1 forward speed. The spraying cost per unit area was 55–64% less compared to manual labor cost with a knapsack sprayer.
It was concluded that the self-propelled crop sprayer is capable of performing all the spraying needs of small farmers under specific forward speed and sprayer adjustments to ensure the effective application of agrochemicals.

Author Contributions

Conceptualization, A.G. and F.A.K.; Funding acquisition, A.G., F.A.K. and F.K.; Methodology, F.A.K. and F.K.; Supervision, A.G., M.A.K., H.M.N. and M.U.F.; Writing–Original draft, F.A.K. and F.K.; Writing—review and editing, A.G., M.A.K., H.M.N. and M.U.F. All authors have read and agreed to the published version of the manuscript.

Funding

This research was funded by the Higher Education Commission (HEC), Islamabad, grant number NRPU-7583.

Institutional Review Board Statement

Not applicable.

Informed Consent Statement

Not applicable.

Data Availability Statement

Not applicable.

Acknowledgments

The authors would like to thank the Higher Education Commission (HEC), Islamabad, Pakistan, for financial support under the National Research Program of Universities (NRPU) of Pakistan (Project No. NRPU-7583). Also, I would like to thank the University of California, Davis, USA for publication charges.

Conflicts of Interest

The authors declare no conflict of interest.

References

  1. Fan, S.; Chan-Kang, C. Is small beautiful? Farm size, productivity, and poverty in Asian agriculture. Agric. Econ. 2005, 32, 135–146. [Google Scholar] [CrossRef] [Green Version]
  2. Zaidi, S. Issues in Pakistan’s Economy: A Political Economy Perspective, 3rd ed.; Oxford University Press: Oxford, UK, 2015. [Google Scholar]
  3. Phambra, A.M.; Tahir, S.; Imran, M. Small farms and the current structure of farmland holding in Pakistan. Pak. J. Econ. Stud. 2020, 3, 47–64. [Google Scholar]
  4. Chauhan, N.S.; Mohapatra, P.K.J.; Pandey, K.P. Improving energy productivity in paddy production through benchmarking—An application of data envelopment analysis. Energy Conv. Manag. 2006, 47, 1063–1085. [Google Scholar] [CrossRef]
  5. Singh, G. Estimation of a mechanization index and its impact on production and economic factors—A case study in India. Biosyst. Eng. 2006, 93, 99–106. [Google Scholar] [CrossRef]
  6. Bourguet, D.; Guillemand, T. The hidden and external costs of pesticide use. Sustain. Agric. Rev. 2016, 19, 35–120. [Google Scholar]
  7. Yadav, I.C.; Devi, N.L.; Syed, J.H.; Cheng, Z.; Li, J.; Zhang, G.; Jones, K.C. Current status of persistent organic pesticide residues in air, water, and soil, and their possible effect on neighboring countries: A comprehensive review of India. Sci. Total Environ. 2015, 511, 123–137. [Google Scholar] [CrossRef]
  8. Rincon, V.J.; Sánchez-Hermosilla, J.; Páez, F.; Pérez-Alonso, J.; Callejón, A.J. Assessment of the influence of working pressure and application rate on pesticide spray application with a hand-held spray gun on greenhouse pepper crops. Crop Prot. 2017, 96, 7–13. [Google Scholar] [CrossRef]
  9. Braekman, P.; Foque, D.; Messens, W.; Van Labeke, M.C.; Pieters, J.G.; Nuyttens, D. Effect of spray application technique on spray deposition in greenhouse strawberries and tomatoes. Pest Manag. Sci. 2010, 66, 203–212. [Google Scholar] [CrossRef] [PubMed]
  10. Pergher, G.; Gubiani, R.; Tonetto, G. Foliar deposition and pesticide losses from three air-assisted sprayers in a hedgerow vineyard. Crop Prot. 1997, 16, 25–33. [Google Scholar] [CrossRef]
  11. Cunningham, G.P.; Harden, J. Reducing spray volumes applied to mature citrus trees. Crop Prot. 1998, 17, 289–292. [Google Scholar] [CrossRef]
  12. Farooq, M.; Salyani, M. Spray penetration into the citrus tree canopy from two air-carrier sprayers. Trans. ASABE 2002, 45, 1287–1293. [Google Scholar] [CrossRef]
  13. Salyani, M.; Sweeb, R.D.; Farooq, M. Comparison of string and ribbon samplers in orchard spray applications. Trans. ASABE 2006, 49, 1705–1710. [Google Scholar] [CrossRef]
  14. Braekman, P.; Foque, D.; Van Labeke, M.C.; Pieters, J.G.; Nuyttens, D. Influence of spray application technique on spray deposition in Greenhouse Ivy pot plants grown on hanging shelves. HortScience 2009, 44, 1921–1927. [Google Scholar] [CrossRef] [Green Version]
  15. Nuyttens, D.; Windey, S.; Sonck, B. Optimization of a vertical spray boom for greenhouse spray applications. Biosyst. Eng. 2004, 89, 417–423. [Google Scholar] [CrossRef]
  16. Nuyttens, D.; Windey, S.; Sonck, B. Comparison of operator exposure for five different greenhouse spraying applications. J. Agric. Saf. Health 2004, 10, 187–195. [Google Scholar] [CrossRef] [PubMed]
  17. Nuyttens, D.; Braekman, P.; Windey, S.; Sonck, B. Potential dermal pesticide exposure affected by greenhouse spray application technique. Pest Manag. Sci. 2009, 65, 781–790. [Google Scholar] [CrossRef]
  18. Chen, Y.; Mao, E.; Li, W.; Zhang, S.; Song, Z.; Yang, S.; Chen, J. Design and experiment of a high-clearance self-propelled sprayer chassis. Int. J. Agric. Biol. Eng. 2020, 13, 71–80. [Google Scholar] [CrossRef]
  19. Qiu, W.; Li, X.L.; Li, C.C.; Ding, W.M.; Lv, X.L.; Liu, Y.D. Design and test of a novel crawler-type multi-channel air-assisted orchard sprayer. Int. J. Agric. Biol. Eng. 2020, 13, 60–67. [Google Scholar] [CrossRef]
  20. Ma, C.; Li, G.; Peng, Q. Design and Test of a Jet Remote Control Spraying Machine for Orchards. AgriEngineering 2021, 3, 797–814. [Google Scholar] [CrossRef]
  21. Cai, J.C.; Wang, X.; Gao, Y.Y.; Yang, S.; Zhao, C.J. Design and performance evaluation of a variable-rate orchard sprayer based on a laser-scanning sensor. Int. J. Agric. Biol. Eng. 2019, 12, 51–57. [Google Scholar] [CrossRef]
  22. Penido, E.C.C.; Teixeira, M.M.; Fernandes, H.C.; Monteiro, P.B.; Cecon, P.R. Development, and evaluation of a remotely controlled and monitored self-propelled sprayer in tomato crops. Rev. Cienc. Agron. 2019, 50, 8–17. [Google Scholar] [CrossRef]
  23. Teejet®. A User’s Guide to Spray Nozzles; Teejet Technologies: Glendale Heights, IL, USA, 2013; 60p, Available online: https://www.teejet.com/CMSImages/TEEJET/documents/bulletins/spray-application/LI-TJ178_a-users-guide-to-spray-nozzles.pdf (accessed on 30 December 2013).
  24. Teejet®. Spray Nozzles. Teejet Technologies. Available online: https://www.teejet.com/spray_application/nozzles.aspx (accessed on 30 December 2018).
  25. Sanchez-Hermosilla, J.; Paez, F.; Rincon, V.J.; Carvajal, F. Evaluation of the effect of spray pressure in hand-held sprayers in a greenhouse tomato crop. Crop Prot. 2013, 54, 121–125. [Google Scholar] [CrossRef]
  26. Rehman, T.; Khan, M.U.; Tayyab, M.; Akram, M.W.; Faheem, M. Current status and overview of farm mechanization in Pakistan—A review. Agric. Eng. Int. 2016, 18, 83–93. [Google Scholar]
  27. Matthews, G.A. Attitudes, and behaviours regarding use of crop protection products—A survey of more than 8500 smallholders in 26 countries. Crop Prot. 2008, 27, 834–846. [Google Scholar] [CrossRef]
  28. Sanchez-Hermosilla, J.; Rincon, V.J.; Paez, F.; Fernandez, M. Comparative spray deposits by manually pulled trolley sprayer and spray gun in greenhouse tomato crops. Crop Prot. 2012, 31, 119–124. [Google Scholar] [CrossRef]
  29. Sangale, K.A.; Shinde, D.D. Design of hydraulic power transmission system of a heavy-duty vehicle. Int. Adv. Res. J. Sci. Eng. Technol. 2016, 3, 79–81. [Google Scholar]
  30. Engineering ToolBox. Rolling Resistance. 2008. Available online: https://www.engineeringtoolbox.com/rolling-friction-resistance-d_1303.html (accessed on 30 December 2008).
  31. Zhu, H.; Salyani, M.; Fox, R.D. A portable scanning system for evaluation of spray deposit distribution. Comput. Electron. Agric. 2011, 76, 38–43. [Google Scholar] [CrossRef]
  32. Hoffmann, W.C.; Hewitt, A.J. Comparison of three imaging systems for water-sensitive papers. Appl. Eng. Agric. 2005, 21, 961–964. [Google Scholar] [CrossRef]
  33. Wang, G.; Lan, Y.; Qi, H.; Chen, P.; Hewitt, A.; Han, Y. Field evaluation of an unmanned aerial vehicle (UAV) sprayer: Effect of spray volume on deposition and the control of pests and disease in wheat. Pest Manag. Sci. 2019, 75, 1546–1555. [Google Scholar] [CrossRef] [PubMed]
  34. Fernandes, A.P.; Parreira, R.S.; Ferreira, M.C.; Romani, G.N. Characterization of the deposition profile and droplet diameter and optimization of spacing between nozzles in the spray boom. Agric. Eng. 2007, 27, 728–733. [Google Scholar]
  35. Ferreira, M.C.; Costa, G.M.; Silva, A.R.; Tagliari, S.R.A. Qualitative factors of the hydraulic power tip ADGA-110015 for agricultural spraying. Agric. Eng. 2007, 27, 471–478. [Google Scholar]
  36. Roman, R.A.A.; Ferreira, M.C.; Carvalho, G.F.G.; Baggio, M.V. Spraying distribution, symmetry of fan, and droplet size of spray nozzles TF-VS2. Planta Daninha 2010, 28, 897–905. [Google Scholar]
  37. National Association of State Departments of Agriculture. National Pesticide Applicator Certification Core Manual, 2nd ed.; National Association of State Departments of Agriculture: Washington, DC, USA, 2014.
  38. Carroll, J. The Effects of Sprayer Speed and Droplet Size on Herbicide Burndown Efficacy. Master’s Thesis, University of Arkansas, Fayetteville, AR, USA, 2017. Available online: https://scholarworks.uark.edu/etd/2435/ (accessed on 1 September 2021).
  39. Khan, F.A.; Ghafoor, A.; Khan, M.A.; Chattha, U.M.; Kouhanestani, F.K. Parameter Optimization of Newly Developed Self-Propelled Variable Height Crop Sprayer Using Response Surface Methodology (RSM) Approach. Agriculture 2022, 12, 408. [Google Scholar] [CrossRef]
  40. Sayinci, B.; Demir, B.; Acik, N. Comparison of spray nozzles in terms of spray coverage and drop distribution at low volume. Turk. J. Agric. For. 2020, 44, 262–270. [Google Scholar] [CrossRef]
  41. Ferguson, J.C.; Chechetto, R.G.; Hewitt, A.J.; Chauhan, B.S.; Adkins, S.W.; Kruger, G.R.; O’Donnell, C.C. Assessing the deposition and canopy penetration of nozzles with different spray qualities in an oat (Avena sativa L.) canopy. Crop Prot. 2016, 81, 14–19. [Google Scholar] [CrossRef] [Green Version]
  42. Koszel, M. Influence of fan flat nozzles wears degree on drop tracks size. Res. Agric. Eng. 2009, 55, 39–44. [Google Scholar] [CrossRef] [Green Version]
  43. Nansen, C.; Ferguson, J.C.; Moore, J.; Groves, L.; Emery, R.; Garel, N.; Hewitt, A. Optimizing pesticide spray coverage using a novel web and smartphone tool, snap card. Agron. Sustain. Dev. 2015, 35, 1075–1085. [Google Scholar] [CrossRef]
  44. Ranta, O.; Marian, O.; Muntean, M.V.; Molnar, A.; Ghețe, A.; Crisan, V.; Stanila, S.; Rittner, T. Quality Analysis of Some Spray Parameters When Performing Treatments in Vineyards in Order to Reduce Environment Pollution. Sustainability 2021, 13, 7780. [Google Scholar] [CrossRef]
  45. TeeJet Technologies. Spray Application: Overview. Available online: https://www.teejet.com/CMSImages/TEEJET/documents/catalogs/cat51a_us.pdf (accessed on 30 December 2014).
  46. Shirwal, S.; Veerangouda, M.; Palled, V.; Sushilendra; Hosamani, A.; Krishnamurthy, D. Studies on Operational Parameters of Different Spray Nozzles. Int. J. Curr. Microbiol. Appl. Sci. 2020, 9, 1267–1281. [Google Scholar] [CrossRef]
  47. Azizpanah, A.; Rajabipour, A.; Alimardani, R.; Kheiralipour, K.; Ghamari, B.; Mohammadi, V. Design, construction, and evaluation of a sprayer drift measurement system. Agric. Eng. Int. 2015, 17, 138–146. [Google Scholar]
  48. ASABE S572.1; Spray Nozzle Classification by Droplet Spectra. American Society of Agricultural and Biological Engineers: St. Joseph, MI, USA, 2009; 3p.
  49. Wang, G.; Lan, Y.; Yuan, H.; Qi, H.; Chen, P.; Ouyang, F.; Han, Y. Comparison of Spray Deposition, Control Efficacy on Wheat Aphids and Working Efficiency in the Wheat Field of the Unmanned Aerial Vehicle with Boom Sprayer and Two Conventional Knapsack Sprayers. Appl. Sci. 2019, 9, 218. [Google Scholar] [CrossRef] [Green Version]
  50. Water-Sensitive Paper Check Your Spray Coverage. Available online: https://www.syngenta.com.au/awri (accessed on 19 April 2021).
  51. Ahmad, D.; Afzal, M. Estimating the economic perspective of cotton crop in southern Punjab of Pakistan. Int. J. Adv. Appl. Sci. 2018, 5, 50–55. [Google Scholar] [CrossRef]
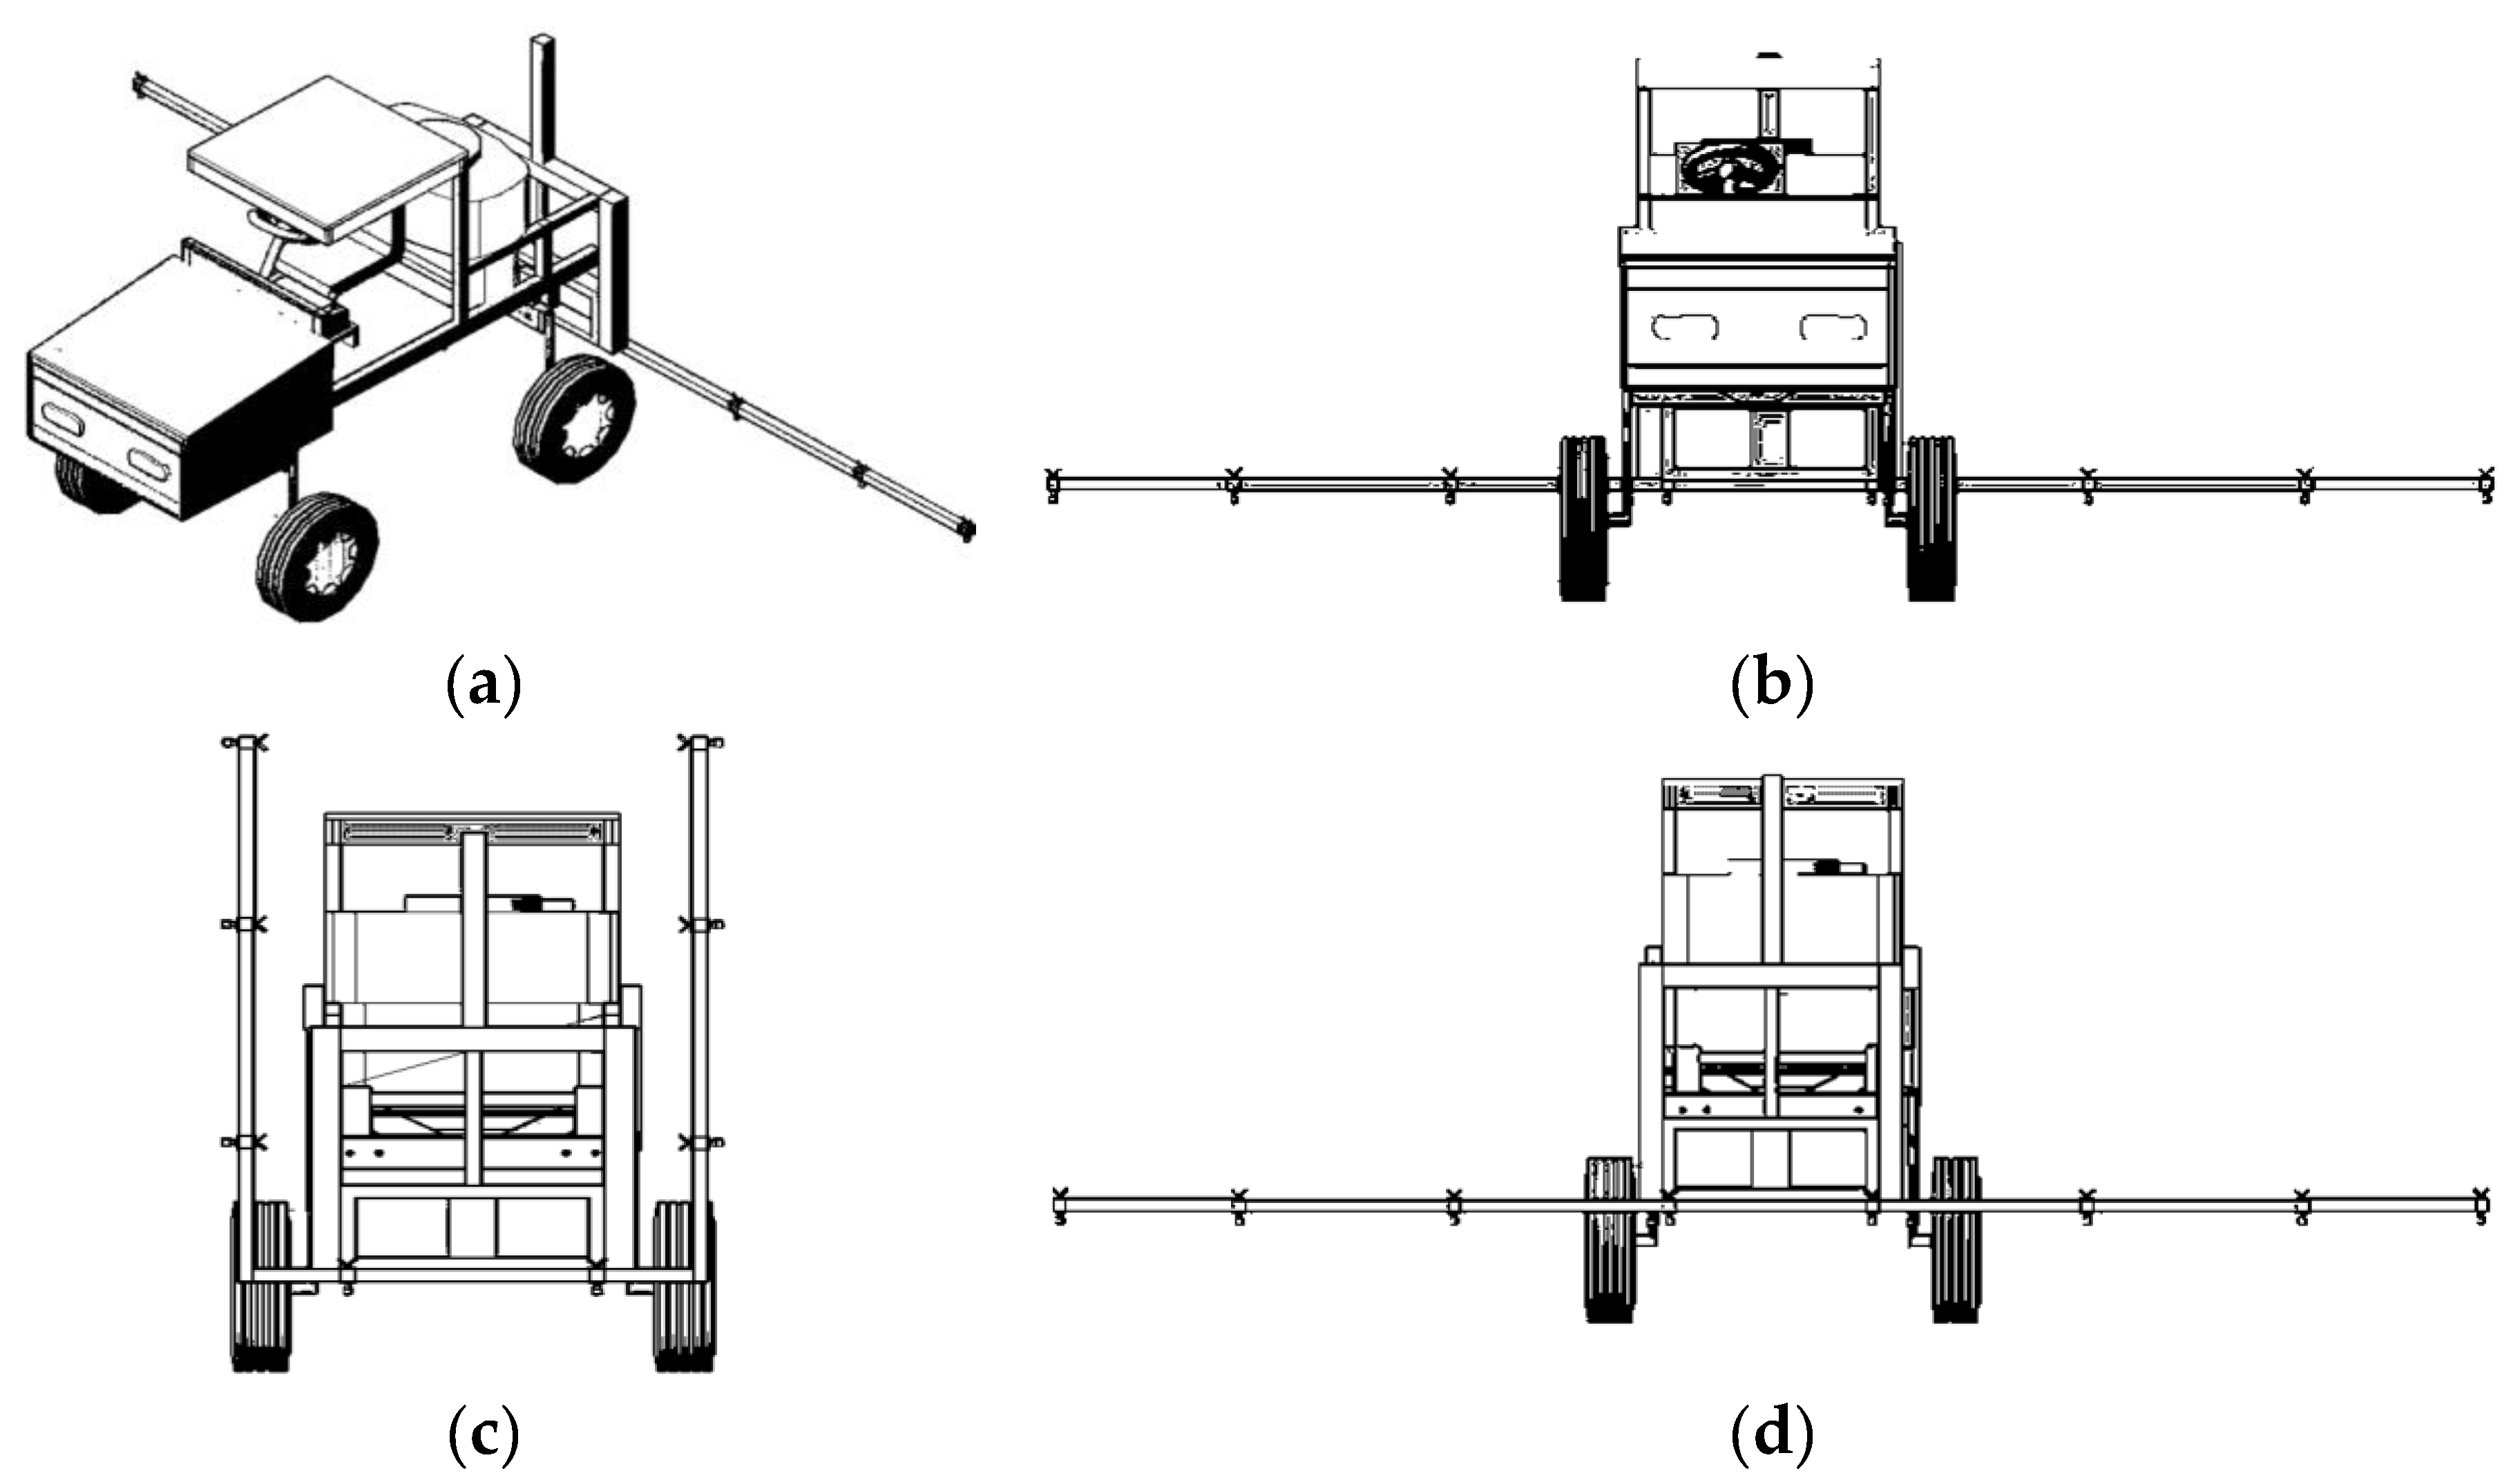
Figure 1. Self-propelled crop sprayer, (a) Isometric view, (b) Isometric front view, (c) Isometric back view with a vertical boom, (d) Isometric back view with a horizontal boom.
Sustainability 14 09204 g001
Figure 2. Self-propelled crop sprayer, (a) actual view of the sprayer, (b) spray pump, (c) filter, and (d) hydraulic system.
Sustainability 14 09204 g002
Figure 3. Spraying mechanism.
Sustainability 14 09204 g003
Figure 4. Schematic diagram of Ackermann geometry. (O is the reference point, R is the minimum turning radius, L is the wheelbase, W is the track width, a 2 is the distance from the center of the sprayer to the rear axle, δ o is the outer wheel angle, and δ i is the inner wheel angle).
Sustainability 14 09204 g004
Figure 5. Laboratory testing of a nozzle on the spray test bench, (a) hollow cone nozzle, and (b) spray test bench.
Sustainability 14 09204 g005
Figure 6. Field testing of sprayer in cotton crop, (a) sprayer performing task in a cotton field, (b) placement of water-sensitive paper in the field, and (c) spray application on water-sensitive paper.
Sustainability 14 09204 g006
Figure 7. (a) Experimental layout, (b) experimental plan for each plot.
Sustainability 14 09204 g007
Figure 8. Residual analysis of data, (a) normality plot of residuals for droplet density, (b) normality plot of residuals for coverage percentage, and (c) normality plot of residuals for VMD.
Sustainability 14 09204 g008
Figure 9. Spray pattern at different pressures.
Sustainability 14 09204 g009
Figure 10. Spray symmetry of hollow cone nozzle, (a) spray symmetry at 2.5 bar pressure, (b) spray symmetry at 3 bar pressure, (c) spray symmetry at 3.5 bar pressure, and (d) spray symmetry at 4 bar pressure.
Sustainability 14 09204 g010
Figure 11. Droplet density of the sprayer (a) speed and height Interaction at a pressure of 5 bar; (b) speed and pressure Interaction at a height of 55 cm; (c) spray height and pressure Interaction at a speed of 6 km h−1.
Sustainability 14 09204 g011
Figure 12. Coverage percentage of the sprayer (a) speed and height interaction at a pressure of 5 bar; (b) speed and pressure interaction at a height of 55 cm; (c) spray height and pressure interaction at a speed of 6 km h−1.
Sustainability 14 09204 g012
Figure 13. VMD of the sprayer (a) speed and height interaction at a pressure of 5 bar; (b) speed and pressure interaction at a height of 55 cm; (c) spray height and pressure interaction at a speed of 6 km h−1.
Sustainability 14 09204 g013
Table 1. Self-propelled sprayer specifications.
ItemsSpecificationsDetailed Specifications
StructureSelf-propelled
Overall frame sizes2845 × 1017 × 2440 mmMild steel, material grade SAE 4130
Machine weight1090 kg
Wheelbase1753 mm
Ground clearance762–915 mm
Track width1676 mm
Turning modeRack & pinion steering
Minimum turning radius3056 mm
Nozzle height from the ground458–1220 mm
Engine power20 hpModel 2105D, 2-cylinder, closed water cooling, straight-line four-stroke, speed 1500 rpm
Driving modeAutomatic gear shift
TireFour tireTire pressure 2 bar
Liquid tank300 LPolyethylene (PE)
NozzleHollow coneASJ (HC8002),
size 15 × 7 mm, spray angle 80°
Hydraulic systemTypeDC power pack
Motor12-V
Power1600 W
Pump typeGear pump
Reservoir capacity8 L
Max flow rate5.6 L min−1
Max Pressure176 bar
Hydraulic cylinder length1220 mm
Spray boomLifting modeHydraulic drive
Folding modeManual drive
Spray boom6096 mm
Spray pumpTypeDiaphragm pumpModel-BYT-7A111, Volt-12 V
Pressure24 bar
Flow rate22 L min−1
Table 2. Treatment for experiment.
Trt. No.Treatment AbbreviationTreatment Variables
Forward Speed (km h−1)Spray Height (cm)Spray Pressure (bar)
T1S1H1P14403
T2S1H1P24405
T3S1H1P34407
T4S1H2P14553
T5S1H2P24555
T6S1H2P34557
T7S1H3P14703
T8S1H3P24705
T9S1H3P34707
T10S2H1P16403
T11S2H1P26405
T12S2H1P36407
T13S2H2P16553
T14S2H2P26555
T15S2H2P36557
T16S2H3P16703
T17S2H3P26705
T18S2H3P36707
T19S3H1P18403
T20S3H1P28405
T21S3H1P38407
T22S3H2P18553
T23S3H2P28555
T24S3H2P38557
T25S3H3P18703
T26S3H3P28705
T27S3H3P38707
Table 3. Levene’s Test.
Response VariablesSource of VarianceSSdfMSFp
Droplet densityBetween groups0.8420.420.0040.10 *
CoverageBetween groups7.3323.650.1010.90
VMDBetween groups1.5220.760.020.979
* Equality of variance as p-value > 0.05.
Table 4. Kolmogorov-Smirnov test.
Response VariablesKolmogorov-Smirnova
StatisticdfSig.
Droplet Density0.100324<0.001 *
Coverage Percentage0.077324<0.001
VMD0.098324<0.001
* Normal distribution of data as p < 0.05.
Table 5. Droplet density of sprayer at different spray treatments.
Treatment No.Treatment AbbreviationDroplet Density (Droplets cm−2)
T1S1H1P185.6 ± 3.76 c
T2S1H1P288.6 ± 3.53 b
T3S1H1P397.4 ± 3.21 a
T4S1H2P180.9 ± 3.09 e
T5S1H2P284.9 ± 2.97 cd
T6S1H2P387 ± 3.22 bc
T7S1H3P169 ± 3.43 h
T8S1H3P278.3 ± 3.55 f
T9S1H3P382.8 ± 2.89 de
T10S2H1P170.7 ± 3.18 gh
T11S2H1P281.5 ± 3.25 e
T12S2H1P387.4 ± 3.68 bc
T13S2H2P156 ± 3.98 k
T14S2H2P264.7 ± 3.61 i
T15S2H2P373 ± 3.34 g
T16S2H3P151.3 ± 2.87 l
T17S2H3P260.6 ± 3.48 j
T18S2H3P369.2 ± 3.87 h
T19S3H1P142.8 ± 3.59 n
T20S3H1P260 ± 2.99 j
T21S3H1P368.7 ± 3.23 h
T22S3H2P139 ± 3.56 o
T23S3H2P248 ± 3.82 m
T24S3H2P354.2 ± 3.46 k
T25S3H3P131.3 ± 3.71 p
T26S3H3P243.5 ± 3.83 n
T27S3H3P348.4 ± 3.97 m
(Similar letter indicates that means are not significantly different from one another at a 95% confidence interval using Duncan’s test).
Table 6. Analysis of variance (ANOVA) for droplet density.
Source of VarianceSSdfMSFp-ValueFcritResults
Treatment98,984.22263807396.9 2.8 × 10 183 1.54Significant *
Crop block50.083522252.60.0755593.03Not significant
Treatment × Crop block296.8031525.700.60.98671.39Not significant
Error2331.0382439.60
Total101,662.1323
* significant as p-value < 0.05.
Table 7. Coverage percentage of sprayer at different spray treatments.
Treatment No.Treatment AbbreviationCoverage Percentage
T1S1H1P143.9 ± 1.63 c
T2S1H1P247.3 ± 1.59 b
T3S1H1P355.9 ± 1.47 a
T4S1H2P139.1 ± 1.65 f
T5S1H2P241.6 ± 1.73 de
T6S1H2P343.2 ± 1.41 cd
T7S1H3P131.9 ± 1.53 h
T8S1H3P237 ± 1.92 g
T9S1H3P340.6 ± 1.88 ef
T10S2H1P129.5 ± 1.67 ij
T11S2H1P239.4 ± 1.39 f
T12S2H1P343.6 ± 1.55 c
T13S2H2P122.5 ± 1.46 m
T14S2H2P226.7 ± 1.75 k
T15S2H2P331.1 ± 1.38 hi
T16S2H3P121 ± 1.53 mn
T17S2H3P225 ± 1.89 kl
T18S2H3P329.5 ± 1.78 ij
T19S3H1P117.2 ± 1.32 o
T20S3H1P224.5 ± 1.43 l
T21S3H1P329.1 ± 1.49 j
T22S3H2P114.9 ± 1.72 p
T23S3H2P219.8 ± 1.65 n
T24S3H2P322.5 ± 1.82 m
T25S3H3P113.1 ± 1.52 p
T26S3H3P217.2 ± 1.73 o
T27S3H3P320 ± 1.40 n
(Similar letter indicates that means are not significantly different from one another at a 95% confidence interval using Duncan’s test).
Table 8. Analysis of variance (ANOVA) for coverage percentage.
Source of VarianceSSdfMSFp-ValueFcritResults
Treatment39,590.12261522.7290.8 2.4 × 10 167 1.54Significant *
Crop block21.48969210.72.050.1306933.03Not significant
Treatment × Crop block176.1436523.40.640.9692851.39Not significant
Error1272.3932435.2
Total41,060.15323
* significant as p-value < 0.05.
Table 9. VMD of sprayer at different spray treatments.
Treatment No.Treatment AbbreviationVMD (µm)
T1S1H1P1245 ± 2.54 f
T2S1H1P2254.2 ± 2.21 b
T3S1H1P3261.4 ± 2.32 a
T4S1H2P1241.5 ± 2.45 h
T5S1H2P2246.3 ± 2.16 de
T6S1H2P3249.9 ± 1.97 c
T7S1H3P1234.5 ± 2.28 j
T8S1H3P2243.2 ± 2.34 g
T9S1H3P3245.3 ± 2.53 ef
T10S2H1P1230.5 ± 2.03 lm
T11S2H1P2239.8 ± 2.11 i
T12S2H1P3246.9 ± 1.98 d
T13S2H2P1226.2 ± 2.46 n
T14S2H2P2230 ± 2.37 m
T15S2H2P3235 ± 2.42 j
T16S2H3P1224.9 ± 2.51 op
T17S2H3P2230.7 ± 2.39 lm
T18S2H3P3232.5 ± 2.27 k
T19S3H1P1221 ± 2.13 r
T20S3H1P2225.7 ± 2.05 no
T21S3H1P3231.4 ± 2.27 kl
T22S3H2P1219.8 ± 2.21 r
T23S3H2P2223.4 ± 2.47 q
T24S3H2P3226.5 ± 2.31 n
T25S3H3P1217.1 ± 2.56 s
T26S3H3P2220.7 ± 2.09 r
T27S3H3P3223.8 ± 2.23 pq
(Similar letter indicates that means are not significantly different from one another at a 95% confidence interval using Duncan’s test).
Table 10. Analysis of variance (ANOVA) for VMD.
Source of VarianceSSdfMSFp-ValueFcritResults
Treatment42,168.6261621.9900.74 9 × 10 222 1.54Significant *
Crop block2.7785821.3890.770.46343.03Not significant
Treatment × Crop block107.4631522.0661.140.24431.39Not significant
Error437.54252431.800
Total42,716.38323
* significant as p-value < 0.05.
Table 11. Field efficiency of sprayer.
Tank CapacitySpray Area (Mean ± SE *)Spray Time (Mean ± SE *)Effective Field CapacityField Efficiency
(L)(ha)(h)(ha h−1)(%)
3000.90 ± 0.060.41 ± 0.032.1961
* SE = Standard error.
Table 12. Economic analysis.
Fixed Cost
Depreciation$300 per year
Interest @ 12%$360 per year
Fixed cost$660 per year
Annual spray area assumed
Total Fixed cost per hectare
3285 hectares per year
$660/3285 = $0.20 ha−1
Variable cost
Repair and Maintenance @ 15%$450 per year
Driver charges @ $7.5/8 h/day$1400 per year
Fuel Charges @ $0.70/liter$3416 per year
Variable cost$5266 per year
Annual spray area assumed3285 hectares per year
Total variable cost$5266/3285 = $1.60 ha−1
Total spraying cost
Total spraying cost (Fixed + Variable)$0.20 + $1.60/ha = $1.80 ha−1
Publisher’s Note: MDPI stays neutral with regard to jurisdictional claims in published maps and institutional affiliations.