Review

Integration of Solar Photovoltaic Systems into Power Networks: A Scientific Evolution Analysis

1
Departament d’Enginyeria Mecànica, Universitat Rovira i Virgili, Av. Paisos Catalans 26, 43007 Tarragona, Spain
2
Departament d’Enginyeria Química, Universitat Rovira i Virgili, Av. Paisos Catalans 26, 43007 Tarragona, Spain
*
Author to whom correspondence should be addressed.
Sustainability 2022, 14(15), 9249; https://doi.org/10.3390/su14159249
Submission received: 15 June 2022 / Revised: 25 July 2022 / Accepted: 26 July 2022 / Published: 28 July 2022

Abstract

:
Solar photovoltaic (PV) systems have drawn significant attention over the last decade. One of the most critical obstacles that must be overcome is distributed energy generation. This paper presents a comprehensive quantitative bibliometric study to identify the new trends and call attention to the evolution within the research landscape concerning the integration of solar PV in power networks. The research is based on 7146 documents that were authored between 2000–2021 and downloaded from the Web of Science database. Using an in-house bibliometric tool, Bibliometrix R-package, and the open-source tool VOSviewer we obtained bibliometric indicators, mapped the network analysis, and performed a multivariate statistical analysis. The works that were based on solar photovoltaics into power networks presented rapid growth, especially in India. The co-occurrence analysis showed that the five main clusters, classified according to dimensions and significance, are (i) power quality issues that are caused by the solar photovoltaic penetration in power networks; (ii) algorithms for energy storage, demand response, and energy management in the smart grid; (iii) optimization, techno-economic analysis, sensitivity analysis, and energy cost analysis for an optimal hybrid power system; (iv) renewable energy integration, self-consumption, energy efficiency, and sustainable development; and (v) modeling, simulation, and control of battery energy storage systems. The results revealed that researchers pay close attention to “renewable energy”, “microgrid”, “energy storage”, “optimization”, and “smart grid”, as the top five keywords in the past four years. The results also suggested that (i) power quality; (ii) voltage and frequency fluctuation problems; (iii) optimal design and energy management; and (iv) technical-economic analysis, are the most recent investigative foci that might be appraised as having the most budding research prospects.

1. Introduction

With global energy demand on the rise [1], the utilization of renewable energy is increasing continuously, although at a slower rate than the energy consumption. Renewable energy sources (RESs) strive to improve their technical and economic integration into power networks.
For the last two decades, there has been a big effort to integrate RESs into the energy and electricity mix, both to provide energy security within the context of energy transition policies and to address the impacts of climate change. Among all the various RESs, solar energy is commonly used for generating clean electricity and reducing greenhouse gas emissions [2]. Solar photovoltaic (PV) in particular, is currently regarded as the most essential and promising renewable energy technology [1]. In order to make solar PV more efficient, a grid-connected PV system is required and has become the most popular solar PV application [3]. It provides long-term cost reductions, a reliable system with low maintenance requirements, and fast technological progress [4].
Grid-connected PV installations are growing exponentially at the global level, as illustrated in Figure 1. Solar PV had another record-breaking year in 2020, with new installations comprising an estimated 126 GigaWatts (GW); this brought the worldwide total to an estimated 705 GW in terms of on-grid capacity [5], and the number is growing steadily. According to the International Renewable Energy Agency [6], the total number of installations will rise to 2840 GW by 2030 and 8519 GW by 2050. PV installations have historically outperformed expectations.
Due to its randomness and intermittent nature, the integration of RESs in power networks will present various challenges. The higher the penetration level of grid-connected PV systems in the medium voltage network, the more stability and reliability issues will arise [7,8,9]. In addition, with high PV penetration, more harmonics are injected into the system, leading to an increase in the total harmonic distortion (THD) [10]. Studies have also been conducted on the impacts of PV penetration in power networks; the most affected system parameters are voltage and frequency stability, notably at penetration levels above 20% [11,12,13,14,15].
Furthermore, high PV penetration may create a reverse power flow in the network when PV power exceeds the demand [16]. Reverse power flow can create grid instabilities, including frequency and voltage level variations, by allowing more power to flow from the distribution to the transmission system. Due to the continuous increase in PV installations [17,18], new control strategies for the convenient operation and management of new power grids that are integrated with PV systems will be required.
Several studies within the scientific literature have contributed to identifying the main findings in different research fields. Essentially, the reviews concentrated on summarizing the key results based on an extensive search of the current literature. Another complementary approach is a bibliometric analysis, and its primary focus is based on extracting the most noteworthy data from scientific databases such as the Web of Science (WoS) or Scopus [19,20].
Many review papers deal exclusively with solar PV integration such as, Hudson and Heilscher [21] who presented the issues and utility concerns of the system management for PV grid integration. In other investigations, an overview of solar PV integration into power networks has been discussed [22,23,24]. A comprehensive review of PV inverters on grid-connected PV applications is given in [25,26,27,28,29]. Haque and Wolfs [30], and Karimi et al. [31] provide a detailed study of the technical impacts of the high PV penetrations in the power networks.
Several bibliometric studies have been conducted, such as solar energy technologies [4,32], solar energy management [33], thermal energy storage [34,35,36], concentrating solar power development [37], solar cooling [38,39], and solar pumping irrigation. The last ten-year period has witnessed a yearly increase in the number of studies concerning the integration of solar PV into power networks. Nonetheless, to the authors’ best knowledge, there are no studies that have been published to date that assess the scientific evolution of the literature quantitatively and qualitatively, referring to the theory and practice of integrating solar PV systems into power networks from a bibliometric perspective, which is our main objective and motivation for carrying out this work.
Based on this literature gap, we formulated the following research question, which guided the construction of this article: How does the bibliometric analysis regarding the integration of solar PV systems into power networks help to create and explore future research?
This study attempts to fill this gap and aims to determine the characteristics of the worldwide literature regarding the integration of solar PV systems into power networks within the field of interest by analyzing the scientific works that were published in WoS from 2000 to 2021. The following are the main expected contributions of this study: (i) summarize the status quo of the global research on the integration of solar PV power plants into power networks; (ii) identify and analyze the scientific publication growth, the most influential authors, institutions, countries, journals, and the degree of existing academic collaboration between researchers, institutions, and countries; and (iii) provide scientific mapping, which includes: word clustering, frequency, and co-occurrence analysis of keywords, which was used to examine the intellectual structure, emerging and hot research lines, as well as a historical trend. Therefore, this work’s results have the potential to benefit the larger academic community by drawing attention to the gaps and revealing opportunities and a roadmap for possible future research that may be performed to improve the knowledge [29,40]. The structure of the paper is organized as follows: After this introduction section, the materials and methods are described in Section 2, including data source and data processing. Section 3 presents the results and discussions, and finally, Section 4 summarizes the main conclusions and highlights the gaps, hot topics, and future trends.

2. Materials and Methods

A scientific evolution analysis is a systematic approach that uses statistical tools to examine scientific publications and the variety of documentation types they represent (quantitative analysis of publications) [41,42].
The traditional method for researching and analyzing scientific literature is to conduct an in-depth analysis of the corresponding literature using a structured literature review. This strategy has significant drawbacks. It takes time and the number of publications that can be analyzed is limited. Compared to the traditional review approach, the bibliometric study presents the trending one. It is advantageous in subjects with vast volumes of literature that are difficult to summarize by employing traditional review methods [35,43].
Bibliometrics is a collection of methodologies for analyzing bibliometric parameters and document systems as a research object [32,44], and it is an effective tool for dealing with hundreds, even thousands of publications, of related literature. It permits measuring the provided scientific production in a given region and a specific period [45,46,47,48].
The main three indicators of productivity are impact (measuring how productive the units are on other units), the integration of productivity, and its impact using several bibliometric indicators. Some examples of bibliometric indicators are the following: publication and citation count, the cites per paper, and citation thresholds [49]; the h-index [50,51]; the g-index [52]; and the m-quotient [53]. Any of these indexes have their own advantages and, therefore, can be used to complement each other [54]. The most commonly used metrics are the number of publications, citation count, and h-index (defined as the number of publications of an author/journal that has received at least h-times citation).
There are several indicators as mentioned above together with the average number of citations, the division of the h one by the same scientific number gives insights into the duration of each scientist’s career [53,55]. The reader is also referred to Norouzi et al. [56] to see a brief explanation of each index.
The methodology that was employed in the present study is based on a similar approach, as the ones that are proposed by Aria and Cuccurullo [57], and Zupic and Čater [54]. An approach with five phases, as shown in Figure 2, includes (i) conceptualization of research, (ii) collection of bibliometric data, (iii) analysis of the collected data, (iv) visualization, and (v) interpretation.

2.1. Database Selection

The first step of the methodology, as presented in Figure 2, is the research topic definition, which is followed by the data selection as the second step. Web of Science and Scopus are two of the most important citation databases. The Scopus database uses three main evaluation indicators: Source Normalized Impact per Paper (SNIP), Impact per Publication (IPP), and SCImago Journal Rank (SJR), while the WoS database uses two main evaluation indicators: impact factor (IF) and 5-year IF. Furthermore, the WoS database contains SCI and SSCI documents. It includes more than 8700 core academic journals that have the most influence in various fields [58]. Moreover, the WoS database was used similarly to the previous bibliometric study analyses that showed the WoS database contains widely accepted high-quality data in various disciplines [59,60]. Considering the features of the WoS database, this study employs WoS as a database for examining the literature on the topic that was analyzed.

2.2. Search Query

The search query is one of the most important stages and significantly influences the study results. Therefore, to obtain the most consistent results concerning the central topic of this study, the authors defined all keywords that describe the topic adequately. Secondly, wildcards are also used to map different combinations of characters in the composition of the query (e.g., “Photovoltaic*”). An extensive collection of keywords is identified by applying expert-driven semantically-related terms [61].
Equation (1). Search query used in WoS database.
TS = T S 1   A N D   T S 2   A N D   T S 3   A N D   T S 4   O R   T S 5  
To define the logic of the query, the first part of it (TSA = TS1 + TS2 + TS3), is used to capture topics that are related to RES, especially the solar PV ones. The second component (TSB = TS4) aims to collect topics that are related to the integration of PV plants into power networks. The third part (TSC = TS5), is to capture energy storage technologies. The complete list of terms that were used in the search query (TS) can be consulted in Appendix A.
In data cleaning, non-relevant categories (i.e., biology, medicine, etc.) were removed from the results. Additionally, an exhaustive effort was made to verify the congruence of the findings by means of skimming the titles and abstracts.

2.3. Research Tools

In this study, the Bibliometrix R package [54] was used to carry out the bibliometric citation analysis and comprehensive scientific mapping analysis. Moreover, VOSviewer, a free software package that was developed by Van Eck and Waltman [62] was employed to create and visualize the citation density networks and collaboration networks for scientific publications, authors, journals, countries, institutions, and keywords [63].
In addition to the Bibliometrix R package and the VOSviewer software, an in-house bibliometric tool was used to carry out the following tasks: Firstly, the repetitive terms that are written in different ways (such as singular and plural forms, abbreviations) were standardized, and merged. For example, “Photovoltaic”, “Photovoltaics”, “Solar PV”, and “PV”, were merged into “Photovoltaic”. Secondly, the authors’ keywords are visualized in Figure 9 using an R programming in-house tool to see the research content evolution in the topic analyzed.

3. Results

In this bibliometric study, the WoS Core Collection database for the period 2000–2021 was employed to extract data, the language was selected as “English”, and the document type was limited to scientific articles, proceeding papers, and reviews. The search query in Equation (1) was used for the topic field. The data were collected on the 14th of July 2021. The following subsections present and discuss the findings of this study.

3.1. General Trends

The search criteria that was used in this bibliometric study summarized a total of 7146 documents that were published between 2000 and 2021. The publications were retrieved from 2074 scientific journals. The most frequently used document type was “Article”, which accounted for 49.9% (3566 records) of total publications, followed by “Proceeding papers” with 44.4% (3174 records), and followed far behind by “Review” with 5.7% (406 records). The keyword plus, author’s keywords, average citations per document, collaboration index, and annual growth rate are also provided in Table 1.
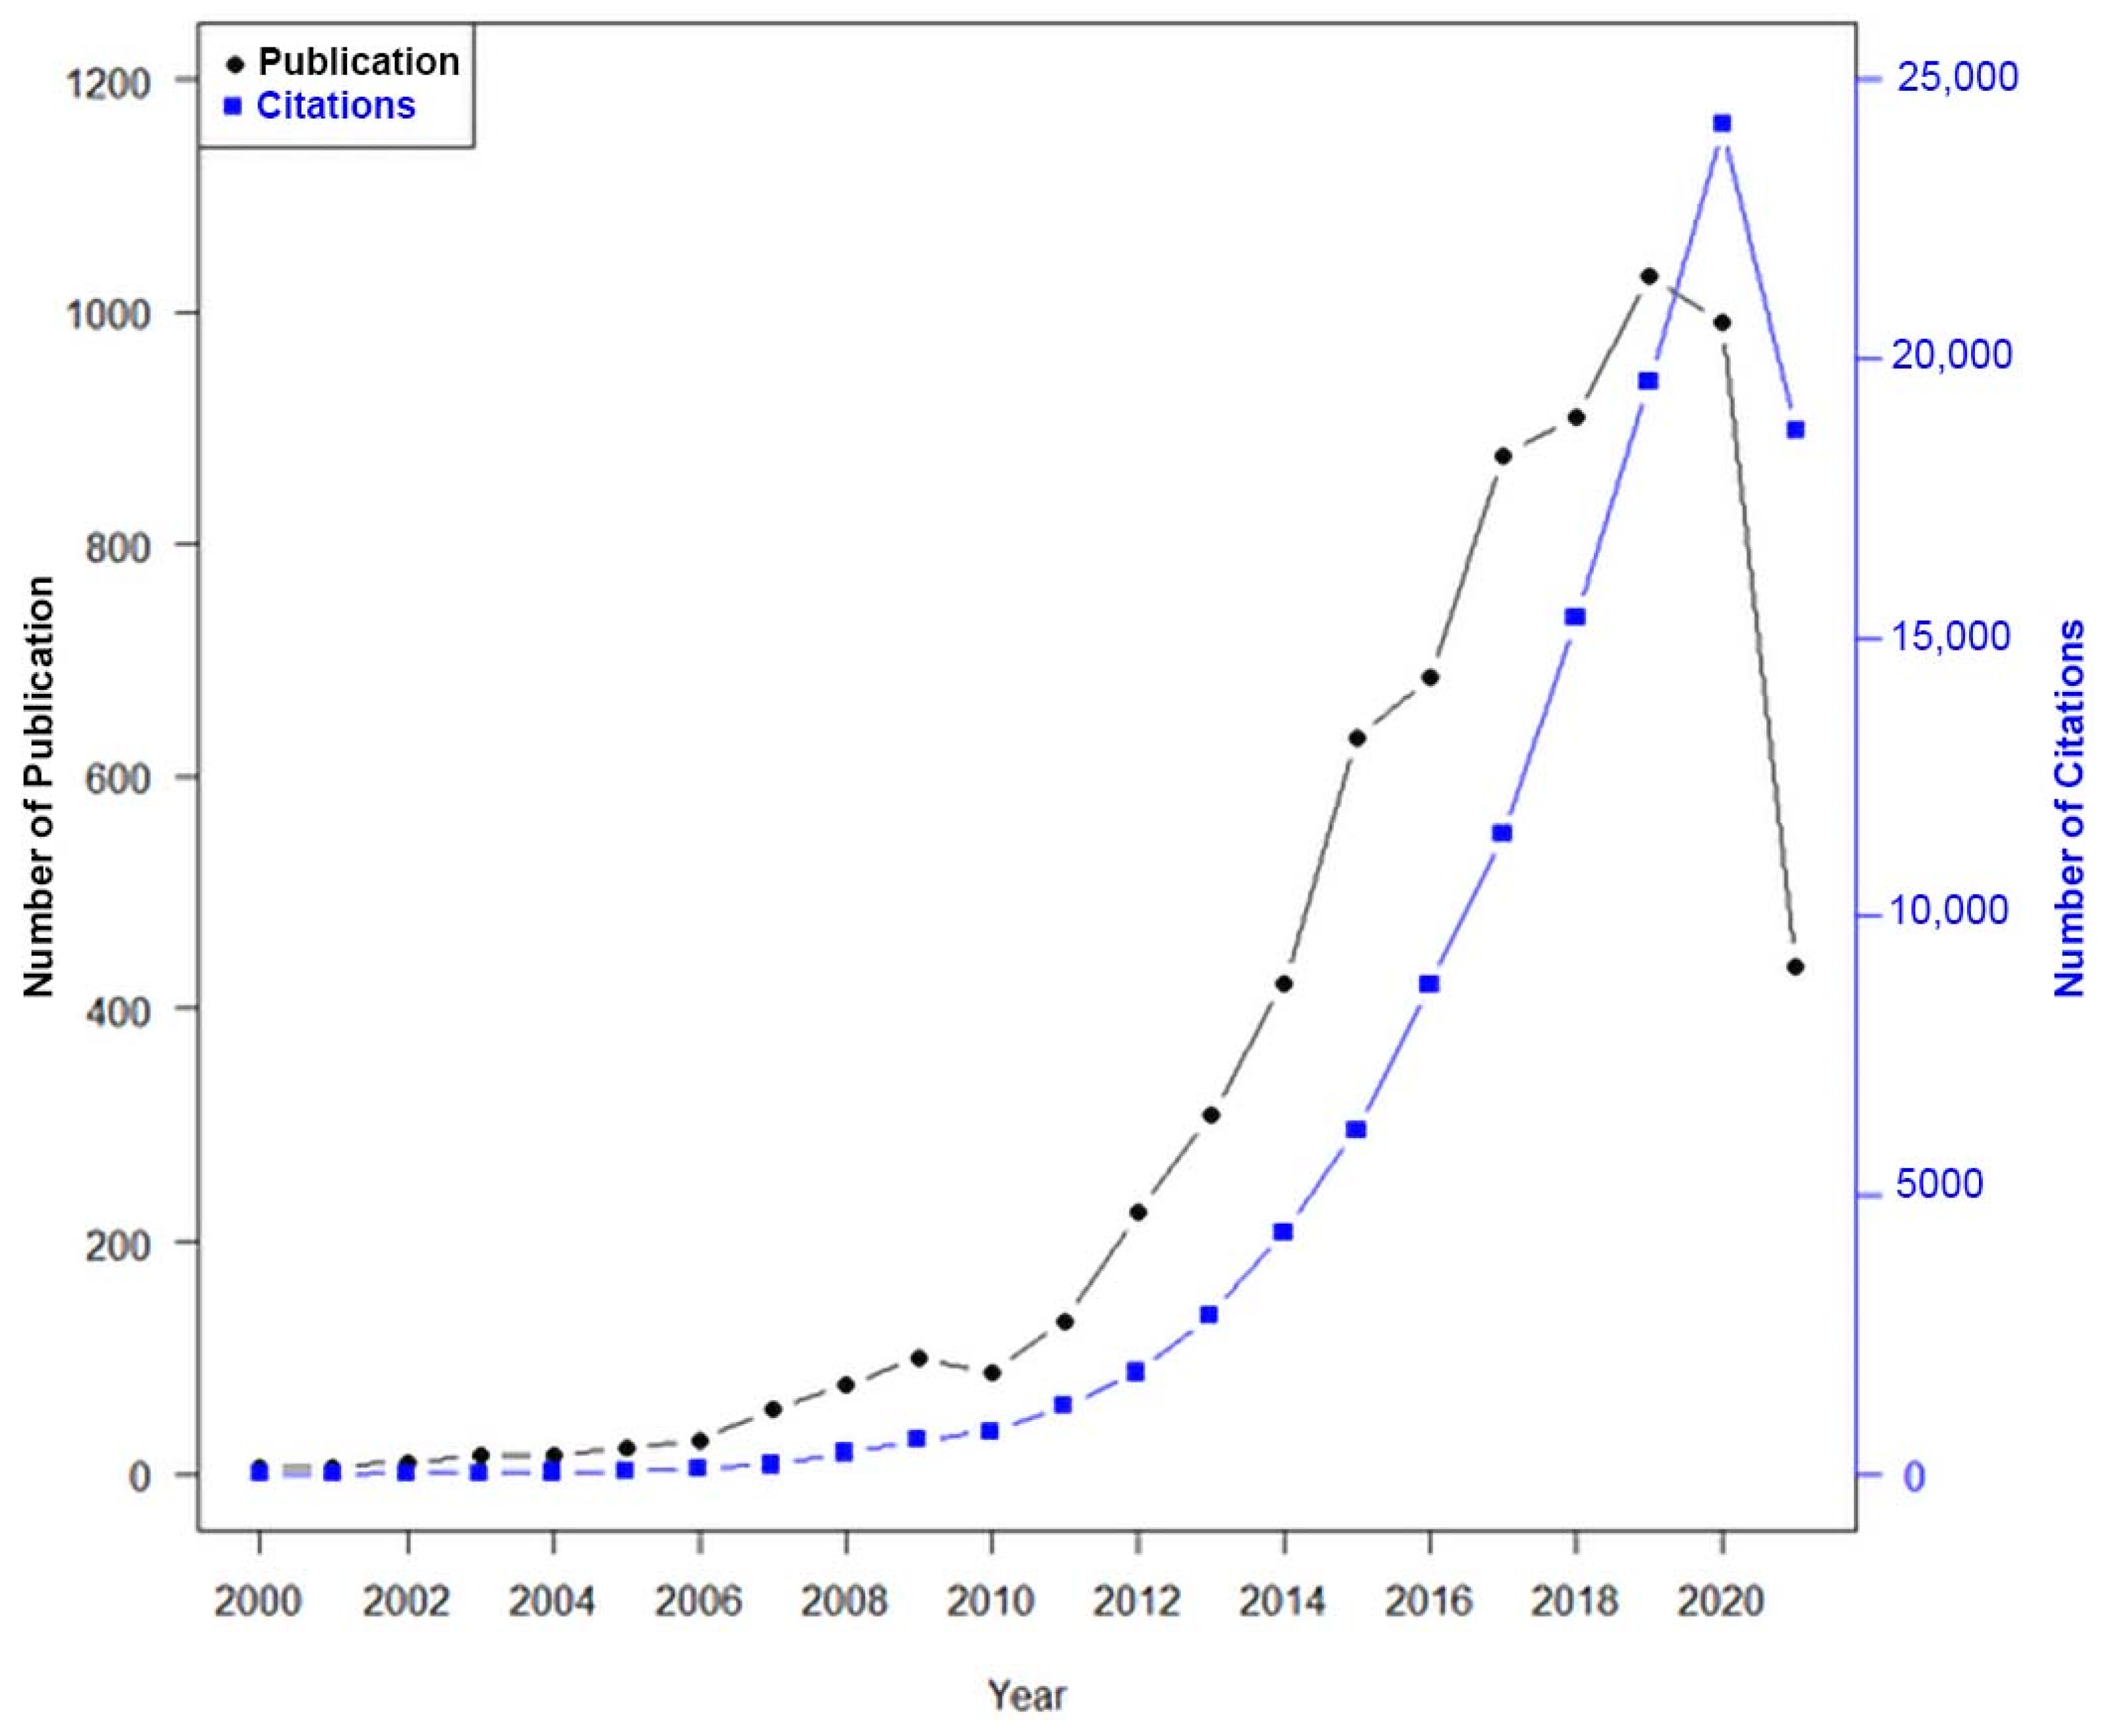
According to the data that were collected, the total of publications per year regarding the topic under analysis is summarized and shown in Figure 3. The overall period can be split into two phases, before and after 2011. As shown in Figure 3, growth was slower until 2011, this evolution is then accelerated, with an annual growth rate of 20.4%.
This field has been growing in the last 10 years in the scientific sector, as shown in Figure 3. This fact indicates that this field is in significant growth, which is supposed to become a vast market deployment in the near future. Besides this, 95.3% of the publications (6808 out of 7146 publications) were published within 2010–2021 and 71.8% of the total publications (5129 out of 7146 publications) were published since 2015.
The annual distribution of the number of citations follows the publication trend, as depicted in Figure 3; the total number of citations accumulated attained a maximum of 24,201 around the year 2020. As expected, the citations are reduced in the last year that is not complete yet and does not include more recent publications. This demonstrates the uniqueness of this research concerning the integration of solar PV systems into power networks.
The number of publications in 2021 is 505, which is significantly less than the previous year. The reason behind this is that the data collection extends until the 14th of July 2021; thus, the later publications that should be categorized in the year 2021 are not yet included in our dataset.

3.2. Country/Area Statistics

From 2000 to 2021, 133 countries have contributed to publishing on the topic that was analyzed. In Table 2, the top 15 productive countries are ranked concerning the total number of publications.
The top 15 countries are responsible for more than 67% of the world’s total publications. There were six Asian countries, five European countries, two from North America, one country from Oceania (Australia), and one from Africa (South Africa) that appeared as the most productive countries concerning this topic and its analysis.
As shown in Table 2, India is the leading country in total publications (992), mainly due to the government’s strategic and long-term industrial policy [64,65]. India’s government adopted a policy of 175 GW of grid-connected renewable energy capacity in 2022 and 450 GW in 2030 [66,67].
Regarding the number of publications, China (754) and the United States (592) come in second and third, respectively. It is worth mentioning that China ranks second for the number of publications that are produced by a single country, while China remains at the top of the list of the number of international collaborative publications. The top 3 are also the biggest emitters of carbon dioxide. Also, other countries, such as Italy, Spain, Germany, Australia, and Iran, show relevant production. The massive amount of scientific publications demonstrate the EU’s growing interest and investment. This is mainly due to the adoption of two essential strategies to support the Green Deal’s energy [68]: the ‘EU Strategy for Energy System Integration’ and the ‘EU Hydrogen Strategy’, with the goal of bringing the entirety of Europe’s energy generation to 100% renewable sources by 2050 [69,70].
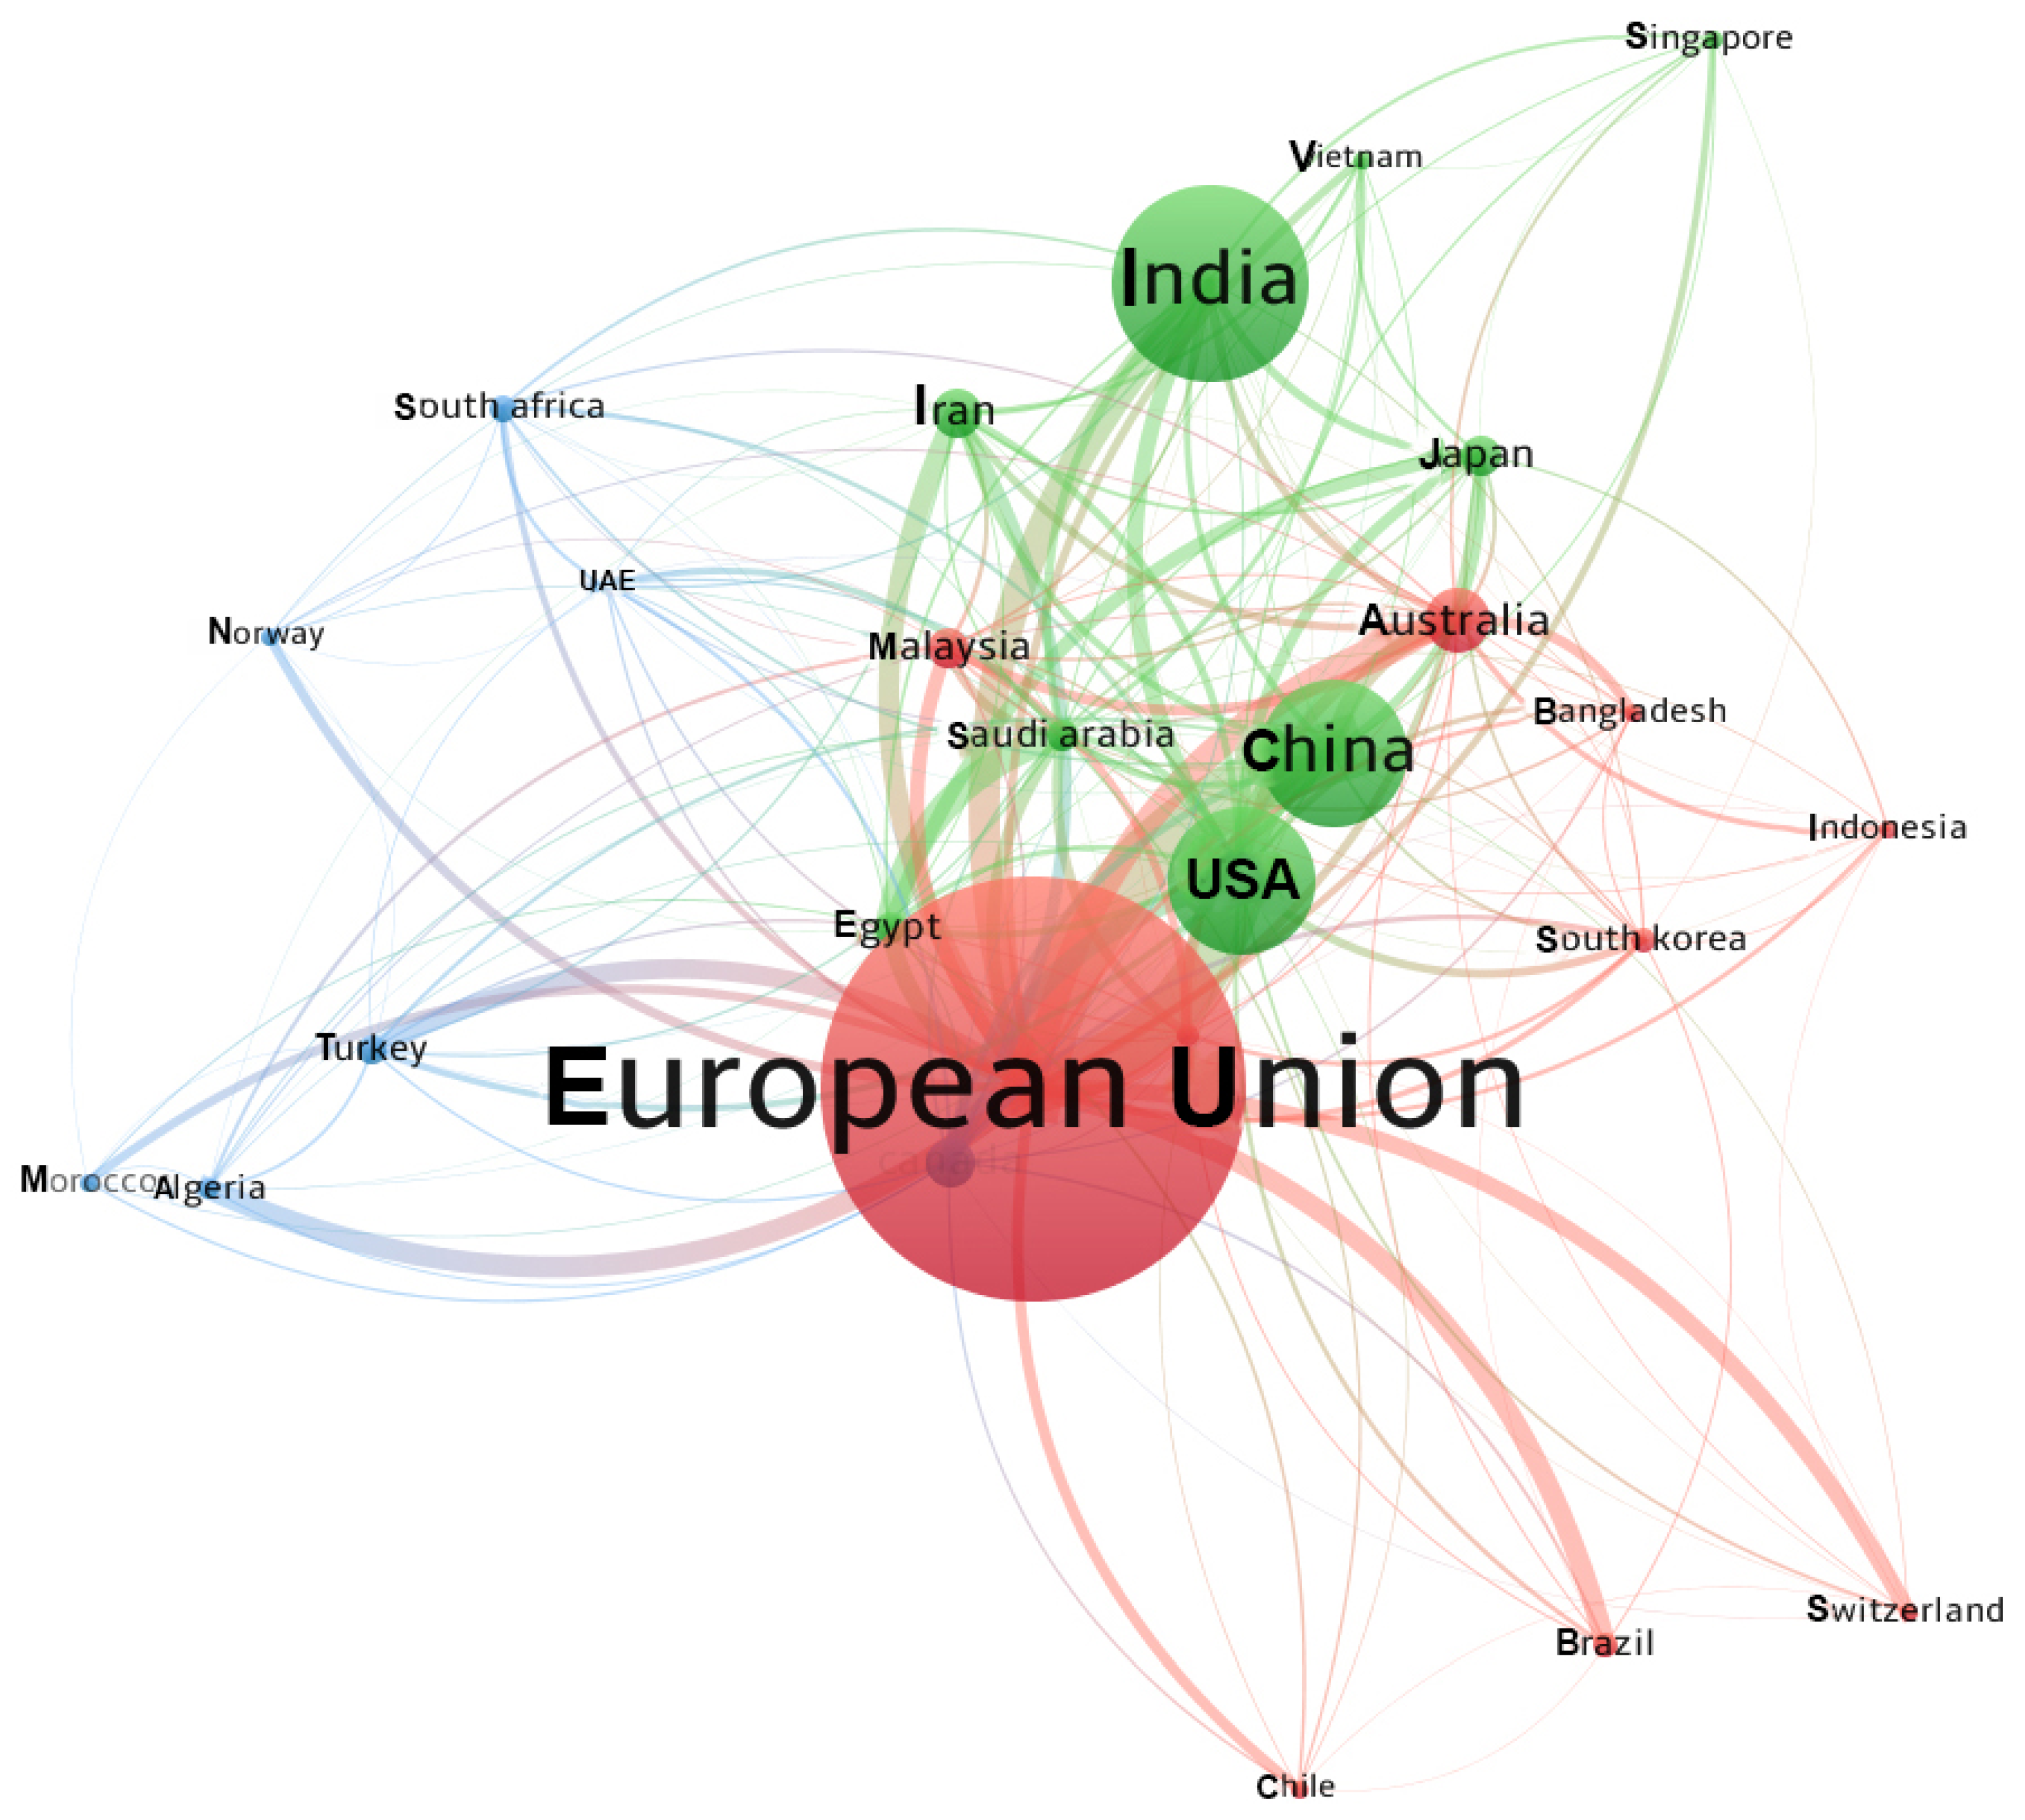
To further understand the collaboration pattern between the countries, the software (VOSviewer) is used to generate the countries’ academic interactions based on joint publications related to author affiliation as well as an analysis of their interactions. Note that “UK” refers to England, Scotland, Wales, and Northern Ireland as members of the European Union (EU-28), whereas “China” refers to mainland China, Hong Kong, Macao, and Taiwan.
The thickness of the links and the node size corresponds to the number of documents that were published and the number of publications that the countries jointly issued, respectively, and the distance between two nodes reflects the intensity of their relationship. A shorter distance represents a higher degree of similarity, and the color indicates the cluster into which an item is entered [71]. In order to be included in the co-authorship network, a country must have 35 publications.
It can be seen from Figure 4 that the EU has a strong collaboration with China, the USA, India, and Australia, followed by remarkable collaborations between China and the USA, Australia, Japan, and Iran. Three main clusters were identified in Figure 4. The first cluster (in red) led by the EU, includes Australia, Canada, Malaysia, Brazil, Switzerland, and others. The second cluster (in green) led by India comprises of China, the USA, Iran, Japan, etc. The third cluster (in blue), led by South Africa, includes Turkey, Norway, Algeria, Morocco, and the United Arab Emirates (UAE).
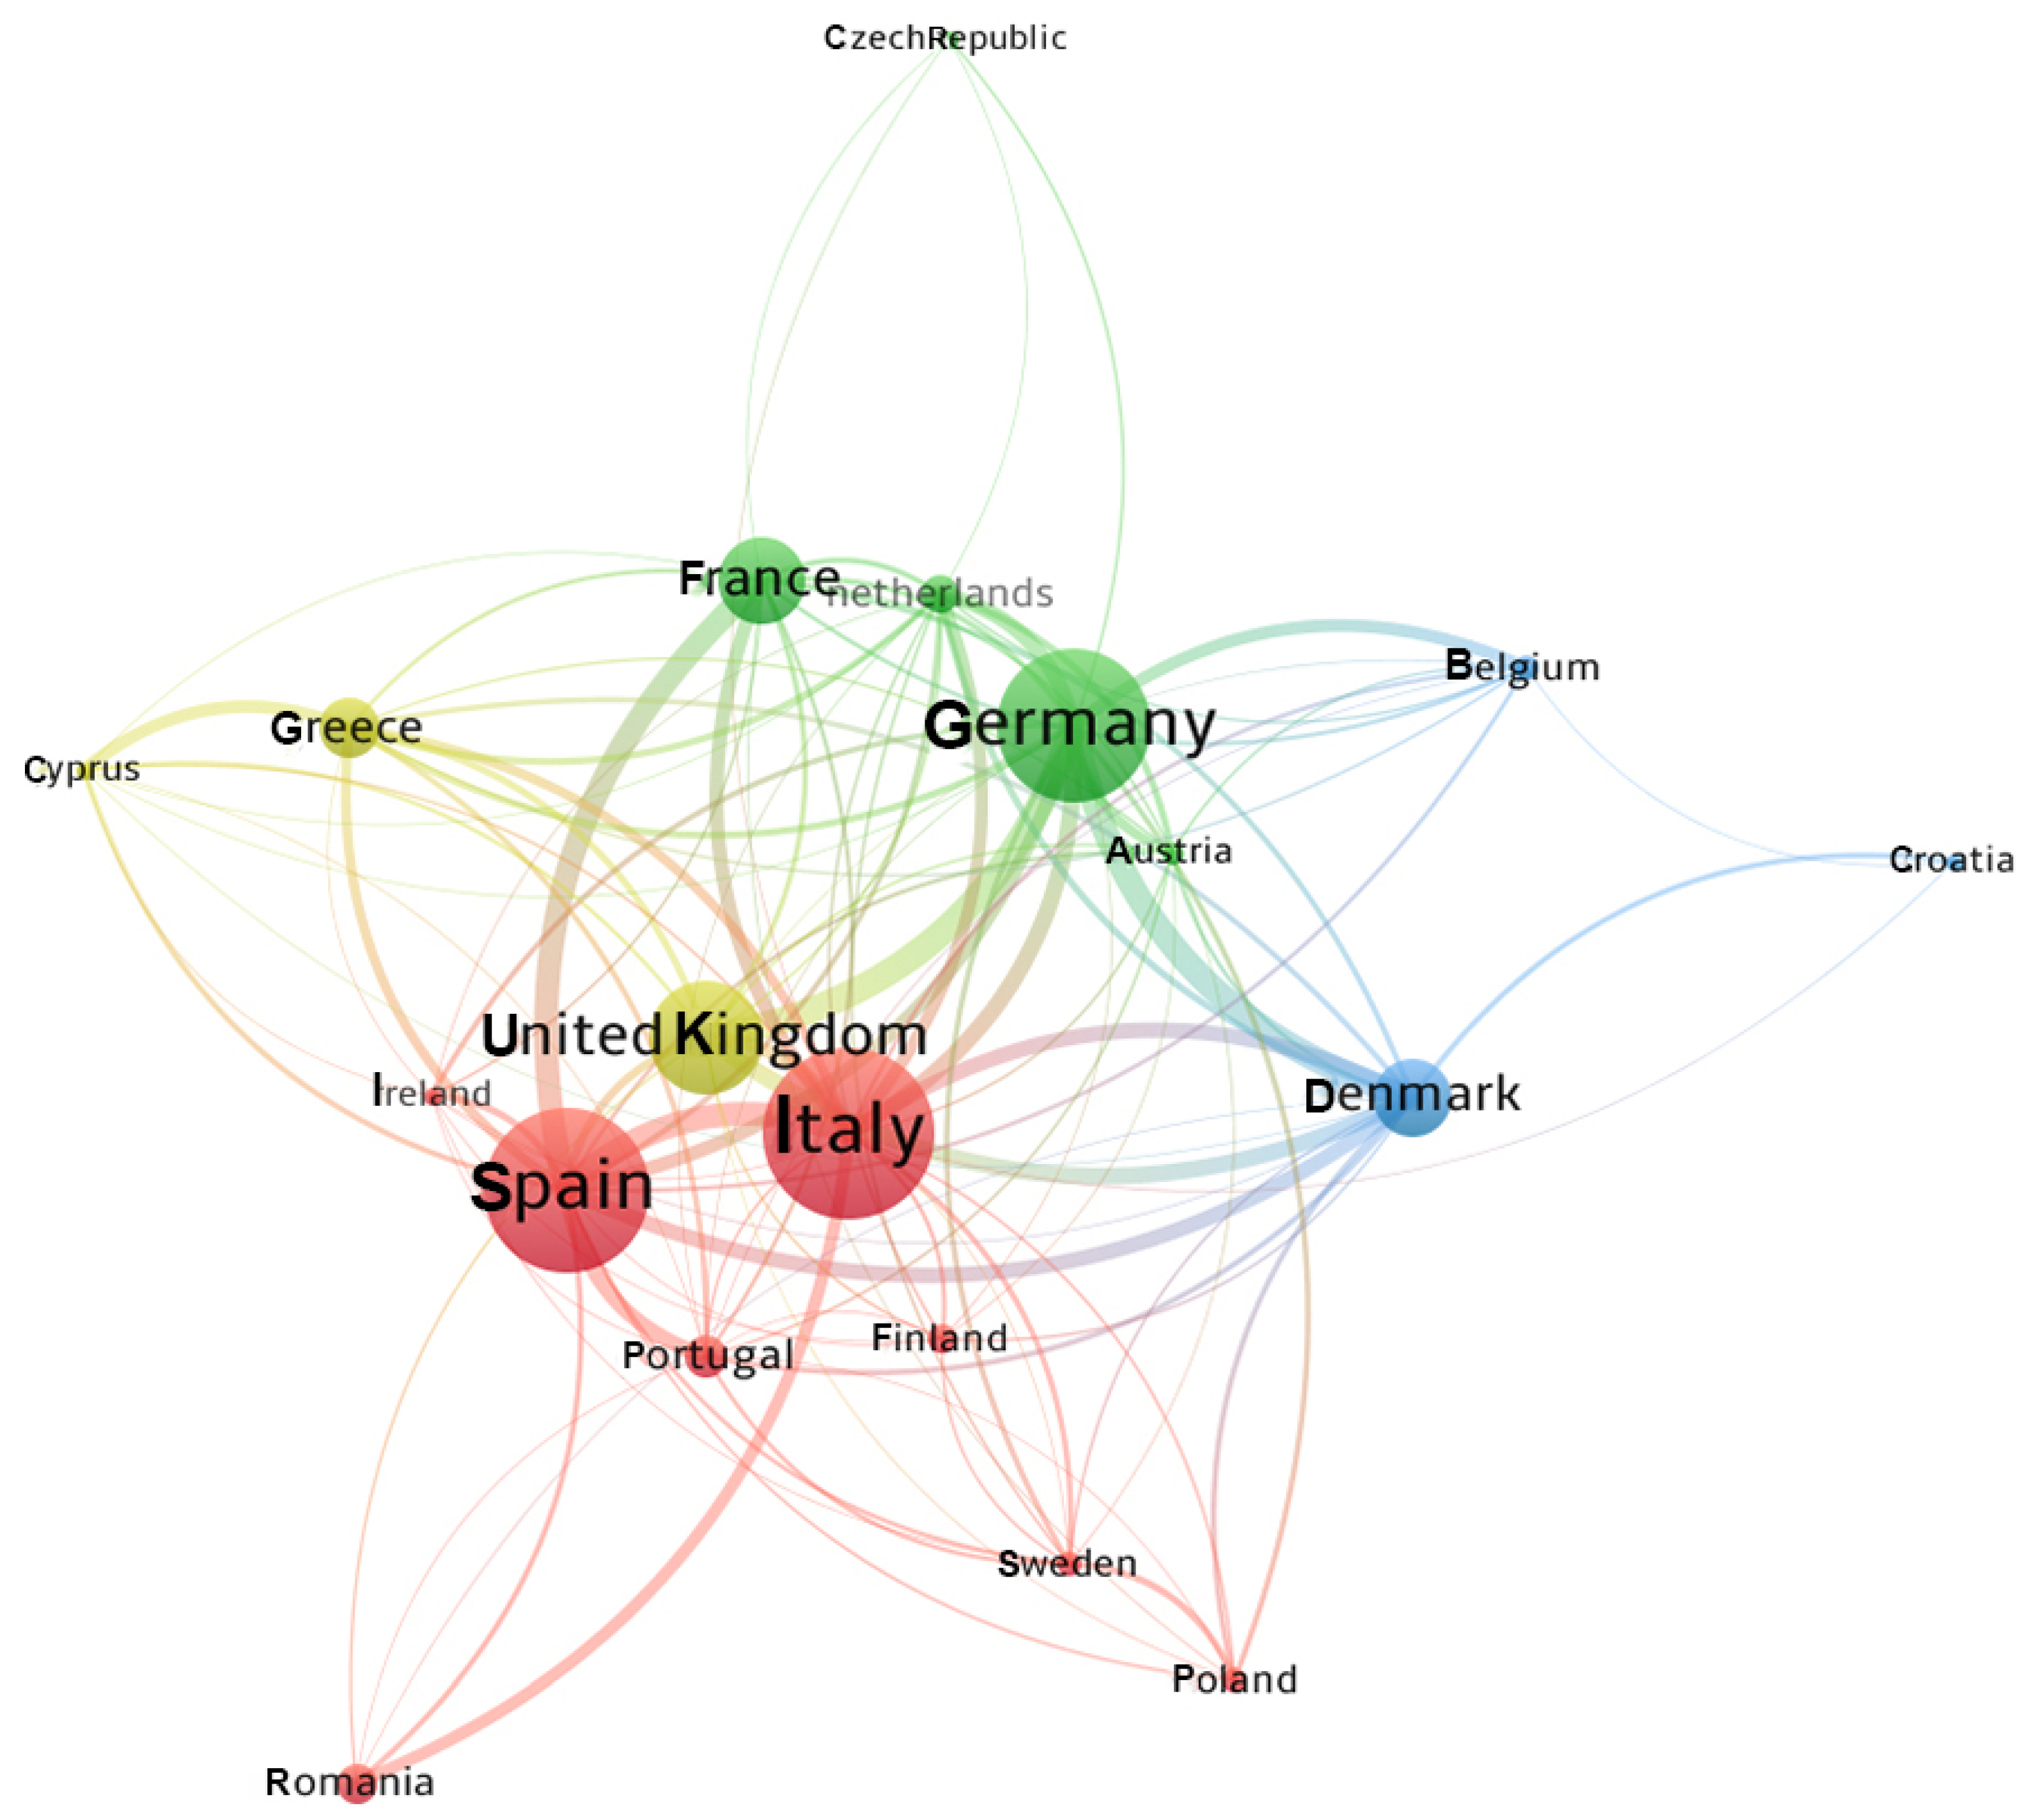
Figure 5 complements Figure 4 and illustrates the interaction of the European countries’ publications on the topic that was analyzed. It is clear that there are five major publishing countries in Europe: Italy, Spain, Germany, the United Kingdom, and France. All of them are ranked among the top 15 most productive countries concerning the topic under analysis (Table 2). As seen in Figure 5, there is a high level of interaction among them as well as sharing authorship with all the remaining countries.

3.3. Institution and University Statistics

Information from the authors’ institutional affiliations showed that they were distributed among a total of 4890 institutions. Table A1 provides a list of the top 15 productive institutions regarding the publication amount. Among them, three are from China; two from Iran, Spain, and Malaysia; and one each from Denmark, India, the USA, Italy, Portugal, and Singapore.
The university with the highest number of research contributions was Aalborg University in Denmark with nearly 2% of the field’s entire global publications. (126 publications), followed by North China Electric Power University in China (109 publications), and then Iran’s Islamic Azad University (93 publications).
The corresponding cooperation network diagram between the leading research organizations is shown in Figure 6. In order to facilitate the analysis, the minimum number of publications for an institution to appear in the cooperation network was set to 25. A total of 40 institutions matched these criteria, with five clusters identified in Figure 6. Concerning the number and width of the links in the figure, the strongest co-authorship links can be observed between Aalborg University (Denmark) and Islamic Azad University (Iran), National Renewable Energy Laboratory (USA), and Polytechnic University of Milan (Italy), Indian Institute of Technology Delhi (India) and Nanyang Technological University (Singapore), and North China Electric Power University (China) and Tsinghua University (China). These universities are ranked among the top 15 most productive institutions concerning the topic under analysis (Table A1).

3.4. Journals Statistics

A total of 7146 studies were published in 2074 journals and/or conference proceedings. These journals are classified in various research areas: i.e., engineering, energy fuels, computer science, mathematics, environmental science, science and technology, and economics. This indicates that the topic under analysis has piqued the interest of a wide range of scholars in a variety of sectors as a viable approach for promoting other areas, both economically and environmentally.
Table 3 consists of a list of the top 15 most productive journals based on the number of their publications. These 15 journals account for 28.5% of the world’s publications in this field. We analyzed several factors that were reported in Table 3 to identify the most significant journals concerning the topic under analysis.
Among them, Energies was the journal with the most publications, 328 publications (4.58%) and an impact factor (IF) of 3.00. Regarding the number of publications, Renewable & Sustainable Energy Reviews (IF = 14.98) with 237 records (3.31%), and Renewable Energy (IF = 8.00) with 234 publications (3.27%) came in second and third position, respectively.
As shown in Table 3, Renewable & Sustainable Energy Reviews with the highest impact factor (IF = 14.98), was ranked first. In accordance with the h-index (h = 64) and total citations (TC = 15,829), followed by Renewable Energy (h = 53, TC = 8543) and Applied Energy (h = 46, TC = 7945).
According to the average number of citations per document (TC/TP), Renewable & Sustainable Energy Reviews, Solar Energy, and Applied Energy are the top three journals although they are ranked 2nd, 10th, and 4th regarding the number of records, indicating these journals are of the highest quality.

3.5. Author Statistics

According to the findings, 17,471 authors have contributed to publishing on the integration of solar PV systems into power networks. Where necessary, duplicated author profiles have been removed from the database, which is especially common among Chinese authors. Table A2 provides some bibliometric indicators, such as the number of author’s publications, the number of citations, the h-index, the g-index, as well as the m-quotient, which facilitated the identification of the most relevant authors.
Table A2 shows the 15 most productive authors in terms of the number of publications. Among them, three are from Denmark, three are from China, and one is from each of the following countries: Australia, Canada, India, Japan, Malaysia, Portugal, Spain, Saudi Arabia, and the United Arab Emirates.
Amongst these authors, Bhim Singh is the most productive one, with 44 publications and a local h-index equal to 8, from the Indian Institute of Technology Delhi, India. According to the number of publications, Frede Blaabjerg, with 37 publications, and a local h-index equal to 15, has the highest number of citations (3762) and an average number of citations per document (TC/TP) of 101.7 that is the highest one within the top 15 most productive authors. Meanwhile, Josep Guerrero, with 34 records, has the second-highest number of citations (1702), with an average number of citations per document (TC/TP) of 54.9. In addition, he holds the highest local h-index (16) among the top 15 authors. Both are from the Aalborg University in Denmark, and they are ranked second and third, respectively.
Furthermore, as indicated in Table A2, Francisco Jurado from the University of Jaén in Spain is the top-ranked author in terms of the m-quotient parameter, indicating his emergence as an author. His publication output has been steadily increasing over time and accounts for this author’s rise to prominence.
Figure 7 illustrates these top authors’ productivity in the integration of solar PV systems into power networks over the past two decades. It is worth noting that the author with the most extended trajectory in this field was Frede Blaabjerg from the Aalborg University in Denmark. Moreover, other authors from the same University (Josep Guerrero and Yongheng Yang) have been actively working in this field since 2008 and 2012, respectively. The author Bhim Singh, from the Indian Institute of Technology Delhi, has recently produced a significant amount of research output within this domain.

3.6. Research Hotspots and Evolution

Keywords summarize research articles and highlight and refine the research’s main topic. We focused on the author’s keywords instead of all the keywords in order to obtain a more precise pattern identification analysis in this study [72].
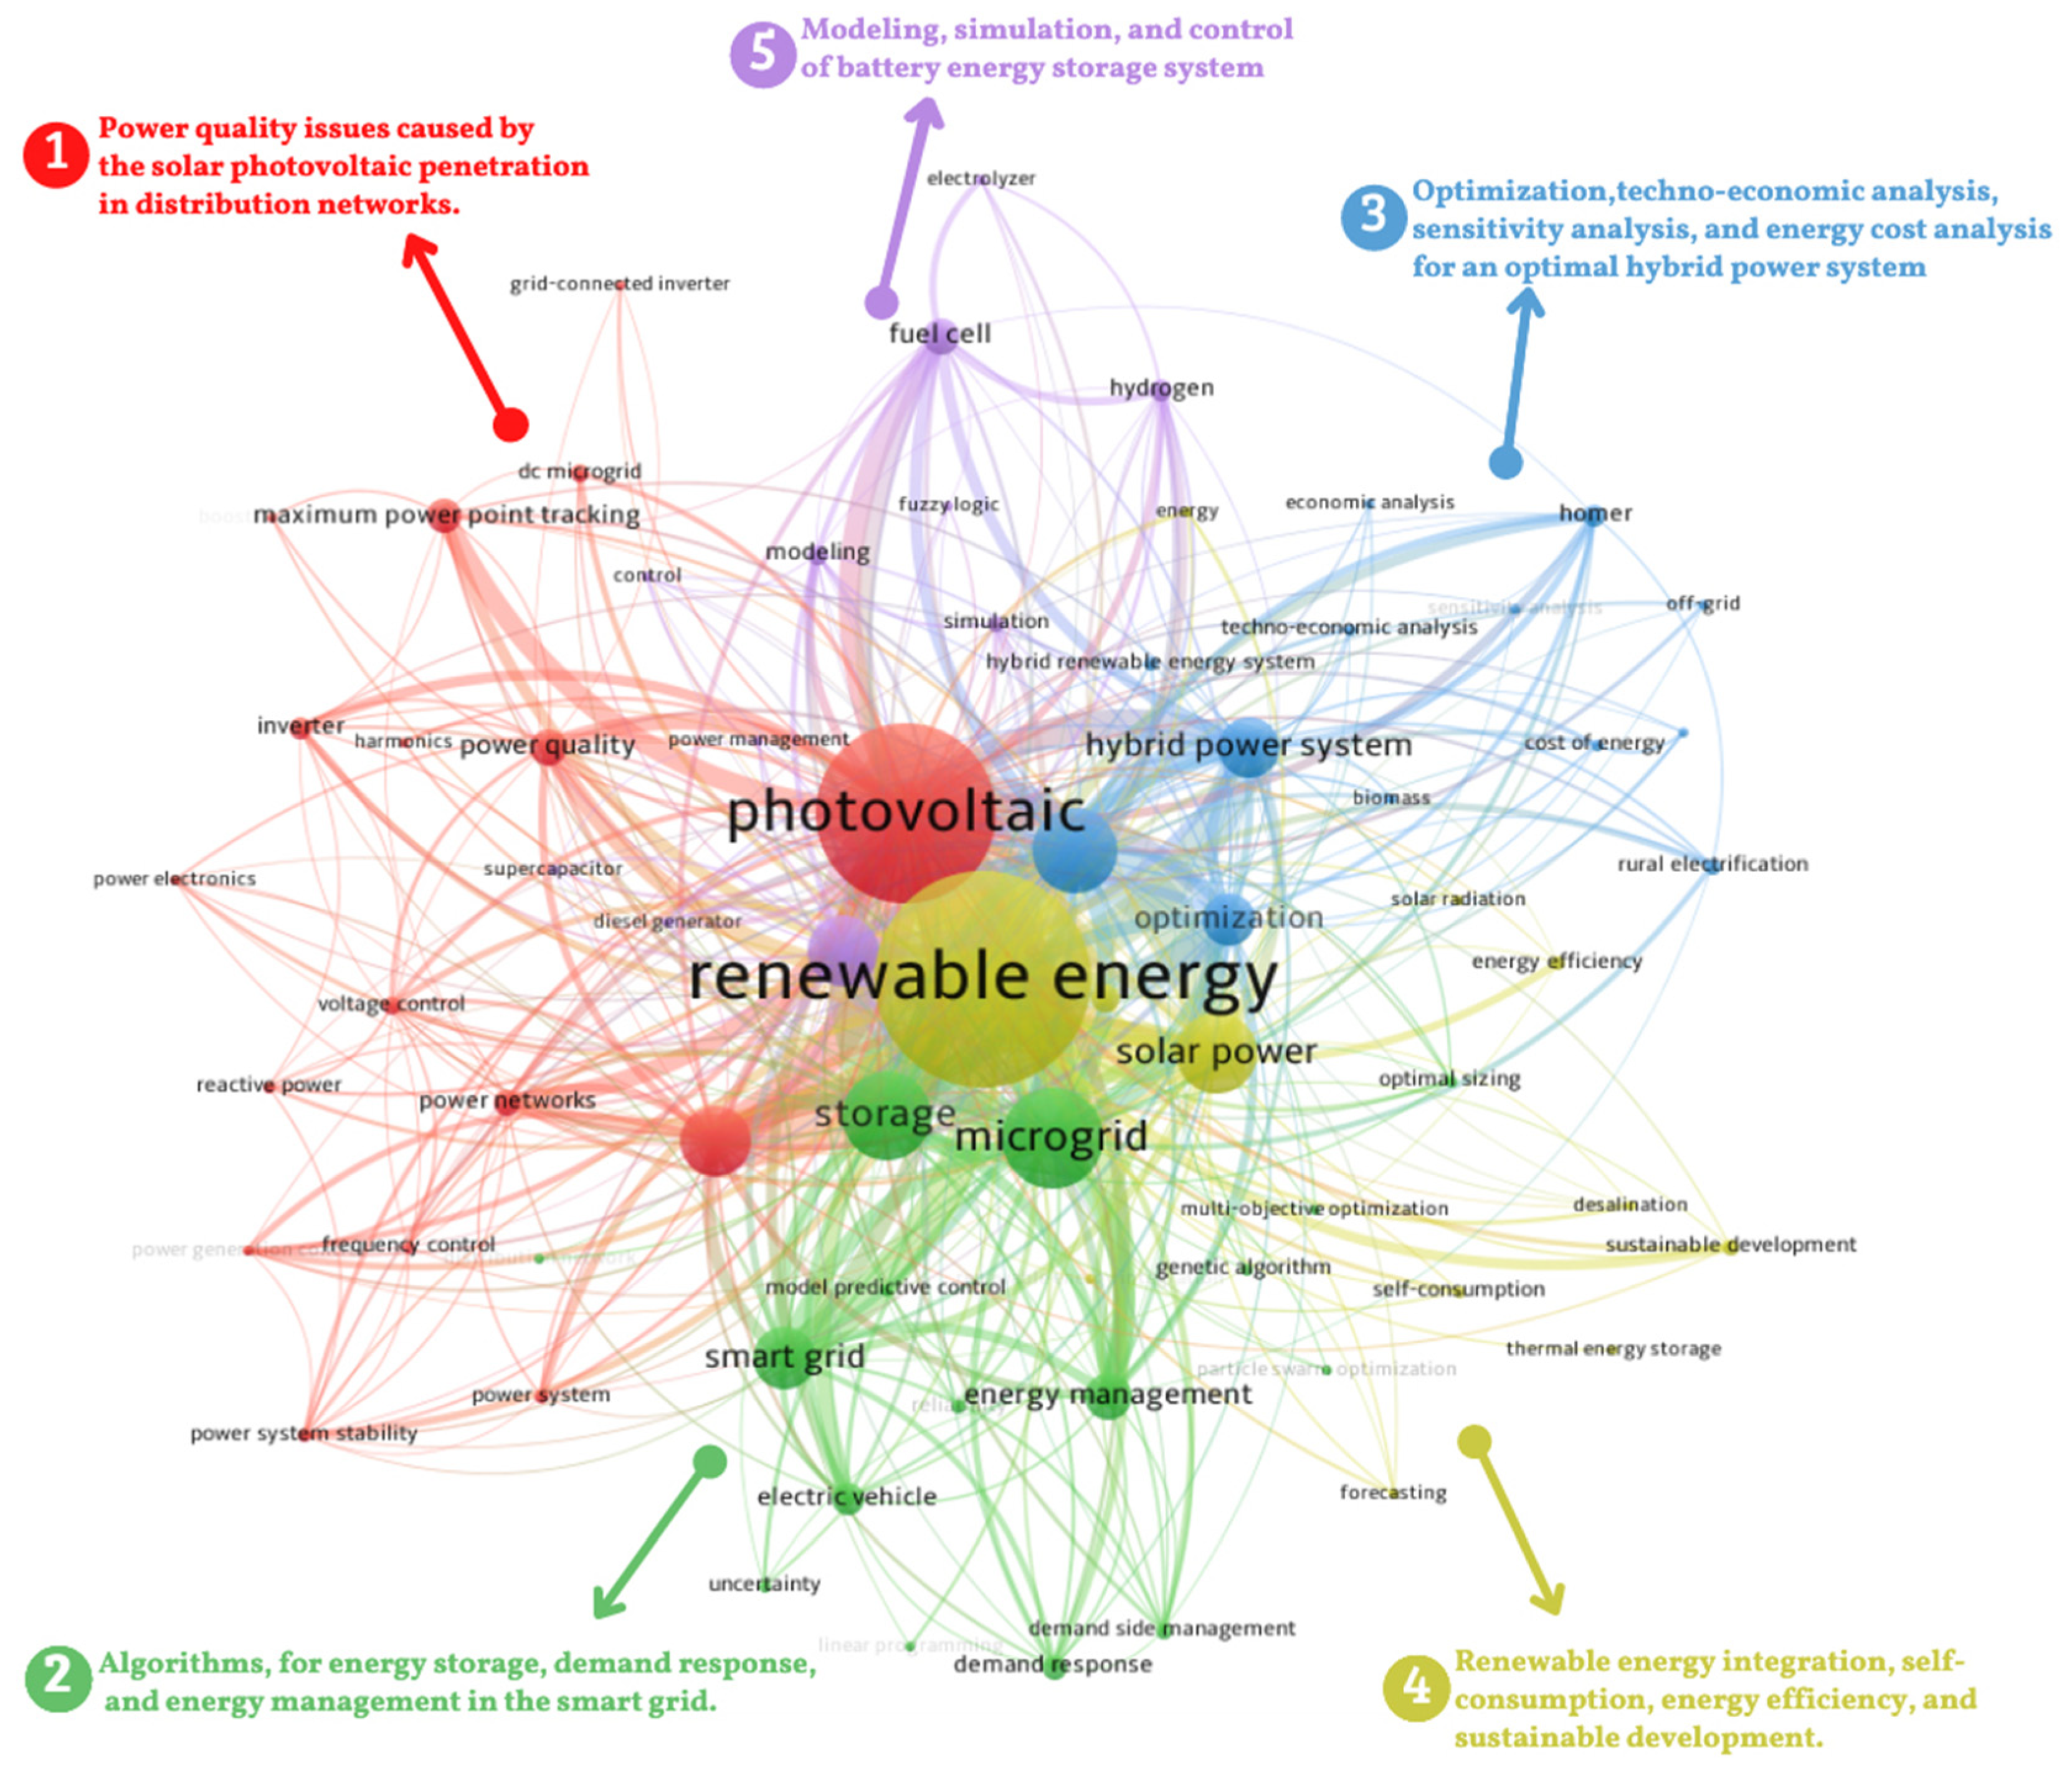
With the help of VOSviewer, the keywords co-occurrence network with the authors’ keywords in the integration of solar PV systems into power networks during 2000–2021 is illustrated in Figure 8. In order to create this knowledge map (network), groups of keywords that relate to the same subject were merged (for example, “photovoltaic”, “PV”, and “photovoltaic systems” are given as “photovoltaic”).
The node’s size reveals the keywords frequency. The co-occurrence frequency of the keywords is represented as an edge between two nodes, with a thicker line corresponding to a higher frequency. The minimum number of keyword occurrences is limited to 30 in order to facilitate the analysis. There are 69 nodes and 24,380 links in total, divided into five clusters:
  • Power quality issues that were caused by the solar PV penetration in distribution networks (red color).
  • Algorithms, for energy storage, demand response, and energy management in the smart grid (green color).
  • Optimization, techno-economic analysis, sensitivity analysis, and energy cost analysis for an optimal hybrid power system (blue color).
  • Renewable energy integration, self-consumption, energy efficiency, and sustainable development (yellow color).
  • Modeling, simulation, and control of battery energy storage system (purple color).
As shown in Figure 8, the most significant cluster is cluster 1 (in red color). Analysis of the data revealed that this cluster’s main concept surrounds power quality-related issues that are caused by the solar PV penetration in distribution networks, as can be gathered from the terms such as: “photovoltaic”, “power electronics”, “power quality”, and “power system stability”, “frequency control”, “grid-connected inverter”, “harmonics”, and “reactive power”. The impact of PV installations on power systems is becoming more noticeable as the number of PV installations is growing worldwide. Several studies [73,74,75] have been performed to measure the PV systems’ penetration impact in power networks. Power quality, the power imbalance between generation and load demand, and voltage and frequency fluctuation are the operational and safety issues that have arisen due to the high penetration of the PV systems [76,77,78]. According to Karimi et al. [31], voltage and harmonics are the primary challenges for PV integration. On the other hand, Haque and Wolfs [30] emphasized overvoltage and voltage imbalance issues.
The “maximum power point tracking” (MPPT) technique for the PV system under partially shaded conditions (PSCs) has been studied extensively. In order to mitigate the negative effects of PSCs on PV power generation, one solution is to change the hardware circuit of the PV array, such as incorporating the switch matrix to reorganize the PV system configuration [79].
Modifying the tracking algorithms is another option. The global maximum power point tracking (GMPPT) approach [80,81] refers to a collection of updated algorithms. The GMPPT approach is less expensive, has less circuit complexity, and is more flexible than hardware-based improvements. “Particle swarm optimization” and “fuzzy” algorithms are among the intelligent algorithms that are presented in [82,83,84]. This leads to another cutting-edge research area which is the dynamic reconfiguration of PV module interconnections within a PV array.
As can be seen in Figure 8, the most repetitive nodes in Cluster 2 (in green color) are: “microgrid”, “smart grid”, “storage”, “energy management”, “demand response”, “multi-objective optimization”, “genetic algorithm”, and “particle swarm optimization”. These keywords reflect that the applications of the advanced algorithms to optimize the problem of energy storage and energy management in the microgrid and the smart grid have piqued researchers’ interest. One or more objective functions may be involved in energy management and control optimization in a microgrid [85]. These may include reducing costs (fuel, operating, and maintenance costs), and the cost of deteriorating storage elements such as batteries or capacitors.
With regard to this cluster, the authors in reference [86], provide a generalized framework for intelligent energy management of a microgrid using artificial intelligence algorithms with multi-objective linear programming optimization. Marzband et al. [87] presented an enhanced real-time energy management system for microgrid systems; this technique uses genetic algorithms to minimize carbon dioxide emissions and energy costs while maximizing the potential of existing renewable energy sources.
Zhao et al. [88] employed a genetic algorithm that was combined with particle swarm optimization to find the most probable capacity model of a solar PV-wind hybrid renewable energy system with quick global convergence. Ben et al. [89] employed a fuzzy adaptive genetic algorithm to identify the optimal number of PV panels, and storage units.
Cluster 3 (in blue color) presented aspects that are related to the optimization of techno-economic analysis and energy cost analysis for an optimal hybrid power system, which can be inferred from the terms “optimization”, “hybrid power system”, “wind power”, “techno-economic analysis”, “HOMER”, and “cost of energy”, and these keywords reflect that the researchers are very interested in these topics. Concerning these terms, Celik [90] conducted an optimization analysis on a hybrid power system that included both solar PV and wind power. Similarly, Markvart [91] studied a PV and wind power hybrid system optimization. Diaf et al. [92] investigated a PV and wind power system from a techno-economic standpoint. Laterra et al. [93] described the procedure to develop a fuzzy logic based on multi-objective optimization to build the unit size of a grid-connected solar PV and wind power system.
Besides the aforementioned mathematical methods, HOMER (Hybrid Optimization Model for Electric Renewables) is a popular software that can handle a variety of technologies for both steady and transient simulation. HOMER has been used in several case studies to model, simulate, and optimize hybrid power systems [94,95,96,97].
Cluster 4 (in yellow color), with central nodes “renewable energy”, “energy efficiency”, “self-consumption”, and “sustainable development”, illustrates that researchers focus on sustainable development by integrating renewable energy and energy efficiency as stated in [98,99,100,101,102,103].
As shown in Figure 8, the main objective of the publications within cluster 5 (in purple color) is the modelization, simulation, and control of battery energy storage systems, especially hydrogen technologies for grid-connected applications, as can be concluded from the following keywords: “hydrogen”, “fuel cell”, “electrolyser”, “modeling”, “simulation”, and “control”, as mentioned in [104,105,106,107].
The application of “deep learning” has become more and more promising in the energy domain, with a huge potential for renewable energy prediction challenges, especially in the field of “photovoltaic” systems for “power forecasting”. Son et al. [108], for instance, used a deep neural network approach to anticipate PV power in a “microgrid” environment, and they provided an “energy management” approach to balance between the amount of energy that was generated and the amount of energy that was required. Moreover, another study [109], presented an innovative “fuzzy logic” system for “forecasting” the output power of two “photovoltaic” power plants in Milan and Catania, Italy. Furthermore, in Wang et al. [110], PV power prediction was done using a hybrid “deep learning” model (Long Short-Term Memory—Convolutional Network).
In addition, the authors’ keywords are visualized in Figure 9 using an R programming in-house tool to see the research content evolution in the topic that was analyzed. A frequency threshold of five has been defined as a minimum. From a general perspective, and according to Figure 3, the topic’s number of publications is vast, with many further and deeper investigation opportunities.
Since there were few publications in this field between 2000 and 2012, as shown in Figure 3, the study concerns were dispersed, and the research context evolution path was unclear. However, various research areas, such as photovoltaic generators, financial analysis, solar radiations forecasting, and several PV cell materials, were prominent topics of study currently.
During 2013–2018, in Figure 9, the researchers focused on the challenges that were related to the optimization methods that applied to the integrations of PV systems into smart grids. In the same period, the performance evaluations of the hybrid renewable energy system using HOMER, and the optimization of the hydrogen storage system with the PV gained much interest.
In 2019–2021, several emerging topic research areas could be detected in Figure 9. It can be summarized as follows: (i) power quality issues due to PV system integrations in power networks, such as voltage control, current imbalance, and harmonic distortion; (ii) optimization of PV systems and energy management using advanced algorithms, including particle swarm, genetic algorithms, and fuzzy logic; (iii) techno-economic analysis for hybrid power systems (PV-wind); and (iv) optimization of battery energy storage systems, especially hydrogen technologies for grid-connected applications. As discussed in the next paragraphs, these four challenging perspectives should be considered in future development studies to improve the current knowledge that has been achieved and developed so far, thus individuating opportunities for future contributions.
In recent years (2019–2021), the concepts of “power quality”, “voltage control”, “power system reliability”, “uncertainty”, and the integration of “photovoltaic” systems in “microgrid” are found to be the top keywords for authors as can be seen in Figure 9 and Figure 8’s cluster 1 (in red), and as highlighted in [74,75]. Moreover, Metwaly and Teh [111] presented two approaches; (i) to determine the different combinations of “battery energy storage system power” ratings, and energy capacity, as well as their implications on the “power system reliability”; and (ii) an adoption technique to evaluate a “battery energy storage system” that includes “demand response” and dynamic thermal ratings.
Emad et al. [112] presented an optimal “techno-economic” design of “hybrid renewable energy” sources, which include ”photovoltaic”, “wind”, and a “battery energy storage system” for a ”microgrid”. Their research is based on an optimization process to meet load demand while minimizing “energy costs” using “HOMER” software, “particle swarm optimization”, and a “genetic algorithm”.
Another topic of recent interest includes the optimization of PV systems and energy management using advanced algorithms, including particle swarm, genetic algorithms, and fuzzy logic as can be concluded from cluster 2 (in green) in Figure 8 and Figure 9’s authors’ keywords, as well as highlighted in [86,93,113,114]. Furthermore, another hot topic is techno-economic analysis for hybrid power system (PV-wind) using mathematical techniques and HOMER, as can be seen from the following authors’ keywords “techno-economic”, “hybrid renewable system”, and “HOMER” in Figure 9, and the cluster 3 (in blue) in Figure 8, and also stated in [90,95,96,115,116]. An additional hot topic is the optimization of hydrogen energy storage technologies for grid-connected applications as can be summarized from the following concepts “hydrogen”, “fuel cell”, “electrolyser”, “modeling”, “simulation”, and “control” in Figure 9, and the cluster 5 (in purple) in Figure 8, as also mentioned in [104,105,106,107,117].

4. Conclusions

This review article with bibliometric analysis is beneficial for a comprehensive and quantitative understanding of the development trends in the integration of photovoltaic systems into power networks. It aims to summarize the evolution of the research in the field as well as point out potential research directions for future studies. We evaluated the current research progress and trends of integration of photovoltaic systems into power networks research, summarizing some publication characteristics such as countries, academic collaboration, journals, and authors. It was developed using data from the WoS database from 2000 to July 2021. With the help of advanced data analysis and visualization tools such as the Bibliometrix R-package and VOSviewer, a total of 7146 publications were analyzed.
The analysis that was performed shows a steadily increasing number of publications on the integration of photovoltaic systems into power networks. A total of 95.3% of the records are published since 2010, with an average annual growth rate of 20.4%, and the numbers continue to grow.
The results revealed that India is the leading country concerning total publications (992); however, it is ranked 9th with regard to the number of citations per document, indicating that the impact varies considerably. Regarding the number of publications, China (754) and the United States (592) come in second and third, respectively. Furthermore, the Aalborg University in Denmark has the maximum contribution in terms of the total volume of studies with nearly 2% of the world’s publications in this field, followed by North China Electric Power University in China (109 publications), and then Iran’s Islamic Azad University (93 publications). Among the top 10 most productive authors, the author Bhim Singh from the Indian Institute of Tech Delhi (India) has the highest number of publications (44) and a local h-index equal to 8. Frede Blaabjerg has 37 publications, a local h-index equal to 15, and the highest average number of citations per document (TC/TP) of 101.7. Additionally, Josep Guerrero, with 34 records, has the highest local h-index (16) among the top 15 authors. Concerning the number of publications, they are ranked second and third, respectively. The study also revealed that the three journals with more publications are Energies with 328 publications (4.58%), Renewable & Sustainable Energy Reviews with 237 records (3.31%), and Renewable Energy with 234 publications (3.27%).
Based on the co-occurrence analysis, the results revealed that interesting emerging keywords that are likely to gain attraction in the coming period are divided into five clusters: (i) power quality issues that are caused by the solar photovoltaic penetration in power networks; (ii) algorithms for energy storage, demand response, and energy management in the smart grid; (iii) optimization, techno-economic analysis, sensitivity analysis, and energy cost analysis for an optimal hybrid power system; (iv) renewable energy integration, self-consumption, energy efficiency, and sustainable development; and (v) modeling, simulation, and control of battery energy storage systems. In addition, the analysis showed that the optimal design and energy management, the power quality, voltage, and frequency fluctuation problems, as well as the technical-economic analysis, are the current research hotspots that might be considered as potential future research topics. Further research on these areas may improve the knowledge of integrating PV systems into the power network, providing new insights into promoting both energy security and addressing the environmental concerns of the sector.
The quality of the data that were used in a bibliometric study significantly impacts the study’s findings. It was attempted to include a large number of the most relevant papers in the solar PV integration research. It is also recommended to expand the database that was analyzed to obtain a more global perspective of the topic, and then analyze the topic of interest using a mixed-method study (bibliometric + traditional review and survey analysis) to gain a more in-depth understanding of the topic that was analyzed. However, the authors believe that the result of this study should offer valuable indications for solar PV industries, academics, and policymakers.

Author Contributions

Conceptualization, Y.E. and D.B.; methodology, Y.E. and M.N.; software, Y.E. and M.N.; validation, M.M.-G., A.F. and D.B.; formal analysis, Y.E. and M.N.; investigation, Y.E.; data curation, Y.E.; writing—original draft preparation, Y.E. and M.N.; writing—review and editing, M.N., M.M.-G., A.F. and D.B.; visualization, Y.E. and M.N.; supervision, M.M.-G., A.F. and D.B.; project administration, D.B.; funding acquisition, D.B. All authors have read and agreed to the published version of the manuscript.

Funding

This research was funded by the Spanish Ministry of Economy and Competitiveness RTI2018-093849-B-C33 (MCIU/AEI/FEDER, UE), the Catalan Government (2017-SGR-1409), and the Tarragona’s council (2021PGR-DIPTA-URV01). This work is partially funded by the Ministerio de Ciencia, Innovación y Universidades—Agencia Estatal de Investigación (AEI) (RED2018-102431-T).

Institutional Review Board Statement

Not applicable.

Informed Consent Statement

Not applicable.

Data Availability Statement

Not applicable.

Acknowledgments

The authors would like to acknowledge financial support from the Spanish Ministry of Economy and Competitiveness RTI2018-093849-B-C33 (MCIU/AEI/FEDER, UE), the Catalan Government (2017-SGR-1409), and the Tarragona’s council (2021PGR-DIPTA-URV01). This work is partially funded by the Ministerio de Ciencia, Innovación y Universidades—Agencia Estatal de Investigación (AEI) (RED2018-102431-T).

Conflicts of Interest

The authors declare no conflict of interest.

Nomenclature

EUEuropean Union
IFImpact Factor
Local g-indexg-index calculated from our dataset
Local h-indexh-index calculated from our dataset
Local m-quotientm-quotient calculated from our dataset
MCPMultiple Country Publications
PVPhotovoltaic
PY_startPublication Year starting
RESsRenewable Energy Sources
SCPSingle Country Publications
TCTotal number of Citations
TC/TPAverage Citations per document
TPTotal number of Publications
WoSWeb of Science

Appendix A

Search query used in WoS database:
TS = T S 1   A N D   T S 2   A N D   T S 3   A N D   T S 4   O R   T S 5  
TS = (
((“Renewable energ*” OR “Green energ*” OR “Clean energ*” OR “RES-based” OR “Renewable Power” OR “Non-conventional energ*” OR “Eco-friendly” OR “Earth-friendly”)
AND
(“Solar Energy” OR “Solar Power” OR “Solar Farm” OR “PV” OR “Photovoltaic*”)
AND
(“Self-consumption” OR “Stand-alone” OR “Grid” OR “ Autonomous “))
AND
((“Integrat*” OR “Interconnect*” OR “Multi-interconnect*” OR “Connect*” OR “Microgrid*” OR “Power energ* system*” OR “Distribution Network*” OR “Distributed generation source*” OR “Multi-source system*” OR “Hybrid multi-source” OR “multi-energy system*”)
OR
(“energy storage” OR “short term* storage” OR “Medium term* storage” OR “Long term* storage” OR “Hybrid energ* storage” OR “Thermal energy storage” OR “TES” OR “P-H2-PEM” OR “Pumped hydro” OR “CAES” OR “Molten Salt” OR “PHS” OR “Lead Batter*” OR “NaS Batter*” OR “VR-FB” OR “Ni-Cd” OR “Li-ion” OR “Batter* storage system*” OR “fuel cell*” OR “power storage” OR “flywheel*”)))

Appendix B

Table A1. Top 15 authors in the integration of solar PV systems into power networks during 2000–2021.
AffiliationsNumber of PublicationsCountry
Aalborg University126Denmark
North China Electric Power University109China
Islamic Azad University93Iran
Indian Institute of Technology Delhi54India
Polytechnic University of Catalonia54Spain
Polytechnic University of Milan52Italy
National Renewable Energy Laboratory49USA
University of Malaya49Malaysia
Tsinghua University48China
Nanyang Technological University41Singapore
University of Tehran41Iran
China Electric Power Research Institute40China
University of Lisbon40Portugal
Jaen University38Spain
University of Technology Malaysia38Malaysia

Appendix C

Table A2. Top 15 authors in the integration of solar PV systems into power networks during 2000–2021.
AuthorAffiliationCountryTPTCTC/TPLocal
h-Index
Local
g-Index
Local
m-Quotient
PY_Start
Singh BIndian Institute of Technology DelhiIndia442265.18141.3332016
Blaabjerg FAalborg UniversityDenmark373762101.715350.752002
Guerrero JMAalborg UniversityDenmark31170254.916280.62008
Senjyu TUniversity of the RyukyusJapan313089.99170.8182011
Zhang YNorth China Electric Power UniversityChina271505.66110.6672013
Jurado FUniversity of JaénSpain2379834.713181.3002012
Li YChina Electric Power Research InstituteChina2333414.56150.52010
Kumar AUniversity of AlbertaCanada221818.26130.432005
Bansal RCUniversity of SharjahUnited Arab Emirates2032316.2101712012
Yang YHAalborg UniversityDenmark1940821.59160.9002012
Mekhilef SUniversity of MalayaMalaysia18106158.910141.4292015
Catalao JPSUniversity of LisbonPortugal1750929.98121.1432015
Shafiullah GMMurdoch UniversityAustralia16885.5690.5002012
Zhang LChina Electric Power Research InstituteChina1667342.1580.4172010
Khalid MKing Fahd University of Petroleum and MineralsSaudi Arabia1528218.86121.0002016
TP = Total number of publications, TC = Total number of citations, TC/TP = Average citations per document, Local h-index = h-index calculated from our dataset, Local g-index = g-index calculated from our dataset, Local m-quotient = m-quotient calculated from our dataset, PY_start = Publication year starting.

References

  1. Obeidat, F. A Comprehensive Review of Future Photovoltaic Systems. Sol. Energy 2018, 163, 545–551. [Google Scholar] [CrossRef]
  2. Criqui, P.; Mima, S. European Climate-Energy Security Nexus: A Model Based Scenario Analysis. Energy Policy 2012, 41, 827–842. [Google Scholar] [CrossRef] [Green Version]
  3. Al-Shetwi, A.Q.; Sujod, M.Z. Grid-Connected Photovoltaic Power Plants: A Review of the Recent Integration Requirements in Modern Grid Codes. Int. J. Energy Res. 2018, 42, 1849–1865. [Google Scholar] [CrossRef]
  4. Kabir, E.; Kumar, P.; Kumar, S.; Adelodun, A.A.; Kim, K.H. Solar Energy: Potential and Future Prospects. Renew. Sustain. Energy Rev. 2018, 82, 894–900. [Google Scholar] [CrossRef]
  5. Kent, R. Renewables. Plast. Eng. 2018, 74, 56–57. [Google Scholar] [CrossRef]
  6. International Renewable Energy Agency. Renewable Power Generation Costs in 2019; IRENA: Abu Dhabi, United Arab Emirates, 2020; ISBN 978-92-9260-244-4. [Google Scholar]
  7. Yang, Y.; Zhou, K.; Blaabjerg, F. Current Harmonics from Single-Phase Grid-Connected Inverters-Examination and Suppression. IEEE J. Emerg. Sel. Top. Power Electron. 2016, 4, 221–233. [Google Scholar] [CrossRef] [Green Version]
  8. Phuangpornpitak, N.; Kumar, S. PV Hybrid Systems for Rural Electrification in Thailand. Renew. Sustain. Energy Rev. 2007, 11, 1530–1543. [Google Scholar] [CrossRef]
  9. Mandelli, S.; Barbieri, J.; Mereu, R.; Colombo, E. Off-Grid Systems for Rural Electrification in Developing Countries: Definitions, Classification and a Comprehensive Literature Review. Renew. Sustain. Energy Rev. 2016, 58, 1621–1646. [Google Scholar] [CrossRef]
  10. Ding, M.; Xu, Z.; Wang, W.; Wang, X.; Song, Y.; Chen, D. A Review on China’s Large-Scale PV Integration: Progress, Challenges and Recommendations. Renew. Sustain. Energy Rev. 2016, 53, 639–652. [Google Scholar] [CrossRef]
  11. Belter, C.W.; Seidel, D.J. A Bibliometric Analysis of Climate Engineering Research. Wiley Interdiscip. Rev. Clim. Change 2013, 4, 417–427. [Google Scholar] [CrossRef]
  12. Zhang, Y.; Zhu, S.; Sparks, R.; Green, I. Impacts of Solar PV Generators on Power System Stability and Voltage Performance. IEEE Power Energy Soc. Gen. Meet. 2012, 1–7. [Google Scholar] [CrossRef]
  13. Emmanuel, K.; Antonis, T.; Katsigiannis, Y.; Moschakis, M. Impact of Increased RES Generation on Power Systems Dynamic Performance. Mater. Sci. Forum 2012, 721, 185–190. [Google Scholar] [CrossRef]
  14. Tamimi, B.; Canizares, C.; Bhattacharya, K. System Stability Impact of Large-Scale and Distributed Solar Photovoltaic Generation: The Case of Ontario, Canada. IEEE Trans. Sustain. Energy 2013, 4, 680–688. [Google Scholar] [CrossRef]
  15. Liu, H.; Jin, L.; Le, D.; Chowdhury, A.A. Impact of High Penetration of Solar Photovoltaic Generation on Power System Small Signal Stability. In Proceedings of the 2010 International Conference on Power System Technology: Technological Innovations Making Power Grid Smarter (POWERCON2010), Zhejiang, China, 24–28 October 2010. [Google Scholar] [CrossRef]
  16. Hasheminamin, M.; Agelidis, V.G.; Salehi, V.; Teodorescu, R.; Hredzak, B. Index-Based Assessment of Voltage Rise and Reverse Power Flow Phenomena in a Distribution Feeder under High PV Penetration. IEEE J. Photovolt. 2015, 5, 1158–1168. [Google Scholar] [CrossRef]
  17. El-Khattam, W.; Salama, M.M.A. Distributed Generation Technologies, Definitions and Benefits. Electr. Power Syst. Res. 2004, 71, 119–128. [Google Scholar] [CrossRef]
  18. Ackermann, T.; Andersson, G.; Söder, L. Distributed Generation: A Definition. Electr. Power Syst. Res. 2001, 57, 195–204. [Google Scholar] [CrossRef]
  19. Aghaei Chadegani, A.; Salehi, H.; Md Yunus, M.M.; Farhadi, H.; Fooladi, M.; Farhadi, M.; Ale Ebrahim, N. A Comparison between Two Main Academic Literature Collections: Web of Science and Scopus Databases. Asian Soc. Sci. 2013, 9, 18–26. [Google Scholar] [CrossRef] [Green Version]
  20. Cabeza, L.F.; Chàfer, M.; Mata, É. Comparative Analysis of Web of Science and Scopus on the Energy Efficiency and Climate Impact of Buildings. Energies 2020, 13, 409. [Google Scholar] [CrossRef] [Green Version]
  21. Hudson, R.; Heilscher, G. PV Grid Integration—System Management Issues and Utility Concerns. Energy Procedia 2012, 25, 82–92. [Google Scholar] [CrossRef] [Green Version]
  22. Nwaigwe, K.N.; Mutabilwa, P.; Dintwa, E. An Overview of Solar Power (PV Systems) Integration into Electricity Grids. Mater. Sci. Energy Technol. 2019, 2, 629–633. [Google Scholar] [CrossRef]
  23. Anzalchi, A.; Sarwat, A. Overview of Technical Specifications for Grid-Connected Photovoltaic Systems. Energy Convers. Manag. 2017, 152, 312–327. [Google Scholar] [CrossRef]
  24. Hariri, M.H.M.; Mat Desa, M.K.; Masri, S.; Zainuri, M.A.A.M. Grid-Connected PV Generation System-Components and Challenges: A Review. Energies 2020, 13, 4279. [Google Scholar] [CrossRef]
  25. Jana, J.; Saha, H.; Das Bhattacharya, K. A Review of Inverter Topologies for Single-Phase Grid-Connected Photovoltaic Systems. Renew. Sustain. Energy Rev. 2017, 72, 1256–1270. [Google Scholar] [CrossRef]
  26. Zeb, K.; Khan, I.; Uddin, W.; Khan, M.A.; Sathishkumar, P.; Busarello, T.D.C.; Ahmad, I.; Kim, H.J. A Review on Recent Advances and Future Trends of Transformerless Inverter Structures for Single-Phase Grid-Connected Photovoltaic Systems. Energies 2018, 11, 1968. [Google Scholar] [CrossRef] [Green Version]
  27. Shayestegan, M.; Shakeri, M.; Abunima, H.; Reza, S.M.S.; Akhtaruzzaman, M.; Bais, B.; Mat, S.; Sopian, K.; Amin, N. An Overview on Prospects of New Generation Single-Phase Transformerless Inverters for Grid-Connected Photovoltaic (PV) Systems. Renew. Sustain. Energy Rev. 2018, 82, 515–530. [Google Scholar] [CrossRef]
  28. Rahim, N.A.; Saidur, R.; Solangi, K.H.; Othman, M.; Amin, N. Survey of Grid-Connected Photovoltaic Inverters and Related Systems. Clean Technol. Environ. Policy 2012, 14, 521–533. [Google Scholar] [CrossRef]
  29. Hassaine, L.; Olias, E.; Quintero, J.; Salas, V. Overview of Power Inverter Topologies and Control Structures for Grid Connected Photovoltaic Systems. Renew. Sustain. Energy Rev. 2014, 30, 796–807. [Google Scholar] [CrossRef]
  30. Haque, M.M.; Wolfs, P. A Review of High PV Penetrations in LV Distribution Networks: Present Status, Impacts and Mitigation Measures. Renew. Sustain. Energy Rev. 2016, 62, 1195–1208. [Google Scholar] [CrossRef]
  31. Karimi, M.; Mokhlis, H.; Naidu, K.; Uddin, S.; Bakar, A.H.A. Photovoltaic Penetration Issues and Impacts in Distribution Network—A Review. Renew. Sustain. Energy Rev. 2016, 53, 594–605. [Google Scholar] [CrossRef]
  32. Du, H.; Li, N.; Brown, M.A.; Peng, Y.; Shuai, Y. A Bibliographic Analysis of Recent Solar Energy Literatures: The Expansion and Evolution of a Research Field. Renew. Energy 2014, 66, 696–706. [Google Scholar] [CrossRef]
  33. de Paulo, A.F.; Porto, G.S. Solar Energy Technologies and Open Innovation: A Study Based on Bibliometric and Social Network Analysis. Energy Policy 2017, 108, 228–238. [Google Scholar] [CrossRef]
  34. David, T.M.; Silva Rocha Rizol, P.M.; Guerreiro Machado, M.A.; Buccieri, G.P. Future Research Tendencies for Solar Energy Management Using a Bibliometric Analysis, 2000–2019. Heliyon 2020, 6, e04452. [Google Scholar] [CrossRef]
  35. Mustapha, A.N.; Onyeaka, H.; Omoregbe, O.; Ding, Y.; Li, Y. Latent Heat Thermal Energy Storage: A Bibliometric Analysis Explicating the Paradigm from 2000–2019. J. Energy Storage 2021, 33, 102027. [Google Scholar] [CrossRef]
  36. Calderón, A.; Barreneche, C.; Hernández-Valle, K.; Galindo, E.; Segarra, M.; Fernández, A.I. Where Is Thermal Energy Storage (TES) Research Going?—A Bibliometric Analysis. Sol. Energy 2020, 200, 37–50. [Google Scholar] [CrossRef]
  37. Tarragona, J.; de Gracia, A.; Cabeza, L.F. Bibliometric Analysis of Smart Control Applications in Thermal Energy Storage Systems. A Model Predictive Control Approach. J. Energy Storage 2020, 32, 101704. [Google Scholar] [CrossRef]
  38. Chen, Q.; Wang, Y.; Zhang, J.; Wang, Z. The Knowledge Mapping of Concentrating Solar Power Development Based on Literature Analysis Technology. Energies 2020, 13, 1988. [Google Scholar] [CrossRef]
  39. Saikia, K.; Vallès, M.; Fabregat, A.; Saez, R.; Boer, D. A Bibliometric Analysis of Trends in Solar Cooling Technology. Sol. Energy 2020, 199, 100–114. [Google Scholar] [CrossRef]
  40. Barbosa, F.G.; Schneck, F. Characteristics of the Top-Cited Papers in Species Distribution Predictive Models. Ecol. Model. 2015, 313, 77–83. [Google Scholar] [CrossRef]
  41. Tan, J.; Fu, H.-Z.; Ho, Y.-S. A Bibliometric Analysis of Research on Proteomics in Science Citation Index Expanded. Scientometrics 2014, 98, 1473–1490. [Google Scholar] [CrossRef]
  42. Grant, M.J.; Booth, A. A Typology of Reviews: An Analysis of 14 Review Types and Associated Methodologies. Health Inf. Libr. J. 2009, 26, 91–108. [Google Scholar] [CrossRef]
  43. Pickering, C.; Byrne, J. The Benefits of Publishing Systematic Quantitative Literature Reviews for PhD Candidates and Other Early-Career Researchers. High. Educ. Res. Dev. 2014, 33, 534–548. [Google Scholar] [CrossRef] [Green Version]
  44. Wang, C.; Lim, M.K.; Zhao, L.; Tseng, M.L.; Chien, C.F.; Lev, B. The Evolution of Omega—The International Journal of Management Science over the Past 40 Years: A Bibliometric Overview. Omega 2020, 93, 102098. [Google Scholar] [CrossRef]
  45. Van Leeuwen, T.; Costas, R. The role of editorial material in bibliometric research performance assessments. Scientometrics 2013, 95, 817–828. [Google Scholar] [CrossRef]
  46. Garfield, E. Is Citation Analysis a Legitimate Evaluation Tool? Scientometrics 1979, 1, 359–375. [Google Scholar] [CrossRef]
  47. Beerkens, M. Facts and Fads in Academic Research Management: The Effect of Management Practices on Research Productivity in Australia. Res. Policy 2013, 42, 1679–1693. [Google Scholar] [CrossRef]
  48. Zhang, G.; Xie, S.; Ho, Y.S. A Bibliometric Analysis of World Volatile Organic Compounds Research Trends. Scientometrics 2010, 83, 477–492. [Google Scholar] [CrossRef]
  49. Zhou, F.; Guo, H.C.; Ho, Y.S.; Wu, C.Z. Scientometric Analysis of Geostatistics Using Multivariate Methods. Scientometrics 2007, 73, 265–279. [Google Scholar] [CrossRef]
  50. Merigó, J.M.; Yang, J. A Bibliometric Analysis of Operations Research and Management Science. Omega 2016, 73, 37–48. [Google Scholar] [CrossRef] [Green Version]
  51. Hirsch, J.E. An Index to Quantify an Individual’s Scientific Research Output. Proc. Natl. Acad. Sci. USA 2005, 102, 16569–16572. [Google Scholar] [CrossRef] [Green Version]
  52. Alonso, S.; Cabrerizo, F.J.; Herrera-viedma, E.; Herrera, F. H-Index: A Review Focused in Its Variants, Computation and Standardization for Different Scientific Fields. J. Informetr. 2009, 3, 273–289. [Google Scholar] [CrossRef] [Green Version]
  53. Egghe, L. Mathematical Theory of the H- and g-Index in Case of fractional counting of authorship. J. Am. Soc. Inf. Sci. Technol. 2008, 59, 1608–1616. [Google Scholar] [CrossRef]
  54. Hirsch, J.E. An Index to Quantify an Individual’s Scientific Research Output That Takes into Account the Effect of Multiple Coauthorship. Scientometrics 2010, 85, 741–754. [Google Scholar] [CrossRef] [Green Version]
  55. Zupic, I. Bibliometric Methods in Management and Organization. Organ. Res. Methods 2015, 18, 429–472. [Google Scholar] [CrossRef]
  56. Choudhri, A.F.; Siddiqui, A.; Khan, N.R.; Cohen, H.L. Understanding Bibliometric Parameters and Analysis. RadioGraphics 2015, 35, 736–746. [Google Scholar] [CrossRef] [Green Version]
  57. Norouzi, M.; Chàfer, M.; Cabeza, L.F.; Jiménez, L.; Boer, D. Circular Economy in the Building and Construction Sector: A Scientific Evolution Analysis. J. Build. Eng. 2021, 44, 102704. [Google Scholar] [CrossRef]
  58. Aria, M.; Cuccurullo, C. Bibliometrix: An R-Tool for Comprehensive Science Mapping Analysis. J. Informetr. 2017, 11, 959–975. [Google Scholar] [CrossRef]
  59. Hu, G.; Wang, L.; Ni, R.; Liu, W. Which H-Index? An Exploration within the Web of Science. Scientometrics 2020, 123, 1225–1233. [Google Scholar] [CrossRef]
  60. Zhao, X.; Wang, S.; Wang, X. Characteristics and Trends of Research on New Energy Vehicle Reliability Based on the Web of Science. Sustainability 2018, 10, 3560. [Google Scholar] [CrossRef] [Green Version]
  61. Li, K.; Rollins, J.; Yan, E. Web of Science Use in Published Research and Review Papers 1997–2017: A Selective, Dynamic, Cross-Domain, Content-Based Analysis. Scientometrics 2017, 115, 1–20. [Google Scholar] [CrossRef] [Green Version]
  62. Van Eck, N.J.; Waltman, L. Software Survey: VOSviewer, a Computer Program for Bibliometric Mapping. Scientometrics 2010, 84, 523–538. [Google Scholar] [CrossRef] [Green Version]
  63. Eck, N.J.; Waltman, L. Citation-Based Clustering of Publications Using CitNetExplorer and VOSviewer. Scientometrics 2017, 111, 1053–1070. [Google Scholar] [CrossRef] [Green Version]
  64. Alagh, Y.K. India 2020. J. Quant. Econ. 2006, 4, 1–14. [Google Scholar] [CrossRef]
  65. Global Energy Review 2020; International Energy Agency: Paris, France, 2021; pp. 1–36.
  66. IEA; NITI Aayog. Renewables Integration Report in India; IEA: Paris, France, 2021. [Google Scholar]
  67. CEEW. Unlocking the Economic Potential of Rooftop Solar PV in India; IEA: Paris, France, 2021. [Google Scholar]
  68. European Commission. The European Green Deal; European Commission: Brussels, Belgium, 2019; p. 24. [Google Scholar] [CrossRef]
  69. European Commission. The Hydrogen Strategy for a Climate-Neutral Europe; European Commission: Brussels, Belgium, 2015; pp. 1689–1699. [Google Scholar]
  70. European Commission. Powering a Climate-Neutral Economy: An EU Strategy for Energy System Integration EN; European Commission: Brussels, Belgium, 2020; pp. 54–67. [Google Scholar]
  71. Van Eck, N.J.; Waltman, L. Manual for VOSviwer Version 1.6.10. CWTS Mean. Metr. 2019, 523–538, 1–53. [Google Scholar]
  72. Darko, A.; Chan, A.P.C.; Huo, X.; Owusu-Manu, D.G. A Scientometric Analysis and Visualization of Global Green Building Research. Build. Environ. 2019, 149, 501–511. [Google Scholar] [CrossRef]
  73. Kharrazi, A.; Sreeram, V.; Mishra, Y. Assessment Techniques of the Impact of Grid-Tied Rooftop Photovoltaic Generation on the Power Quality of Low Voltage Distribution Network—A Review. Renew. Sustain. Energy Rev. 2020, 120, 109643. [Google Scholar] [CrossRef]
  74. Ali, M.S.; Haque, M.M.; Wolfs, P. A Review of Topological Ordering Based Voltage Rise Mitigation Methods for LV Distribution Networks with High Levels of Photovoltaic Penetration. Renew. Sustain. Energy Rev. 2019, 103, 463–476. [Google Scholar] [CrossRef]
  75. Parchure, A.; Tyler, S.J.; Peskin, M.A.; Rahimi, K.; Broadwater, R.P.; Dilek, M. Investigating PV Generation Induced Voltage Volatility for Customers Sharing a Distribution Service Transformer. IEEE Trans. Ind. Appl. 2017, 53, 71–79. [Google Scholar] [CrossRef]
  76. Vazquez, S.; Lukic, S.M.; Galvan, E.; Franquelo, L.G.; Carrasco, J.M. Energy Storage Systems for Transport and Grid Applications. IEEE Trans. Ind. Electron. 2010, 57, 3881–3895. [Google Scholar] [CrossRef] [Green Version]
  77. Carrasco, J.M.; Franquelo, L.G.; Bialasiewicz, J.T.; Galván, E.; Portillo Guisado, R.C.; Prats, M.Á.M.; León, J.I.; Moreno-Alfonso, N. Power-Electronic Systems for the Grid Integration of Renewable Energy Sources: A Survey. IEEE Trans. Ind. Electron. 2006, 53, 1002–1016. [Google Scholar] [CrossRef]
  78. Jung, J.; Onen, A.; Arghandeh, R.; Broadwater, R.P. Coordinated Control of Automated Devices and Photovoltaic Generators for Voltage Rise Mitigation in Power Distribution Circuits. Renew. Energy 2014, 66, 532–540. [Google Scholar] [CrossRef]
  79. Jazayeri, M.; Jazayeri, K.; Uysal, S. Adaptive Photovoltaic Array Reconfiguration Based on Real Cloud Patterns to Mitigate Effects of Non-Uniform Spatial Irradiance Profiles. Sol. Energy 2017, 155, 506–516. [Google Scholar] [CrossRef]
  80. Selvakumar, S.; Madhusmita, M.; Koodalsamy, C.; Simon, S.P.; Sood, Y.R. High-Speed Maximum Power Point Tracking Module for PV Systems. IEEE Trans. Ind. Electron. 2019, 66, 1119–1129. [Google Scholar] [CrossRef]
  81. Karatepe, E.; Hiyama, T.; Boztepe, M.; Çolak, M. Voltage Based Power Compensation System for Photovoltaic Generation System under Partially Shaded Insolation Conditions. Energy Convers. Manag. 2008, 49, 2307–2316. [Google Scholar] [CrossRef]
  82. Elkhateb, A.; Rahim, N.A.; Selvaraj, J.; Uddin, M.N. Fuzzy-Logic-Controller-Based SEPIC Converter for Maximum Power Point Tracking. IEEE Trans. Ind. Applicat. 2014, 50, 2349–2358. [Google Scholar] [CrossRef]
  83. Sen, T.; Pragallapati, N.; Agarwal, V.; Kumar, R. Global Maximum Power Point Tracking of PV Arrays under Partial Shading Conditions Using a Modified Particle Velocity-based PSO Technique. IET Renew. Power Gener. 2018, 12, 555–564. [Google Scholar] [CrossRef]
  84. Optimized Fuzzy Controller for MPPT of Grid-Connected PV Systems in Rapidly Changing Atmospheric. Available online: https://ieeexplore.ieee.org/document/9096502 (accessed on 24 May 2022).
  85. Murty, V.; Kumar, A. Multi-Objective Energy Management in Microgrids with Hybrid Energy Sources and Battery Energy Storage Systems. Prot. Control. Mod. Power Syst. 2020, 5, 2. [Google Scholar] [CrossRef] [Green Version]
  86. Atwa, Y.M.; El-Saadany, E.F.; Salama, M.M.A.; Seethapathy, R. Optimal Renewable Resources Mix for Distribution System Energy Loss Minimization. IEEE Trans. Power Syst. 2010, 25, 360–370. [Google Scholar] [CrossRef]
  87. Marzband, M.; Ghazimirsaeid, S.S.; Uppal, H.; Fernando, T. A Real-Time Evaluation of Energy Management Systems for Smart Hybrid Home Microgrids. Electr. Power Syst. Res. 2017, 143, 624–633. [Google Scholar] [CrossRef]
  88. Zhao, Y.S.; Zhan, J.; Zhang, Y.; Wang, D.P.; Zou, B.G. The Optimal Capacity Configuration of an Independent Wind/PV Hybrid Power Supply System Based on Improved PSO Algorithm. In Proceedings of the 8th International Conference on Advances in Power System Control, Operation and Management (APSCOM 2009), Hong Kong, China, 8–11 November 2009; pp. 1–7. [Google Scholar] [CrossRef]
  89. Ben Jemaa, A.; Essounbouli, N.; Hamzaoui, A. Optimum Sizing of Hybrid PV/Wind/Battery Installation Using a Fuzzy PSO. In Proceedings of the 3rd International Symposium on Environment Friendly Energies and Applications (EFEA), Paris, France, 19–21 November 2014. [Google Scholar] [CrossRef]
  90. Celik, A.N. Optimisation and Techno-Economic Analysis of Autonomous Photovoltaic-Wind Hybrid Energy Systems in Comparison to Single Photovoltaic and Wind Systems. Energy Convers. Manag. 2002, 43, 2453–2468. [Google Scholar] [CrossRef]
  91. Markvart, T. Sizing of Hybrid Photovoltaic-Wind. Sol. Energy 1997, 51, 277–281. [Google Scholar]
  92. Diaf, S.; Diaf, D.; Belhamel, M.; Haddadi, M.; Louche, A. A Methodology for Optimal Sizing of Autonomous Hybrid PV/Wind System. Energy Policy 2007, 35, 5708–5718. [Google Scholar] [CrossRef] [Green Version]
  93. Terra, G.L.; Salvina, G.; Tina, G.M. Optimal Sizing Procedure for Hybrid Solar Wind Power System by Fuzzy Logic. J. Sol. Energy Eng. Trans. ASME 2002, 124, 77–82. [Google Scholar] [CrossRef]
  94. Ngan, M.S.; Tan, C.W. Assessment of Economic Viability for PV/Wind/Diesel Hybrid Energy System in Southern Peninsular Malaysia. Renew. Sustain. Energy Rev. 2012, 16, 634–647. [Google Scholar] [CrossRef]
  95. Li, C.; Ge, X.; Zheng, Y.; Xu, C.; Ren, Y.; Song, C.; Yang, C. Techno-Economic Feasibility Study of Autonomous Hybrid Wind/PV/Battery Power System for a Household in Urumqi, China. Energy 2013, 55, 263–272. [Google Scholar] [CrossRef]
  96. Hiendro, A.; Kurnianto, R.; Rajagukguk, M.; Simanjuntak, Y.M. Junaidi Techno-Economic Analysis of Photovoltaic/Wind Hybrid System for Onshore/Remote Area in Indonesia. Energy 2013, 59, 652–657. [Google Scholar] [CrossRef]
  97. Hafez, O.; Bhattacharya, K. Optimal Planning and Design of a Renewable Energy Based Supply System for Microgrids. Renew. Energy 2012, 45, 7–15. [Google Scholar] [CrossRef]
  98. Chel, A.; Kaushik, G. Renewable Energy Technologies for Sustainable Development of Energy Efficient Building. Alex. Eng. J. 2018, 57, 655–669. [Google Scholar] [CrossRef]
  99. Qazi, A.; Hussain, F.; Rahim, N.A.B.D.; Hardaker, G.; Alghazzawi, D.; Shaban, K.; Haruna, K. Towards Sustainable Energy: A Systematic Review of Renewable Energy Sources, Technologies, and Public Opinions. IEEE Access 2019, 7, 63837–63851. [Google Scholar] [CrossRef]
  100. Strielkowski, W.; Civín, L.; Tarkhanova, E.; Tvaronavičienė, M.; Petrenko, Y. Renewable Energy in the Sustainable Development of Electrical Power Sector: A Review. Energies 2021, 14, 8240. [Google Scholar] [CrossRef]
  101. Gökgöz, F.; Güvercin, M.T. Energy Security and Renewable Energy Efficiency in EU. Renew. Sustain. Energy Rev. 2018, 96, 226–239. [Google Scholar] [CrossRef]
  102. Dincer, I. Renewable Energy and Sustainable Development: A Crucial Review. Renew. Sustain. Energy Rev. 2000, 4, 157–175. [Google Scholar] [CrossRef]
  103. Østergaard, P.A.; Duic, N.; Noorollahi, Y.; Mikulcic, H.; Kalogirou, S. Sustainable Development Using Renewable Energy Technology. Renew. Energy 2020, 146, 2430–2437. [Google Scholar] [CrossRef]
  104. Casteleiro-Roca, J.L.; Vivas, F.J.; Segura, F.; Barragán, A.J.; Calvo-Rolle, J.L.; Andújar, J.M. Hybrid Intelligent Modelling in Renewable Energy Sources-Based Microgrid. A Variable Estimation of the Hydrogen Subsystem Oriented to the Energy Management Strategy. Sustainability 2020, 12, 10566. [Google Scholar] [CrossRef]
  105. Moncecchi, M.; Brivio, C.; Mandelli, S.; Merlo, M. Battery Energy Storage Systems in Microgrids: Modeling and Design Criteria. Energies 2020, 13, 2006. [Google Scholar] [CrossRef] [Green Version]
  106. Kong, L.; Yu, J.; Cai, G. Modeling, Control and Simulation of a Photovoltaic /Hydrogen/ Supercapacitor Hybrid Power Generation System for Grid-Connected Applications. Int. J. Hydrogen Energy 2019, 44, 25129–25144. [Google Scholar] [CrossRef]
  107. Lajnef, T.; Abid, S.; Ammous, A. Modeling, Control, and Simulation of a Solar Hydrogen/Fuel Cell Hybrid Energy System for Grid-Connected Applications. Adv. Power Electron. 2013, 2013, 352765. [Google Scholar] [CrossRef] [Green Version]
  108. Sensorless PV Power Forecasting in Grid-Connected Buildings through Deep Learning—PubMed. Available online: https://pubmed.ncbi.nlm.nih.gov/30072641/ (accessed on 25 May 2022).
  109. Paulescu, M.; Brabec, M.; Boata, R.; Badescu, V. Structured, Physically Inspired (Gray Box) Models versus Black Box Modeling for Forecasting the Output Power of Photovoltaic Plants. Energy 2017, 121, 792–802. [Google Scholar] [CrossRef]
  110. Wang, K.; Qi, X.; Liu, H. Photovoltaic Power Forecasting Based LSTM-Convolutional Network. Energy 2019, 189, 116225. [Google Scholar] [CrossRef]
  111. Metwaly, M.K.; Teh, J. Probabilistic Peak Demand Matching by Battery Energy Storage Alongside Dynamic Thermal Ratings and Demand Response for Enhanced Network Reliability. IEEE Access 2020, 8, 181547–181559. [Google Scholar] [CrossRef]
  112. Emad, D.; El-Hameed, M.A.; El-Fergany, A.A. Optimal Techno-Economic Design of Hybrid PV/Wind System Comprising Battery Energy Storage: Case Study for a Remote Area. Energy Convers. Manag. 2021, 249, 114847. [Google Scholar] [CrossRef]
  113. Berrueta, A.; Heck, M.; Jantsch, M.; Ursúa, A.; Sanchis, P. Combined Dynamic Programming and Region-Elimination Technique Algorithm for Optimal Sizing and Management of Lithium-Ion Batteries for Photovoltaic Plants. Appl. Energy 2018, 228, 1–11. [Google Scholar] [CrossRef]
  114. Beck, T.; Kondziella, H.; Huard, G.; Bruckner, T. Optimal Operation, Configuration and Sizing of Generation and Storage Technologies for Residential Heat Pump Systems in the Spotlight of Self-Consumption of Photovoltaic Electricity. Appl. Energy 2017, 188, 604–619. [Google Scholar] [CrossRef]
  115. Mokhtara, C.; Negrou, B.; Bouferrouk, A.; Yao, Y.; Settou, N.; Ramadan, M. Integrated Supply–Demand Energy Management for Optimal Design of off-Grid Hybrid Renewable Energy Systems for Residential Electrification in Arid Climates. Energy Convers. Manag. 2020, 221, 113192. [Google Scholar] [CrossRef]
  116. Tomar, V.; Tiwari, G.N. Techno-Economic Evaluation of Grid Connected PV System for Households with Feed in Tariff and Time of Day Tariff Regulation in New Delhi—A Sustainable Approach. Renew. Sustain. Energy Rev. 2017, 70, 822–835. [Google Scholar] [CrossRef]
  117. Coppitters, D.; De Paepe, W.; Contino, F. Robust Design Optimization and Stochastic Performance Analysis of a Grid-Connected Photovoltaic System with Battery Storage and Hydrogen Storage. Energy 2020, 213, 118798. [Google Scholar] [CrossRef]
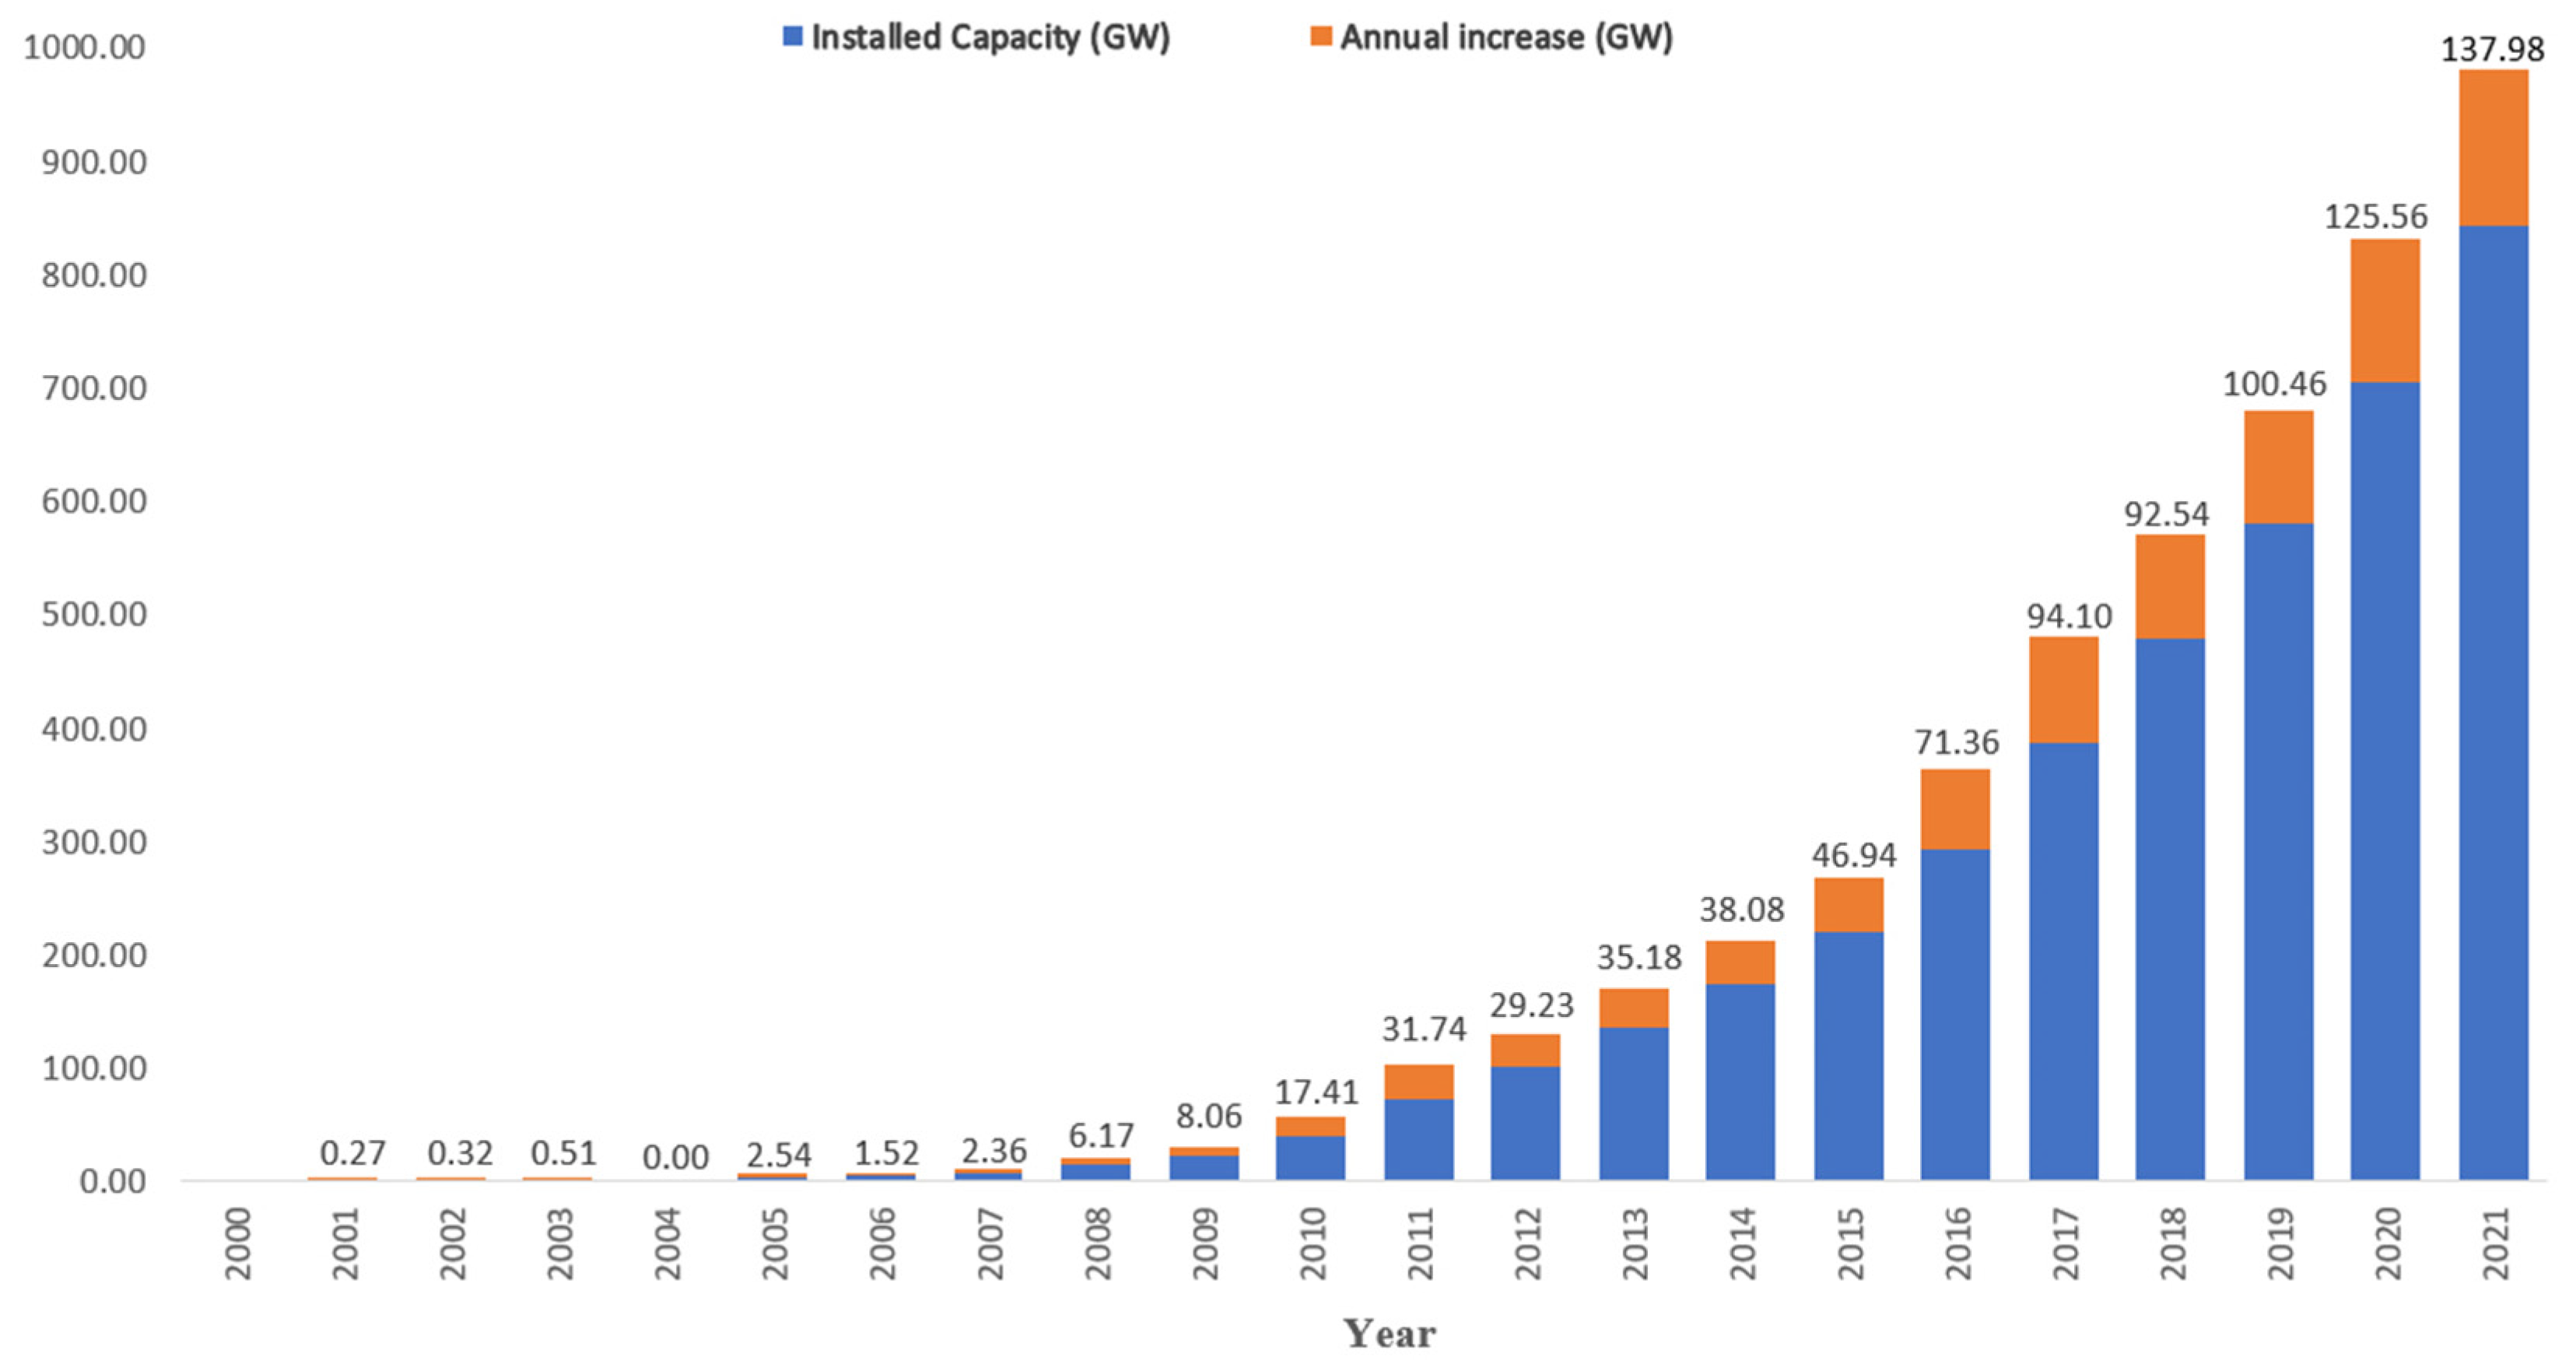
Figure 1. Evolution of solar PV accumulated installed capacity over the last two decades, including the annual increase (orange).
Sustainability 14 09249 g001
Figure 2. The methodological framework of the bibliometric analysis.
Sustainability 14 09249 g002
Figure 3. Evolution in the number of publications and the number of citations related to the integration of solar PV systems into power networks during 2000–2021.
Sustainability 14 09249 g003
Figure 4. Co-authorship interaction between countries in the integration of solar PV systems into power networks during 2000–2021.
Sustainability 14 09249 g004
Figure 5. Co-authorship interaction of the European countries in the integration of solar PV systems into power networks during 2000–2021.
Sustainability 14 09249 g005
Figure 6. Collaboration network of institutions in the integration of solar PV systems into power networks during 2000–2021.
Sustainability 14 09249 g006
Figure 7. Time evolution of the top 15 authors in the integration of solar PV systems into power networks during 2000–2021.
Sustainability 14 09249 g007
Figure 8. Map based on the co-occurrence of the authors’ keywords in the integration of solar PV systems into power networks during 2000–2021.
Sustainability 14 09249 g008
Figure 9. Map based on authors’ keywords for trending topics in the integration of solar PV systems into power networks during 2000–2021.
Sustainability 14 09249 g009
Table 1. General information about the dataset collection of integration of solar PV systems into power networks during 2000–2021.
DescriptionResults
Type of documents
Journal articles3566
Proceedings papers3174
Review papers406
Sources (Journals)2074
Keywords plus3631
Author’s keywords14,242
Average citations per document15.49
Collaboration index2.52
Annual growth rate20.4%
Table 2. Top 15 publishing countries in the integration of solar PV systems into power networks during 2000–2021.
CountryTPTCSCPMCPTC/TP
India9929804918749.88
China75410,06760015413.35
USA59211,9434959720.17
Italy32460652606418.72
Spain28285732067630.40
Germany26846121977117.21
Australia25739741936415.46
Iran22258151734926.19
Malaysia17242711086424.83
Canada17135611215020.82
Japan1711507132398.81
United Kingdom15527141035217.51
France1331622963712.20
South Africa1301074102288.26
Korea1171907833416.30
TP = Total number of publications, TC = Total number of citations, TC/TP = Average citations per document, SCP = Single country publications, MCP = Multiple country publications.
Table 3. Top 15 source journals of the study in the integration of solar PV systems into power networks during 2000–2021.
SourcesTPTCTC/TPLocal
h-Index
IF
(2020)
IF
(5 Years)
Best Quartile
Energies32825297.71233.003.09Q1
Renewable & Sustainable Energy Reviews23715,82966.796414.9814.92Q1
Renewable Energy234854336.51538.007.44Q1
Applied Energy208794538.20469.759.95Q1
Energy193578529.97467.156.85Q1
Energy Conversion and Management137515337.61439.718.95Q1
International Journal of Hydrogen Energy112364232.52355.825.24Q1
IEEE Access976586.78153.373.67Q1
Sustainability885526.27143.253.47Q1
Solar Energy74304441.14274.675.62Q1
Journal of Cleaner Production71124617.55217.259.44Q1
International Journal of Electrical Power & Energy Systems67208831.16254.634.85Q1
Iet Renewable Power Generation66142521.59183.934.24Q2
International Journal of Renewable Energy Research663615.4710Q3
Energy Policy62188430.39256.146.58Q1
TP = Total number of publications, TC = Total number of citations, TC/TP = Average citations per document, Local h-index = h-index calculated from our dataset, IF (2020) = Impact Factor (2020 Journal Citation Reports®).
Publisher’s Note: MDPI stays neutral with regard to jurisdictional claims in published maps and institutional affiliations.