Article

Spatial Variation of Microbial Community Structure and Its Driving Environmental Factors in Two Forest Types in Permafrost Region of Greater Xing′an Mountains

1
College of Geographical Sciences, Harbin Normal University, Harbin 150025, China
2
Personnel Department, Harbin Normal University, Harbin 150025, China
*
Authors to whom correspondence should be addressed.
Sustainability 2022, 14(15), 9284; https://doi.org/10.3390/su14159284
Submission received: 29 June 2022 / Revised: 23 July 2022 / Accepted: 25 July 2022 / Published: 28 July 2022
(This article belongs to the Section Sustainable Forestry)

Abstract

:
Climate warming is accelerating permafrost degradation. Soil microorganisms play key roles in the maintenance of high-latitude permafrost regions and forest ecosystems’ functioning and regulation of biogeochemical cycles. In this study, we used Illumina MiSeq high-throughput sequencing to investigate soil bacterial community composition at a primeval Larix gmelinii forest and a secondary Betula platyphylla forest in a permafrost region of the Greater Xing’an Mountains. The Shannon diversity index tended to decrease and then increase with increasing soil depth, which was significantly higher in the L. gmelinii forest than in the B. platyphylla forest at 40–60 cm. Proteobacteria (19.86–29.68%), Acidobacteria (13.59–31.44%), Chloroflexi (11.04–27.19%), Actinobacteria (7.05–25.57%), Gemmatimonadetes (1.76–9.18%), and Verrucomicrobia (2.03–7.00%) were the predominant phyla of the bacterial community in two forest types. The relative abundance of Proteobacteria showed a decreasing trend in the B. platyphylla forest and an increasing trend in the L. gmelinii forest, whereas that of Chloroflexi increased and then decreased in the B. platyphylla forest and decreased in the L. gmelinii forest with increasing soil depth. The relative abundance of Acidobacteria was significantly higher in the B. platyphylla forest than in the L. gmelinii forest at 0–20 cm depth, whereas that of Actinobacteria was significantly higher in the L. gmelinii forest than in the B. platyphylla forest at 0–20 cm and 40–60 cm depth. Principal coordinate analysis (PCoA) and two-way analysis of variance (ANOVA) indicated that microbial community composition was more significantly influenced by forest type than soil depth. Redundancy analysis (RDA) showed that microbial community structure was strongly affected by soil physicochemical properties such as nitrate nitrogen (NO3−-N), pH, and total organic carbon (TOC). These results offer insights into the potential relationship between soil microbial community and forest conversion in high latitude permafrost ecosystems.

1. Introduction

High-latitude regions are experiencing the strongest warming effects of global climate change, leading to large-scale permafrost degradation and increases in annual average ground temperature and active layer thickness, which in turn has a significant impact on regional climate as well as hydrological and ecological processes [1]. Permafrost is an essential soil organic carbon reservoir worldwide, with its storage of soil organic carbon being approximately twice that of atmospheric carbon [2]. Climate warming will accelerate permafrost thawing, resulting in the continuous release of a large amount of soil organic carbon originally sealed in the low-temperature environment. In turn, the increased metabolic activity of soil microbes will strengthen the efficiency of organic carbon decomposition, resulting in the massive release of carbon-containing greenhouse gases, thus further exacerbating global warming and severely impacting cold region ecosystems [3,4].
Soil microbes are indispensable components of ecosystems and participate in the processes of soil material conversion and energy flow. Moreover, their functional and species diversity play key roles in maintaining ecosystem stability [5,6]. In forest ecosystems, soil microbes are closely related to aboveground vegetation [7]. Plants can change soil nutrients and water conditions through litter and root exudates, thus directly or indirectly affecting the soil microbial community structure and diversity. Moreover, soil microbes can participate in soil ecological processes through metabolic activities to provide the essential nutrient elements for plant growth and development [8,9]. Permafrost degradation can alter the hydrothermal environment and soil nutrient availability of forest ecosystems, accelerating the drying of lakes and swamps, the northward movement of forest lines, and the retrograde succession of vegetation, thus affecting the biogeochemical processes regulated and driven by soil microbes [10,11]. Consequently, research on the evolution of forest soil microbial communities in the context of permafrost degradation is critical for understanding the relationship among plants, soil, and microbes, thus providing a microbiological basis for model predictions of future climate scenarios.
The permafrost region of the Greater Xing’an Mountains is located on the southern margin of the Eurasian continent permafrost belt. This region is characterized by a thin permafrost layer, poor thermal stability, and an extremely vulnerable ecological environment. In addition to being the only cold-temperate coniferous forest area in China, it is also the most widespread and well-preserved ecosystem in this country and plays a significant role in regulating regional climate and water conservation [12]. Larix gmelinii forests constitute a typical zonal vegetation type and climax community of the forest ecosystem in the Greater Xing’an Mountains. Its root system is shallowly distributed and absorbs water mainly from frozen stagnant water. The cold and humid environment sustains the growth of L. gmelinii forests and the occurrence of permafrost [13]. Betula platyphylla is the widely distributed secondary forest as a pioneer species in this region, which accounts for 41.59% and 41.15% of the total forest stock and the total forest area, respectively [14]. In recent years, the southern boundary of permafrost in the region has shifted northward by approximately 50–120 km with the superposition of climate warming and human activities, resulting in a dramatic reduction in the native forest zone dominated by L. gmelinii and the replacement of the primeval L. gmelinii forests by secondary B. platyphylla forests. However, the adaptation mechanism of the subsurface microbial communities in the high-latitude permafrost regions in response to changes in aboveground vegetation remains unclear [15,16]. Therefore, we proposed two hypotheses: (1) there are differences in the soil microbial community composition between L. gmelinii and B. platyphylla forest, and shifts in the community structure may mean potential functional changes; and (2) soil chemical-physical properties would have substantial influences on the diversity and composition of the bacterial communities due to stratified soil abiotic conditions of different soil depths. In order to test the above hypotheses, we analyzed the spatial variation characteristics of soil microbial community structure and functional potential in high-latitude permafrost regions dominated by two dominant forest types using Illumina MiSeq high-throughput sequencing. The acquired data thus provides critical insights into the response and feedback mechanisms of permafrost ecosystems to climate change.

2. Materials and Methods

2.1. Study Area

The study site is located in the Huzhong National Natural Reserve in the Greater Xing’an Mountains, which is the only high-latitude continuous permafrost region in China, and exhibits a typical cold-temperate continental monsoon climate. The mean annual temperature is −4.4 °C, and the mean annual precipitation is 450–550 mm. The frost-free period is 80–90 d, and the snowpack-covered period is approximately 180–200 d [17]. The terrain is higher in the southwest and lower in the northeast and has a mean altitude of 812 m with an elevation range of 650 to 1200 m. The slopes are flat and are mostly less than 15°, with locally steep sunny slopes of up to 35°. Soils are mainly brown coniferous forest soils which are characterized by a brown or dark brown color, light texture, and mixing with a lot of gravel [18]. The typical vegetation of the region consists of coniferous forests dominated by Larix gmelinii. Additionally, Betula platyphylla, Pinus sylvestris var. mongolica, and Populus davidiana are also distributed in this area. The undergrowth vegetation mainly includes Rhododendron dauricum, Ledum palustre, and Vaccinium uliginosum.

2.2. Soil Sample Collection

Under the influence of global warming and human activities, the high-latitude permafrost region in the Greater and Lesser Xing’an Mountains has decreased from an area of 3.9 × 10⁵ km2 in the 1960s to 2.6 × 10⁵ km2 at present, with a total area reduction of approximately 35% [19]. The retrograde succession of vegetation occurs with the development of the permafrost degradation process, and this process significantly affects the plant community composition and diversity of the region. According to the ground temperature observation and forest survey data in 1959, 1979, 1995, 2003, and 2015 and based on repeated field explorations, primeval Larix gmelinii forest (52°12′19.1″ N, 123°20′27.2″ E, soil active layer thickness of 0.7 m) and the secondary Betula platyphylla forest (52°10′04.5″ N, 123°20′38.4″ E, soil active layer thickness of 1.3 m) sites with similar conditions were selected to set up fixed experimental plots of 100 m × 100 m along the permafrost degradation gradient. Three 10 m × 10 m sample plots were randomly established within the fixed experimental plots. Five soil samples from each plot (0–20 cm, 20–40 cm, and 40–60 cm depth) were randomly collected with soil augur (5 cm diameter). Three composite soil samples (regarded as subsamples) of each of the two forest types at three soil depths were obtained (for a total of eighteen subsamples as samples). Soil samples were immediately stored in sterile self-sealing bags, then labeled and placed in ice boxes to be transported to the laboratory. A portion (about 50 g) of these fresh samples was stored in the refrigerator at −80 °C for extraction of soil microbial DNA, whereas another portion (about 200 g) was air-dried and passed through a 2 mm sieve to determine the soil physical and chemical properties.

2.3. Determination of Soil Physical and Chemical Properties

Soil pH was determined by the potentiometric method using a pH meter (FE28) at a water-to-soil mass ratio of 2.5:1. Soil water content (SWC) was measured via the drying and weighing method. Soil total organic carbon (TOC) was determined using a Multi C/N 3100 (Jena, Germany) carbon and nitrogen analyzer. Soil samples had been pretreated by digestion, and the contents of total nitrogen (TN) and total phosphorus (TP) were determined using a SKALAR San++ continuous flow analyzer (Skalar, The Netherlands). Soil nitrate-nitrogen (NO3−-N) and ammonium nitrogen (NH4+-N) were extracted with 2 M KCl and their contents were determined using a SKALAR San++ continuous flow analyzer (Skalar, The Netherlands).

2.4. Soil Microbial Illumina Sequencing

Soil microbial DNA was extracted using the PowerSoil® DNA Isolation Kit (Mobio, AL, USA) and DNA concentration was determined using a NanoDrop 2000 spectrophotometer (Thermo Fisher Scientific, Wilmington, DE, USA). The V3–V4 hypervariable regions of bacterial 16S rRNA genes were amplified using the 338F (5′-ACTCCTACGGGAGGCAGCAG-3′) and 806R (5′-GGACTACHVGGGTWTCTAAT-3′) primers [20]. The PCR reactions were conducted using the following steps: initial denaturation at 95 °C for 3 min, 27 cycles of denaturation at 95 °C for 30 s, annealing at 55 °C for 30 s, and extension at 72 °C for 30 s, stable extension at 72 °C for 5 min, and storage at 4 °C. Each sample was replicated three times and mixed to reduce variability during DNA extraction. The PCR products were purified using the AxyPrep DNA Gel Extraction Kit (Axygen Biosciences, Union City, CA, USA) and quantified using a Quantifluor TM-ST Blue Fluorescence Quantification System (Promega Corporation, Madison, WI, USA). Sequencing libraries were constructed on the Illumina MiSeq PE300 platform by Majorbio Bioengineer Co., Ltd. (Shanghai, China).

2.5. Data Processing Analysis

The raw reads were quality-filtered using Fastp (v.0.19.6) (HaploX, Shenzhen, China), and operational taxonomic units (OTUs) at a 97% similarity threshold were identified using UPARSE (v.7.0.1090) (Robert C. Edgar, Tiburon, CA, USA). The sequences were compared to those in the SILVA bacterial 16S rRNA database using the RDP classifier (v.2.11) (University of Michigan, Ann Arbor, MI, USA), and the sequences were annotated for classification using Mothur (v.1.30.2) (University of Michigan, Ann Arbor, MI, USA) at each taxonomic level [21]. Based on the OTU cluster analysis results, the Chao1 richness index, Simpson dominance index, and Shannon-Weiner diversity index were calculated using Mothur (v.1.30.2) (University of Michigan, Ann Arbor, MI, USA). The significance of soil physicochemical properties and bacterial diversity estimates at different depths was identified via one-way analysis of variance (ANOVA) using SPSS (v.20.0) (IMB Corp, Armonk, NY, USA) [22]. Two-way analysis of variance (ANOVA) was performed to evaluate the effects of forest type, soil depth, and their interaction on alpha diversity indices and microbial community composition with SPSS (v.20.0) (IMB Corp, Armonk, NY, USA). Differences in community composition among sample groups were analyzed using QIIME (v.1.9.1) (J. Gregory Caporaso, Department of Chemistry and Biochemistry, University of Colorado, Boulder, CO, USA) and the R package vegan for principal coordinate analysis (PCoA) based on Bray-Curtis distances [23]. The relationship between microbial community species composition and soil environmental factors was analyzed by redundancy analysis (RDA) using Canoco (v.5.0) (Microcomputer Power, Ithaca, NY, USA) [24]. Tax4Fun analysis was performed to predict microbial functional profiling using an R package [25].

3. Results

3.1. Soil Physicochemical Properties

Soil pH ranged from 4.99 to 5.79, with a tendency to increase and then decrease with increasing soil depth in both forest types, which was significantly higher in the L. gmelinii forest than in the B. platyphylla forest at each soil depth (p < 0.05, Table 1). Soil total organic carbon (TOC) content was highest at BP20 (57.86 g/kg) and LG20 (39.27 g/kg), and was significantly higher at 0–20 cm and 20–40 cm depth in the B. platyphylla forest than that in the L. gmelinii forest (p < 0.05). Soil total nitrogen (TN) content decreased with increasing soil depth and differed significantly between different soil depths (p < 0.05). Soil total phosphorus (TP) content was significantly higher at 0–20 cm depth than at 20–40 cm and 40–60 cm depth (p < 0.05). Soil ammonium nitrogen (NH4+-N) content peaked at 40–60 cm depth. Soil nitrate nitrogen (NO3−-N) content was significantly higher in the B. platyphylla forest than in the L. gmelinii forest at each soil depth (p < 0.05). Soil water content (SWC) was highest at BP40 (36.21%) and LG20 (39.10%), and was significantly higher at 0–20 cm and 20–40 cm depth than at 40–60 cm depth (p < 0.05).

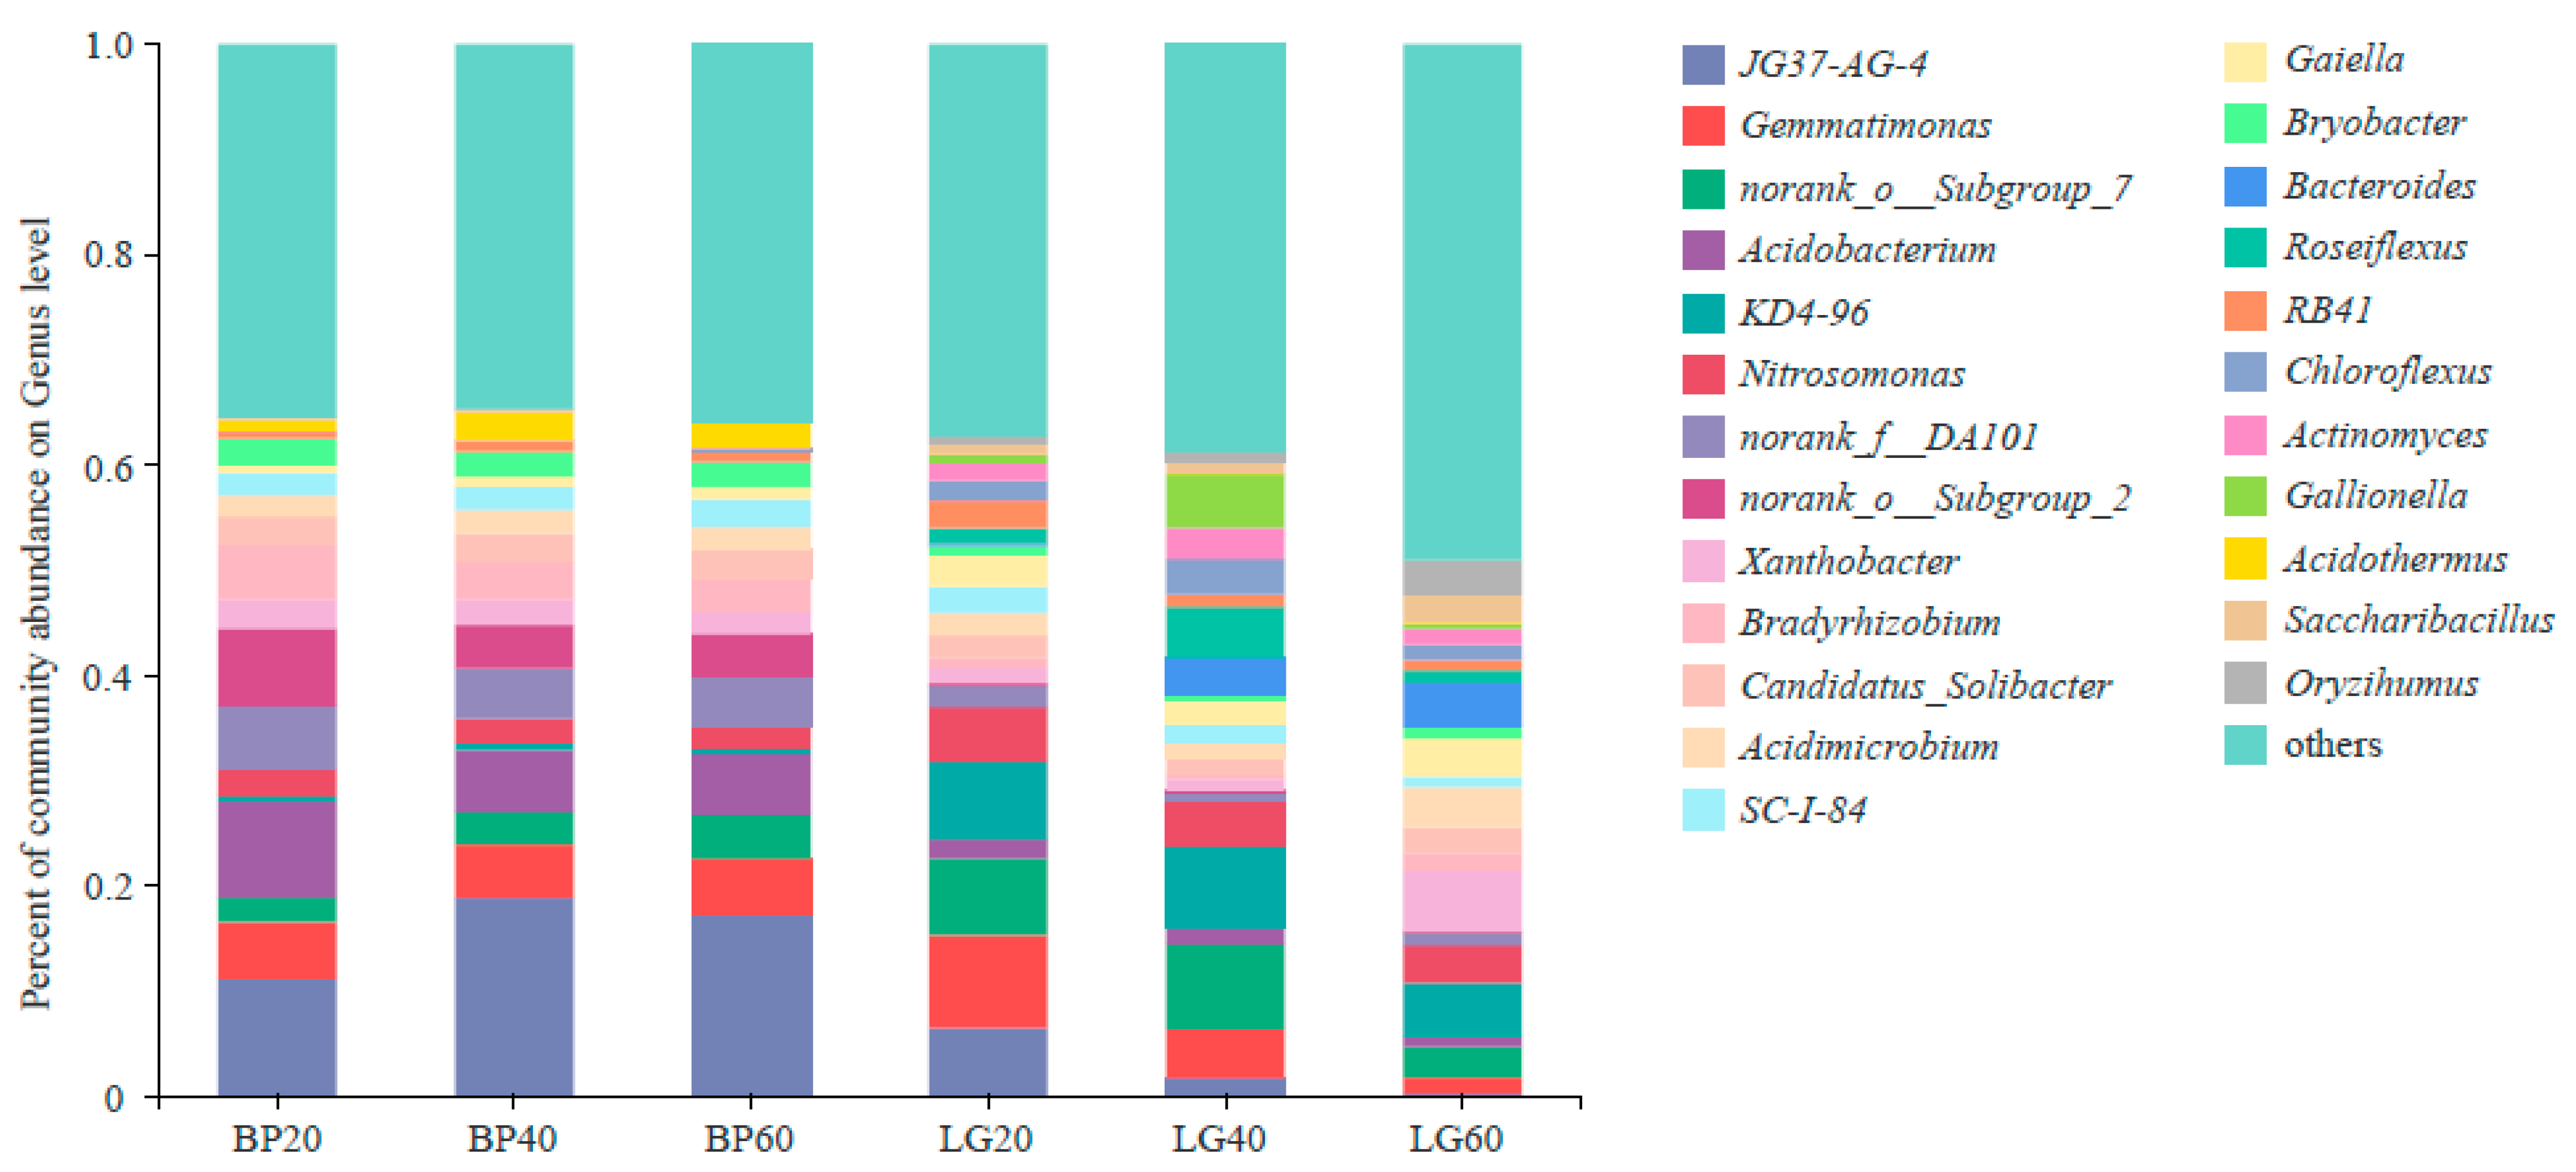
3.2. Composition of Soil Microbial Community

At the phylum level, there were fourteen phyla with relative abundances greater than 1%, of which the dominant phyla were Proteobacteria (19.86–29.68%), Acidobacteria (13.59–31.44%), Chloroflexi (11.04–27.19%), Actinobacteria (7.05–25.57%), Gemmatimonadetes (1.76–9.18%), and Verrucomicrobia (2.03–7.00%) (Figure 1). The relative abundance of Proteobacteria was highest at BP20 and LG60, with a decreasing trend in the B. platyphylla forest and an increasing trend in the L. gmelinii forest with increasing soil depth. The relative abundance of Acidobacteria was highest at BP20 and LG40, and higher in the B. platyphylla forest than in the L. gmelinii forest at each soil depth. The relative abundance of Chloroflexi was highest at BP40 and LG20, which increased and then decreased in the B. platyphylla forest and decreased in the L. gmelinii forest with increasing soil depth. The relative abundance of Actinobacteria was highest at BP40 and LG60, and higher in the L. gmelinii forest than in the B. platyphylla forest at each soil depth.
At the genus level, twenty-four genera with relative abundance greater than 1% were identified (Figure 2). Among them, the dominant genera in the B. platyphylla forest were JG37-AG-4 (11.07–18.83%), Gemmatimonas (5.06–5.44%), norank_o__Subgroup_7 (2.30–4.18%), Acidobacterium (5.81–9.15%), Nitrosomonas (2.04–2.56%), norank_f__DA101 (4.73–6.00%), and norank_o__Subgroup_2 (3.92–7.41%). The dominant genera in the L. gmelinii forest were Gemmatimonas (1.50–8.80%), norank_o__Subgroup_7 (2.86–8.06%), KD4-96 (5.17–7.77%), Nitrosomonas (3.57–5.19%), and Xanthobacter (1.15–5.73%). With increasing soil depth, the relative abundance of the dominant genus JG37-AG-4 increased and then decreased, norank_o__Subgroup_7 increased, and Acidobacterium decreased in the B. platyphylla forest. Furthermore, the relative abundance of the dominant genera Gemmatimonas and Nitrosomonas decreased, norank_o__Subgroup_7 and KD4-96 increased and then decreased, and Xanthobacter decreased and then increased in the L. gmelinii forest.
Significant differences between groups in the top fifteen most abundant phyla were evaluated using a Student’s t-test with Bonferroni correction. The results indicated that six phyla (Planctomycetes, Actinobacteria, WD272, Acidobacteria, Verrucomicrobia, and Firmicutes) differed significantly at 0–20 cm depth (p < 0.05, Figure 3A). Three phyla (WD272, Firmicutes, and Verrucomicrobia) differed significantly at 20–40 cm depth (p < 0.05, Figure 3B). Five phyla (Actinobacteria, WD272, Gemmatimonadetes, Chlorobi, and Parcubacteria) differed significantly at 40–60 cm depth (p < 0.05, Figure 3C).

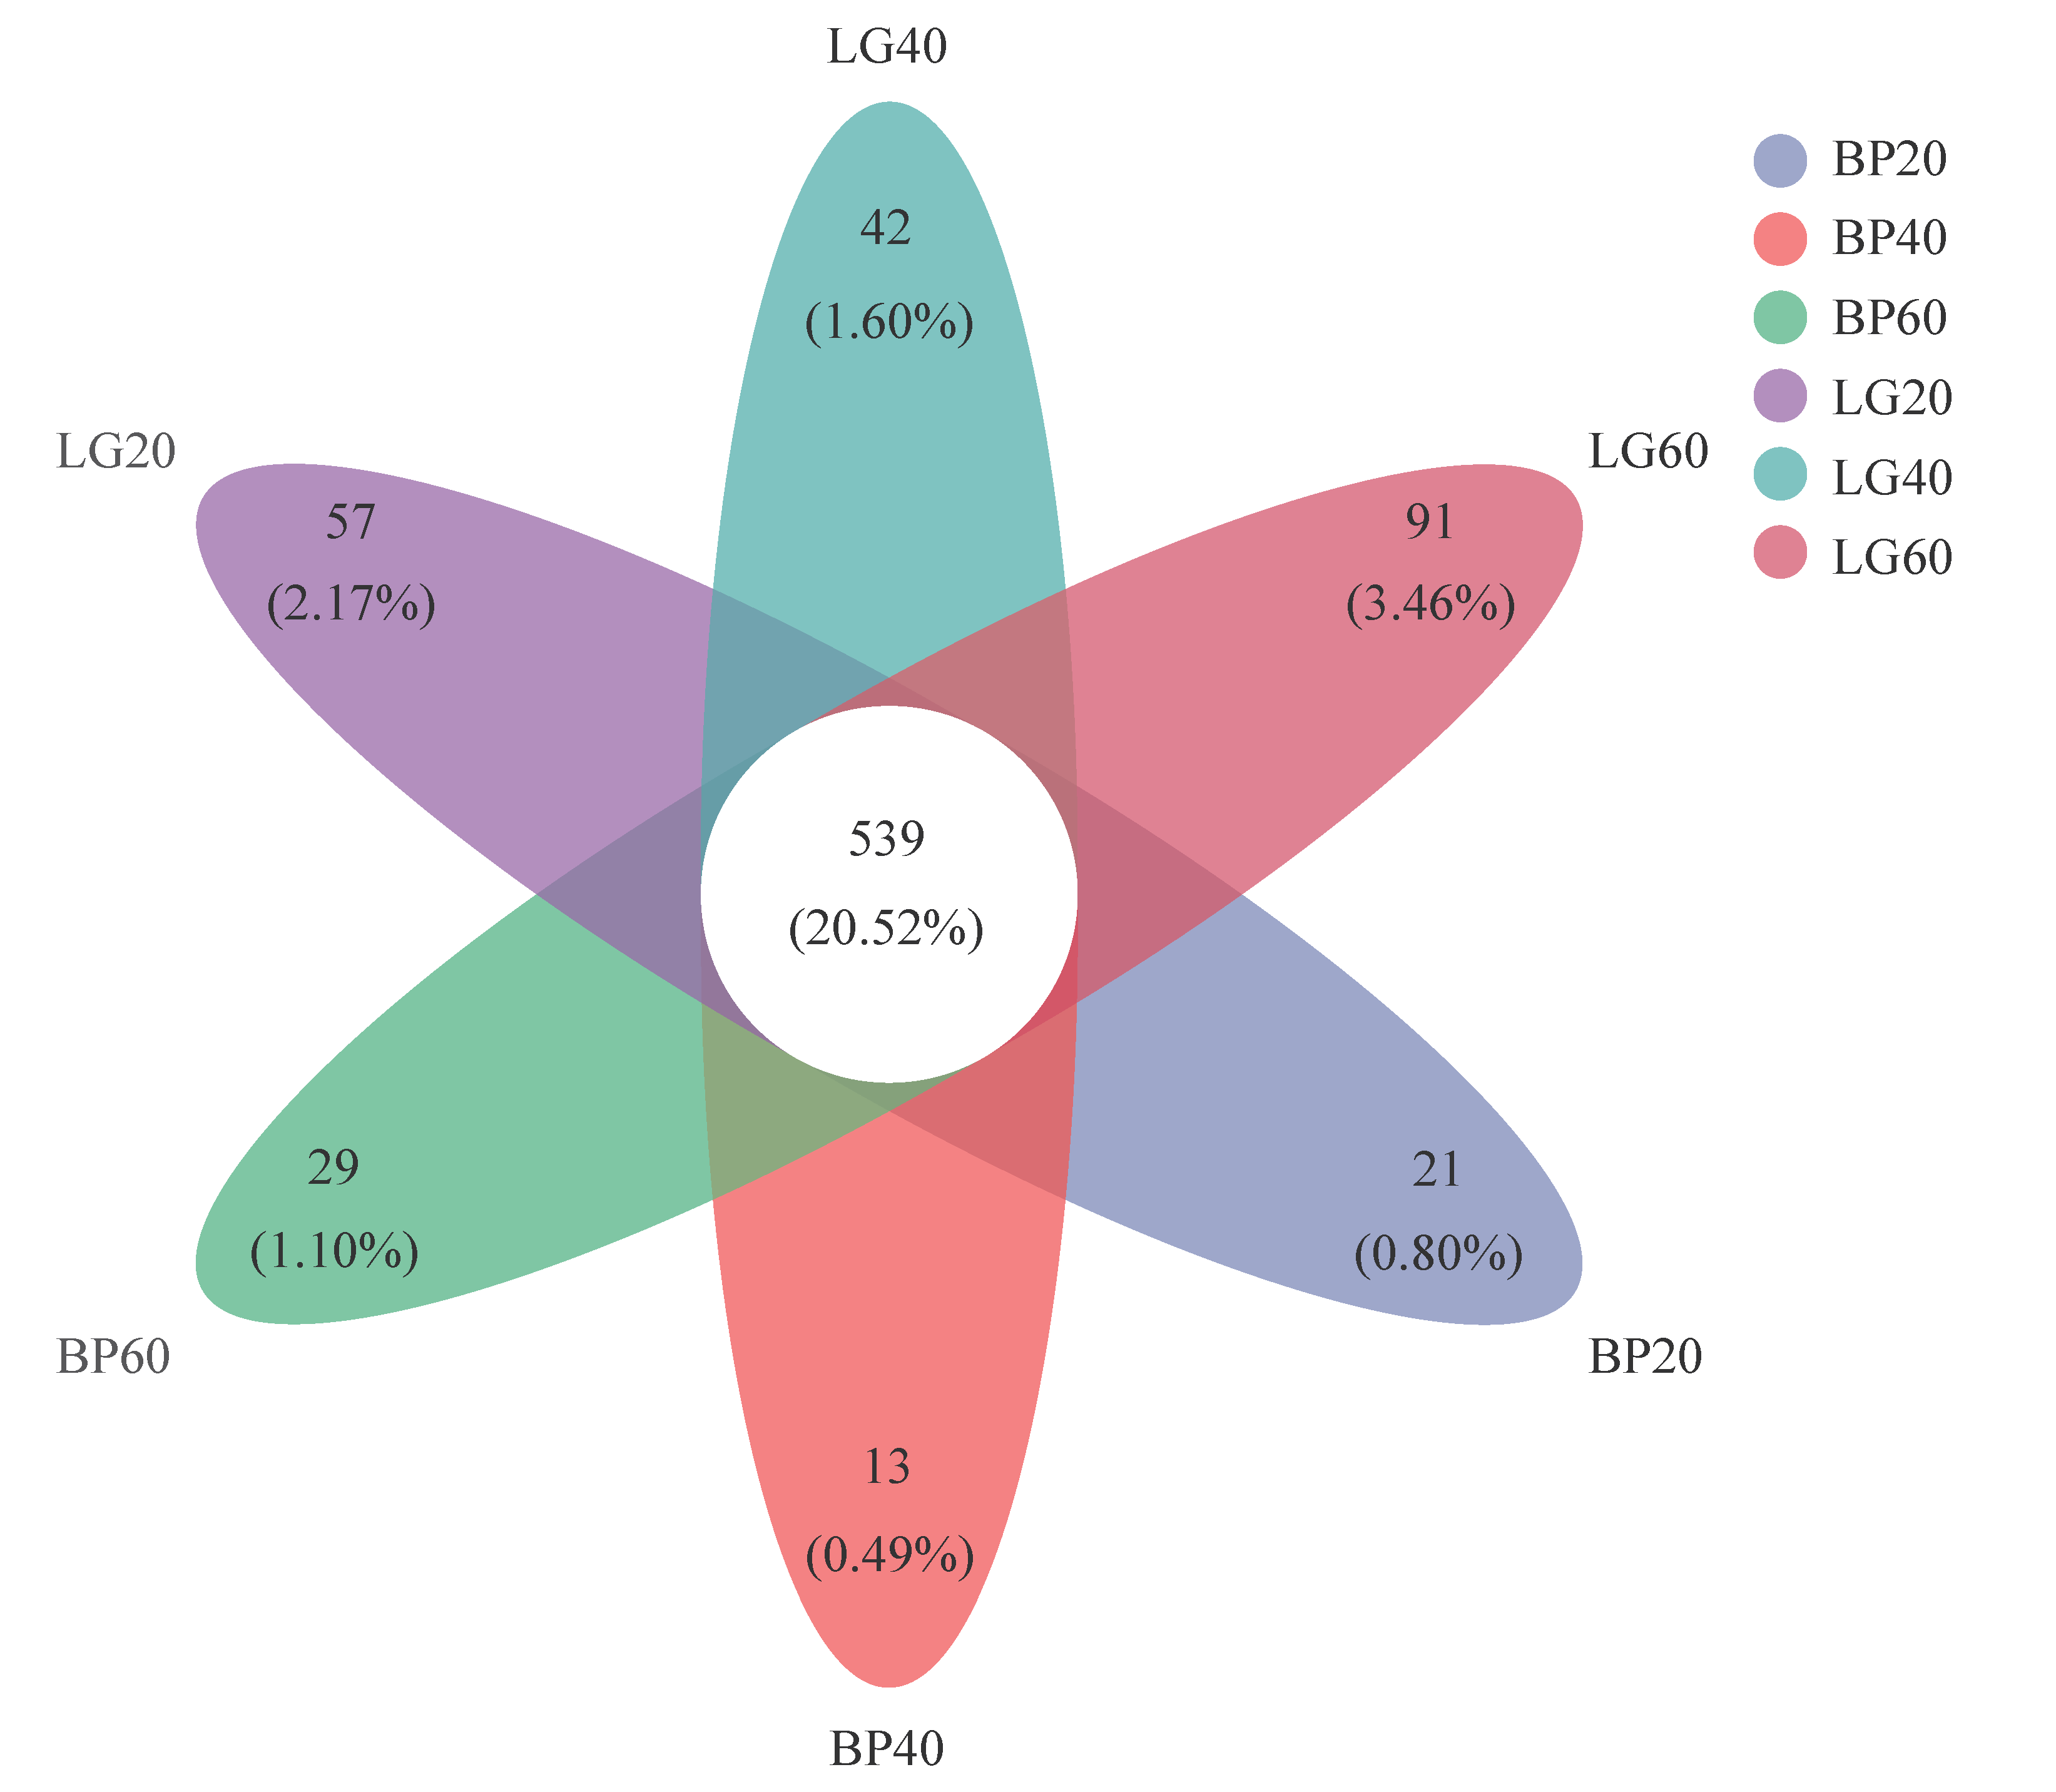
3.3. Richness and Diversity of Soil Microbial Community

A Venn diagram was constructed to assess the number of shared and unique OTUs across all samples. The results showed 539 shared OTUs, accounting for only 20.52% of the total OTUs, indicating that the microbial community structure varied significantly between the two forest types (Figure 4). The highest number of unique OTUs was observed at BP60 (29) and LG60 (91), with the number of unique OTUs in the L. gmelinii forest being significantly higher than that in the B. platyphylla forest at each soil depth.
As shown in Table 2, the Shannon-Wiener index was highest at BP20 and LG60, lowest at BP40 and LG40, and significantly higher in the L. gmelinii forest than in the B. platyphylla forest at 40–60 cm depth (p < 0.05). The Simpson index was significantly higher at LG40 than at LG20 and LG60 (p < 0.05). The ACE and Chao1 indices were highest at BP60 and LG20, lowest at BP40 and LG40, and significantly higher at LG20 and LG60 than at LG40 (p < 0.05). With increasing soil depth, the Shannon-Wiener index, ACE index, and Chao1 index tended to decrease first and then increase in both forest types.

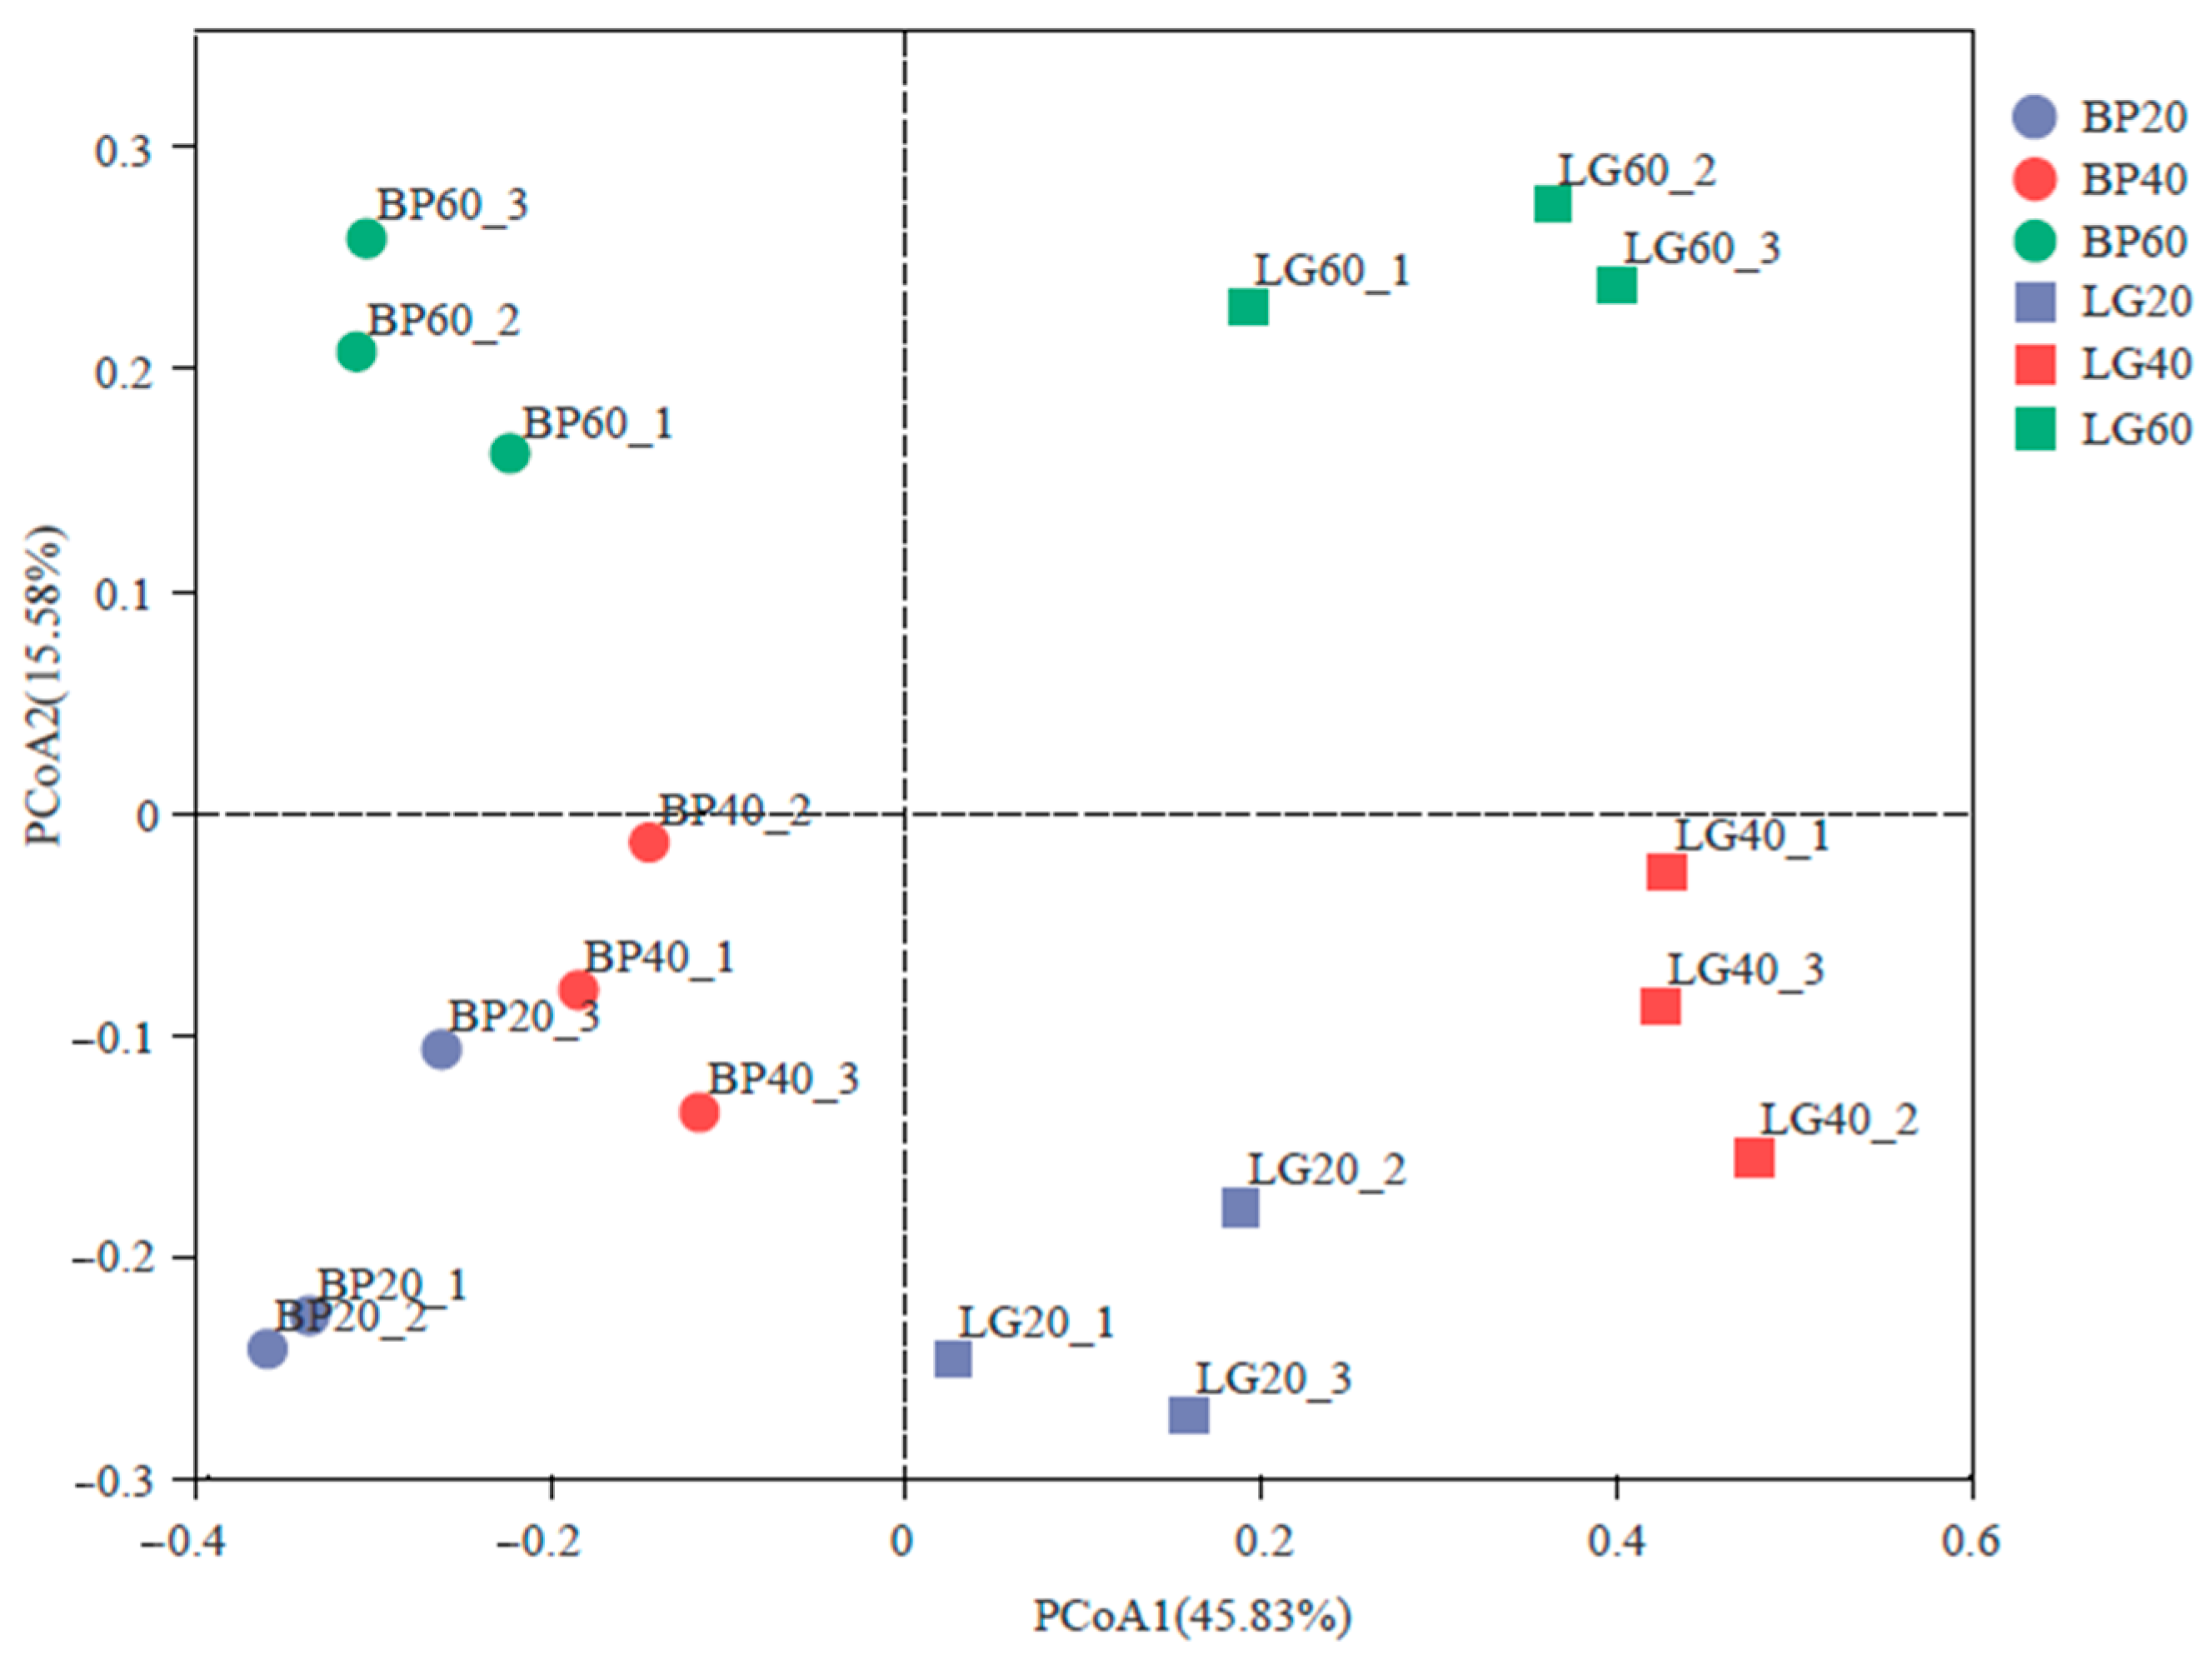
3.4. Structure of Soil Microbial Community

Soil microbial community principal coordinate analysis (PCoA) based on OTU level showed that the variance contributions of PCoA1 and PCoA2 were 45.83% and 15.58%, respectively, with a cumulative contribution of 61.41%, which could explain the combined differences and similarity of microbial community across all samples (Figure 5). All soil samples were separated on the PCoA1 axis, which indicated significant difference in the microbial community structure between the two forest types. Meanwhile, there was apparent variation in microbial community structure of different soil depths. It is clear that the bacterial community composition at both 0–20 cm and 20–40 cm depth and 40–60 cm depth were separated along PCoA2 axis.
Two-way analysis of variance (ANOVA) results confirmed that the Shannon index and Simpson index were significantly affected by soil depth (p < 0.05) and that the ACE and Chao1 indices were significantly affected by forest type (p < 0.05), soil depth (p < 0.05), and the interactive effects of forest type and soil depth (p < 0.05, Table 3). Microbial community composition at the phylum level was significantly influenced by both forest type (F = 26.27, p < 0.001) and soil depth (F = 7.15, p = 0.025), as well as the interactive effects of forest type and soil depth (F = 3.10, p = 0.028), which was significantly influenced by forest type (F = 18.24, p < 0.001), soil depth (F = 5.52, p = 0.041), and the interactive effects of forest type and soil depth (F = 4.15, p = 0.022) at the genus level.

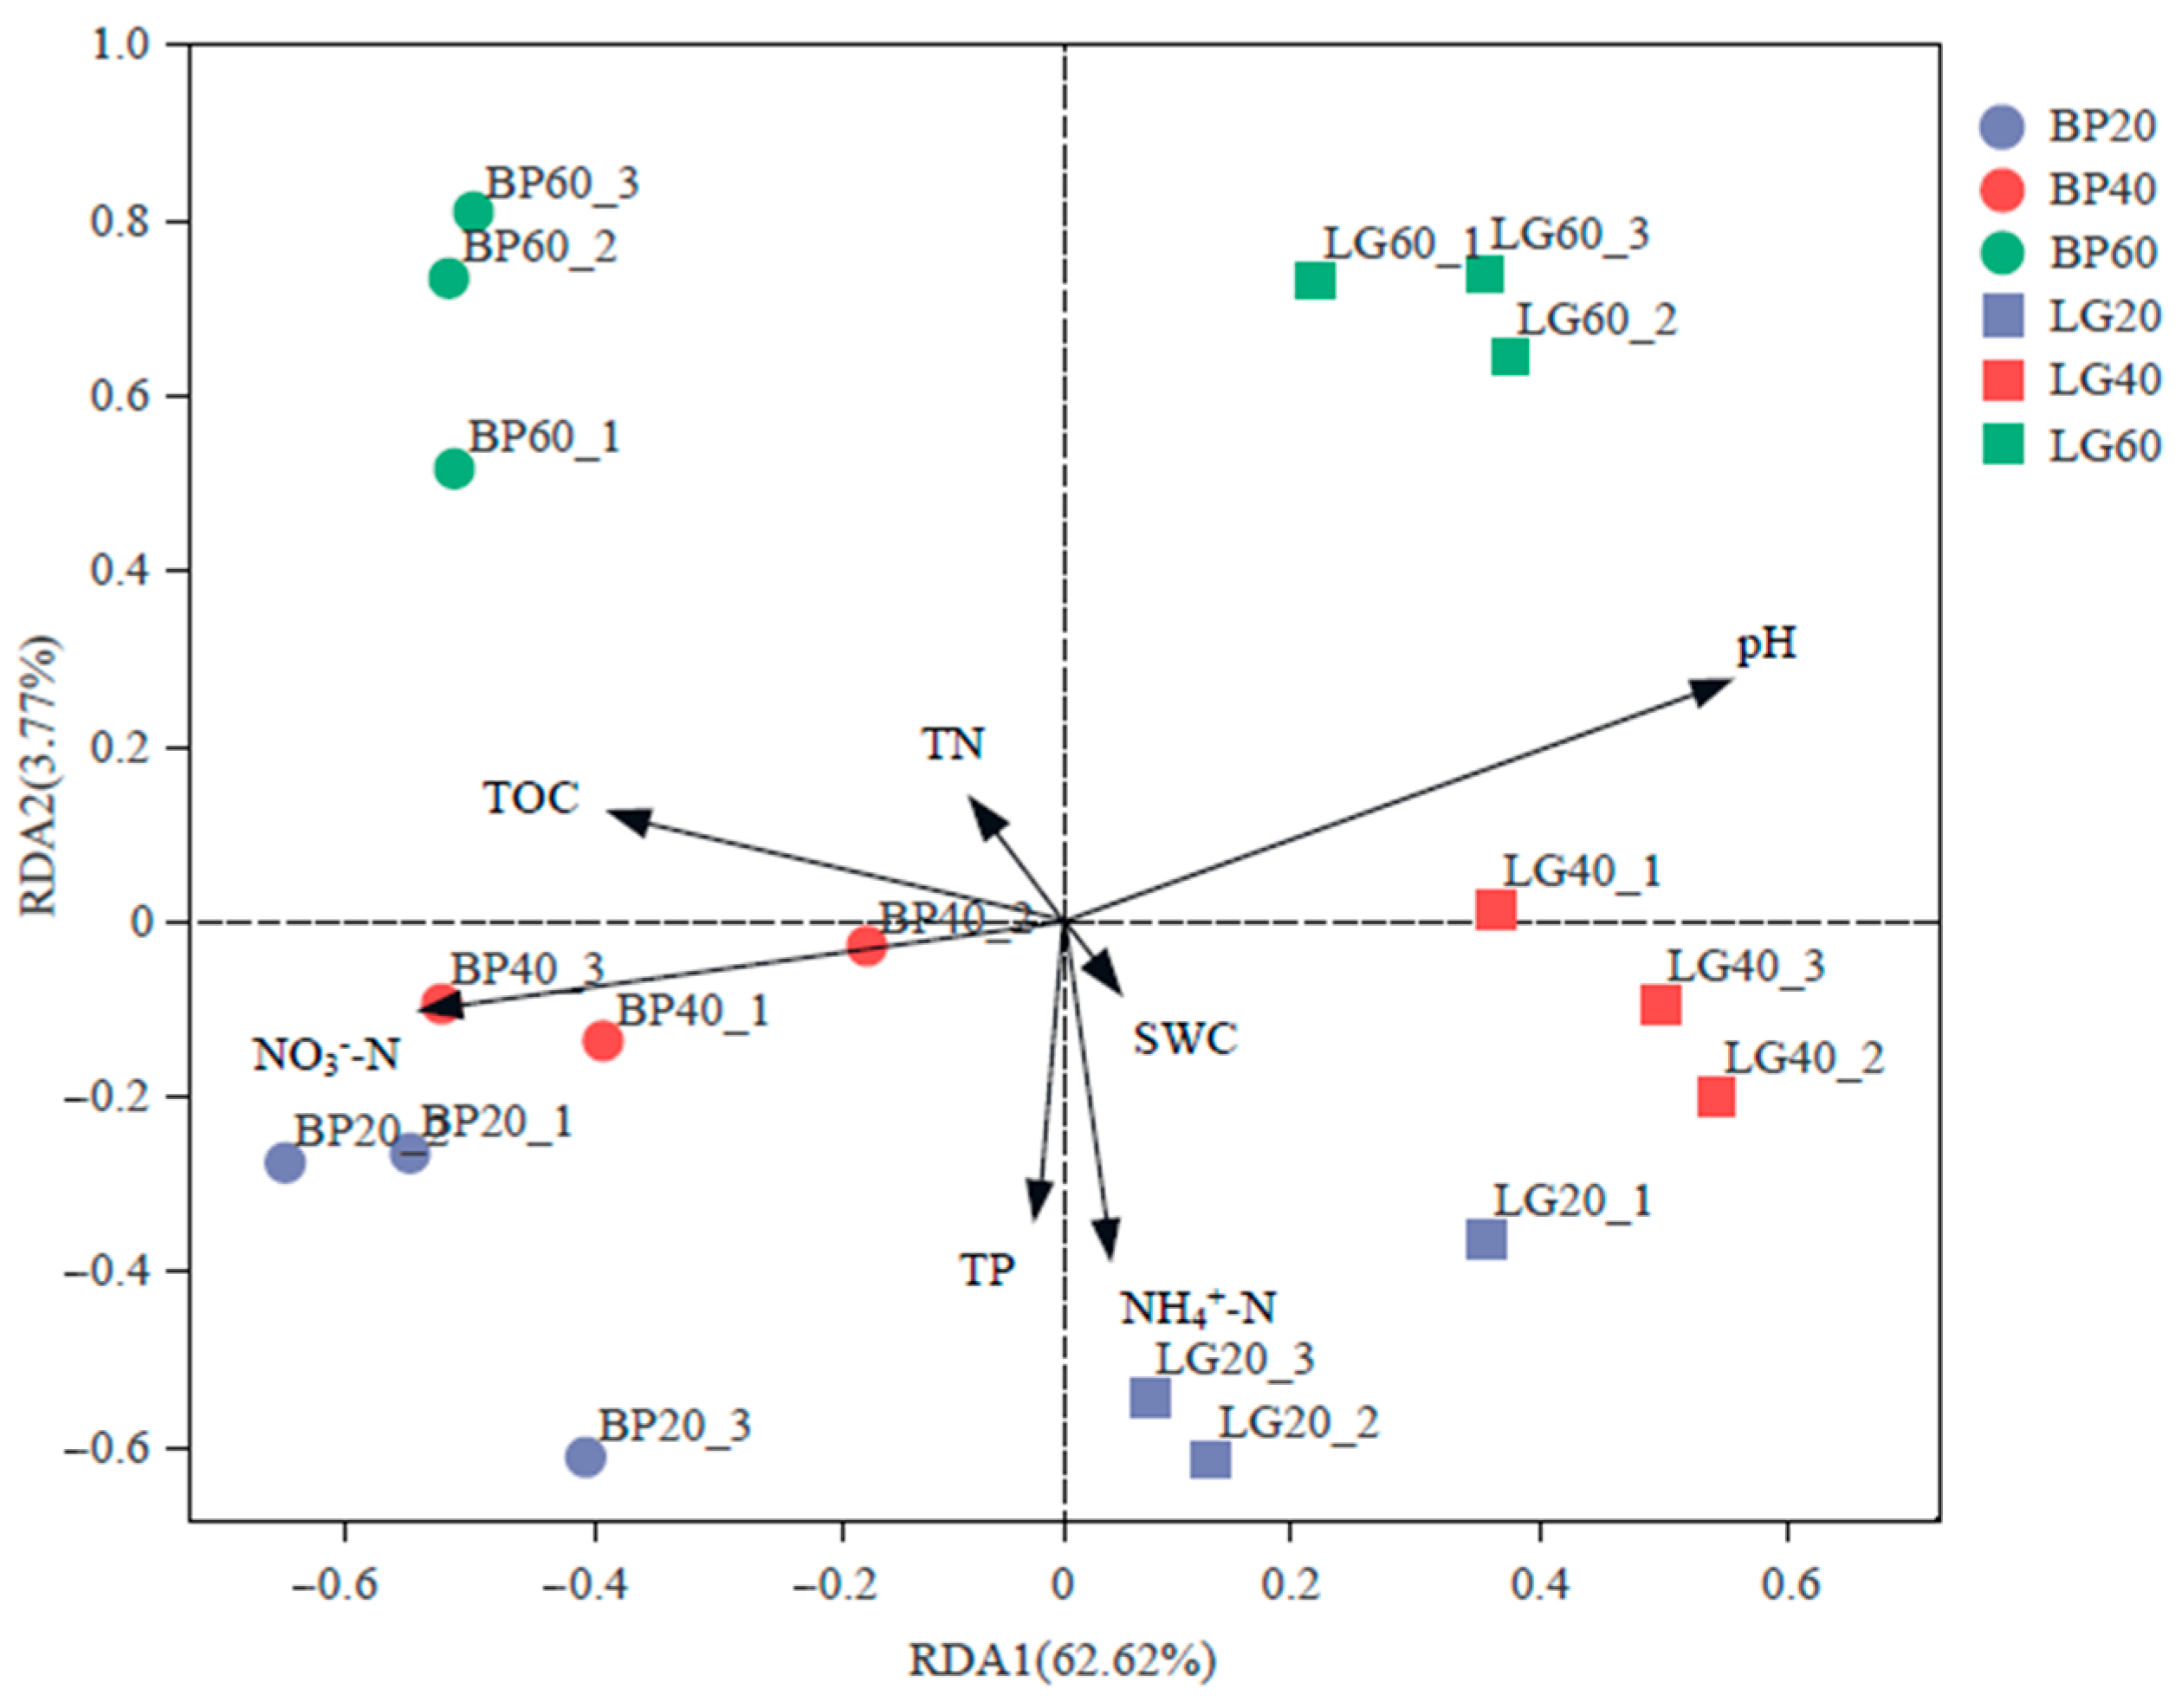
3.5. Relationship between Soil Microbial Community and Physicochemical Properties

The results of redundancy analysis (RDA) based on OTU level showed that the cumulative variance contribution of the two axes was 66.39% (Figure 6). NO3−-N (F = 19.3, p = 0.002) and that pH (F = 5.3, p = 0.022) and TOC (F = 2.9, p = 0.042) were the main environmental factors affecting soil microbial community structure, whereas TN (F = 0.9, p = 0.356), NH4+-N (F = 0.3, p = 0.718), TP (F = 0.2, p = 0.850), and SWC (F = 0.2, p = 0.828) had no significant effect on soil microbial community structure.

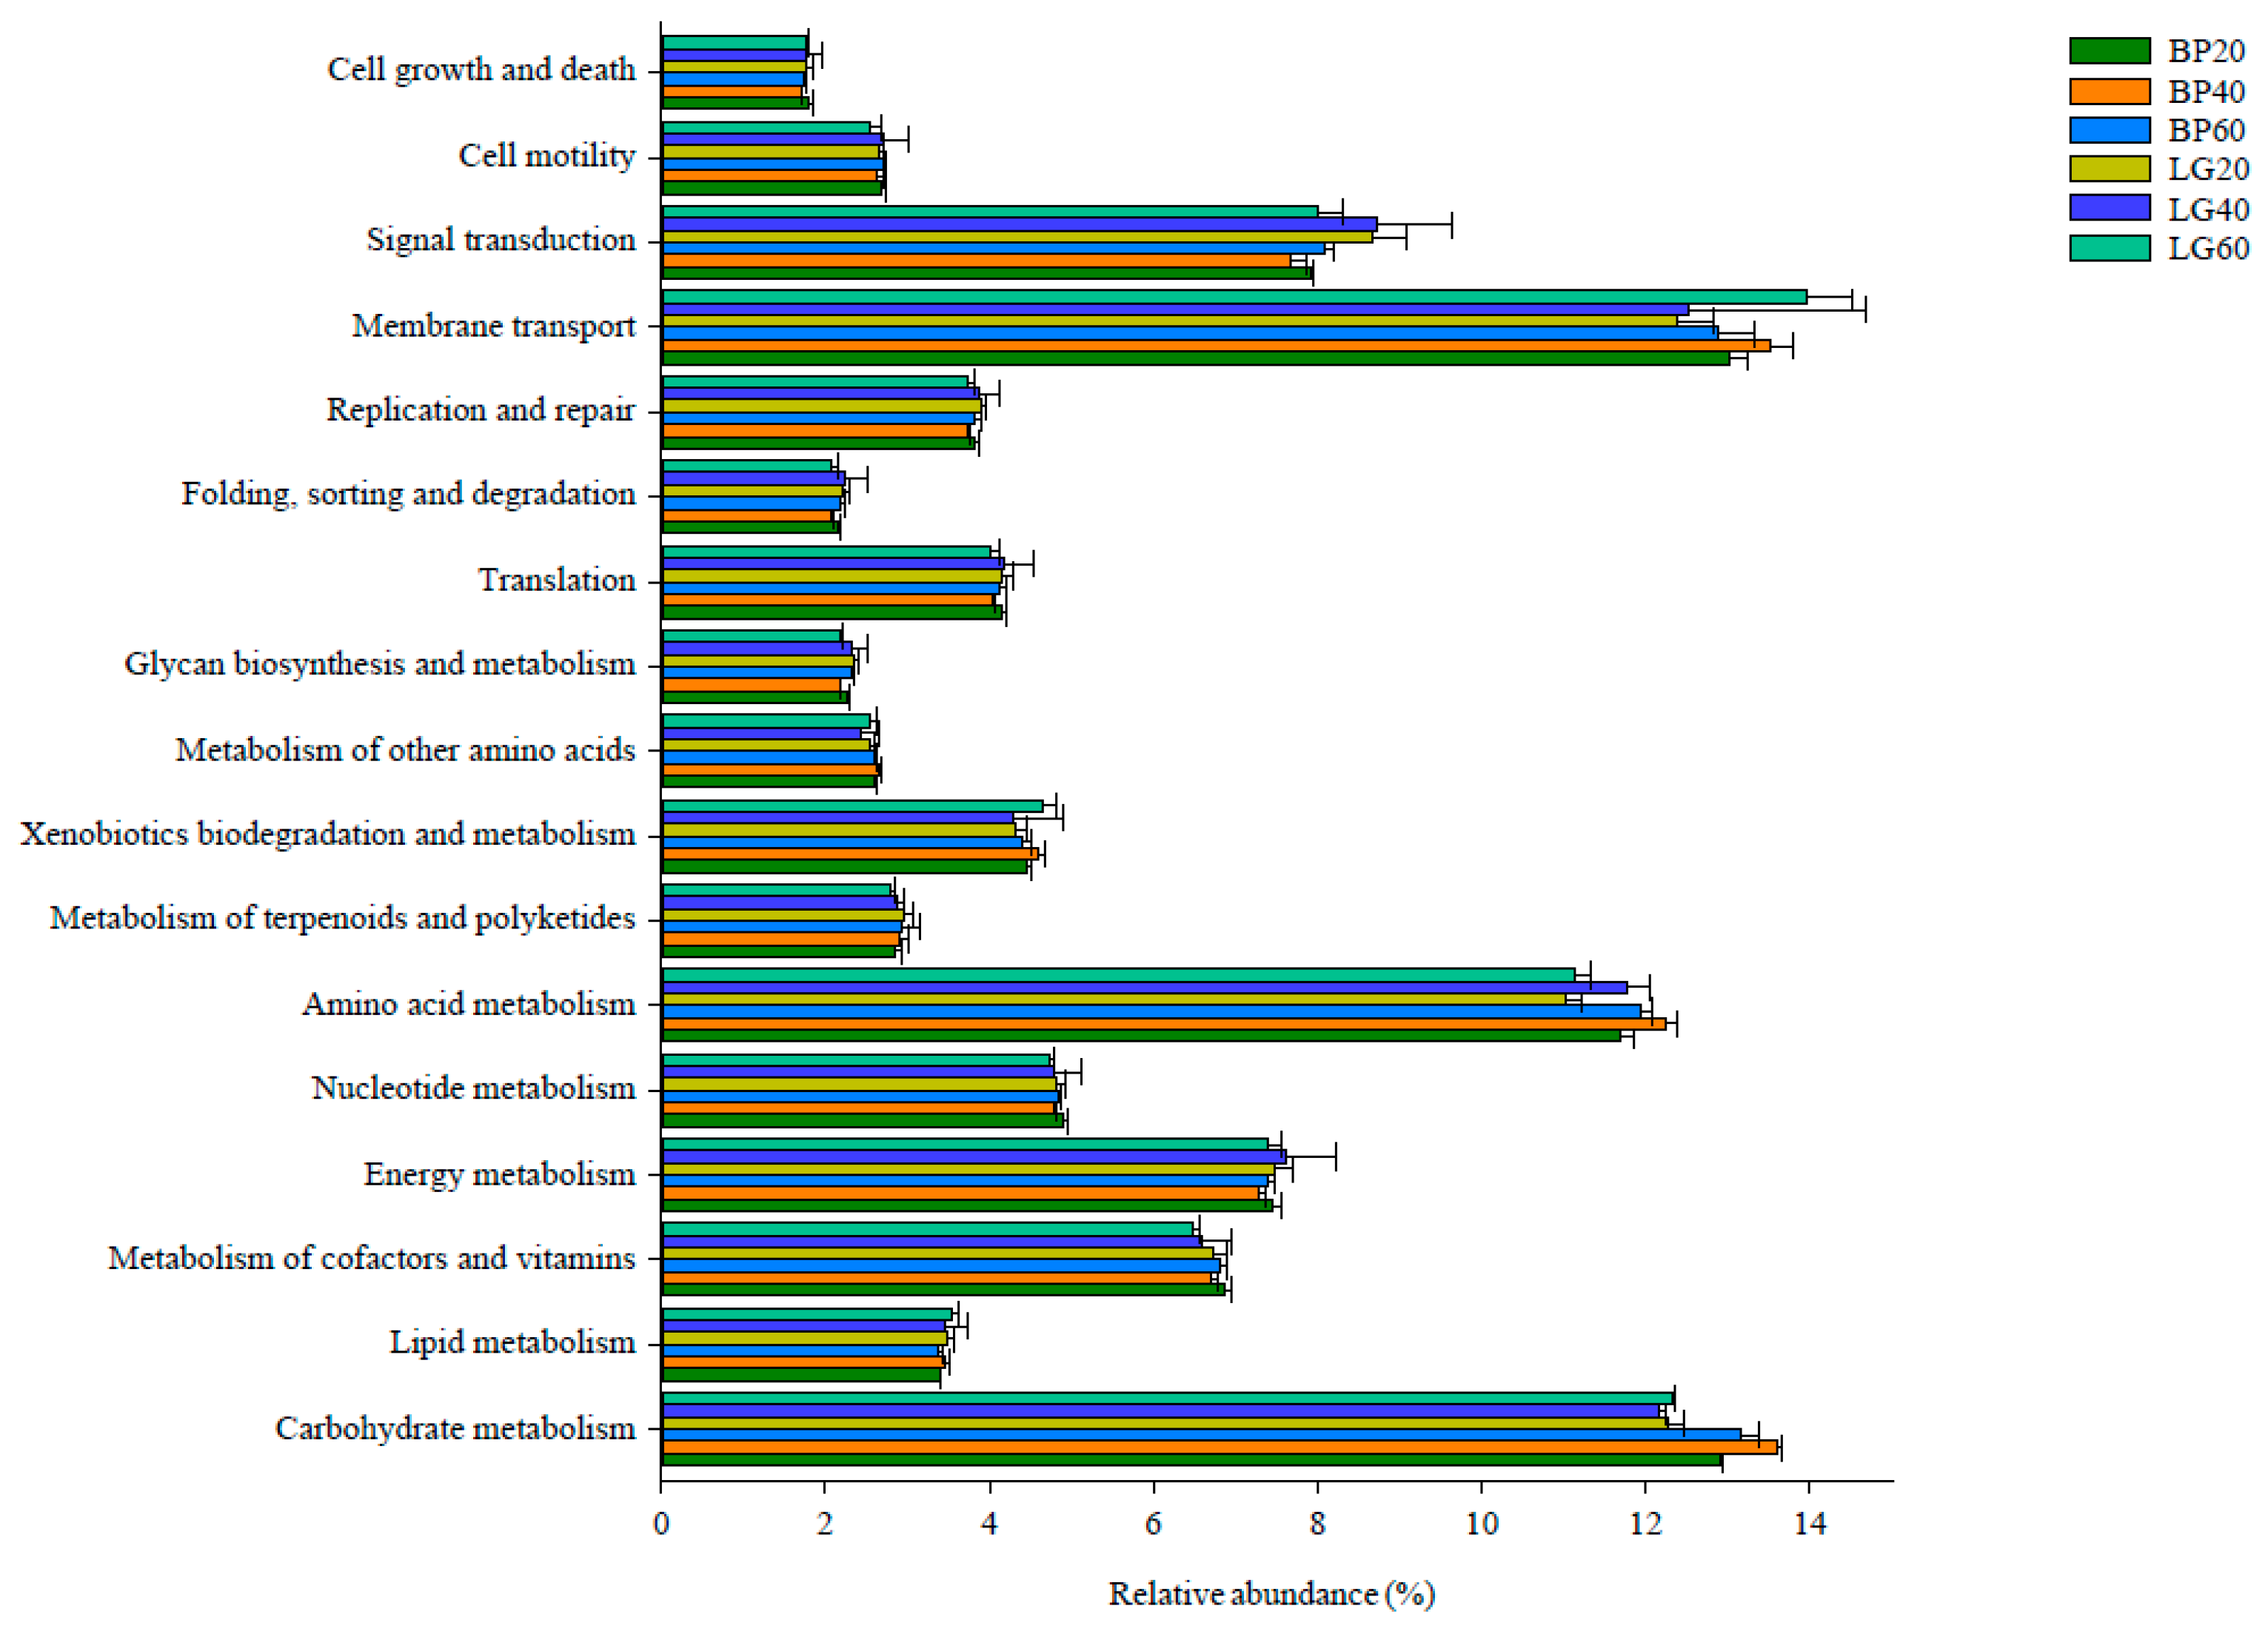
3.6. Predicted Functional Analysis for Microbial Community

As shown in Figure 7, the relative abundance of all seventeen level 2 functional metabolic pathways was greater than 1%. The predicted functional analysis indicated that carbohydrate metabolism, amino acid metabolism, glycan biosynthesis and metabolism, and signal transduction showed significant differences at 0–20 cm depth between the two forest types (p < 0.05). Additionally, carbohydrate metabolism exhibited significant differences at 20–40 cm depth (p < 0.05). Moreover, the metabolism of carbohydrates, amino acids, cofactors and vitamins, and nucleotides, as well as glycan biosynthesis and metabolism differed significantly at 40–60 cm depth (p < 0.05).

4. Discussion

In this study, the Shannon, ACE, and Chao1 indices tended to decrease and then increase with increasing soil depth. This was caused by the stratification of the soil environment due to vertical differences in organic matter and mineral composition. These vertical variations are particularly caused by seasonal freeze-thaw cycles in the active layer, which are powerful ecological filters for microbial community colonization [26,27]. Moreover, the results of two-way ANOVA indicated that the alpha diversity indices were significantly affected by soil depth, which is consistent with the study of Yokota et al. [28]. It is also worth noting that the Shannon-Wiener index of the L. gmelinii forest at 40–60 cm depth was highest and significantly higher than that of the B. platyphylla forest. Previous studies have reported that the diversity of soil bacteria increases with forest conversion due to permafrost degradation [29,30]. In this study, we observed that the average depth in the soil active layer was 69 cm in the L. gmelinii forest and 125 cm in the B. platyphylla forest, where the number of unique OTUs was highest at 40–60 cm depth and significantly higher in the L. gmelinii forest than in the B. platyphylla forest. Placing the acquired results in the background of permafrost thaw and active layer deepening as a result of climate warming, we speculate that the mobilization of essential nutrients mediated by the downward propagation of the freezing front at the active layer boundary further directly causes the transition layer (upon the permafrost interface) with the greatest genetic diversity of microbial communities to move down the soil profile. At 40–60 cm depth, we detected higher NH4+-N content and lower pH in comparison to the 0–40 cm depth in the L. gmelinii forest. Dong et al. [31] also found that the soil layer was a driver and primary explanatory variable of bacterial community diversity. This is due to the redox potential and resource availability of bacterial community, which were determined by inherent microscale changes in soil matrix. The top active layer of permafrost experiences seasonal freezing and thawing and environmental fluctuations, providing stratified heterogeneous habitats to microbial communities, which might cause niche separation and subsequent variations in microbial communities between soil layers. Additionally, soil microbial populations tend to exhibit high reproduction rates but low survival rates when faced with harsh and strong disturbed conditions, resulting in high diversity but low abundance. This can be explained by changes in the microbial community taxonomic and functional structure, with a reduction in oligotrophic and anaerobic bacteria and a substantial increase in copiotrophic and aerobic bacteria [32].
Our findings indicated that Proteobacteria, Acidobacteria, Actinobacteria, and Chloroflexi were the dominant phyla in both forest types in the Greater Xing’an Mountains permafrost region. This is consistent with the findings of other studies that evaluated similar ecosystems, including broad-leaved mixed forests in north-eastern China [33], subalpine forests in the eastern Qinghai-Tibet Plateau [34], and the Arctic tundra in Canada [35]. The higher relative abundance of Proteobacteria in the B. platyphylla forest compared to the L. gmelinii forest at 0–20 cm depth was likely due to differences in nutrient quality and availability. Proteobacteria are not only known for being copiotrophic taxa but are also the major functional bacteria involved in litter transformation and decomposition. Therefore, these bacteria have high nutrient demands and preferentially consume labile soil organic carbon [36]. Previous studies have indicated that broad-leaved forests produce more litter than coniferous forests, which favors the growth and reproduction of soil surface eutrophic microbial groups [37]. This might explain why the relative abundance of Proteobacteria increased significantly with higher TOC content at 0–20 cm depth after forest type conversion. In addition, the higher relative abundance of Proteobacteria in the L. gmelinii forest at 20–60 cm depth may be attributed to some of their members being adapted to low temperature conditions [38]. The relative abundance of Acidobacteria was higher in the B. platyphylla forest than in the L. gmelinii forest at different soil depths. Previous studies have shown that Acidobacteria prefer acidic conditions, and therefore their relative abundance increases with decreasing pH [39]. In our study, the proportion of Acidobacteria increased significantly in the B. platyphylla forest, which was likely because the soil pH was significantly lower than in the L. gmelinii forest. The relative abundance of Actinobacteria was higher in the L. gmelinii forest than in the B. platyphylla forest at different soil depths. Tripathi et al. [27] reported that Actinobacteria successfully colonized a L. gmelinii forest and exhibited an intense interspecific competition since they are adjusted to harsh abiotic environments and have the ability to degrade complex organic compounds. Actinobacteria and some genera associated with Actinobacteria such as Gaiella are resilient to oligotrophic conditions, leading to a decrease in relative abundance as nutrient contents increased after forest type conversion.
We found that microbial community composition was more significantly influenced by forest type than soil depth. It is reported that soil microbial community composition changes in response to vegetation type, which is likely to be altered with the plant species specific variations in leaf litter and root exudates and their effects on soil microenvironments [40]. Litter is the main source of soil organic matter, and changes in litter input may impact the soil microbial community structure by altering the availability of soil nutrient contents [41]. Plant root exudates can provide considerable carbon resources that sustain soil microbial communities, which can affect multiple soil properties. In turn, these changes can indirectly influence soil microbial communities [37].
In our study, NO3−-N, pH, and TOC content were key factors controlling soil bacterial communities. Zhou et al. [42] suggested that soil pH is correlated with TOC, TN, and C/N levels, as well as changes in soil NH4+-N and NO3−-N release. The plant exudates in the rhizosphere at the active layer may be vital to shaping microbial structure by affecting soil properties such as TN, TP, and TOC [43]. Microbes could promote plant growth by improving the bioavailability of soil nutrients, in which the organic forms of nitrogen and phosphorus could be transformed into greater inorganic forms through microbial mineralization and depolymerization [44]. Blume-Werry et al. [45] and Bai et al. [7] demonstrated that deep plant roots could invade freshly thawed permafrost, after which they interacted with the nitrogen and carbon released during the thaw. Additionally, rhizosphere priming and fresh nutrients could increase microbial activity, presumably resulting in increased decomposition of deep soil organic carbon. Microbes with copiotrophic characteristics in B. platyphylla forests respond relatively rapidly to increases in C, N, and nutrient availability. In contrast, the oligotrophic taxa in the L. gmelinii forest exhibit slower growth rates and greater stress tolerance, allowing them to better resist disturbances associated with climate change [46]. Moreover, our study also demonstrated that forest type conversion increased the relative abundance of carbohydrate and amino acid metabolism, and therefore bacteria must rapidly adapt to abrupt increases in labile substrates to survive. The microbial community in the soil active layer is strongly influenced by freeze-thaw processes (environmental filtering) and plant species (biotic filtering), suggesting that changes in bacterial diversity and community composition could regulate the response of plant communities to permafrost thaw and may have a critical effect on climate change feedbacks. However, more information on ecosystem properties and processes is needed to gain a more comprehensive understanding of the effects of permafrost degradation on forest ecosystems functioning in high-latitude cold regions.

5. Conclusions

Our results demonstrated that Proteobacteria, Acidobacteria, Actinobacteria, and Chloroflexi were the dominant phyla in both forest types in the Greater Xing’an Mountains permafrost region. The relative abundance of copiotrophic and aerobic bacteria was higher in the B. platyphylla forest, whereas that of oligotrophic and anaerobic bacteria was higher in the L. gmelinii forest. NO3−-N, pH, and TOC are vital factors driving bacterial community composition. Collectively, our findings provide crucial insights into the complex responses of microbial community structure and diversity potentials to forest conversion, as well as the dynamics of microbial-mediated biogeochemical cycles in high latitude permafrost ecosystems.

Author Contributions

Conceptualization, D.S. and D.M.; data curation, Y.C., X.L. and D.S.; writing—review & editing, D.M. and L.L. All authors have read and agreed to the published version of the manuscript.

Funding

This study was supported by the National Natural Science Foundation of China [No. 42171127]; the Postdoctoral Scientific Research Starting Foundation of Heilongjiang Province [No. LBH-Q21022].

Institutional Review Board Statement

Not applicable.

Informed Consent Statement

Not applicable.

Data Availability Statement

The data presented in this study are available on request from the corresponding author.

Conflicts of Interest

The authors declare no conflict of interest.

References

  1. Kim, H.M.; Lee, M.J.; Jung, J.Y.; Hwang, C.Y.; Kim, M.; Ro, H.M.; Chun, J.; Lee, Y.K. Vertical distribution of bacterial community is associated with the degree of soil organic matter decomposition in the active layer of moist acidic tundra. J. Microbiol. 2016, 54, 713–723. [Google Scholar] [CrossRef]
  2. Feng, J.J.; Wang, C.; Lei, J.S.; Yang, Y.F.; Yan, Q.Y.; Zhou, X.S.; Tao, X.Y.; Ning, D.L.; Yuan, M.T.M.; Qin, Y.J.; et al. Warming-induced permafrost thaw exacerbates tundra soil carbon decomposition mediated by microbial community. Microbiome 2020, 8, 3. [Google Scholar] [CrossRef]
  3. Schuur, E.A.G.; McGuire, A.D.; Schadel, C.; Grosse, G.; Harden, J.W.; Hayes, D.J.; Hugelius, G.; Koven, C.D.; Kuhry, P.; Lawrence, D.M.; et al. Climate change and the permafrost carbon feedback. Nature 2015, 520, 171–179. [Google Scholar] [CrossRef]
  4. Yergeau, E.; Hogues, H.; Whyte, L.G.; Greer, C.W. The functional potential of high Arctic permafrost revealed by metagenomic sequencing, qPCR and microarray analyses. ISME J. 2010, 4, 1206–1214. [Google Scholar] [CrossRef] [PubMed]
  5. Averill, C.; Hawkes, C.V. Ectomycorrhizal fungi slow soil carbon cycling. Ecol. Lett. 2016, 19, 937–947. [Google Scholar] [CrossRef] [PubMed]
  6. Jansson, J.K.; Hofmockel, K.S. Soil microbiomes and climate change. Nat. Rev. Microbiol. 2020, 18, 35–46. [Google Scholar] [CrossRef] [PubMed]
  7. Bai, Z.; Ye, J.; Wei, Y.L.; Yan, S.K.; Yuan, H.S. Soil depth-dependent C/N stoichiometry and fungal and bacterial communities along a temperate forest succession gradient. Catena 2021, 207, 105613. [Google Scholar] [CrossRef]
  8. Bolaji, A.J.; Wan, J.C.; Manchur, C.L.; Lawley, Y.; de Kievit, T.R.; Fernando, W.G.D.; Belmonte, M.F. Microbial community dynamics of soybean (Glycine max) is affected by cropping sequence. Front. Microbiol. 2021, 12, 632280. [Google Scholar] [CrossRef]
  9. Shahzad, T.; Chenu, C.; Genet, P.; Barot, S.; Perveen, N.; Mougin, C.; Fontaine, S. Contribution of exudates, arbuscular mycorrhizal fungi and litter depositions to the rhizosphere priming effect induced by grassland species. Soil Biol. Biochem. 2015, 80, 146–155. [Google Scholar] [CrossRef]
  10. Jorgenson, M.T.; Harden, J.; Kanevskiy, M.; O’Donnell, J.; Wickland, K.; Ewing, S.; Manies, K.; Zhuang, Q.L.; Shur, Y.; Striegl, R.; et al. Reorganization of vegetation, hydrology and soil carbon after permafrost degradation across heterogeneous boreal landscapes. Environ. Res. Lett. 2013, 8, 035017. [Google Scholar] [CrossRef]
  11. Hultman, J.; Waldrop, M.P.; Mackelprang, R.; David, M.M.; McFarland, J.; Blazewicz, S.J.; Harden, J.; Turetsky, M.R.; McGuire, A.D.; Shah, M.B.; et al. Multi-omics of permafrost, active layer and thermokarst bog soil microbiomes. Nature 2015, 521, 208–212. [Google Scholar] [CrossRef]
  12. Liu, M.H.; Feng, F.J.; Cai, T.J.; Tang, S.J. Soil microbial community response differently to the frequency and strength of freeze-thaw events in a Larix gmelinii forest in the Daxing’an Mountains, China. Front. Microbiol. 2020, 11, 1164. [Google Scholar] [CrossRef]
  13. Yasmeen, S.; Wang, X.C.; Zhao, H.Y.; Zhu, L.J.; Yuan, D.Y.; Li, Z.S.; Zhang, Y.D.; Ahmad, S.; Han, S.J. Contrasting climate-growth relationship between Larix gmelinii and Pinus sylvestris var. mongolica along a latitudinal gradient in Daxing’an Mountains, China. Dendrochronologia 2019, 58, 125645. [Google Scholar] [CrossRef]
  14. Wei, H.; Man, X.L. Increased litter greatly enhancing soil respiration in Betula platyphylla forests of permafrost region, Northeast China. Forests 2021, 12, 89. [Google Scholar] [CrossRef]
  15. Fang, X.M.; Yu, D.P.; Zhou, W.M.; Zhou, L.; Dai, L.M. The effects of forest type on soil microbial activity in Changbai Mountain, Northeast China. Ann. Forest Sci. 2016, 73, 473–482. [Google Scholar] [CrossRef] [Green Version]
  16. Duan, B.X.; Man, X.L.; Cai, T.J.; Xiao, R.H.; Ge, Z.X. Increasing soil organic carbon and nitrogen stocks along with secondary forest succession in permafrost region of the Daxing’an Mountains, Northeast China. Glob. Ecol. Conserv. 2020, 24, e01258. [Google Scholar] [CrossRef]
  17. Gao, J.; Wu, Y.Y.; Liu, B.Y.; Zhao, R.K.; Liu, A.Q.; Li, X.; Chen, Q.Z.; Sun, L.W.; Guo, X.P.; Liu, H.J. Vertical distribution patterns of element concentrations in podetia of Cladonia rangiferina from Huzhong Natural Reserve, Heilongjiang, China. Pol. J. Environ. Stud. 2021, 30, 103–110. [Google Scholar] [CrossRef]
  18. Ping, X.Y.; Chang, Y.; Liu, M.; Hu, Y.M.; Huang, W.T.; Shi, S.X.; Jia, Y.C.; Li, D.K. Carbon emission and redistribution among forest carbon pools, and change in soil nutrient content after different severities of forest fires in Northeast China. Forests 2022, 13, 110. [Google Scholar] [CrossRef]
  19. Jin, H.J.; Chang, X.L.; Luo, D.L.; He, R.X.; Lu, L.Z.; Yang, S.Z.; Guo, D.X.; Chen, X.M.; Harris, S.A. Evolution of permafrost in Northeast China since the Late Pleistocene. Sci. Cold Arid Reg. 2016, 8, 269–296. [Google Scholar] [CrossRef]
  20. Li, W.K.; Niu, S.K.; Liu, X.D.; Wang, J.M. Short-term response of the soil bacterial community to differing wildfire severity in Pinus tabulaeformis stands. Sci. Rep. 2019, 9, 1148. [Google Scholar] [CrossRef] [Green Version]
  21. Sengupta, A.; Kushwaha, P.; Jim, A.; Troch, P.A.; Maier, R. New soil, old plants, and ubiquitous microbes: Evaluating the potential of incipient basaltic soil to support native plant growth and influence belowground soil microbial community composition. Sustainability 2020, 12, 4209. [Google Scholar] [CrossRef]
  22. Jiang, L.; Song, Y.Y.; Sun, L.; Ma, X.Y.; Wang, X.W.; Song, C.C.; Hou, A.X.; Wang, L.L. Distribution of carbon and nitrogen cycle microbes along permafrost peatland profile in Northeast China. Environ. Prog. Sustain. 2021, 40, 13707. [Google Scholar] [CrossRef]
  23. Oksanen, J.; Blanchet, F.J.; Friendly, M.; Kindt, R.; Legendre, P.; McGlinn, D. Community Ecology Package, R Package, Version 2.4-2; R Foundation for Statistical Computing: Vienna, Austria, 2017. Available online: https://cran.r-project.org/web/packages/vegan/index.html(accessed on 28 June 2022).
  24. Braak, C.; Smilauer, P. Canoco Reference Manual and User’s Guide: Software for Ordination, Version 5.0. 2012. Available online: http://www.canoco5.com (accessed on 28 June 2022).
  25. Ke, H.; Li, J.H.; Zhang, X.Q.; Hu, J. Bacterial community structure and predicted metabolic function of landfilled municipal solid waste in China. Sustainability 2022, 14, 3144. [Google Scholar] [CrossRef]
  26. Deng, J.; Gu, Y.F.; Zhang, J.; Xue, K.; Qin, Y.J.; Yuan, M.; Yin, H.; He, Z.L.; Wu, L.Y.; Schuur, E.A.G.; et al. Shifts of tundra bacterial and archaeal communities along a permafrost thaw gradient in Alaska. Mol. Ecol. 2015, 24, 222–234. [Google Scholar] [CrossRef]
  27. Tripathi, B.M.; Kim, H.M.; Jung, J.Y.; Nam, S.; Ju, H.T.; Kim, M.; Lee, Y.K. Distinct taxonomic and functional profiles of the microbiome associated with different soil horizons of a moist tussock tundra in Alaska. Front. Microbiol. 2019, 10, 1442. [Google Scholar] [CrossRef] [Green Version]
  28. Yokota, M.; Guan, Y.P.; Fan, Y.; Zhang, X.M.; Yang, W. Vertical and temporal variations of soil bacterial and archaeal communities in wheat-soybean rotation agroecosystem. PeerJ 2022, 10, 12868. [Google Scholar] [CrossRef]
  29. Jin, X.Y.; Jin, H.J.; Iwahana, G.; Marchenko, S.S.; Luo, D.L.; Li, X.Y.; Liang, S.H. Impacts of climate-induced permafrost degradation on vegetation: A review. Adv. Clim. Chang. Res. 2021, 12, 29–47. [Google Scholar] [CrossRef]
  30. Aksenov, A.S.; Shirokova, L.S.; Kisil, O.Y.; Kolesova, S.N.; Lim, A.G.; Kuzmina, D. Bacterial number and genetic diversity in a permafrost peatland (Western Siberia): Testing a link with organic matter quality and elementary composition of a peat soil profile. Diversity 2021, 13, 328. [Google Scholar] [CrossRef]
  31. Dong, X.F.; Liu, C.; Ma, D.L.; Wu, Y.F.; Man, H.R.; Wu, X.W.; Li, M.; Zang, S.Y. Organic carbon mineralization and bacterial community of active layer soils response to short-term warming in the Great Hing’an Mountains of Northeast China. Front. Microbiol. 2021, 12, 802213. [Google Scholar] [CrossRef]
  32. Wang, R.; Wang, M.; Wang, J.; Yao, J.H.; Li, X.W.; Lin, Y.H.; Du, F.K. Soil bacterial characteristics under four habitats with different vegetation communities on the Qinghai-Tibetan Plateau. Wetlands 2021, 41, 58. [Google Scholar] [CrossRef]
  33. Qi, D.D.; Feng, F.J.; Fu, Y.M.; Ji, X.M.; Liu, X.F. Effects of soil microbes on forest recovery to climax community through the regulation of nitrogen cycling. Forests 2020, 11, 1027. [Google Scholar] [CrossRef]
  34. Wang, Z.H.; Bai, Y.; Hou, J.F.; Li, F.; Li, X.Q.; Cao, R.; Deng, Y.Y.; Wang, H.B.; Jiang, Y.R.; Yang, W.Q. The changes in soil microbial communities across a subalpine forest successional series. Forests 2022, 13, 289. [Google Scholar] [CrossRef]
  35. Shi, Y.; Xiang, X.J.; Shen, C.C.; Chu, H.Y.; Neufeld, J.D.; Walker, V.K.; Grogan, P. Vegetation-associated impacts on Arctic tundra bacterial and microeukaryotic communities. Appl. Environ. Microb. 2015, 81, 492–501. [Google Scholar] [CrossRef] [PubMed] [Green Version]
  36. Zhang, W.W.; Lu, Z.T.; Yang, K.; Zhu, J.J. Impacts of conversion from secondary forests to larch plantations on the structure and function of microbial communities. Appl. Soil Ecol. 2017, 111, 73–83. [Google Scholar] [CrossRef]
  37. Ao, L.; Zhao, M.C.; Li, X.; Sun, G.Y. Different urban forest tree species affect the assembly of the soil bacterial and fungal community. Microb. Ecol. 2022, 83, 447–458. [Google Scholar] [CrossRef]
  38. Mateos-Rivera, A.; Yde, J.C.; Wilson, B.; Finster, K.W.; Reigstad, L.J.; Ovreas, L. The effect of temperature change on the microbial diversity and community structure along the chronosequence of the sub-arctic glacier forefield of Styggedalsbreen (Norway). FEMS Microbiol. Ecol. 2016, 92, fiw038. [Google Scholar] [CrossRef] [Green Version]
  39. Ren, B.H.; Hu, Y.M.; Chen, B.D.; Zhang, Y.; Thiele, J.; Shi, R.J.; Liu, M.; Bu, R.C. Soil pH and plant diversity shape soil bacterial community structure in the active layer across the latitudinal gradients in continuous permafrost region of Northeastern China. Sci. Rep. 2018, 8, 5619. [Google Scholar] [CrossRef]
  40. Fu, D.G.; Wu, X.N.; Qiu, Q.T.; Duan, C.Q.; Jones, D.L. Seasonal variations in soil microbial communities under different land restoration types in a subtropical mountains region, Southwest China. Appl. Soil Ecol. 2020, 153, 103634. [Google Scholar] [CrossRef]
  41. Dong, H.Y.; Shao, S.; Liang, C.F.; Xu, Q.F.; Chen, J.H.; Qin, H. Impacts of litter composition on the structure and functional pathways of soil microbial community during Phyllostachys edulis expansion. Agronomy 2022, 12, 220. [Google Scholar] [CrossRef]
  42. Zhou, Z.H.; Wang, C.K.; Luo, Y.Q. Meta-analysis of the impacts of global change factors on soil microbial diversity and functionality. Nat. Commun. 2020, 11, 3072. [Google Scholar] [CrossRef]
  43. Chai, Y.N.; Schachtman, D.P. Root exudates impact plant performance under abiotic stress. Trends Plant Sci. 2022, 27, 80–91. [Google Scholar] [CrossRef]
  44. Fujii, K.; Yamada, T.; Hayakawa, C.; Nakanishi, A.; Funakawa, S. Decoupling of protein depolymerization and ammonification in nitrogen mineralization of acidic forest soils. Appl. Soil Ecol. 2020, 153, 103572. [Google Scholar] [CrossRef]
  45. Blume-Werry, G.; Milbau, A.; Teuber, L.M.; Johansson, M.; Dorrepaal, E. Dwelling in the deep-strongly increased root growth and rooting depth enhance plant interactions with thawing permafrost soil. New Phytol. 2019, 223, 1328–1339. [Google Scholar] [CrossRef]
  46. Adamczyk, M.; Ruthi, J.; Frey, B. Root exudates increase soil respiration and alter microbial community structure in alpine permafrost and active layer soils. Environ. Microbiol. 2021, 23, 2152–2168. [Google Scholar] [CrossRef]
Figure 1. Soil microbial community composition at the phylum level.
Sustainability 14 09284 g001
Figure 2. Soil microbial community composition at the genus level.
Sustainability 14 09284 g002
Figure 3. Analysis of bacterial relative abundance differences at the phylum level. Note: (* 0.01 < p ≤ 0.05, ** 0.001 < p ≤ 0.01, *** p ≤ 0.001). (A) Significant differences in relative abundance between groups at 0–20 cm depth; (B) Significant differences in relative abundance between groups at 20–40 cm depth; (C) Significant differences in relative abundance between groups at 40–60 cm depth.
Sustainability 14 09284 g003aSustainability 14 09284 g003b
Figure 4. Venn diagram of shared and unique OTUs across all samples.
Sustainability 14 09284 g004
Figure 5. Principal coordinate analysis (PCoA) of soil microbial community.
Sustainability 14 09284 g005
Figure 6. Redundancy analysis (RDA) between soil physicochemical properties and microbial community.
Sustainability 14 09284 g006
Figure 7. Level 2 functional metabolic pathways with relative abundance greater than 1% in soil microbial community based on Tax4Fun.
Sustainability 14 09284 g007
Table 1. Soil physicochemical properties at different depths in two forest types.
SamplespHTOC (g/kg)TN (g/kg)TP (g/kg)NH4+-N (mg/kg)NO3−-N (mg/kg)SWC (%)
BP204.99 ± 0.07 b57.86 ± 5.45 a3.45 ± 0.35 a1.39 ± 0.25 a8.27 ± 0.49 b12.00 ± 2.49 a30.87 ± 3.04 a
BP405.17 ± 0.11 a31.47 ± 4.37 b2.72 ± 0.26 b0.73 ± 0.13 b11.16 ± 1.27 a8.04 ± 0.93 b36.21 ± 5.32 a
BP605.04 ± 0.03 b16.15 ± 2.61 c1.41 ± 0.12 c0.47 ± 0.32 b12.16 ± 2.18 a7.31 ± 1.08 b21.44 ± 1.40 b
LG205.67 ± 0.14 ab39.27 ± 4.32 a3.07 ± 0.43 a1.80 ± 0.33 a8.43 ± 0.35 b5.73 ± 0.35 a39.10 ± 4.69 a
LG405.79 ± 0.06 a20.01 ± 2.08 b2.23 ± 0.39 b0.61 ± 0.48 b10.99 ± 1.53 a3.48 ± 0.73 b32.50 ± 6.57 a
LG605.54 ± 0.08 b15.20 ± 3.63 b1.09 ± 0.17 c0.39 ± 0.11 b11.31 ± 2.76 a3.41 ± 0.52 b23.23 ± 2.46 b
Note: Values in the table are mean ± standard deviation; different lowercase letters indicate significant differences between different soil depths in the same forest type (p < 0.05). BP20, BP40, and BP60 represent the sample of the B. platyphylla forest at 0–20 cm depth, 20–40 cm depth, and 40–60 cm depth, respectively; LG20, LG40, and LG60 represent the sample of the L. gmelinii forest at 0–20 cm depth, 20–40 cm depth, and 40–60 cm depth, respectively. Three samples were analyzed per site of sample collection.
Table 2. Soil microbial alpha diversity index.
SamplesShannon-WienerSimpsonACEChao1
BP205.49 ± 0.08 a0.013 ± 0.004 a1328.35 ± 37.48 a1305.26 ± 38.52 a
BP405.12 ± 0.21 b0.015 ± 0.003 a1295.32 ± 53.04 a1288.06 ± 65.80 a
BP605.15 ± 0.16 b0.014 ± 0.002 a1343.42 ± 46.35 a1344.03 ± 47.65 a
LG205.42 ± 0.07 b0.010 ± 0.003 b1452.31 ± 50.18 a1417.03 ± 49.59 a
LG405.07 ± 0.24 c0.016 ± 0.002 a1325.23 ± 23.41 b1309.08 ± 39.42 b
LG605.78 ± 0.25 a0.008 ± 0.004 b1413.24 ± 33.86 a1390.13 ± 26.58 a
Note: Values in the table are mean ± standard deviation; different lowercase letters indicate significant differences between different soil depths in the same forest type (p < 0.05).
Table 3. Two-way analysis of variance (ANOVA) for the effects of forest type and soil depth on alpha diversity indices and microbial community composition.
FactorForest TypeDepthForest Type × Depth
FpFpFp
Shannon3.840.0747.720.0076.820.010
Simpson3.030.1084.840.0291.880.195
ACE14.190.0036.340.0131.900.019
Chao17.500.0184.050.0451.540.025
Phyla26.27<0.0017.150.0253.100.028
Genera18.24<0.0015.520.0414.150.022
Note: F-values and p-values are the results of two-way ANOVA for the variability of factors interactively induced by forest type and soil depth; bold means significant difference (p < 0.05).
Publisher’s Note: MDPI stays neutral with regard to jurisdictional claims in published maps and institutional affiliations.

