3.1. Analysis of Apparent Phenomena of Freeze–Thaw Testing
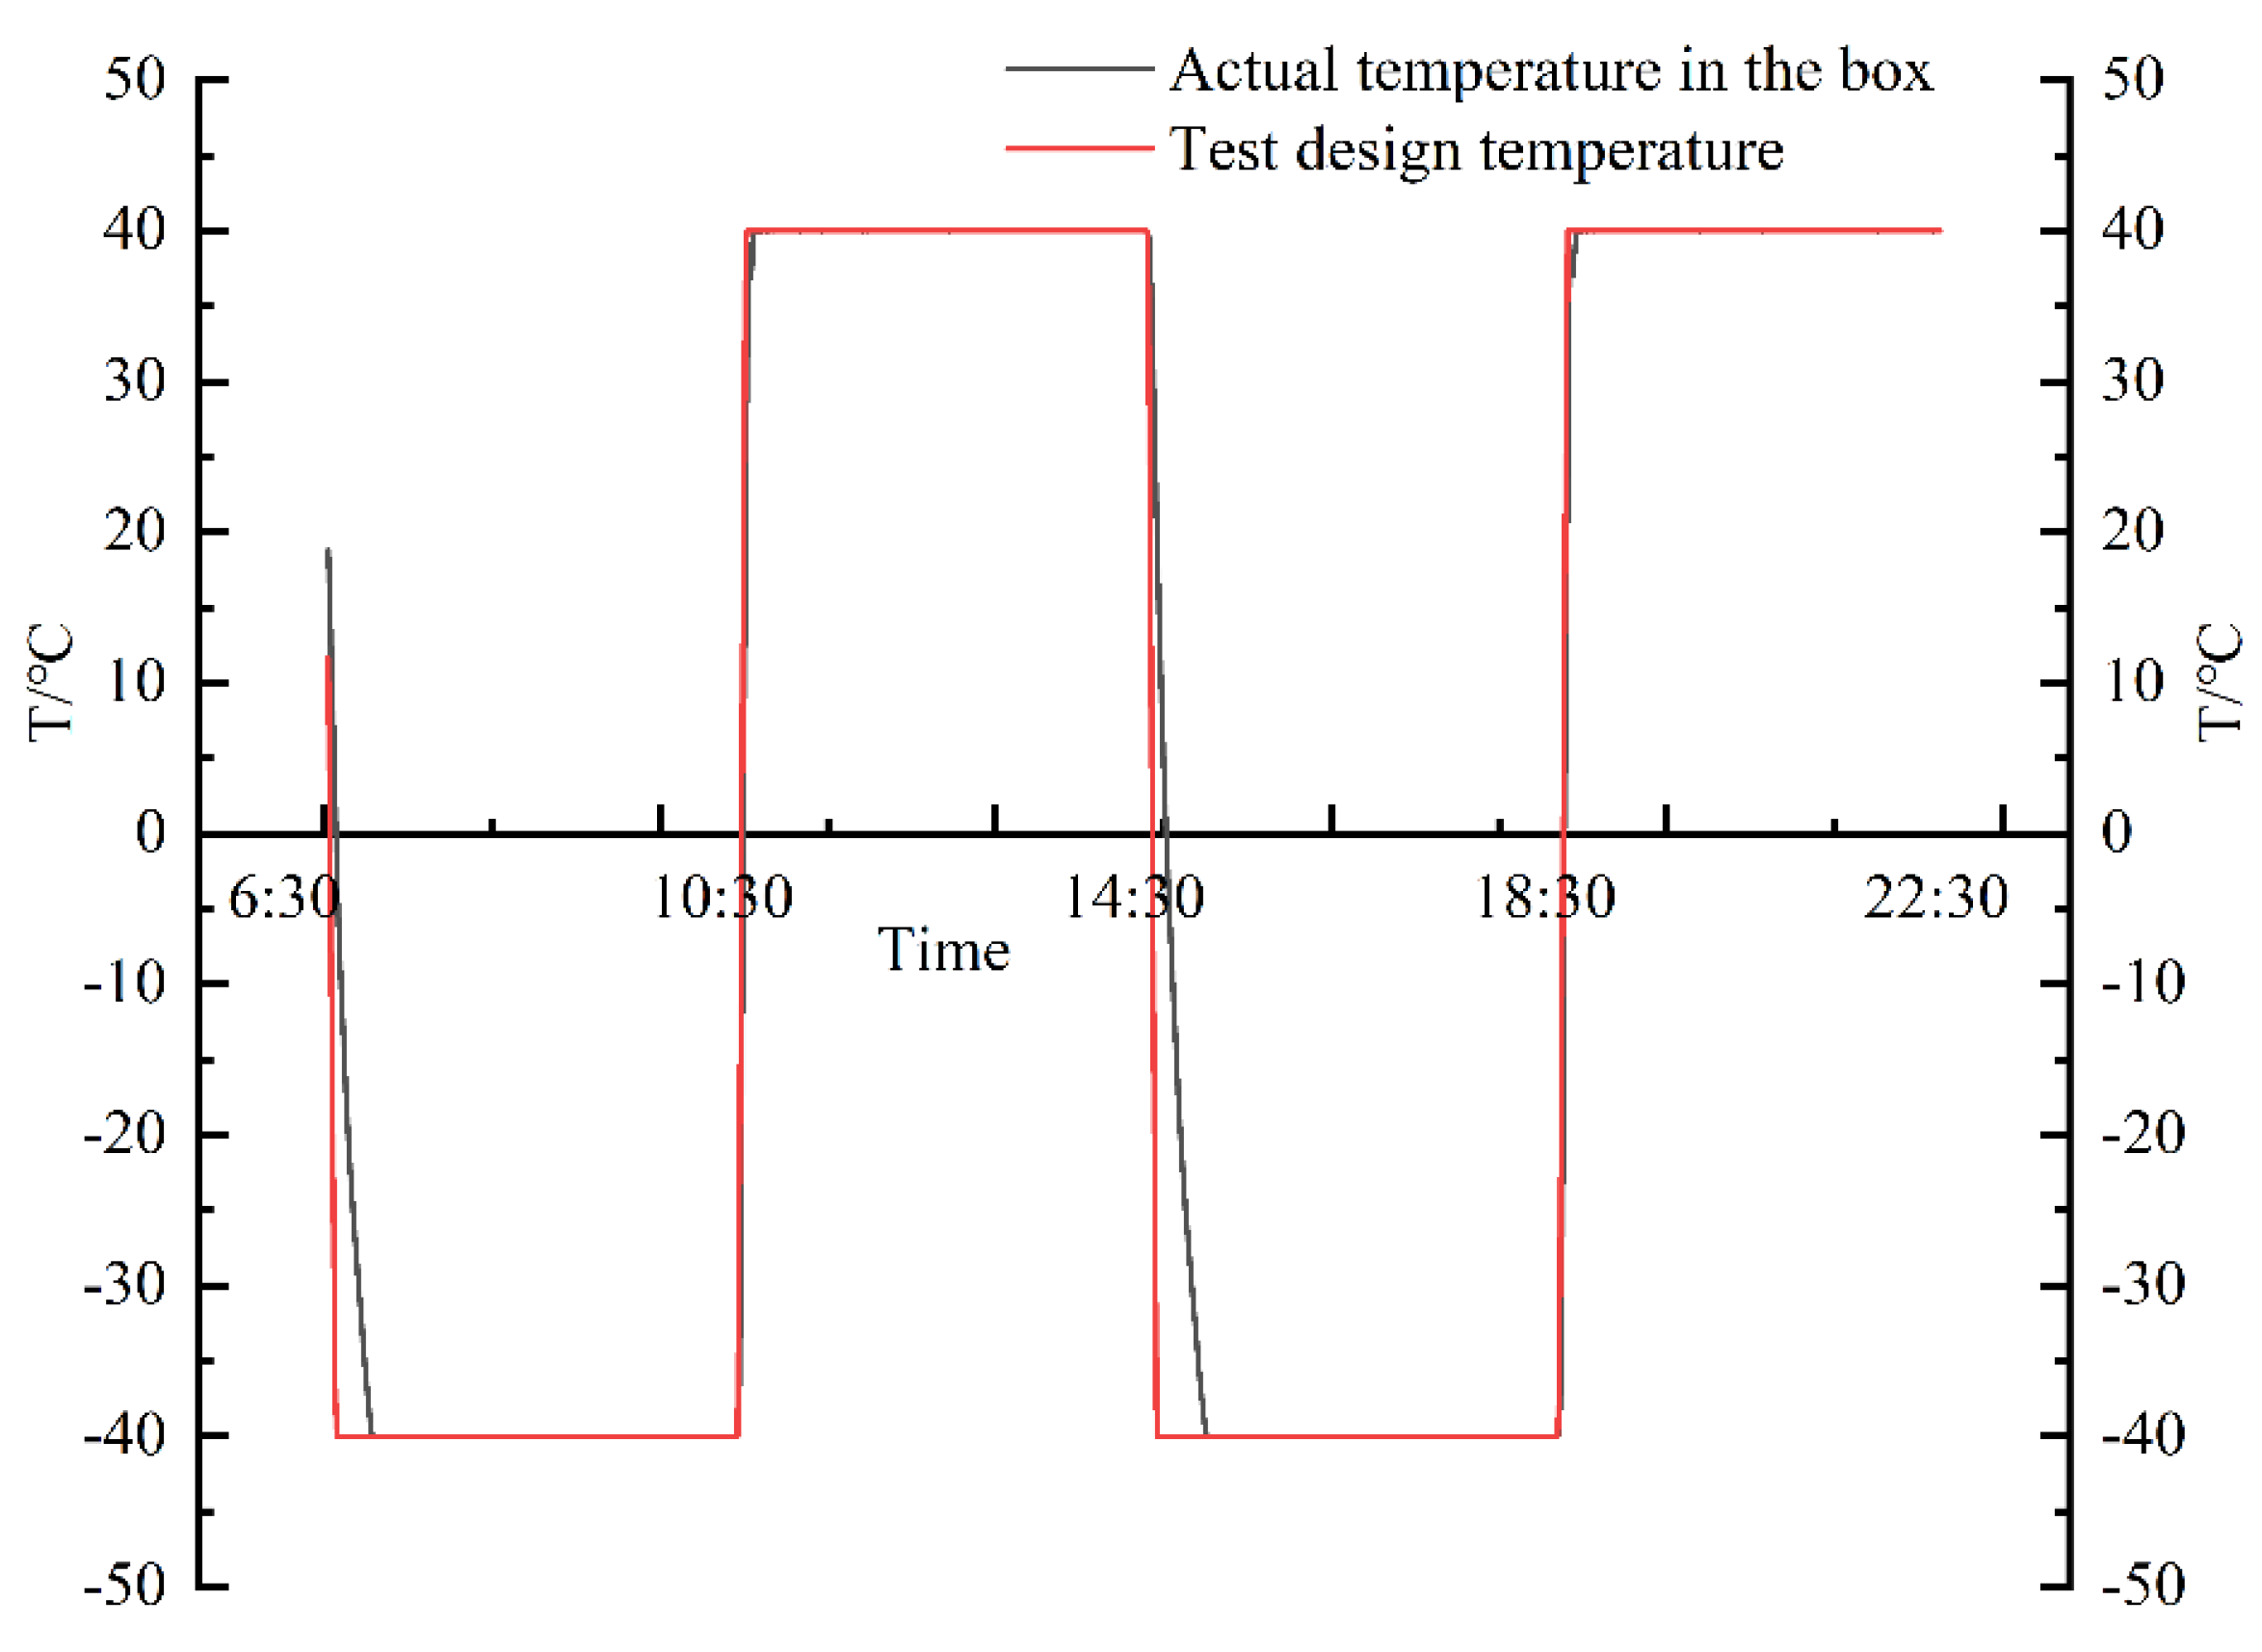
Figure 3 shows trends of freezing–thawing test temperatures. In freeze–thaw cycles, sample practical temperatures rapidly reduced from room temperature to the designed −40 °C within 28 min. For example, it took only 36 min for the sample experimental temperature to decrease from 40 °C to −40 °C and only 14 min to heat from −40 °C to 40 °C. Therefore, when the temperature is between −40 °C and 40 °C, the rising rate of rock temperature is 2.57 times the falling rate.
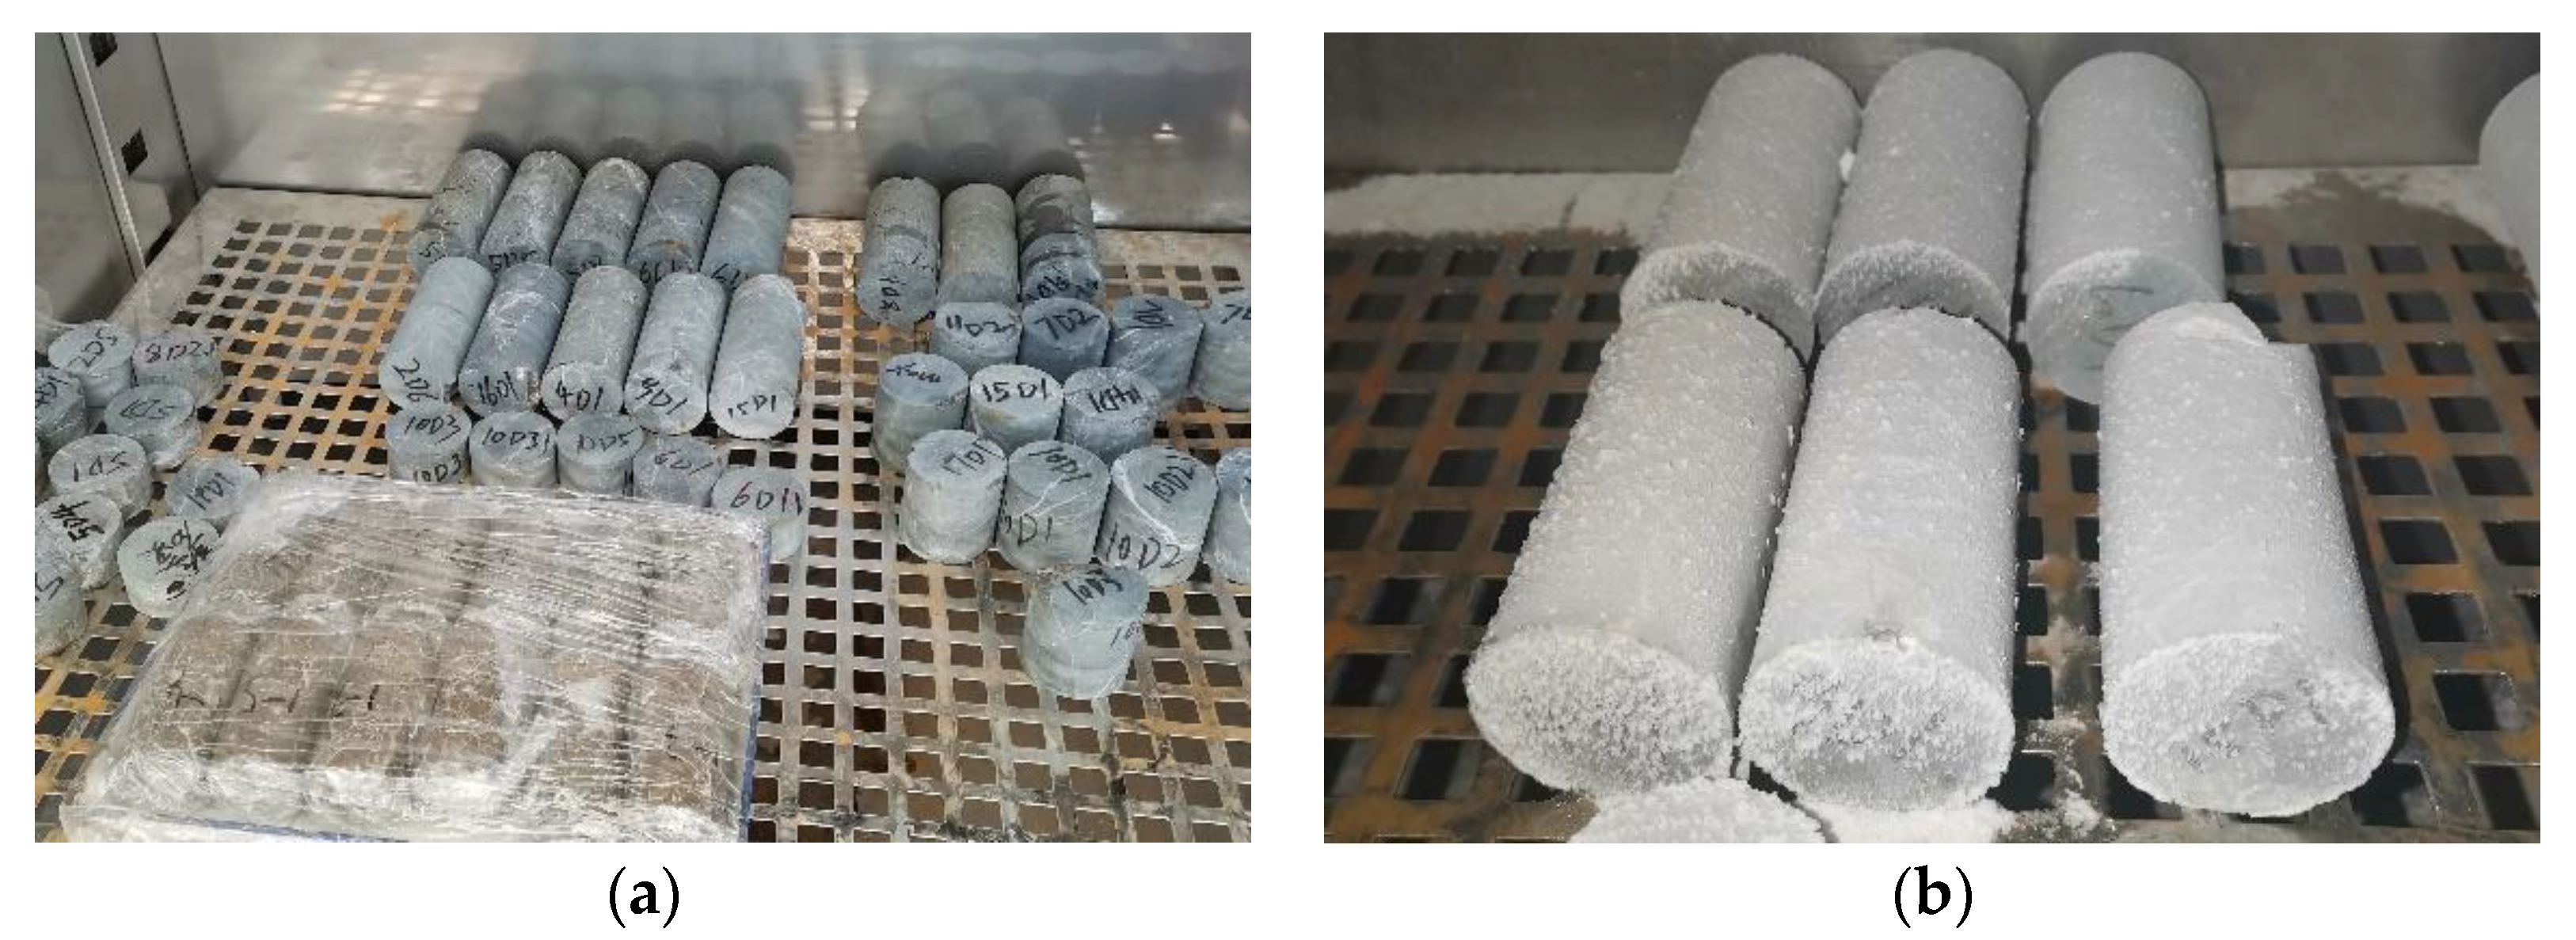
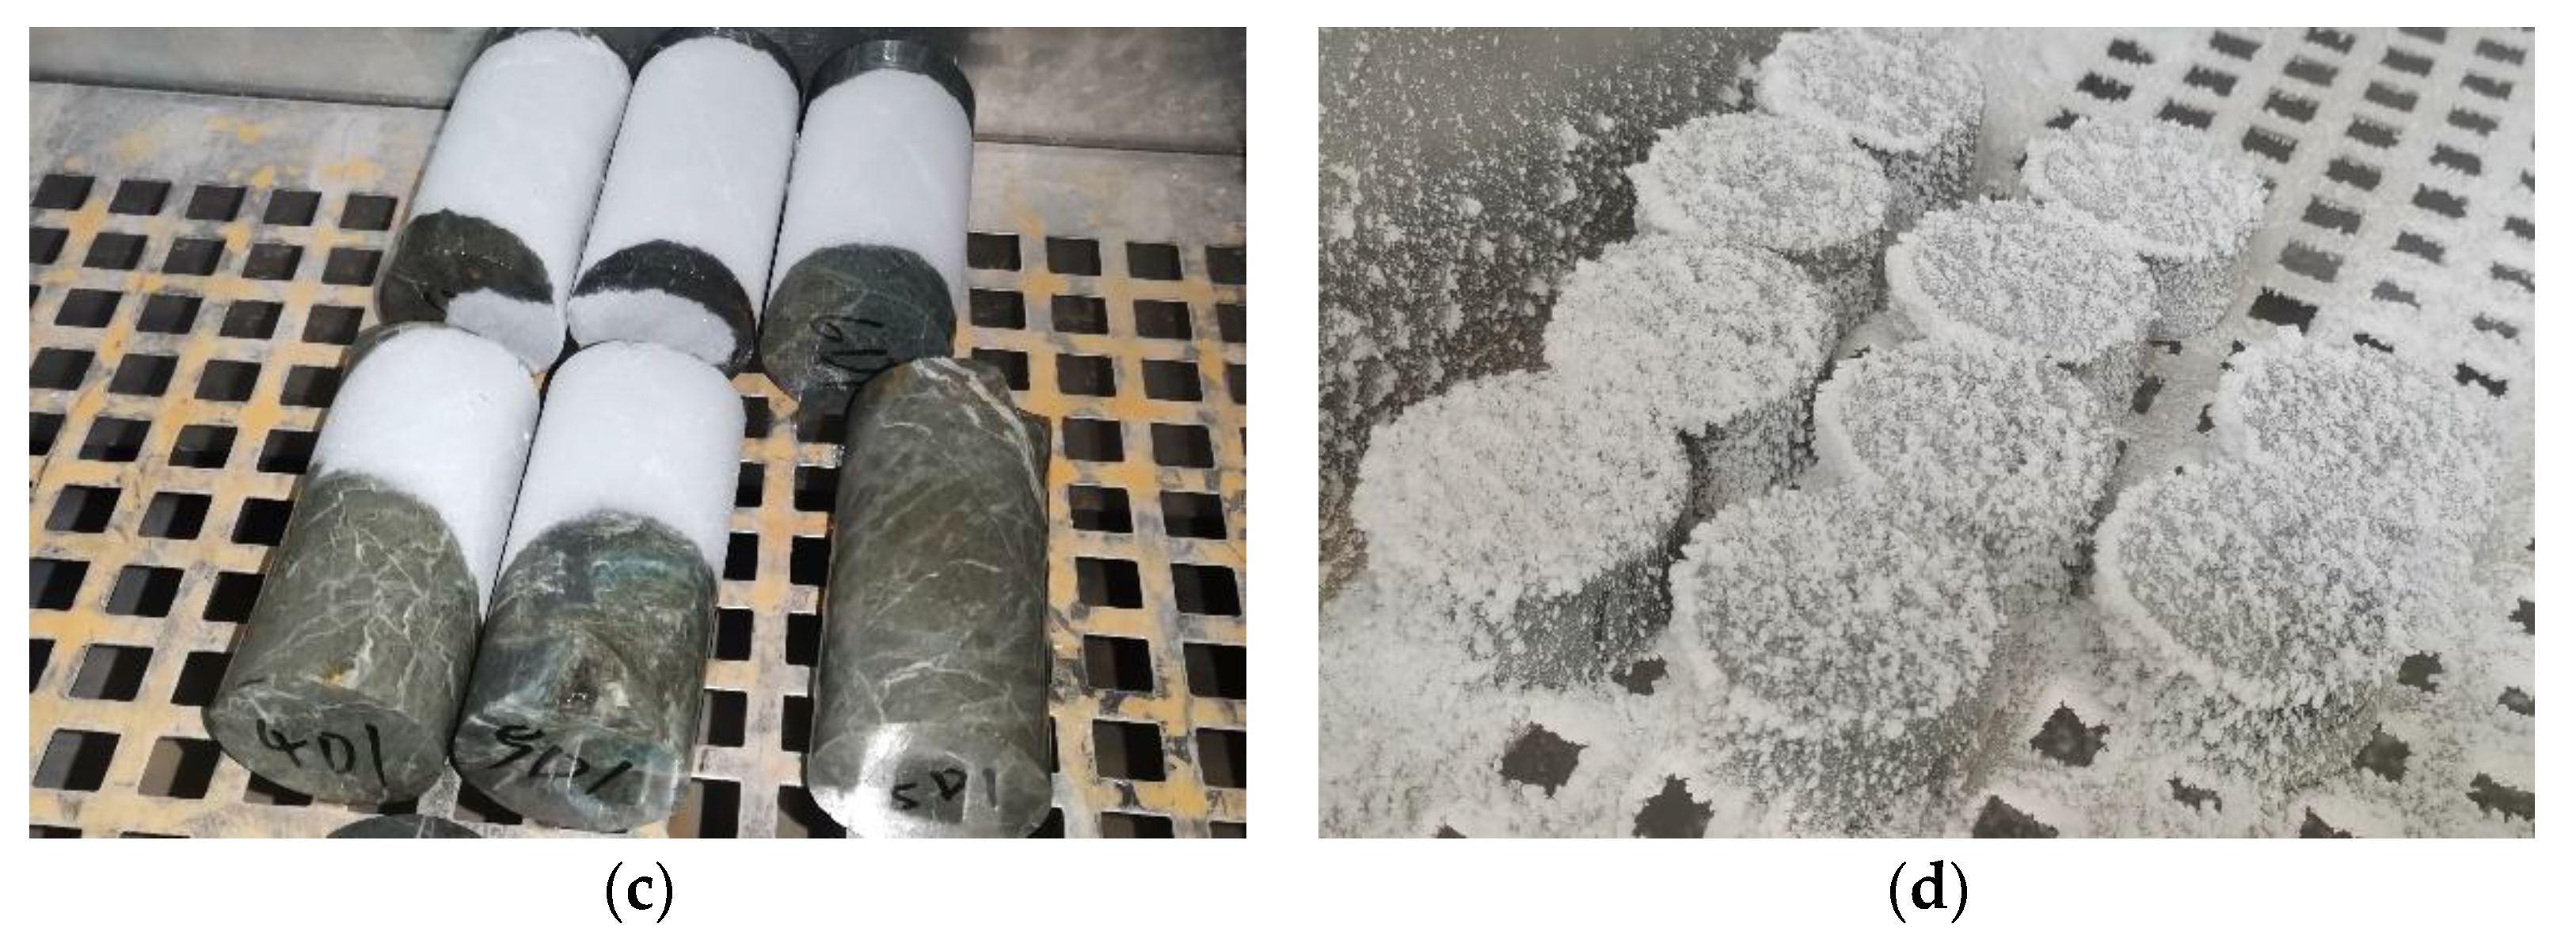
Figure 7 shows sample appearance at different freeze–thaw cycling stages.
Figure 7a shows the original samples before the freeze–thaw test, without moisture and ice on the surface.
Figure 7b shows the appearance of a dry sample after being deep-frozen. It has a thin layer of ice distributed with granular protrusion freezing points, and the sample was visible from the upper and bottom surfaces.
Figure 7c shows the sample situation after freezing and beginning high-temperature ablation for a while. The frozen thin ice on its surface gradually melts, and the ablation process starts from the upper surface and gradually melts downward, in which the surface granular protrusion freezing point melts first.
Figure 7d is the deep-frozen immersion-saturated sample. Its surface ice was more significant than in the dry sample, the granular protrusion freezing point was denser, and the sample was not visible from the upper or bottom surface.
After several freeze–thaw tests, the apparent analysis revealed that the sample showed no evident changes in the surface ice thickness and freezing point density after several cycles. The surface ice thickness of the dry sample was slightly smaller than that of the immersion-saturated sample. As a result, the granular protrusion freezing points were more sparsely distributed than the immersion-saturated sample.
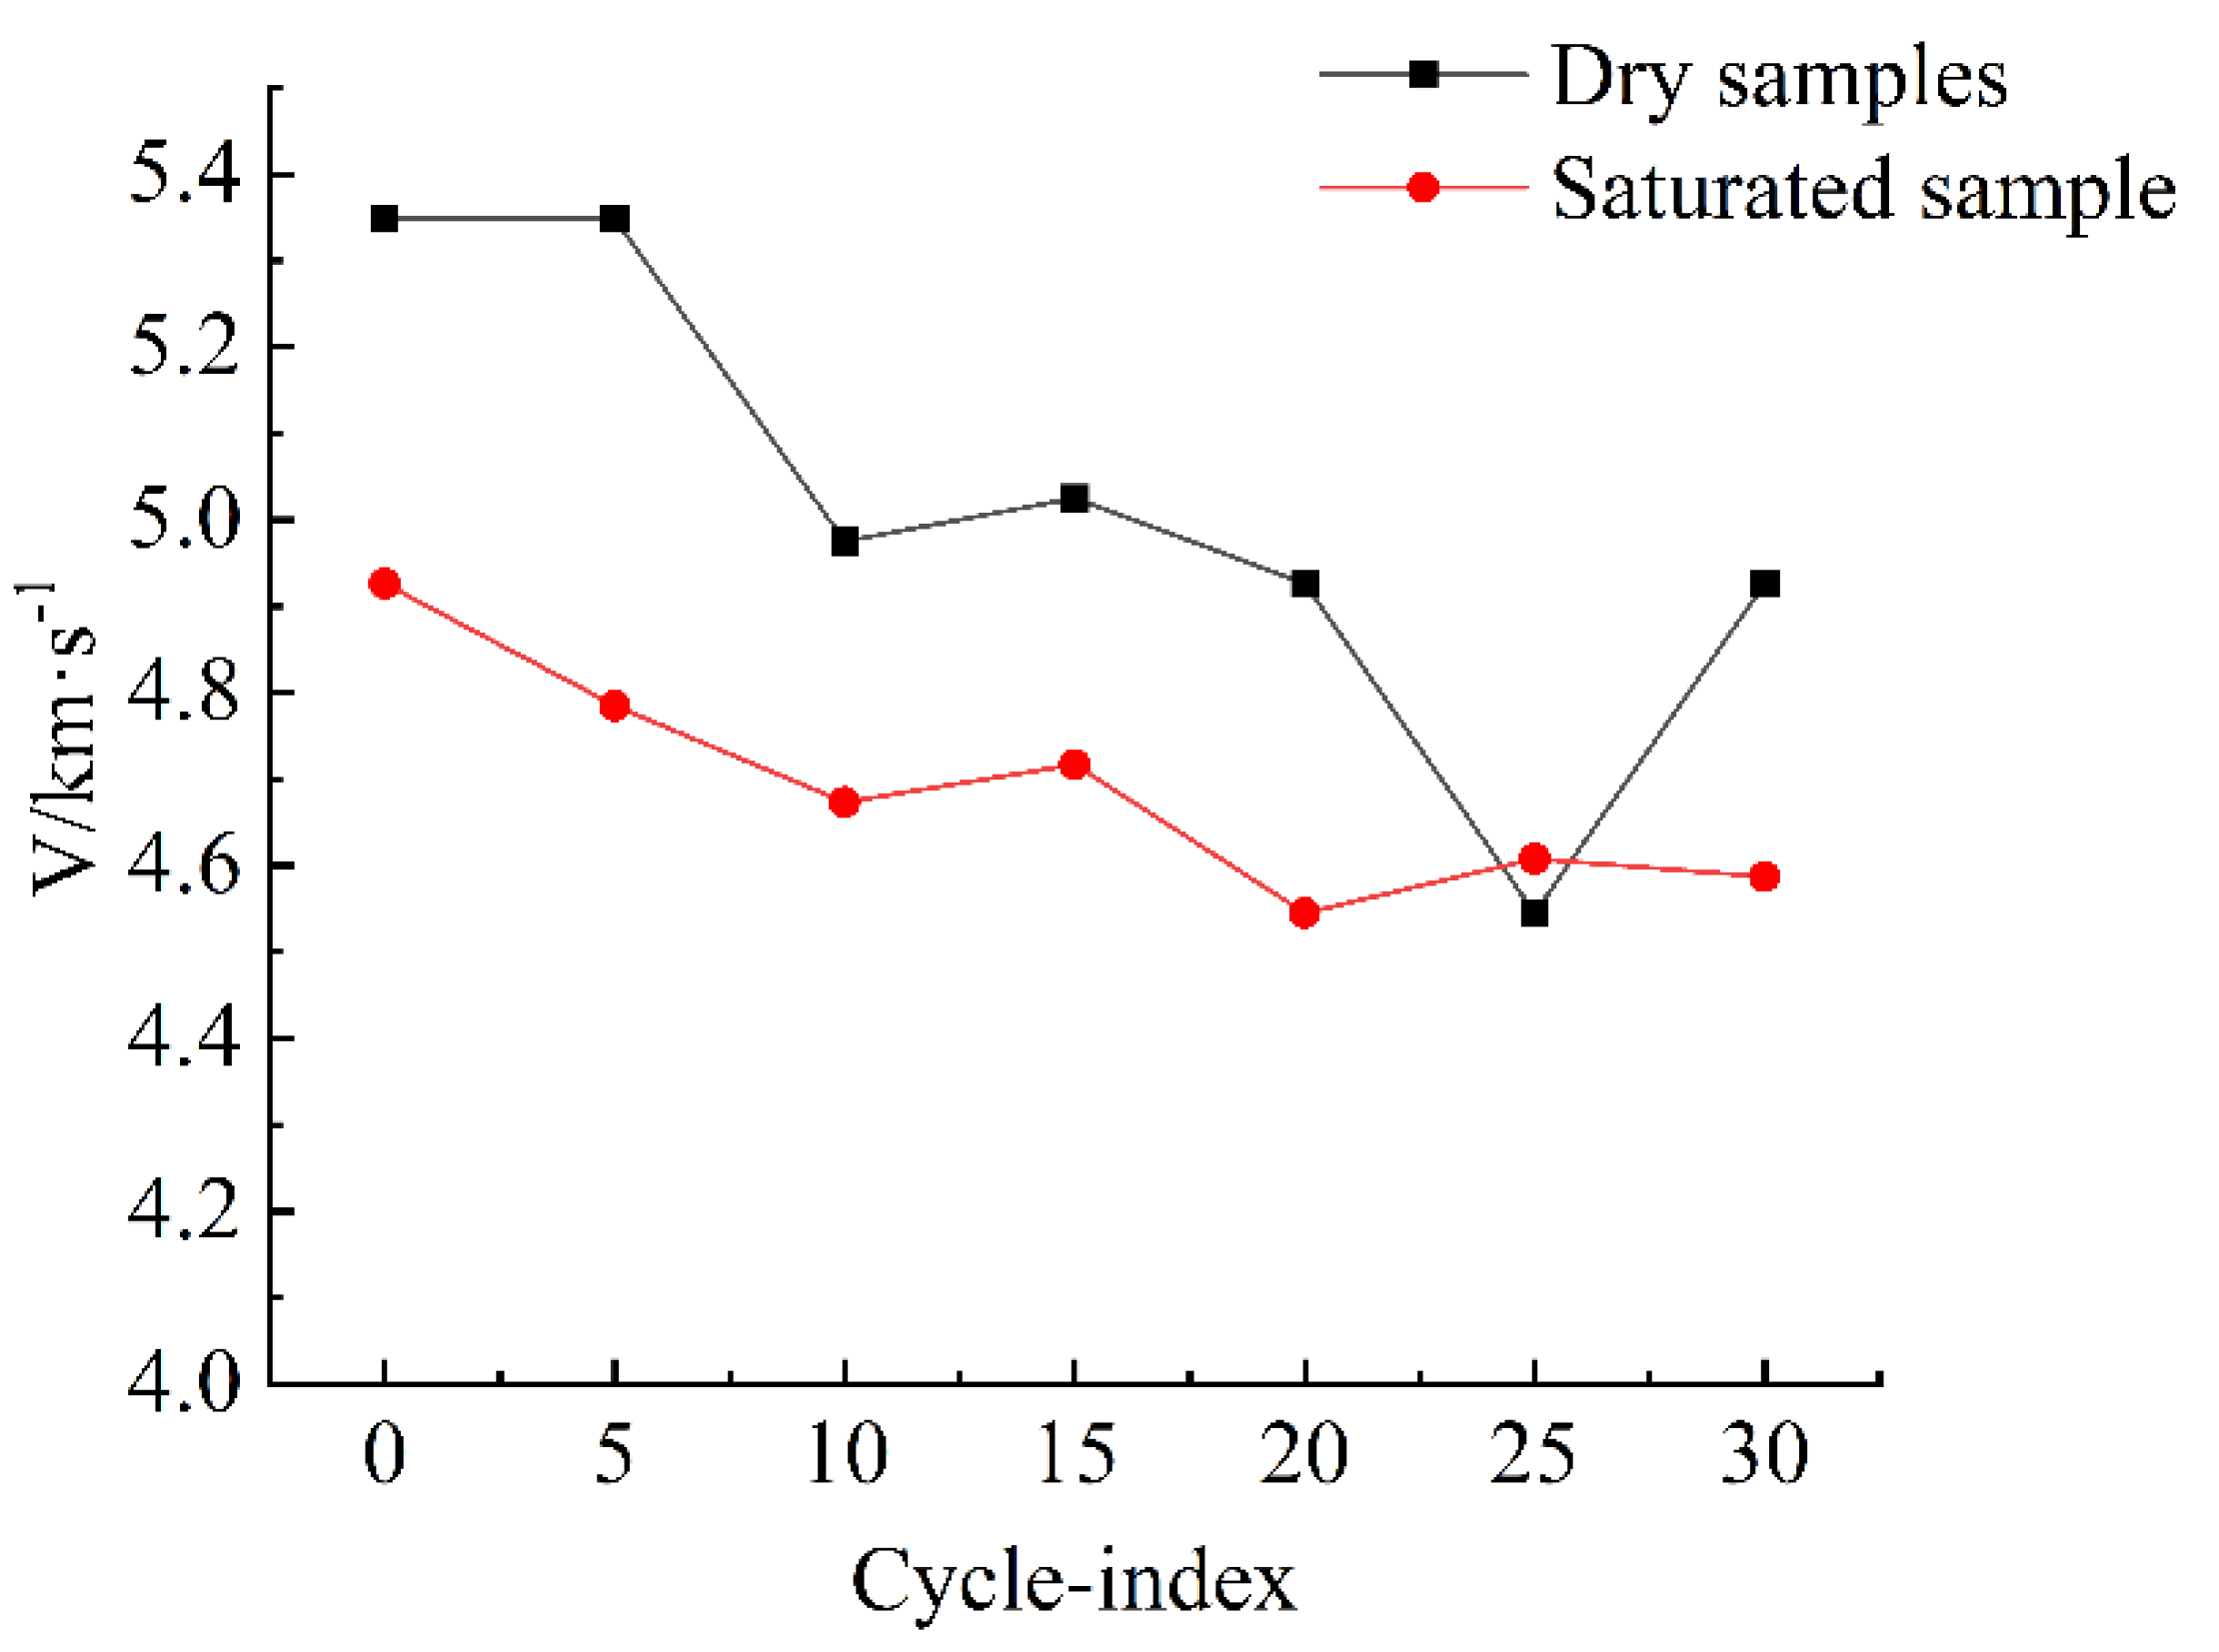
3.2. Shear Wave Velocity Test
Table 2 illustrates the impacts of freezing–thawing cycling on shear wave speed and amplitude of rocks. As shown in
Table 2 and
Figure 8, shear wave speeds of dry and immersion-saturated samples decreased as the number of freezing–thawing cycles increased. After the first 30 freezing–thawing cycles, the shear wave speeds of dry and immersion-saturated samples decreased by 0.8 and 0.34 km/s. The wave speed of the dry sample was significantly higher than that of the immersion-saturated sample.
As the number of freeze–thaw cycles increased, the difference in shear wave velocity between the two types of samples reduced, suggesting that, after a certain number of cycles, the difference between a dry sample and an immersion-saturated sample became less, and the wave velocity tended to stabilize, and no significant fluctuation was generated.
As shown in
Table 2 and
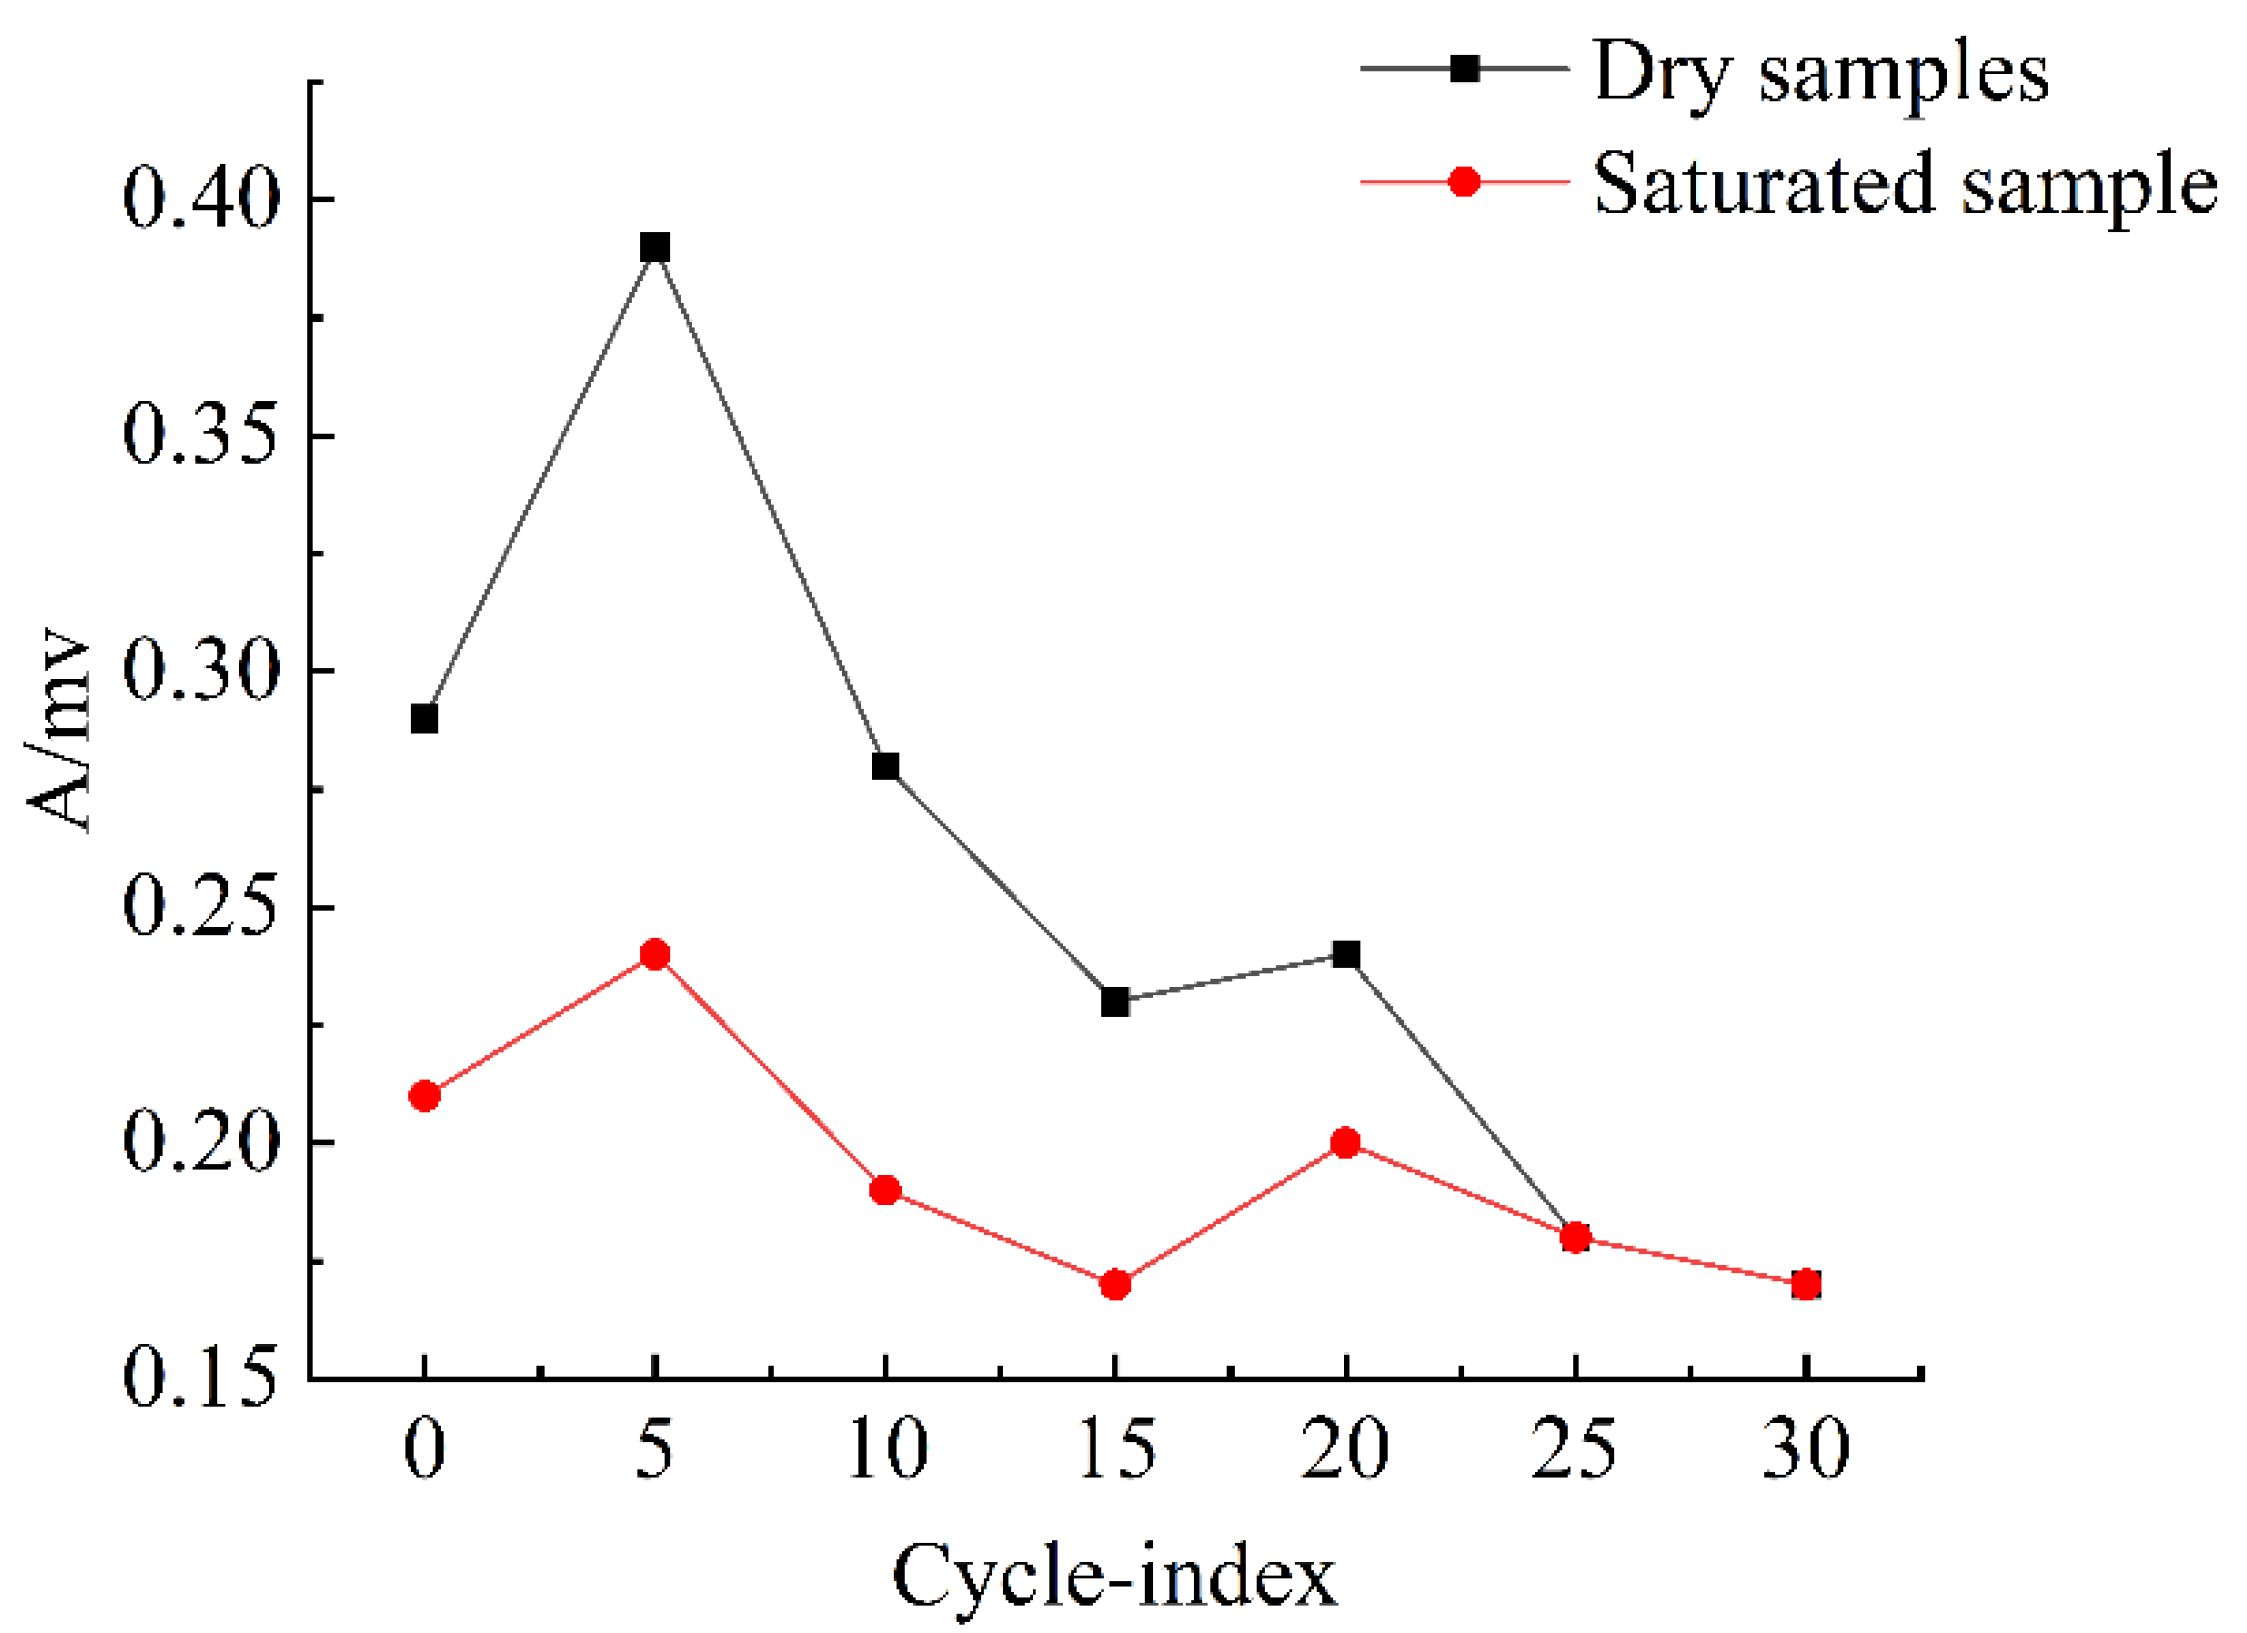
Figure 9, both amplitudes increased before decreasing with the increasing number of freeze–thaw cycles. In addition, the dry sample had a more apparent decreasing trend.
During the first five cycles, the amplitudes of both dry and immersion-saturated samples increased with the number of freeze–thaw cycles. However, the rate of amplitude increase of the dry sample was significantly higher than that of the immersion-saturated sample. Both amplitudes decreased after the 5th freeze–thaw cycle, and both amplitudes were stable after the 25th cycle. We predicted that after freeze–thaw cycles of a limited number of cycles, amplitudes of both samples decreased, stabilizing after a limited number of cycles, with no significant fluctuation with the increase of the cycle number.
According to the physical properties of waves, the freeze–thaw cycle test changes the nature of the propagating medium to a certain extent, which, in turn, leads to a change in the wave velocity.
In Equation (1), V is the speed of sound in km/s; T is the sound time in μs; h is the height of the specimen in m.
In Equation (2), c is the wave speed, λ is the wavelength, and f is the frequency of the wave.
According to Equations (1) and (2), the propagation medium changes the wavelength, which, in turn, leads to a decrease in wave speed. Since the biggest difference between different propagation media is density, the analysis concluded that the freeze–thaw cycling action changed the density of the specimens, and there was a slight difference in the density of the specimens after different numbers of freeze–thaw cycles.
Zhu G. et al. [
39] analyzed that the density is proportional to the wave velocity, and according to the wave velocity test results, as the number of freeze–thaw cycles increases, the specimen wave velocity decreases, that is, the density decreases.
According to the test results of water-saturated specimens and dry specimens, there is a difference, the analysis that the reason for this change is that the specimen after immersion in water changes the density of the specimen, etc., water fills the tiny voids inside the specimen, and the difference in the propagation medium causes the difference in wave speed and amplitude of the two specimens. The trend of wave velocity and amplitude after specimen immersion is relatively flat, and the analysis suggests that the difference between each specimen is reduced after water enters the tiny voids inside the specimen, which changes the wave propagation medium, so the trend is relatively flat, and the effect of freeze–thaw cycles on some properties of the rock, so that the wave velocity gradually decreases with the increase of the number of freeze–thaw cycles.
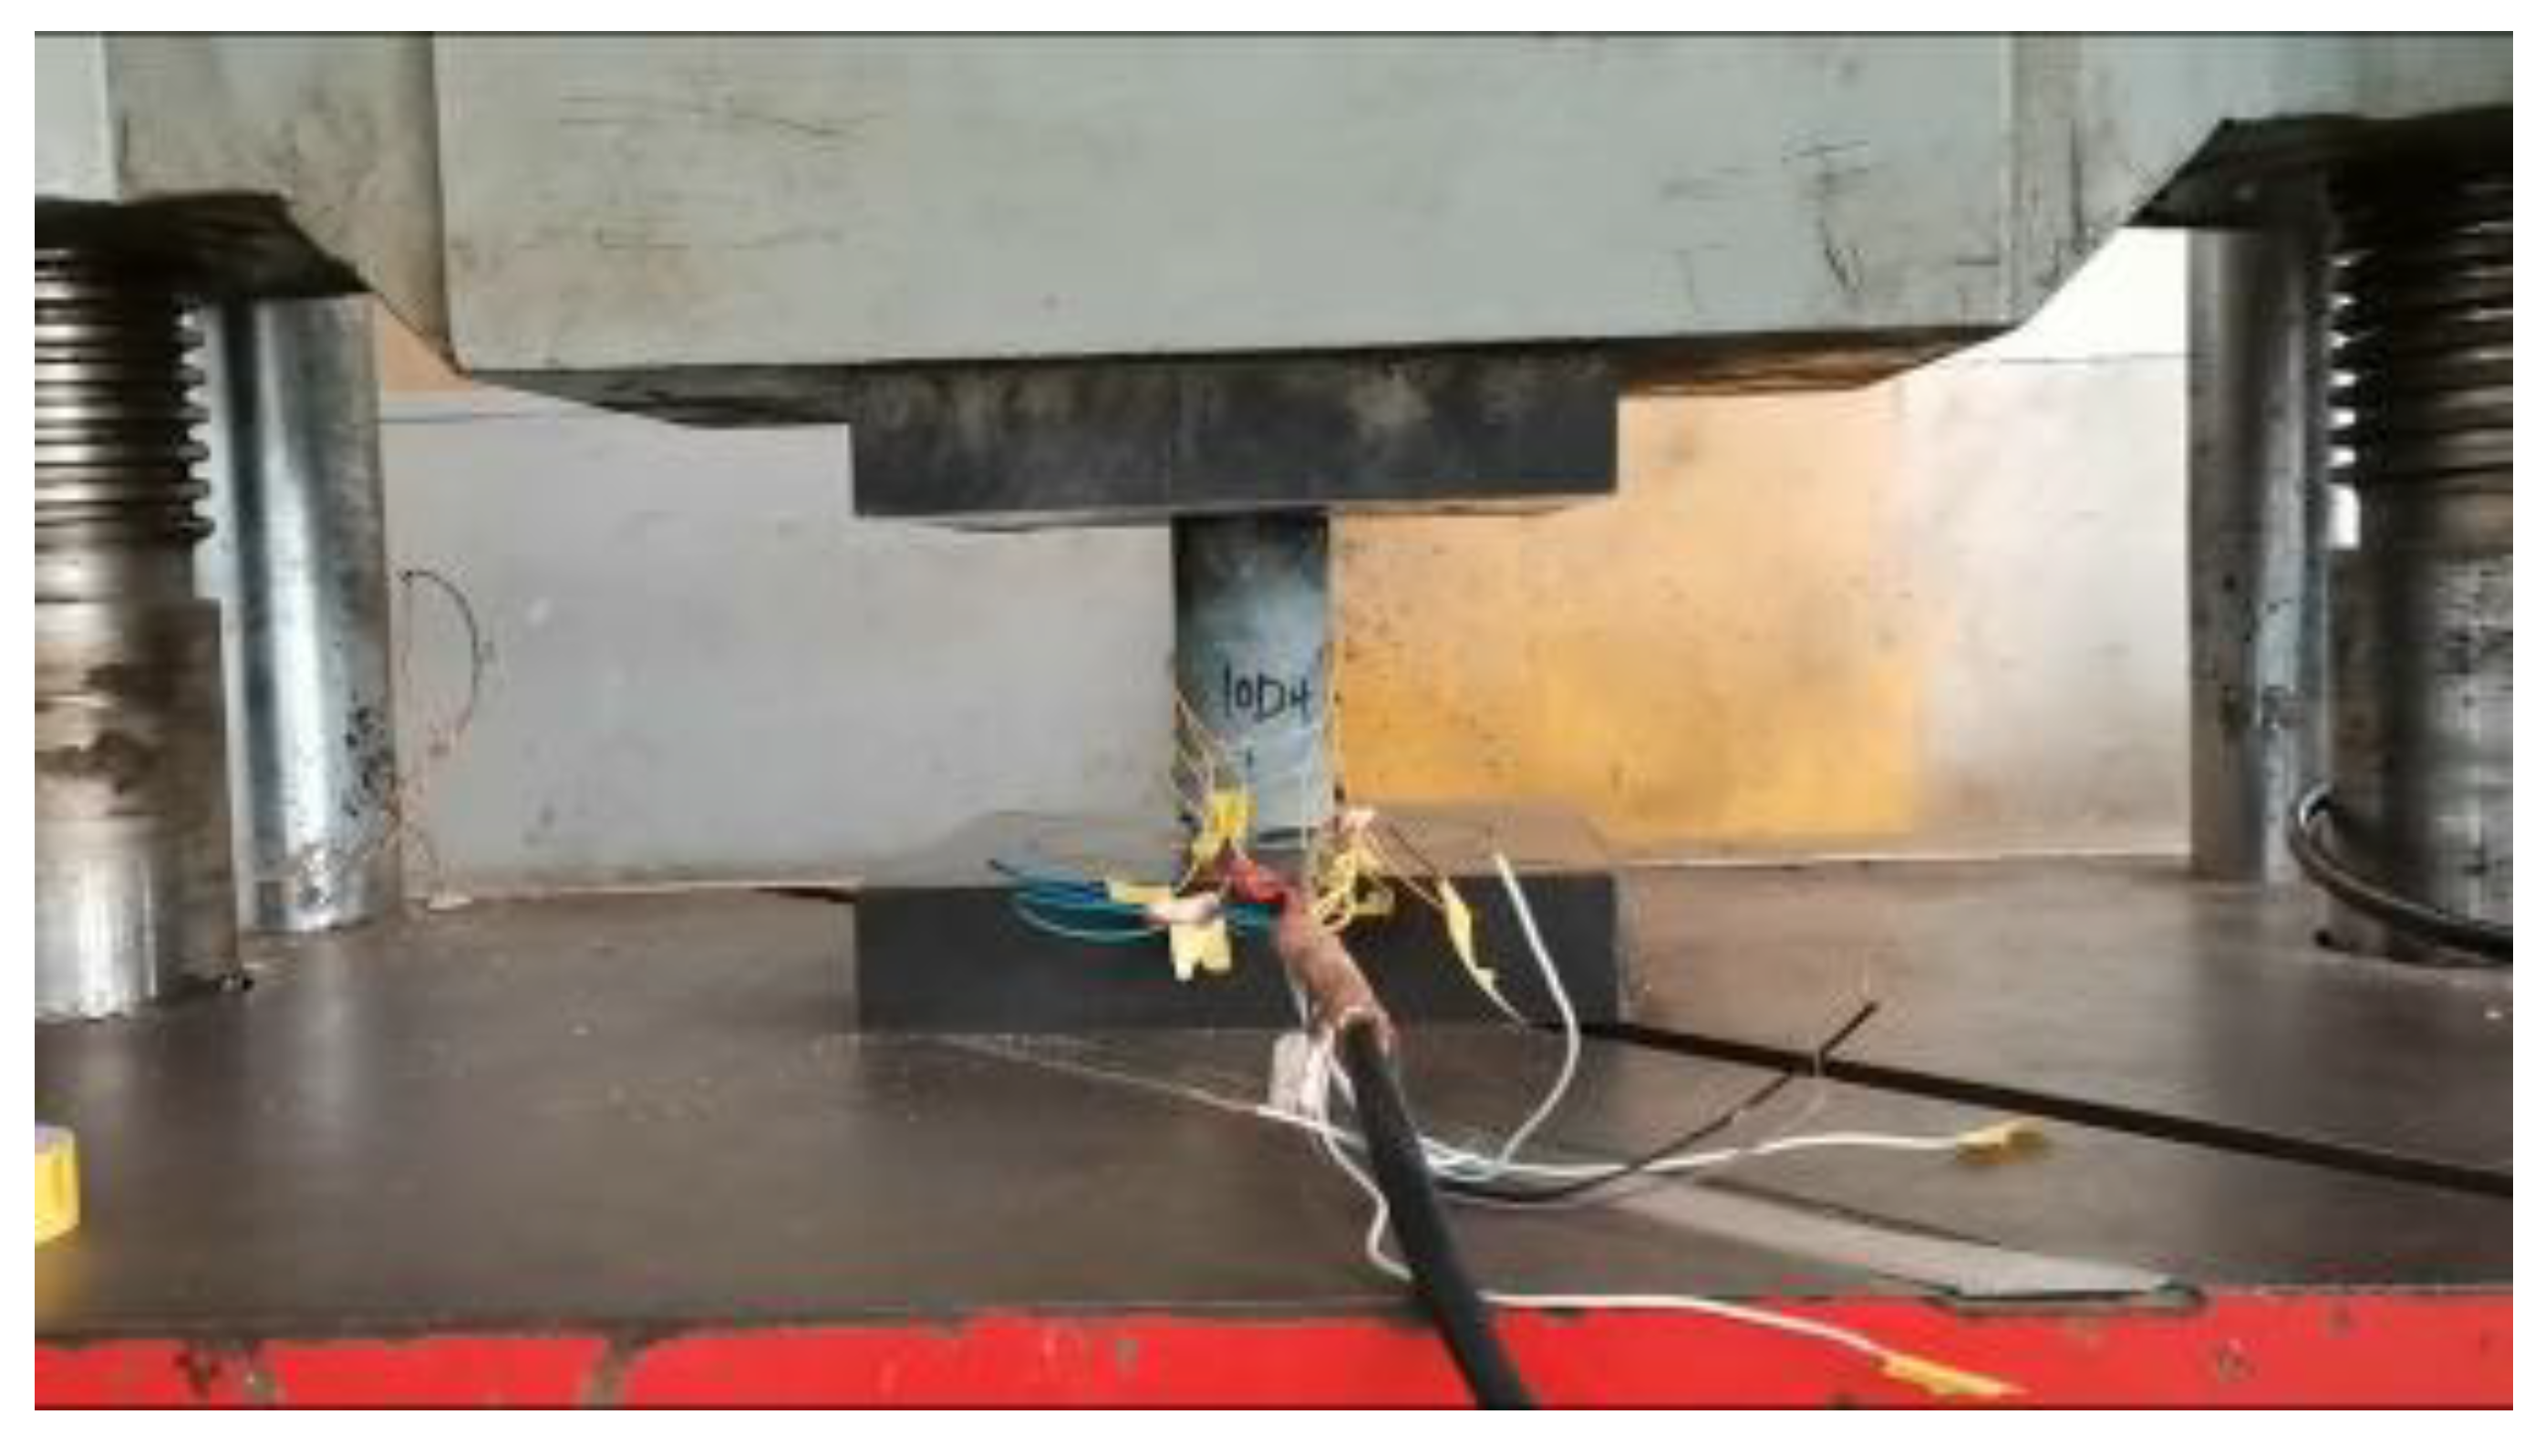
3.3. Uniaxial Compressive Strength Test
Table 3 illustrates the impacts of freeze–thaw cycling on the strength parameters of rocks.
According to
Table 3 and
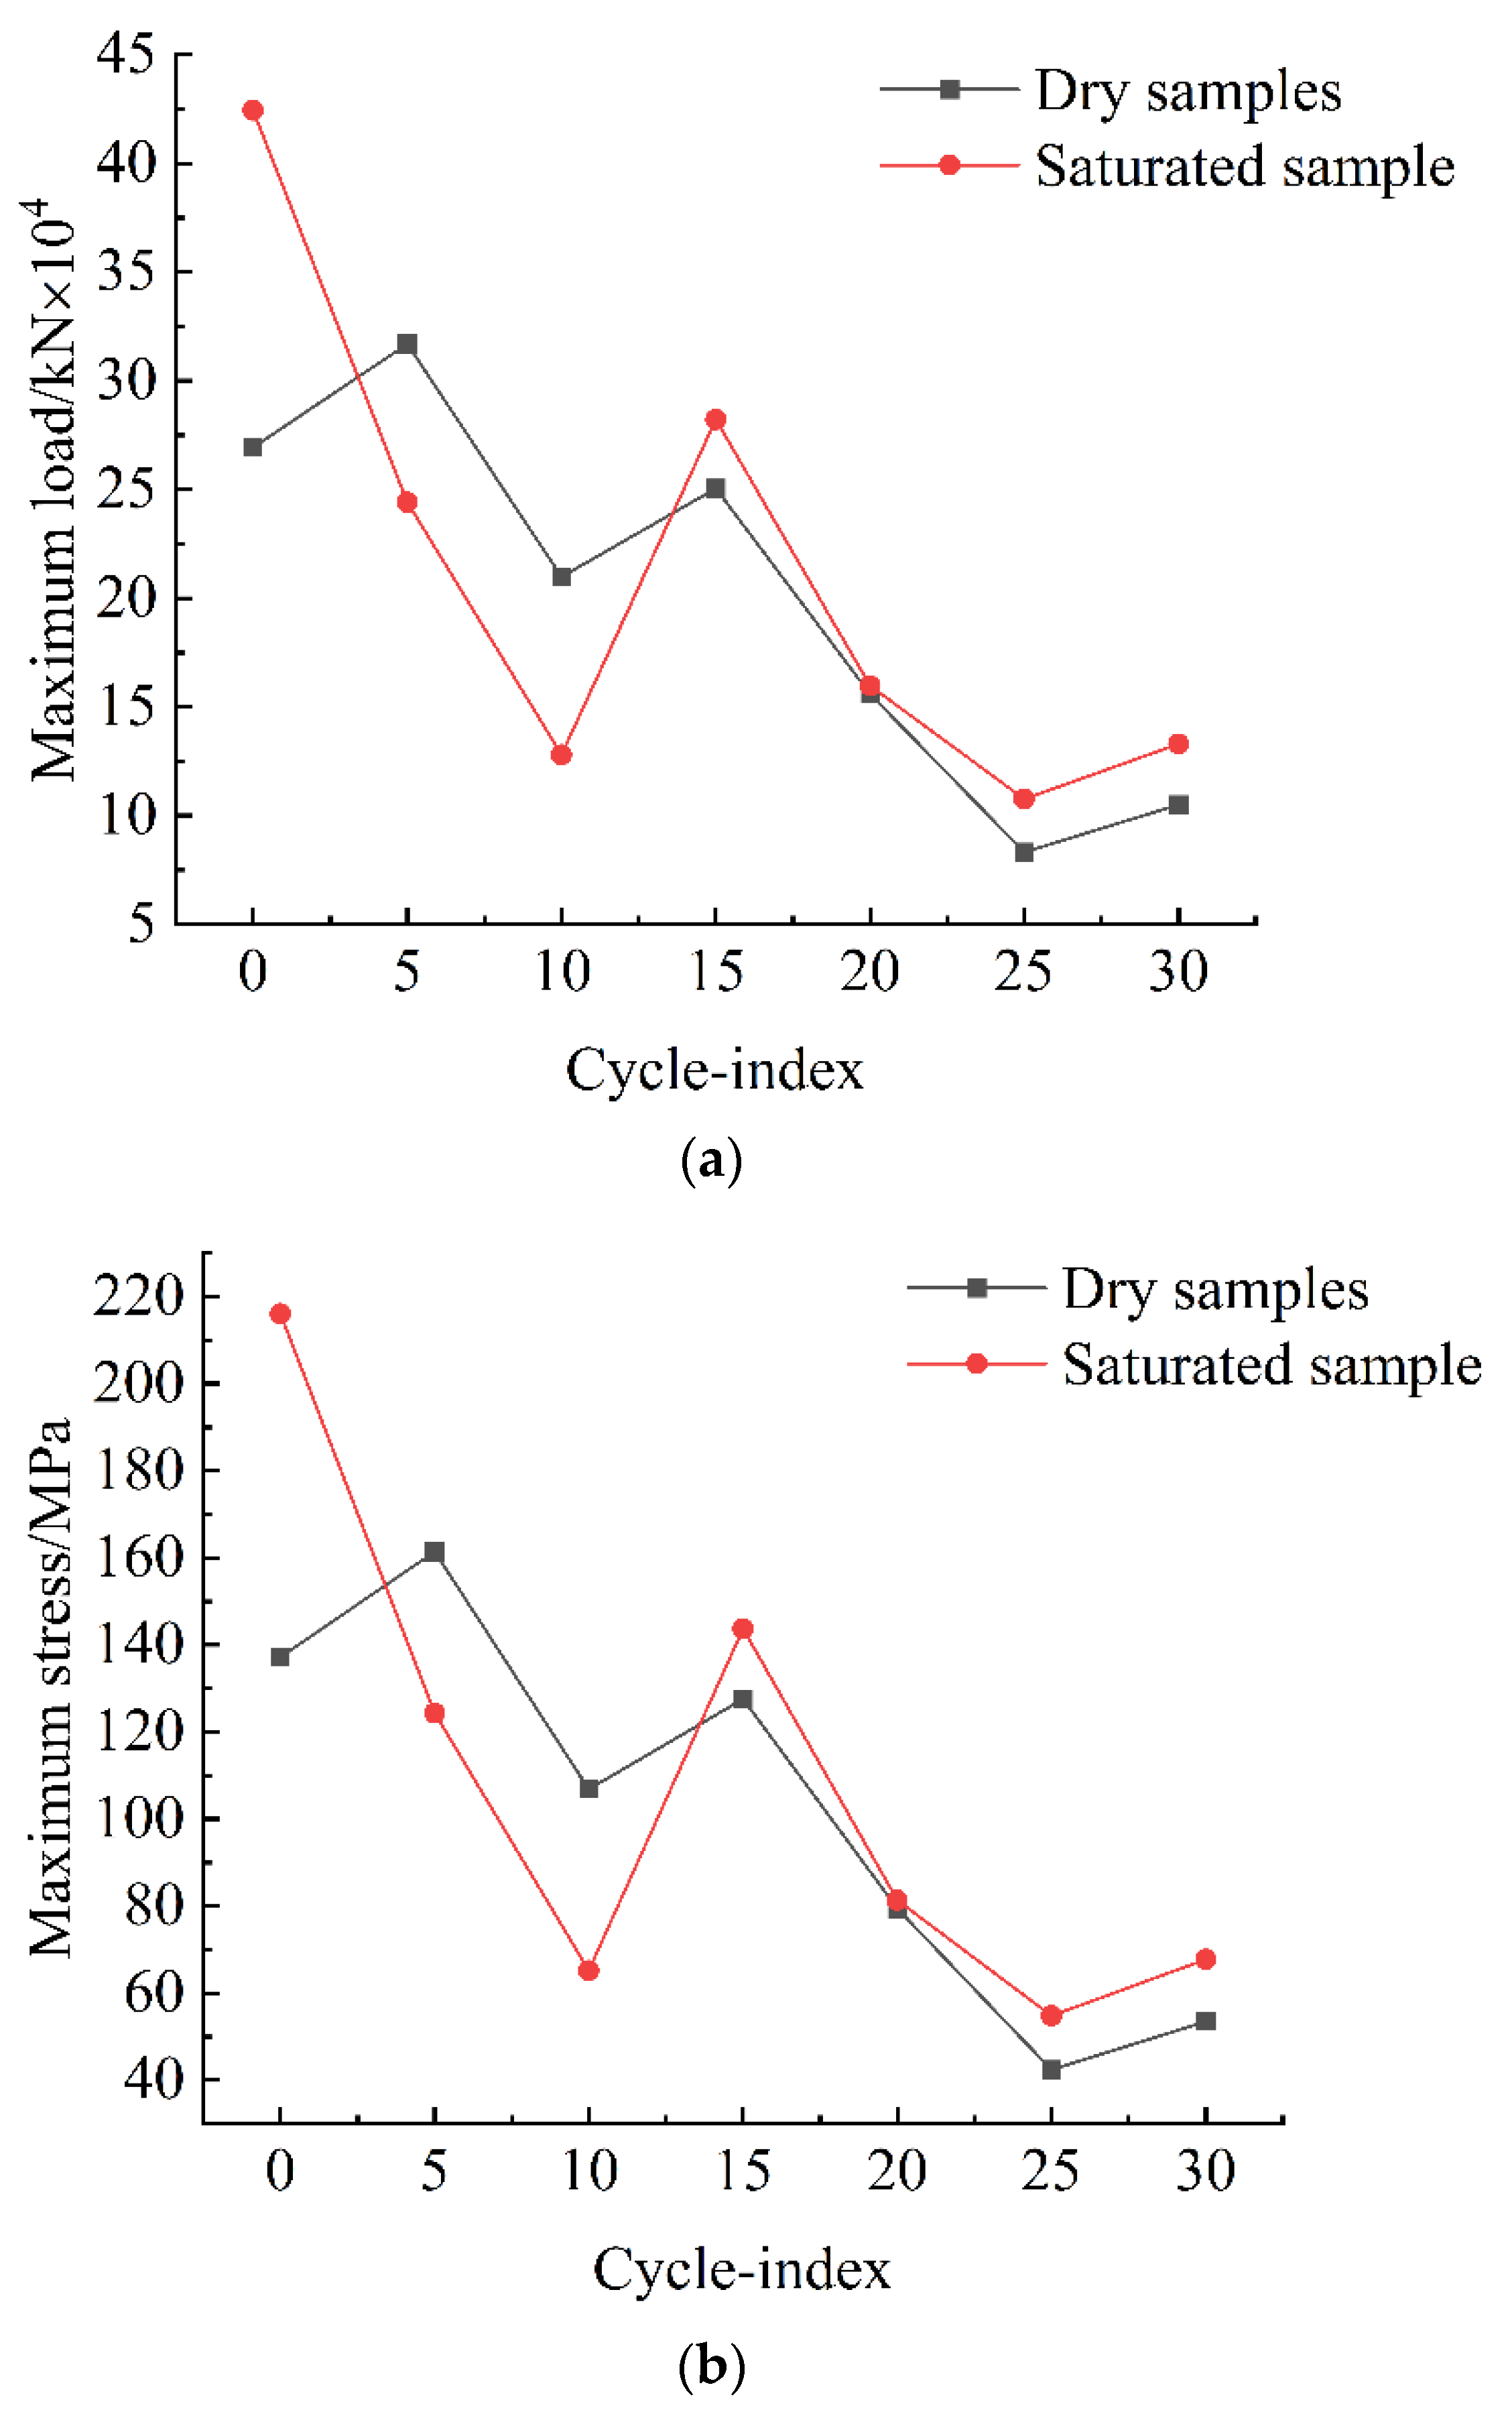
Figure 10, the uniaxial compressive strengths of samples decreased as the number of freeze–thaw cycles increased. Before the 13th freeze–thaw cycle, the uniaxial compressive strength of dry samples was significantly higher than that of immersion-saturated samples. However, the strengths of both samples decreased with the increasing number of freeze–thaw cycles. After the 13th freeze–thaw cycle, the strength of immersion-saturated samples was slightly larger than that of dry rock samples. However, with the increase in the number of freezing–thawing cycles, the uniaxial compressive strengths of both rock samples still decreased. However, strength decreased slightly less than before the 13th freezing–thawing cycle. After the 25th freezing–thawing cycle, the uniaxial compressive strengths of both rock samples increased somewhat. Still, the rate of increase was relatively low, suggesting that after a limited number of freeze–thaw cycles, uniaxial compressive strengths of the two rock samples remained within a specific range, and large fluctuations would not occur with the increase in the number of freeze–thaw cycles.
According to the analysis of the test results, the uniaxial compressive strength of the specimens decayed significantly after 30 freeze–thaw cycles, with the dry specimens decaying about 62.01% and the water-saturated specimens decaying about 68.65%. The reason for this situation was that the water immersion changed some properties inside the specimens, resulting in the difference in strength decay between the two specimens.
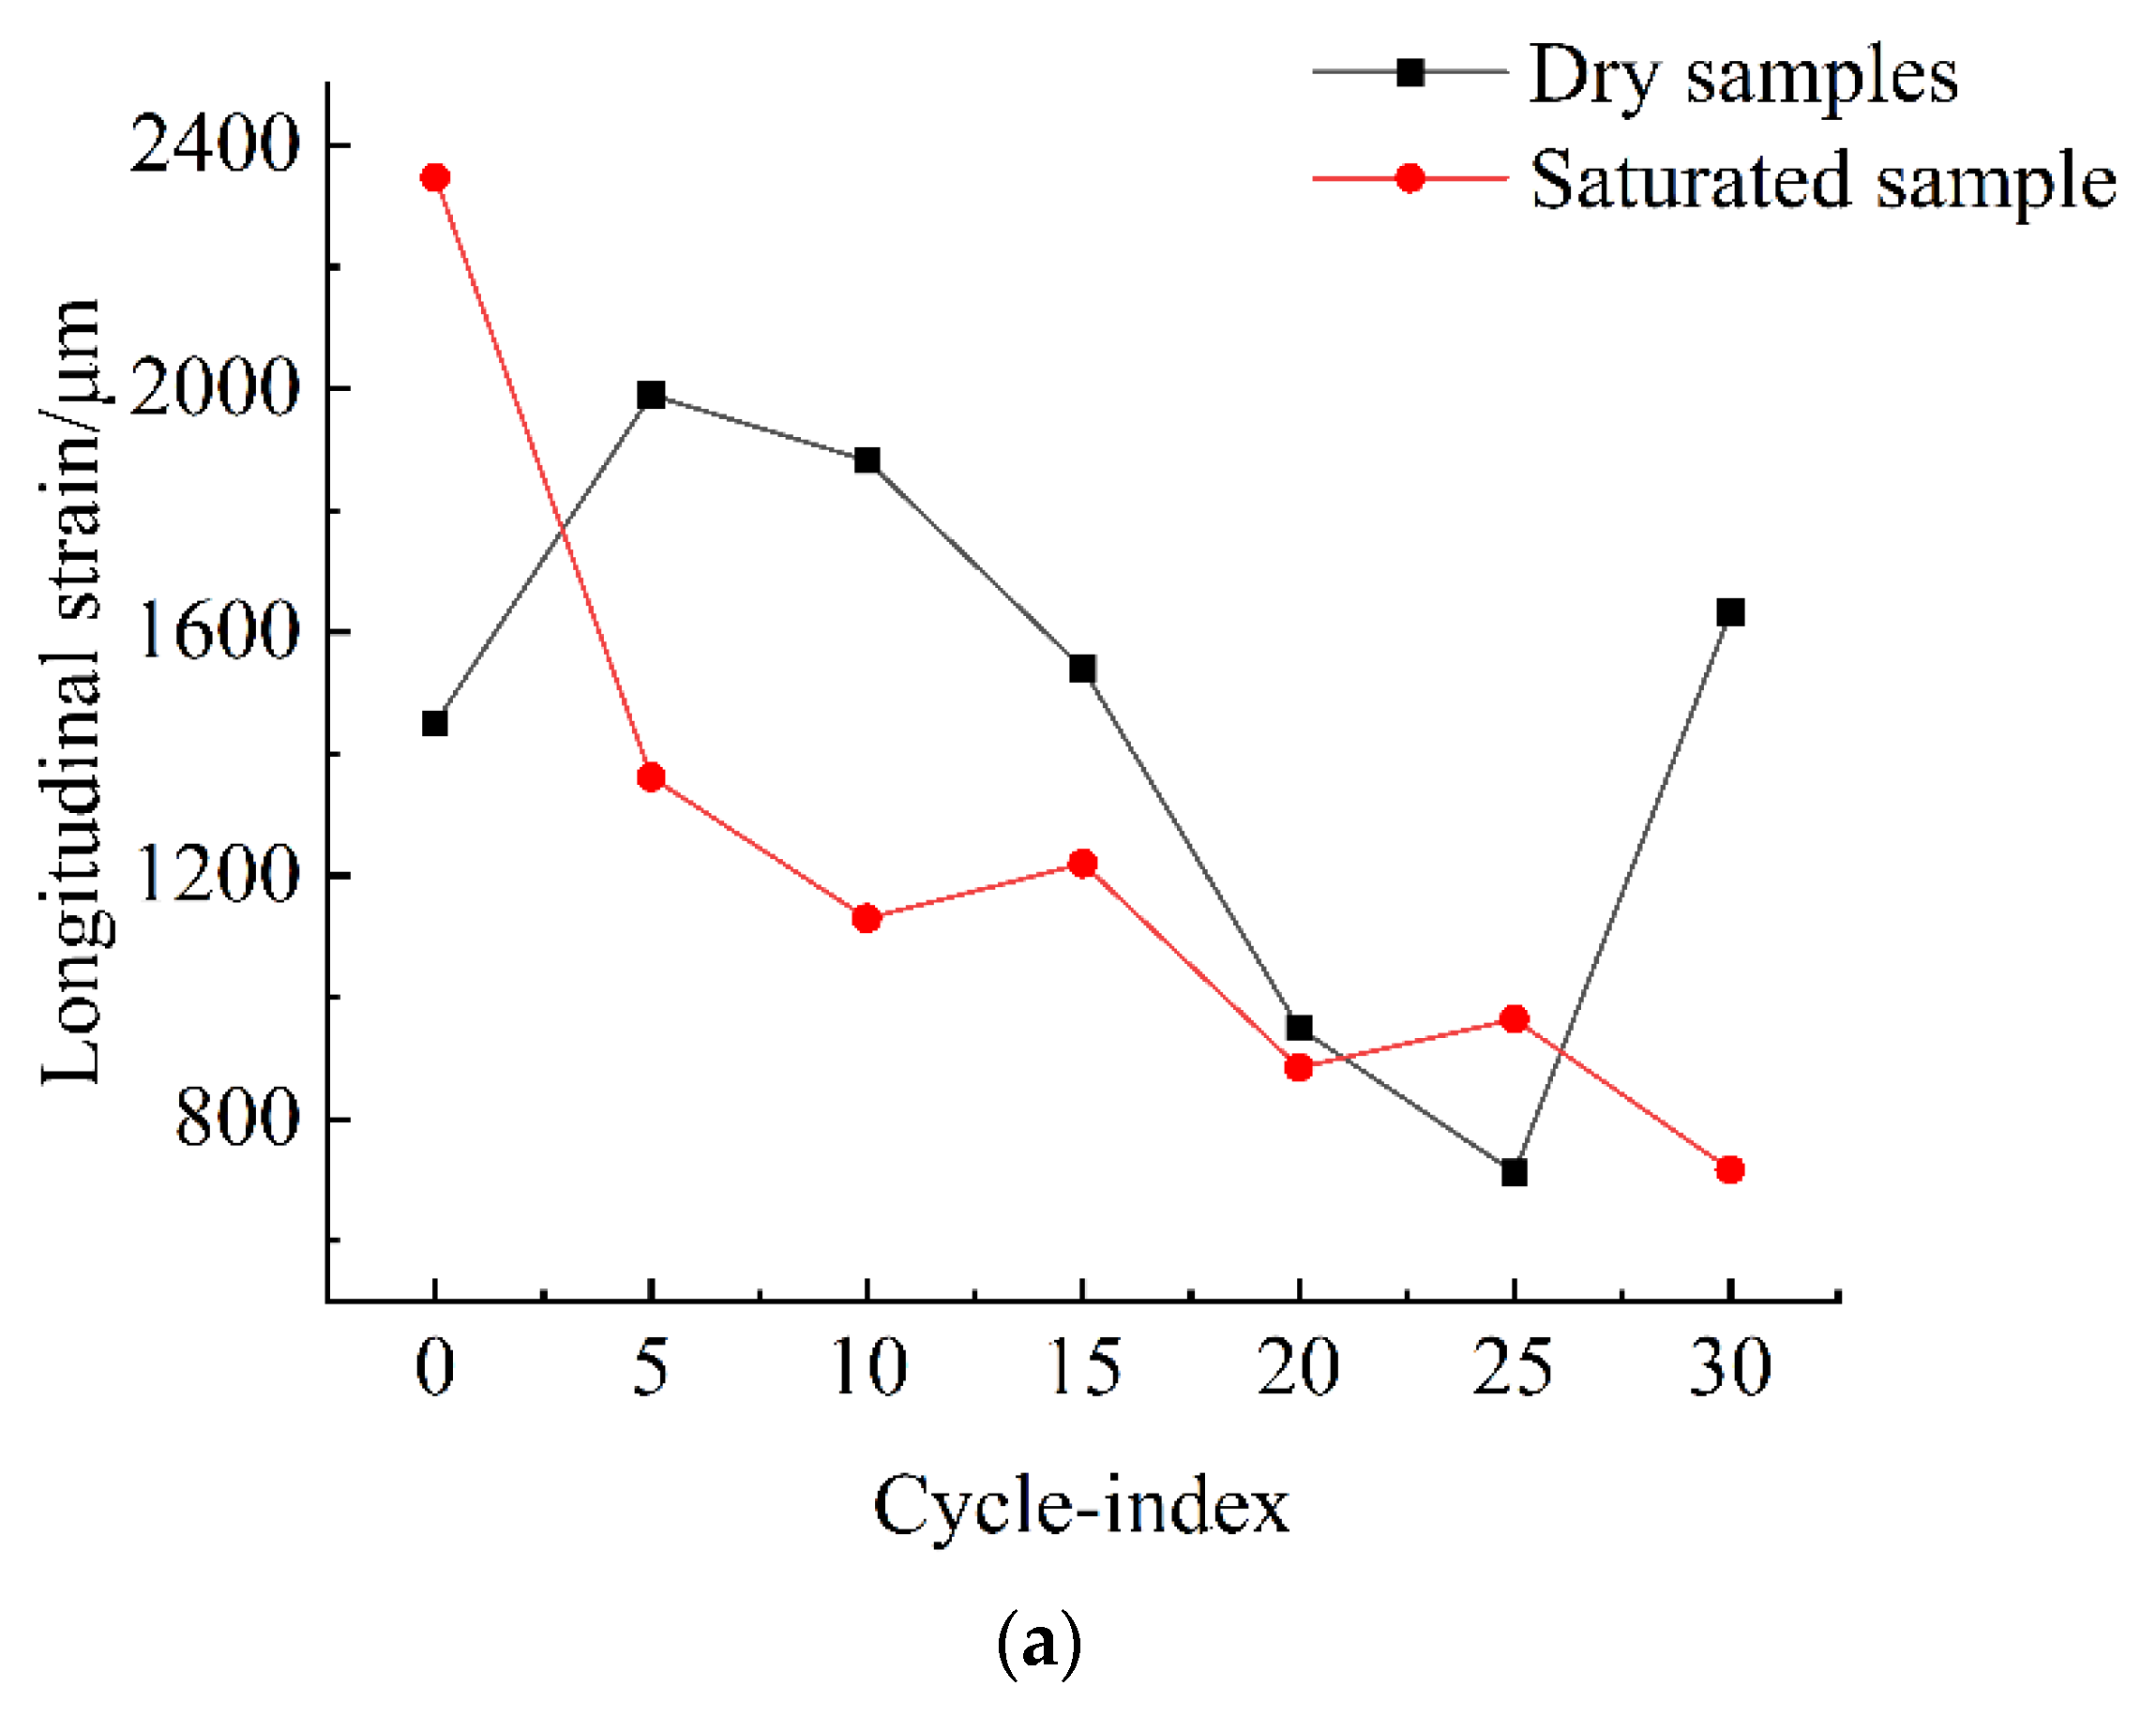
According to
Table 4 and
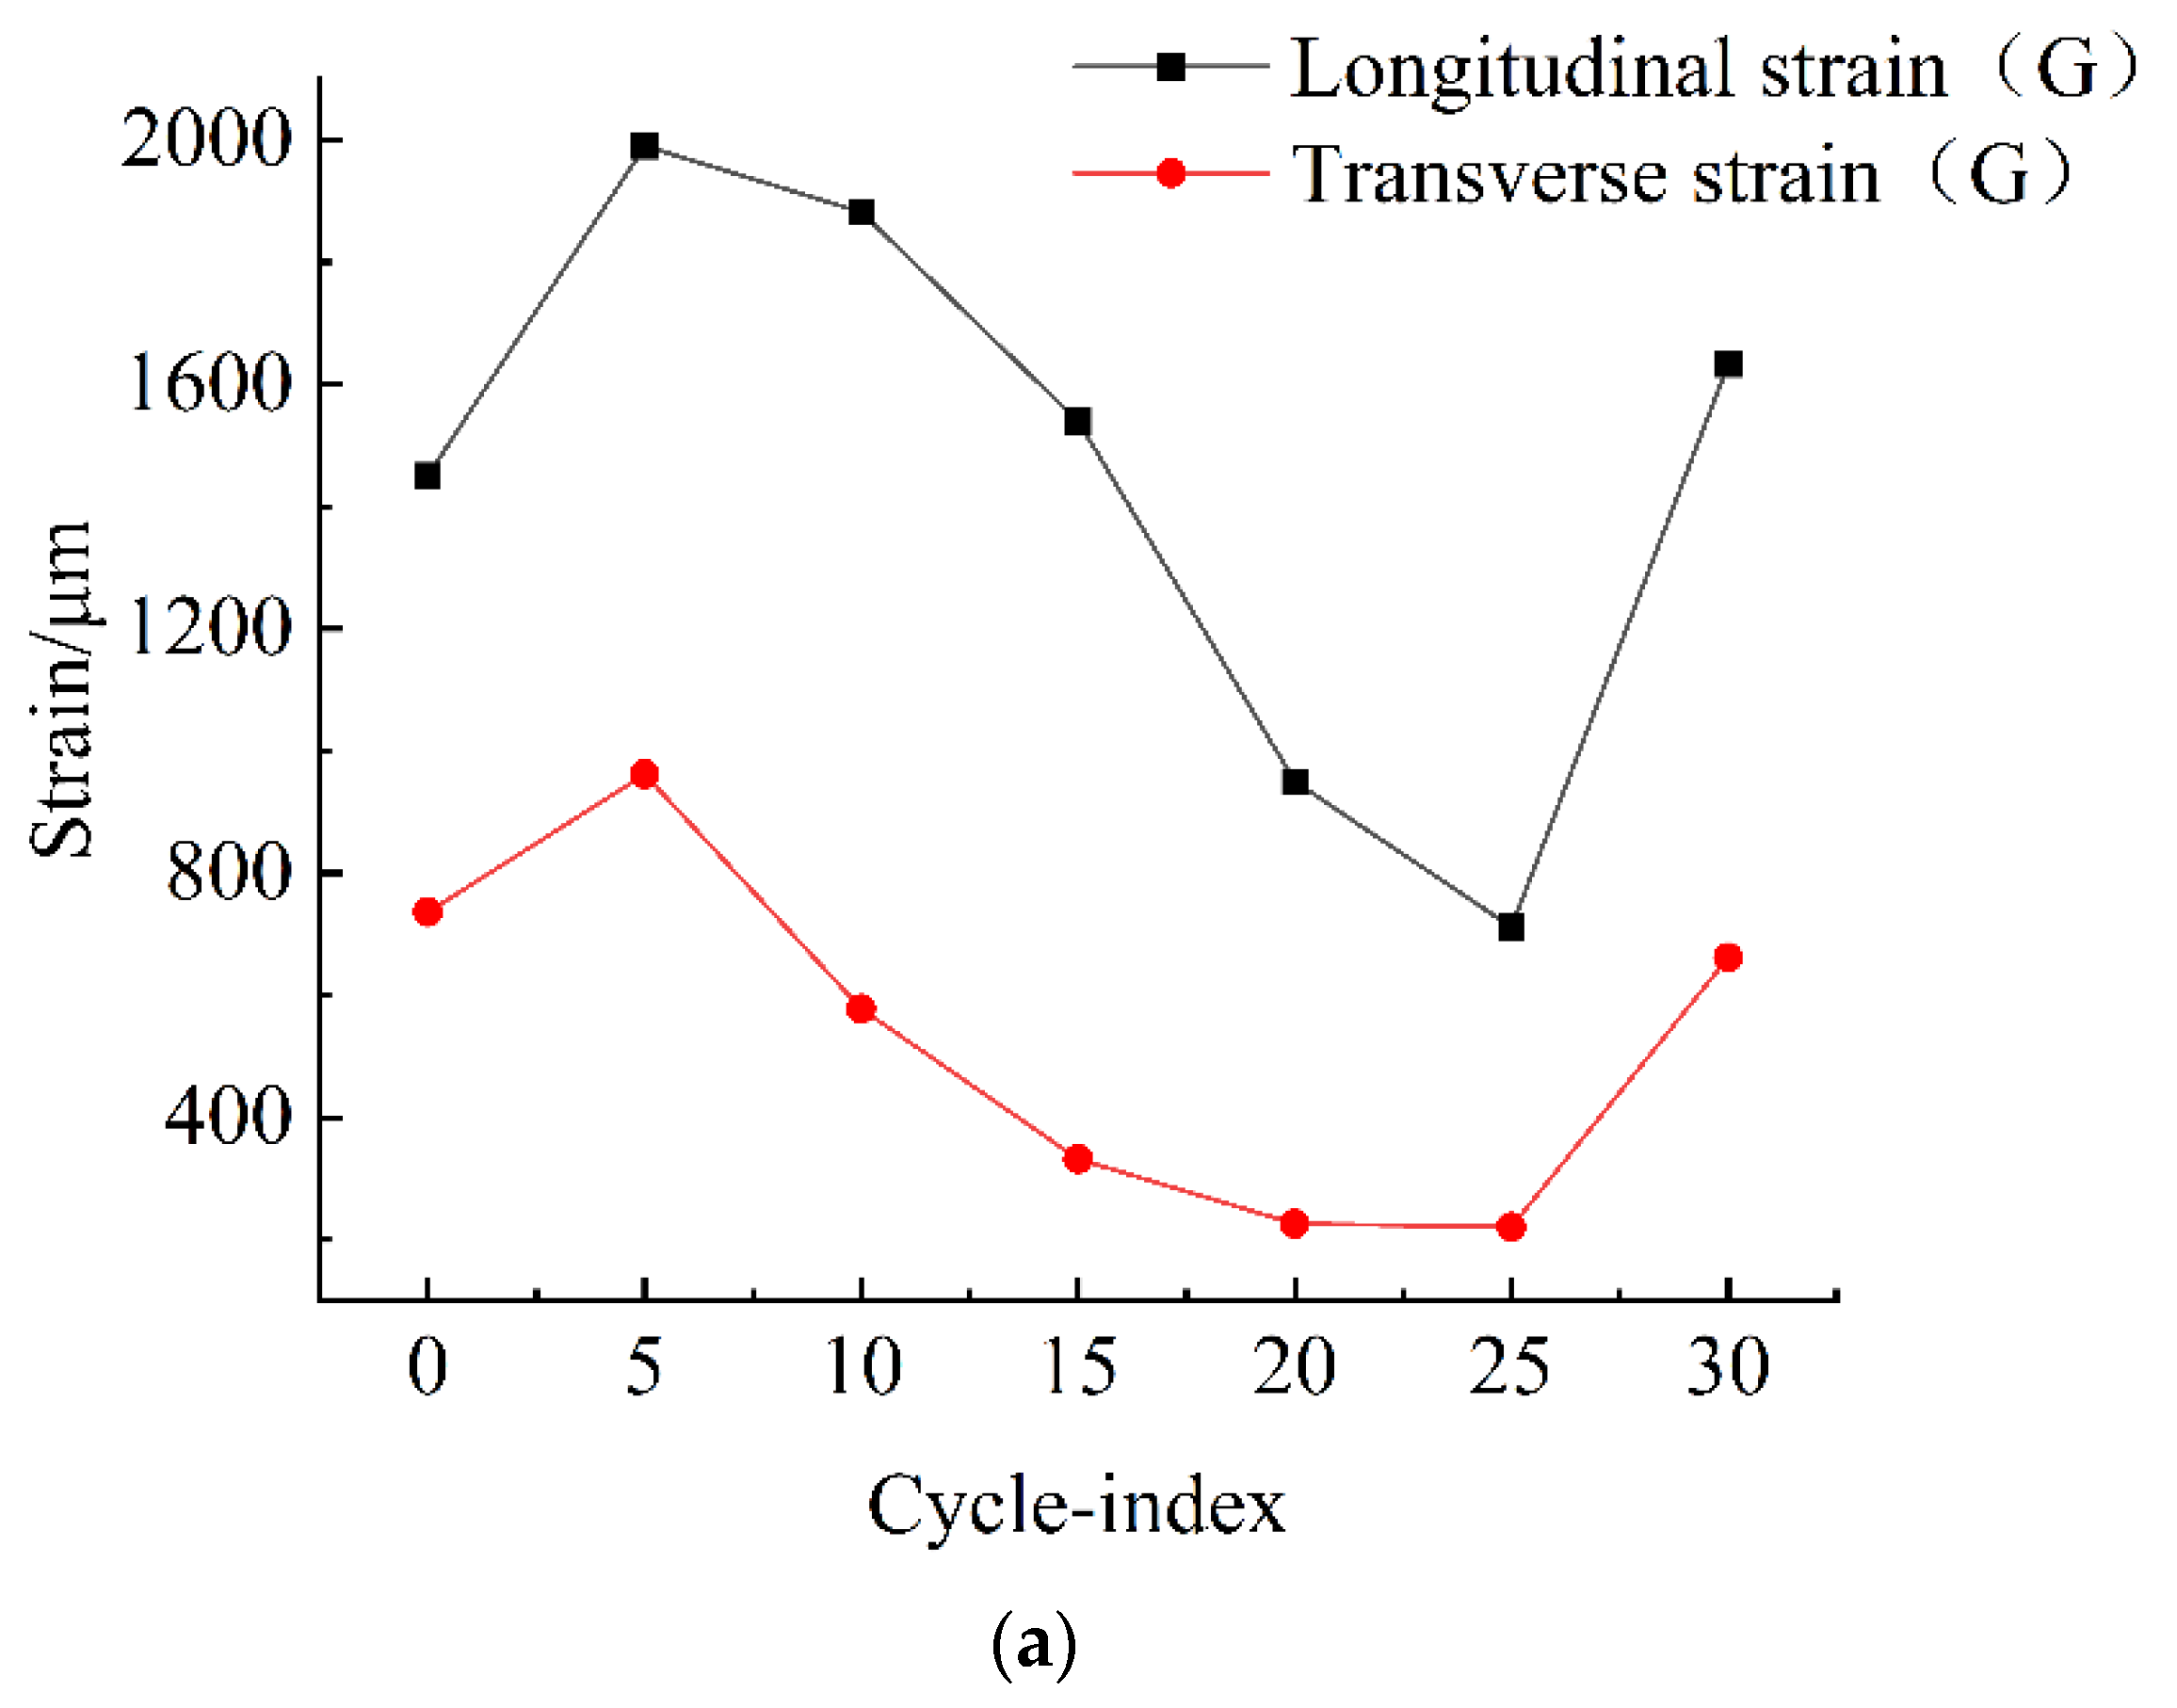
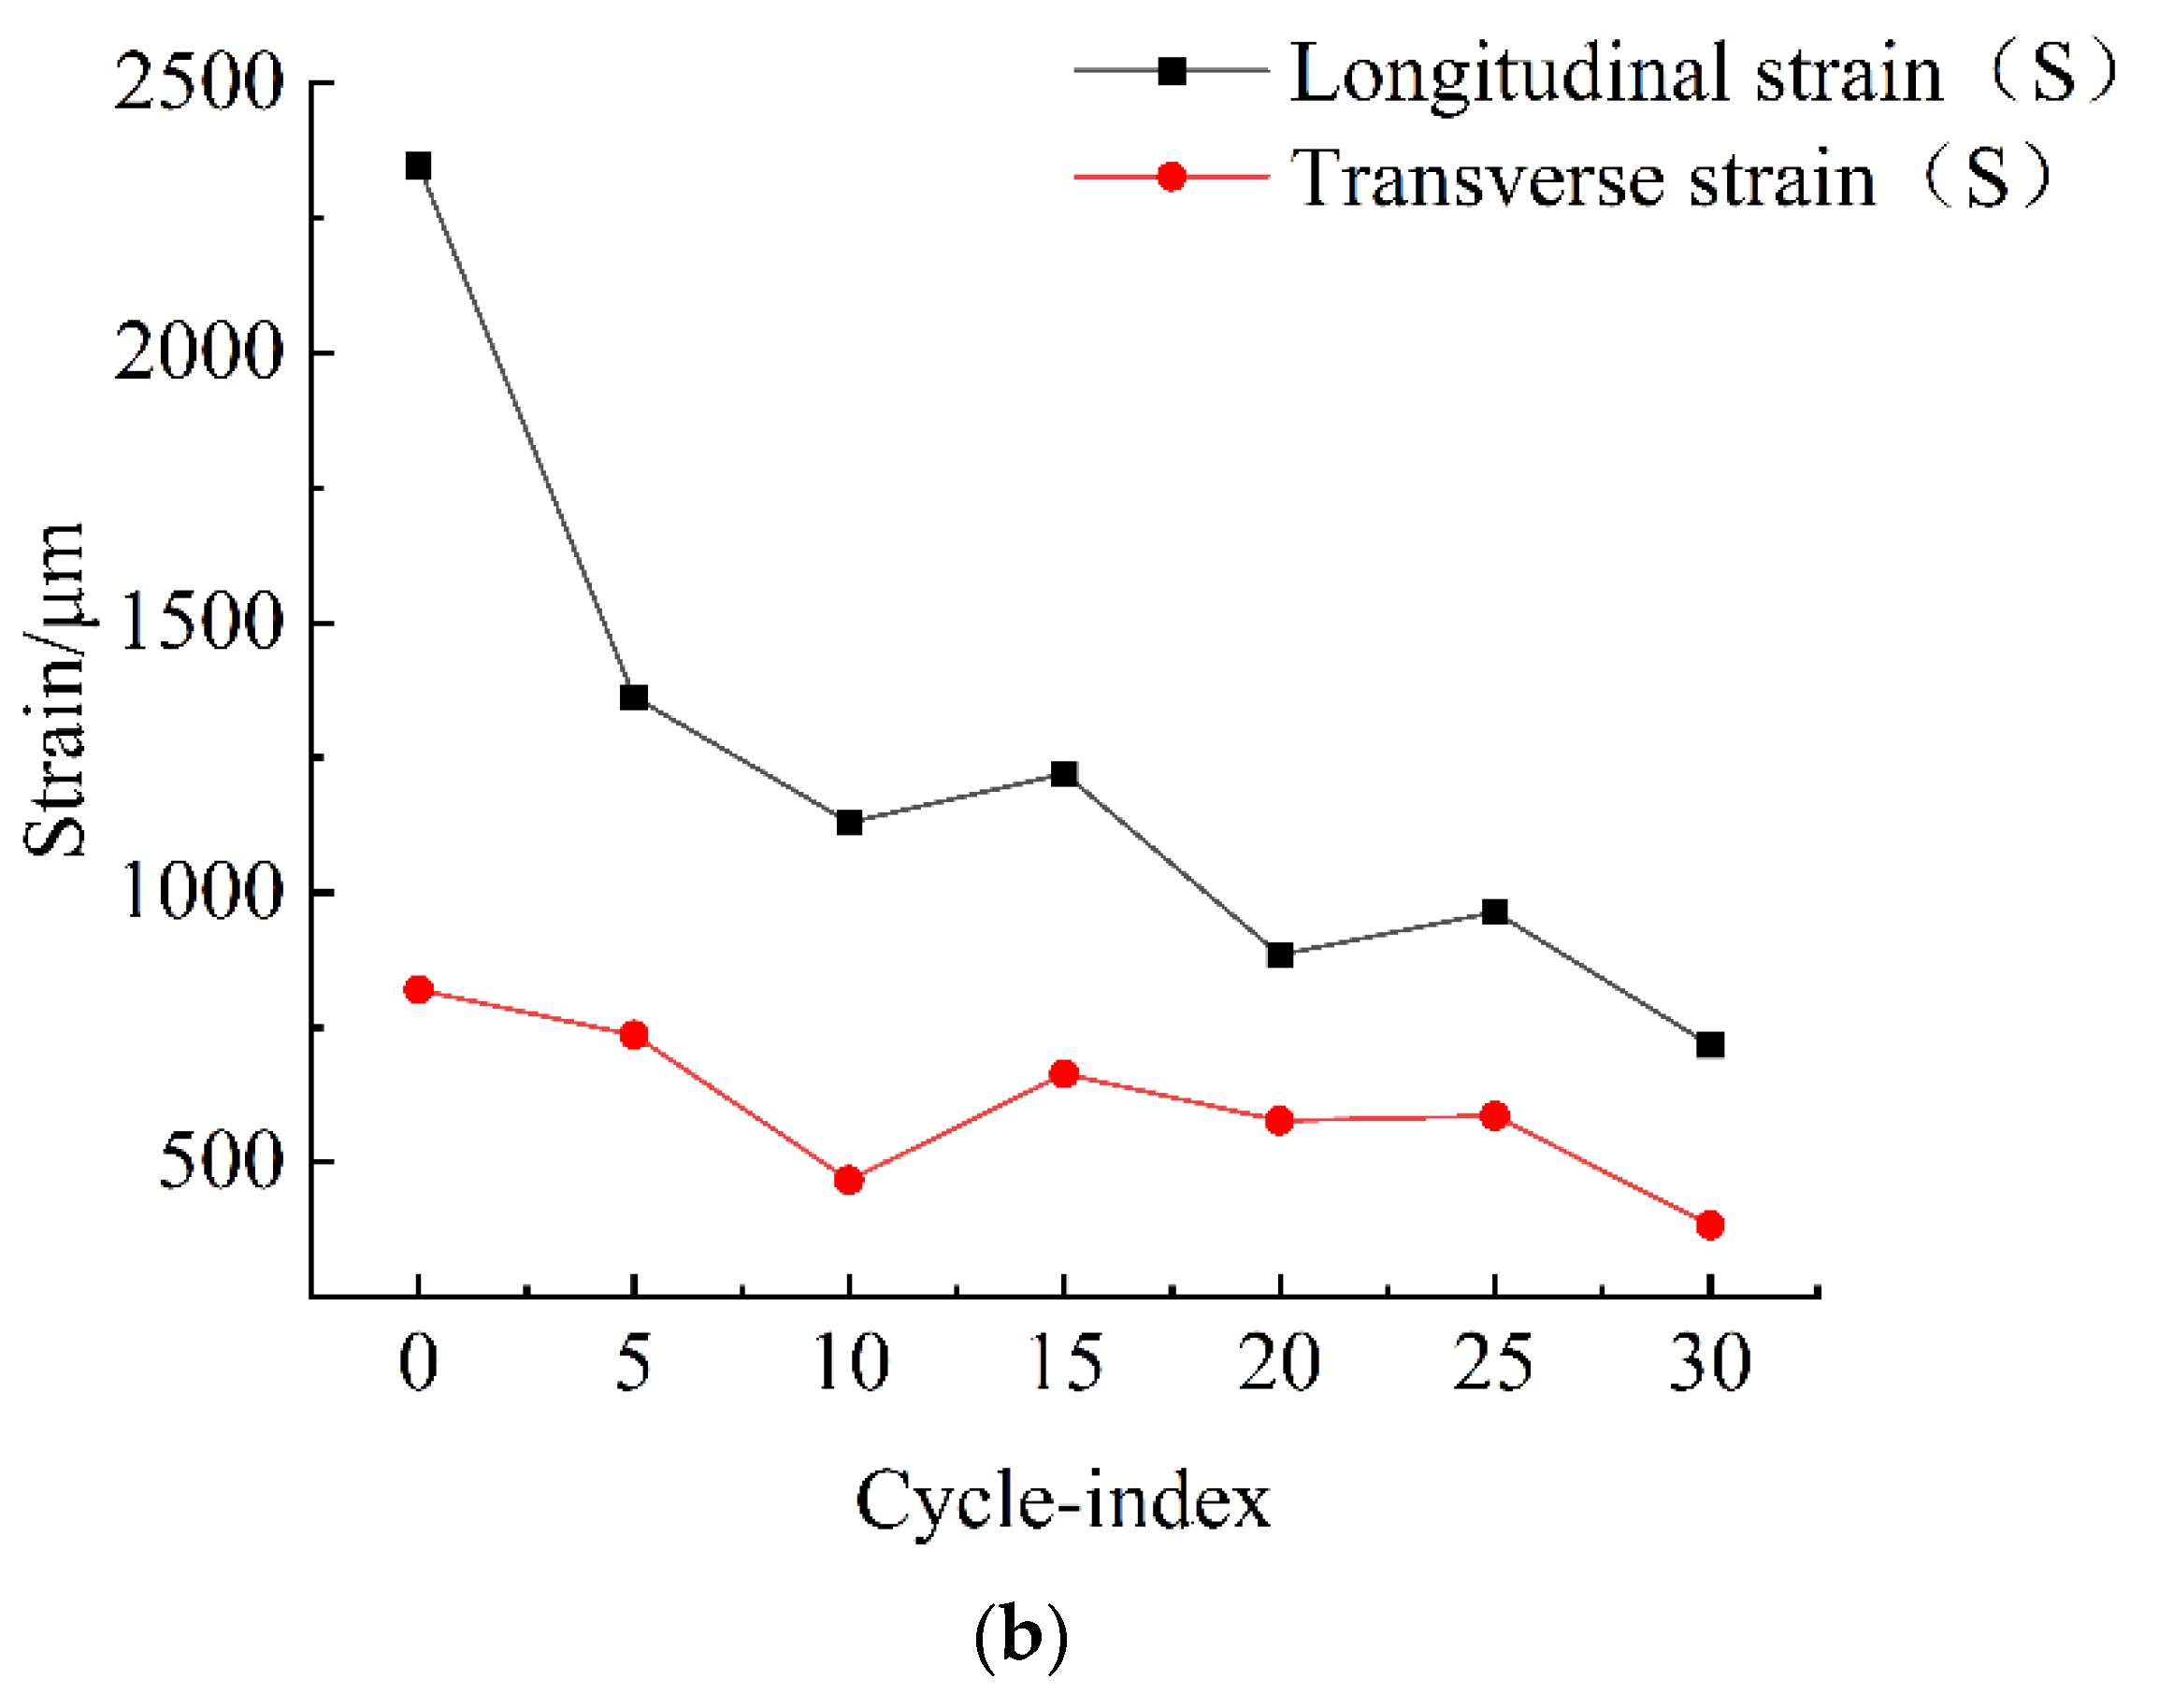
Figure 11a, with the increased number of freeze–thaw cycles, the strain during dry sample damage first increased, then decreased, and finally increased, with longitudinal strain greater than transverse strain. During the first five freeze–thaw cycles, the strain during dry sample damage increased with the number of freeze–thaw cycles. The number of damaged cycles decreased with the increase of cycles from the 5th to the 25th cycle and rose again after the 25th cycle.
As shown in
Figure 11b, the strain of immersion-saturated sample destruction decreased gradually with the increase of freeze–thaw cycles, and the longitudinal strain was significantly more significant than the transverse strain. However, the strain change rate was substantial during the first ten freeze–thaw cycles, and the curve remained unchanged after the 10th cycle. Since strain would not decrease infinitely with the increase of the cycle number, we predicted that after a specific number of freeze–thaw cycles, the damaging strain of the immersion-saturated rock samples no longer significantly changed with the increase of the number of freeze–thaw cycles and appeared to be stable.
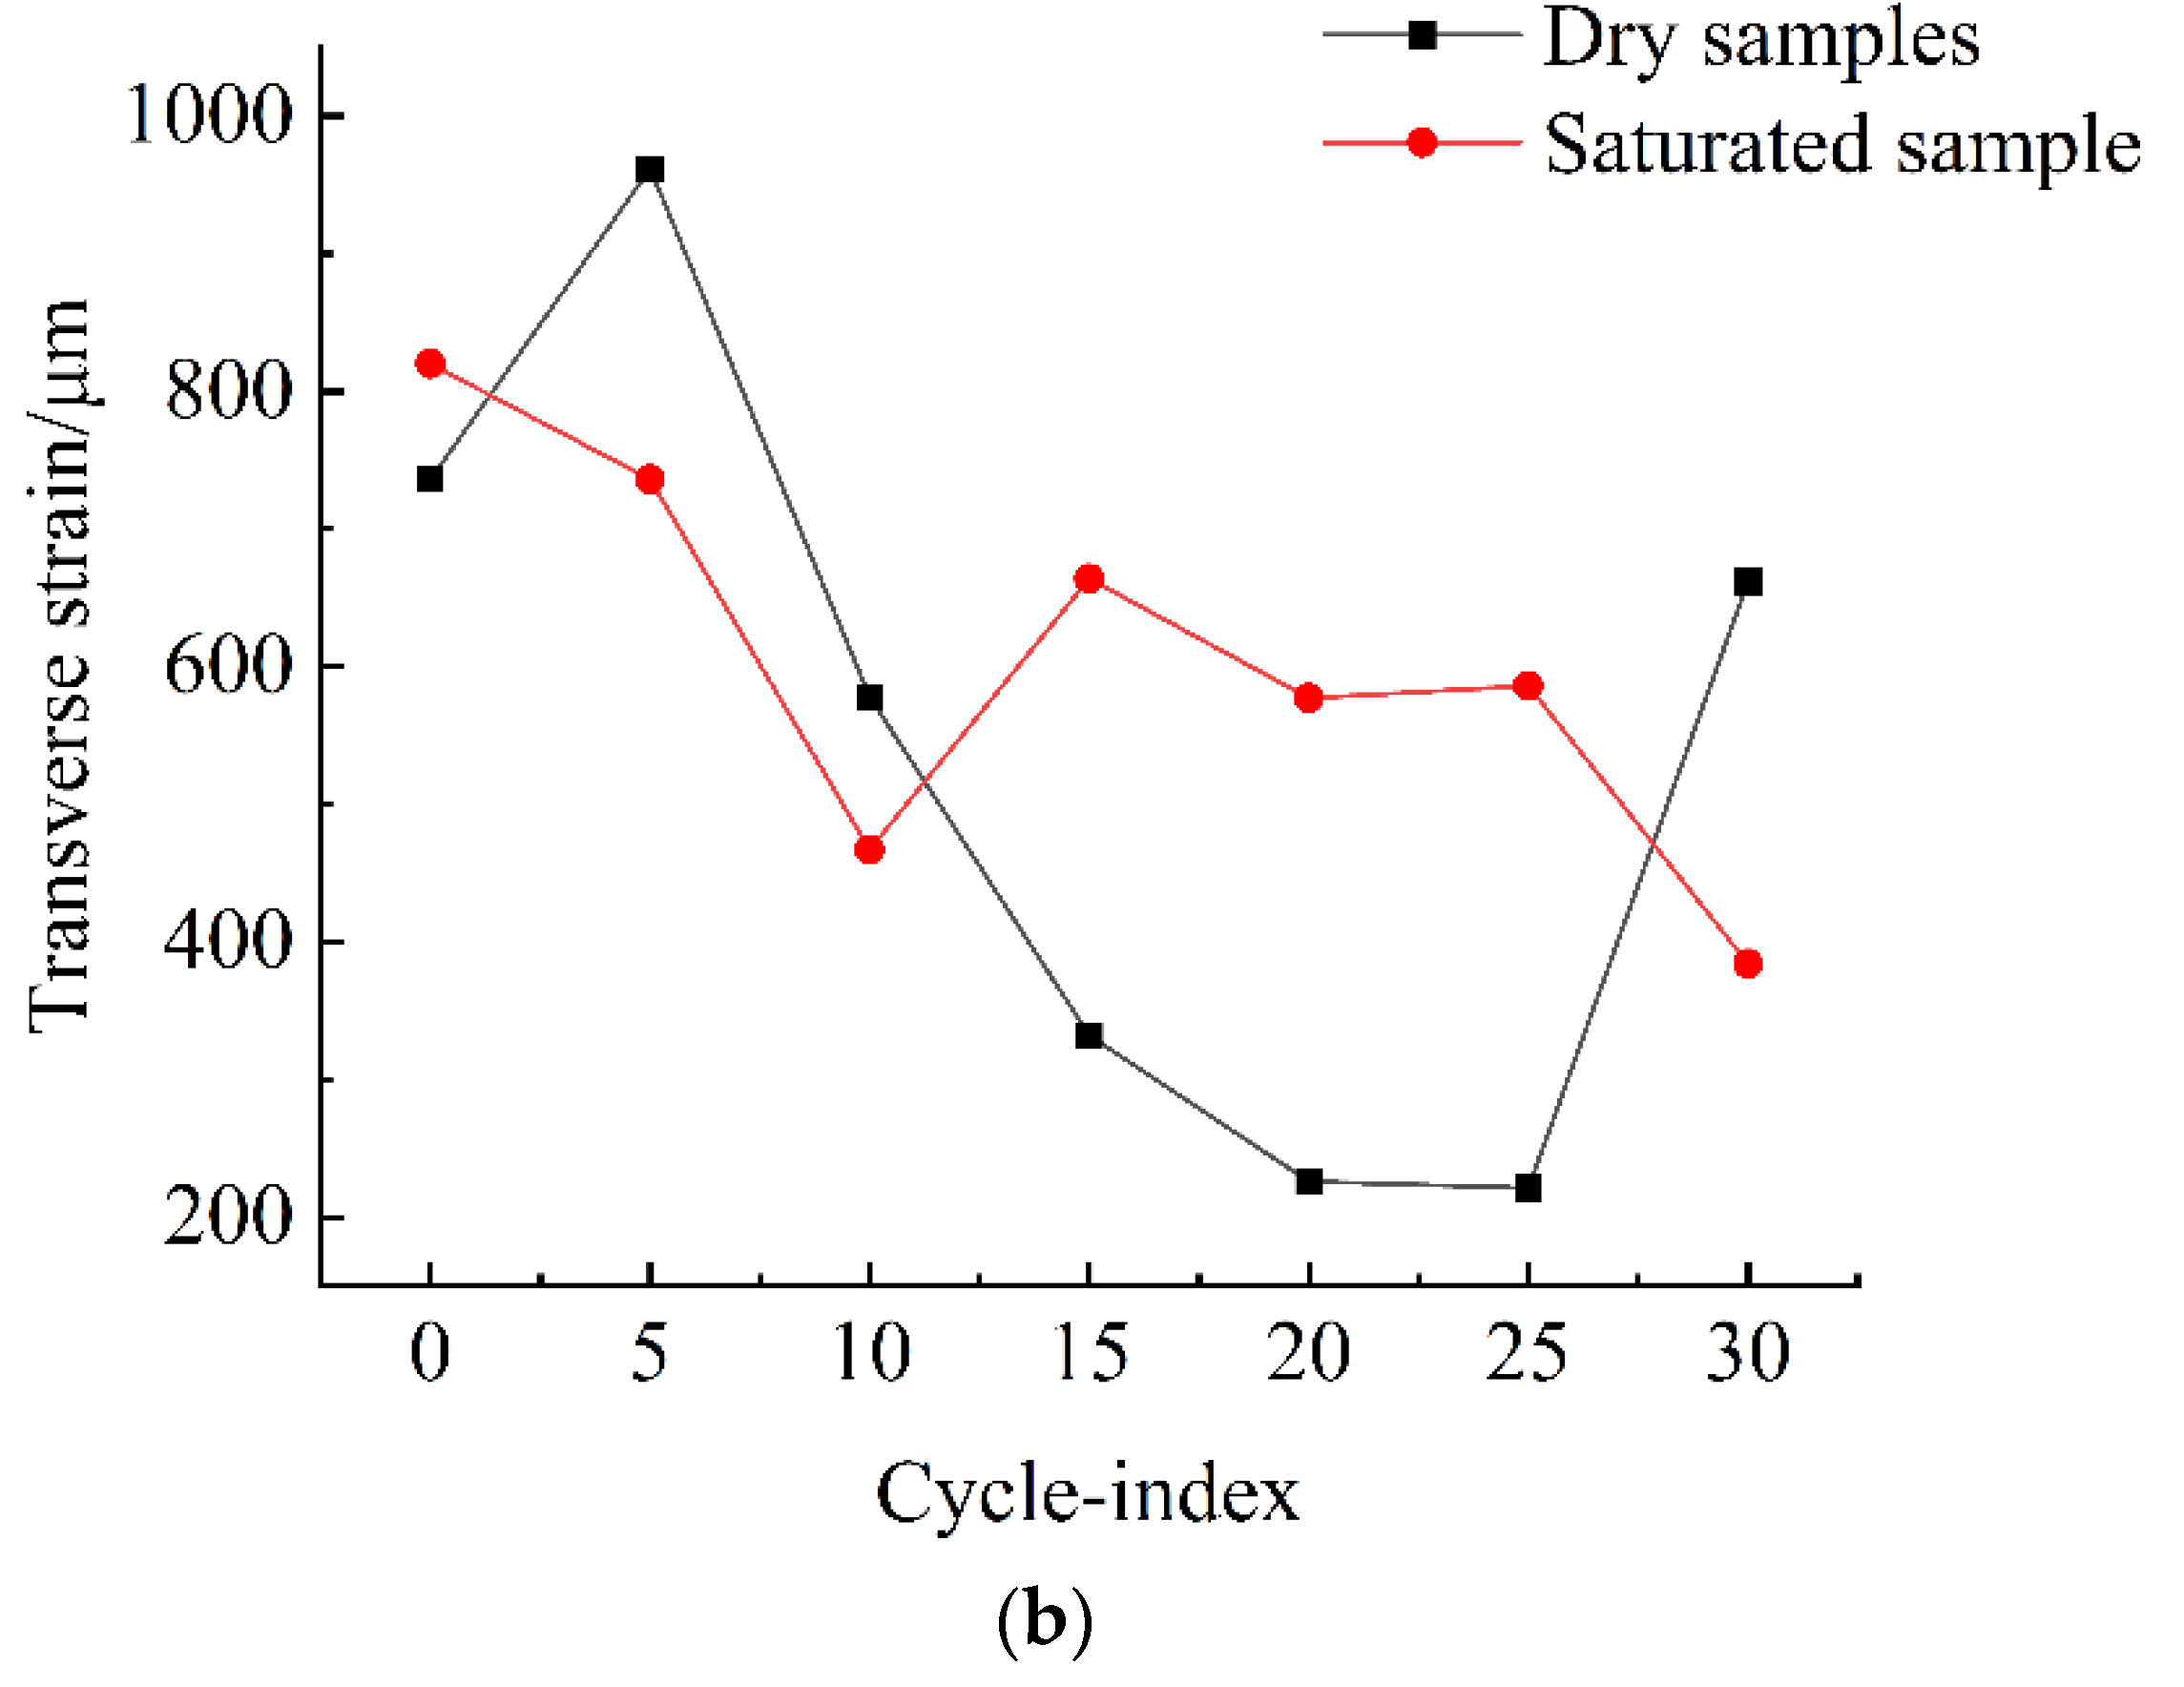
According to the comparison of the number of freeze–thaw cycles and the longitudinal and transverse strains during rock samples destruction (
Figure 12a,b), the longitudinal strain, in general, was more significant than the immersion-saturated sample when the dry sample was damaged. However, between the 5th and 25th cycle, the longitudinal strain decreased with the increase in the number of freeze–thaw cycles.
As shown in
Figure 12b, when the number of freezing–thawing cycles is less than 11, the transverse strain is more significant than that of the immersion-saturated sample when the dry sample fails. After the 11th cycle, the transverse strain upon the failure of the immersion-saturated rock samples was more significant than that of the dry sample as the number of freeze–thaw cycles. Moreover, the transverse strain, in general, decreased with the number of freeze–thaw cycles.
According to
Table 5 and
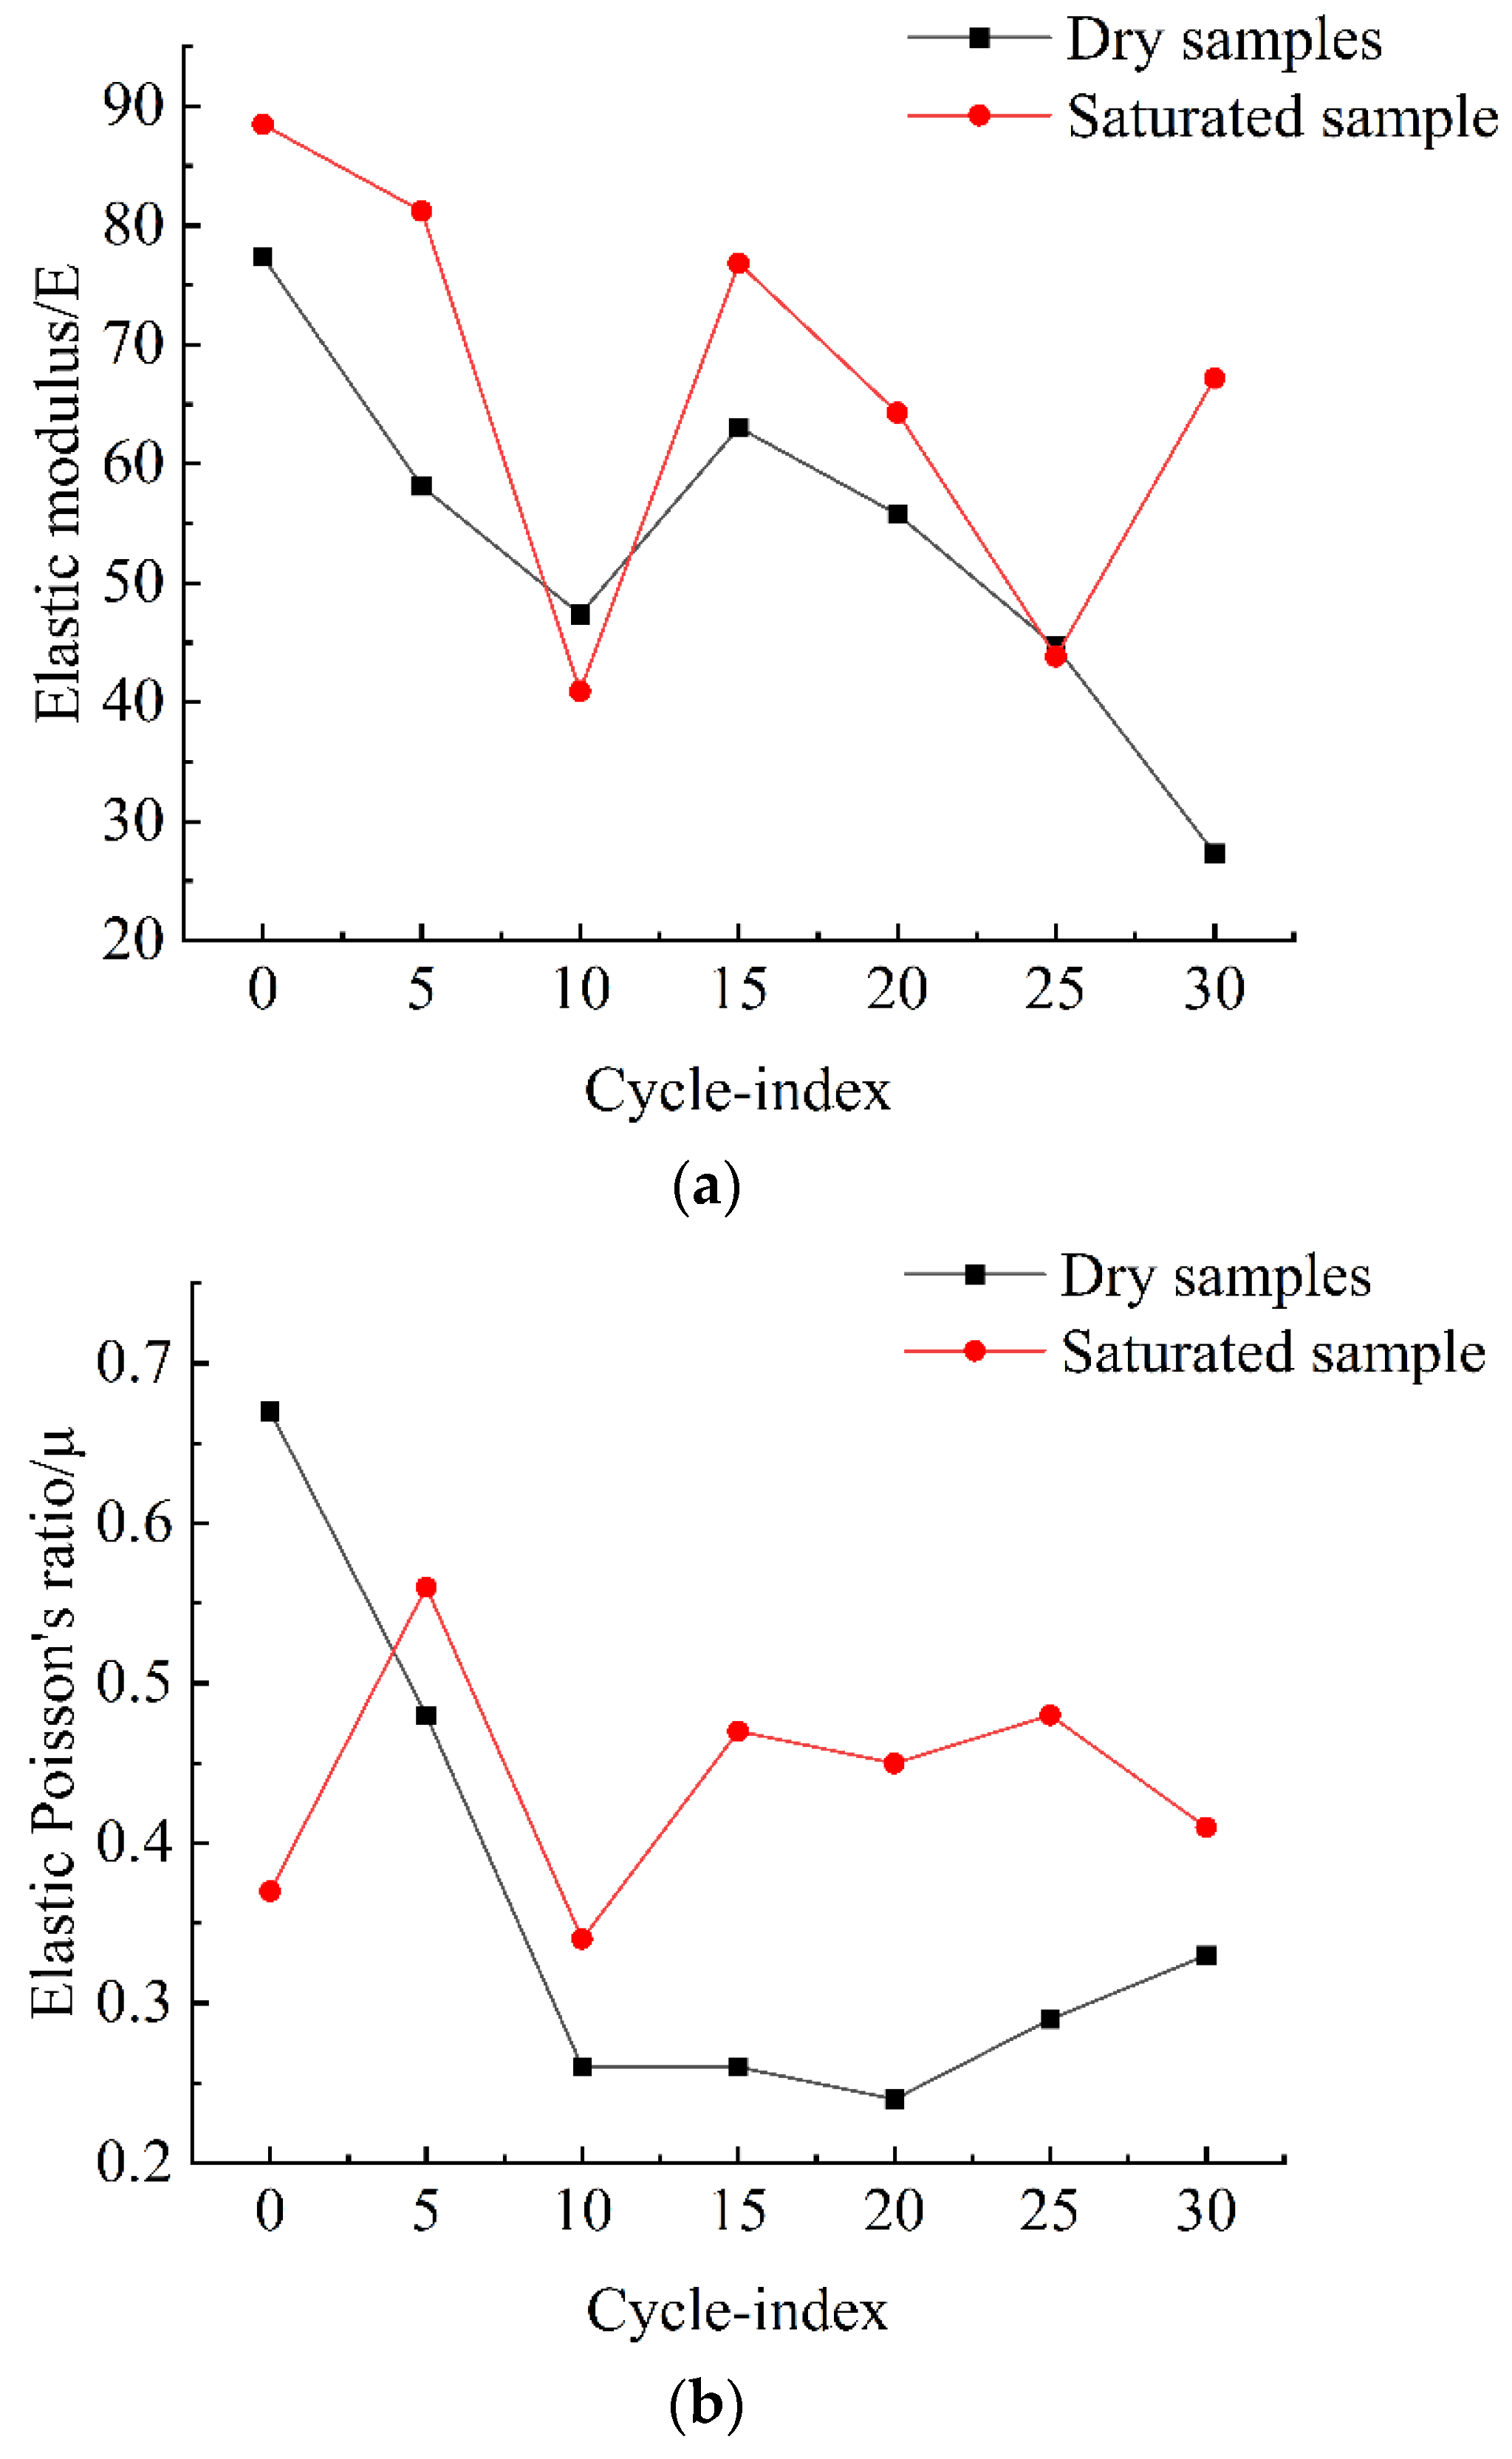
Figure 13a,b, freeze–thaw cycling impacts the rock elastic modulus and Poisson’s ratio.
As shown in
Figure 13a, the elastic modulus of the immersion-saturated rock samples is slightly greater than that of the dry sample, and as the number of freeze–thaw cycles increases, the elastic modulus of both samples decreases. Before the first ten freeze–thaw cycles, the reduction in the elastic modulus of both samples was slightly more significant than the reduction after the 10th cycle; between the 10th and 15th cycles, the elastic moduli of both samples increased with the increase of the number of freeze–thaw cycles but decreased after the 15th cycle.
Figure 13b shows that immersion-saturated rock samples have a higher elastic Poisson’s ratio than dry samples. Before the first ten freeze–thaw cycles, the elastic Poisson’s ratios of the two samples decreased rapidly. However, after the first ten freeze–thaw cycles, the elastic Poisson’s ratios of both samples tended to be stable.
The analysis predicted that after a certain number of freeze–thaw cycles, the Poisson’s ratios of the two samples would be stable. According to the test curve, as the number of freezing–thawing cycles increased, the Poisson’s ratio of the dry rock sample approached 0.6–0.7 eventually. In contrast, the elastic Poisson’s ratio of the immersion-saturated sample would have a final elastic Poisson’s ratio of 0.45.
According to
Table 6 and
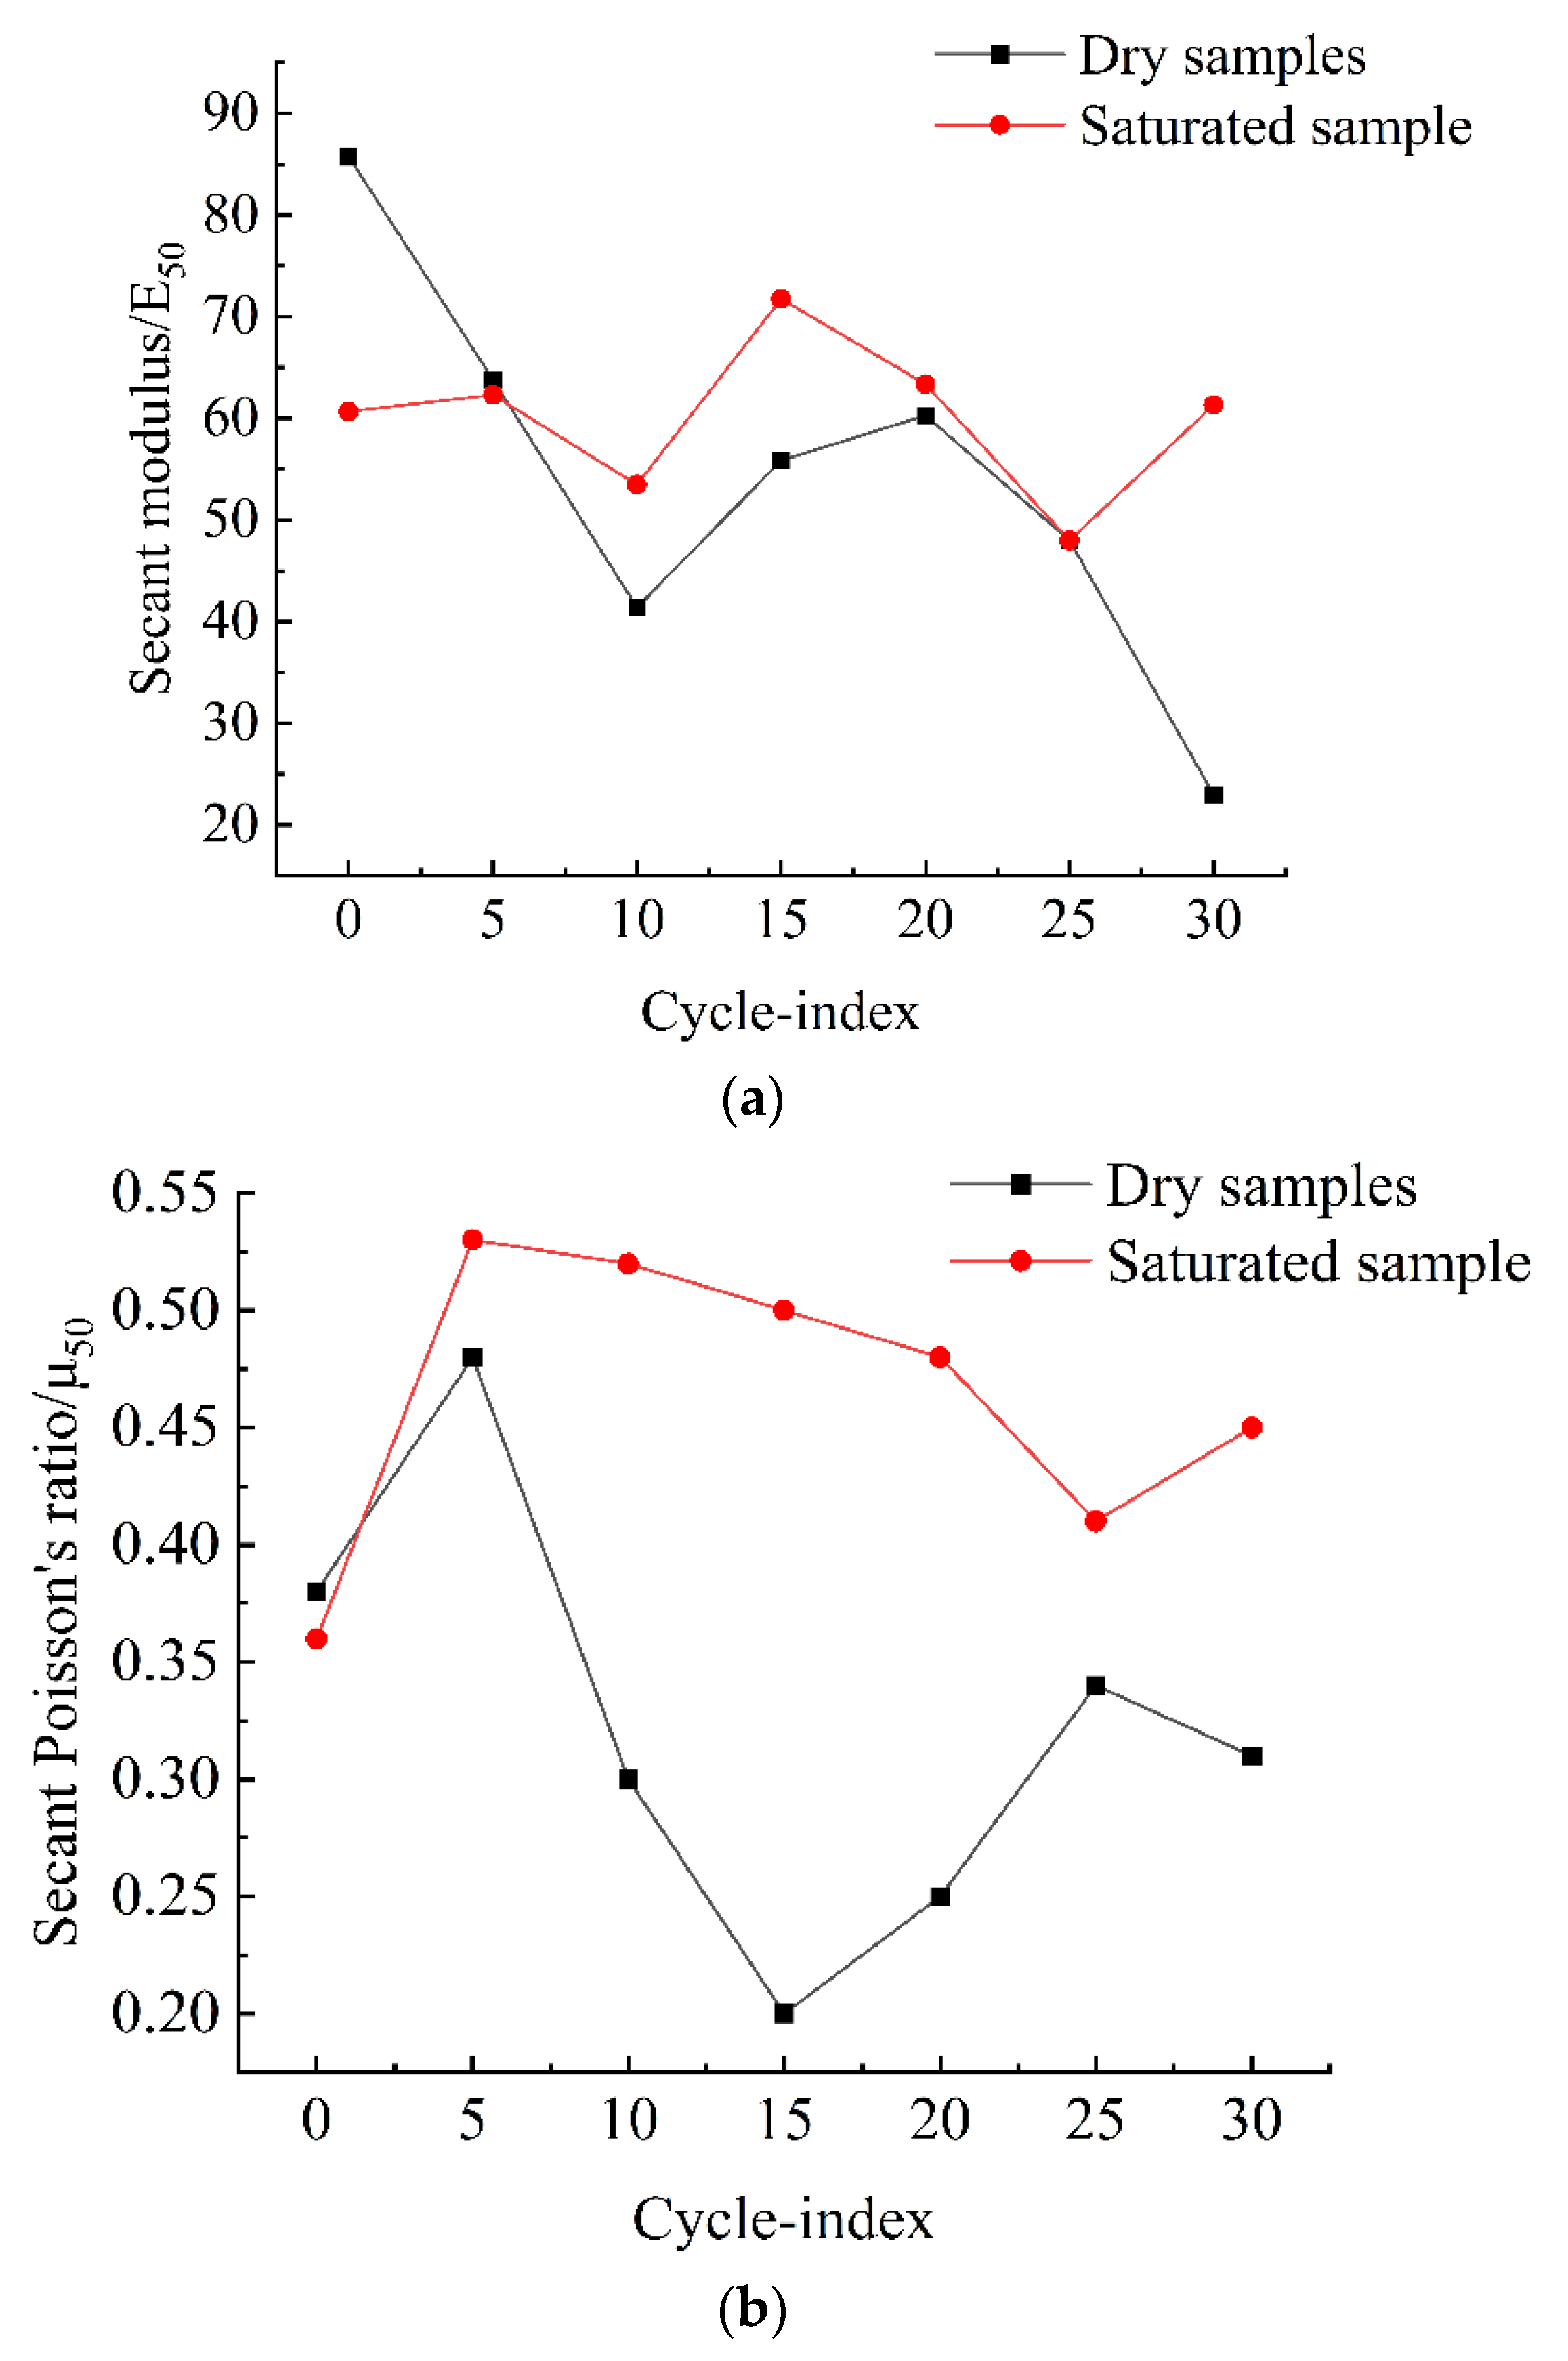
Figure 14a,b, freeze–thaw cycling impacted the secant modulus and secant Poisson’s ratio of rock.
As shown in
Figure 14a, as the number of freeze–thaw cycles increased, the secant modulus of the immersion-saturated sample was slightly larger than that of the dry sample. The secant modulus of the two groups of rock samples decreased as the number of freeze–thaw cycles grew. Except for the fact that the secant modulus of the dry sample showed a slight increase during the 10th and 20th freeze–thaw cycles, it was continuously reducing with a gradually increasing gradient both when the freezing–thawing was within the first ten cycles and when the freeze–thaw was after the 20th cycle. However, the secant modulus of the immersion-saturated sample had a stable change during the freeze–thaw cycles.
As shown in the
Figure 14b curve, the secant Poisson’s ratio of the immersion-saturated sample was more significant than that of the dry sample and had a decreasing trend in general as the number of freeze–thaw cycles grew, because the secant Poisson’s ratio of the dry sample had a significant rate of increase as the number of freeze–thaw cycles increased. In contrast, the rate of increase of the immersion-saturated sample was relatively low.
The effect of freeze–thaw cycles changed the nature of the rock, and the specimens containing fractures were eliminated after the pre-screening sample, so it is considered that the effect of water on fractures in freeze–thaw cycles is small, and it is considered that the freeze–thaw cycles changed the nature of the rock’s own strength by this test, and the strength deterioration of the specimens gradually increased with the increase of the number of freeze–thaw cycles, showing the phenomenon that the uniaxial compressive strength of the rock gradually decreased with the increase of the number of freeze–thaw cycles.
According to the loading direction, the specimens were mainly loaded along the longitudinal direction when the ring was broken, so the longitudinal strain was always greater than the transverse strain when the damage occurred. After the specimens were immersed in water, the modulus of elasticity and Poisson’s ratio changed, their brittleness changed, and their elastic phase at the time of destruction increased, so the strain value at the time of destruction of the immersed specimens increased. As the number of freeze–thaw cycles increases, the uniaxial compressive strength of the rock gradually decreases, so the longitudinal loading displacement gradually decreases, and the corresponding damage strain also decreases with the number of freeze–thaw cycles.


