1. Introduction
In December 2019, a new virus was detected in Wuhan, China called severe acute respiratory syndrome coronavirus 2 (SARS-CoV-2) [
1]. A pandemic was declared on 11th March 2020 by the World Health Organization [
2]. Studies have shown that the daily movement of people during the pandemic resulted in the spread of infectious diseases [
3,
4]. Mobility restrictions along with other measures such as online teaching, closure of institutes and restaurants, working from home, restrictions on public gatherings, and lockdown were applied worldwide to avoid the spreading of COVID-19 [
5]. Research indicates that these restrictions and measurements were effective in controlling the virus [
6]. The passenger demand was reduced globally for public transport because of the risk of getting infected [
7]. People avoided unnecessary movements, resulting in lower traffic on roads than in normal circumstances [
8].
In Poland, the impact of COVID-19 on daily travel behavior showed a significant reduction in travel times [
9]. In the Netherlands, outdoor activities were reduced by 80% due to intelligent lockdown [
10]. In the UK, vehicle use was reduced by 20% before lockdown and more than 60% during the lockdown [
11]. In Australia, there was a higher reduction in public transport usage [
12]. In Chicago, USA, online work increased from 15% to 48% during the pandemic [
13]. In Kelowna, Canada, the work-based trips were increased for occupations related to health, law, community, education, etc. [
14]. During COVID-19, several cities also noted a considerable reduction in traffic accidents and congestion problems [
15]. Junyi Zhang conducted a worldwide expert survey which revealed a significant shift from public to other transportation modes [
16]. In Thessaloniki, Greece, there was a moderate reduction in car usage and a considerable reduction in mass transit trips during the pandemic [
17]. People were caring more about cleanliness than safety, security, travel time, or travel cost during the COVID-19 pandemic [
18].
Various research studies were conducted all over the world to examine the travel behavior and mode choice during the pandemic. Most of them revealed that people shifted from public transport to private transport and that there was a reduction in daily trips. Moreover, there was an increase in the frequency of teleworking or working from home during COVID-19. The summary of previous research studies related to the effect of COVID-19 on travel behavior and mode choice is shown in
Table 1.
In
Table 1, it can be seen that various research studies were carried out to examine the effect of COVID-19 on travel behavior and mode choice almost all over the world. Similarly, the pandemic also hit the travel behavior and mode choice in Thailand. Until now, no research study was conducted to examine the travel behavior and mode choice in Bangkok. Therefore, it was essential to research the effect of COVID-19 on travel behavior and mode choice in the Bangkok Metropolitan Area, Thailand. The main reason for considering Bangkok instead of any other city is that Bangkok is the capital of Thailand and a densely populated area. Therefore, the results of a research study on travel behavior and mode choice for Bangkok can help in the proper management of transportation infrastructure throughout Thailand during COVID-19.
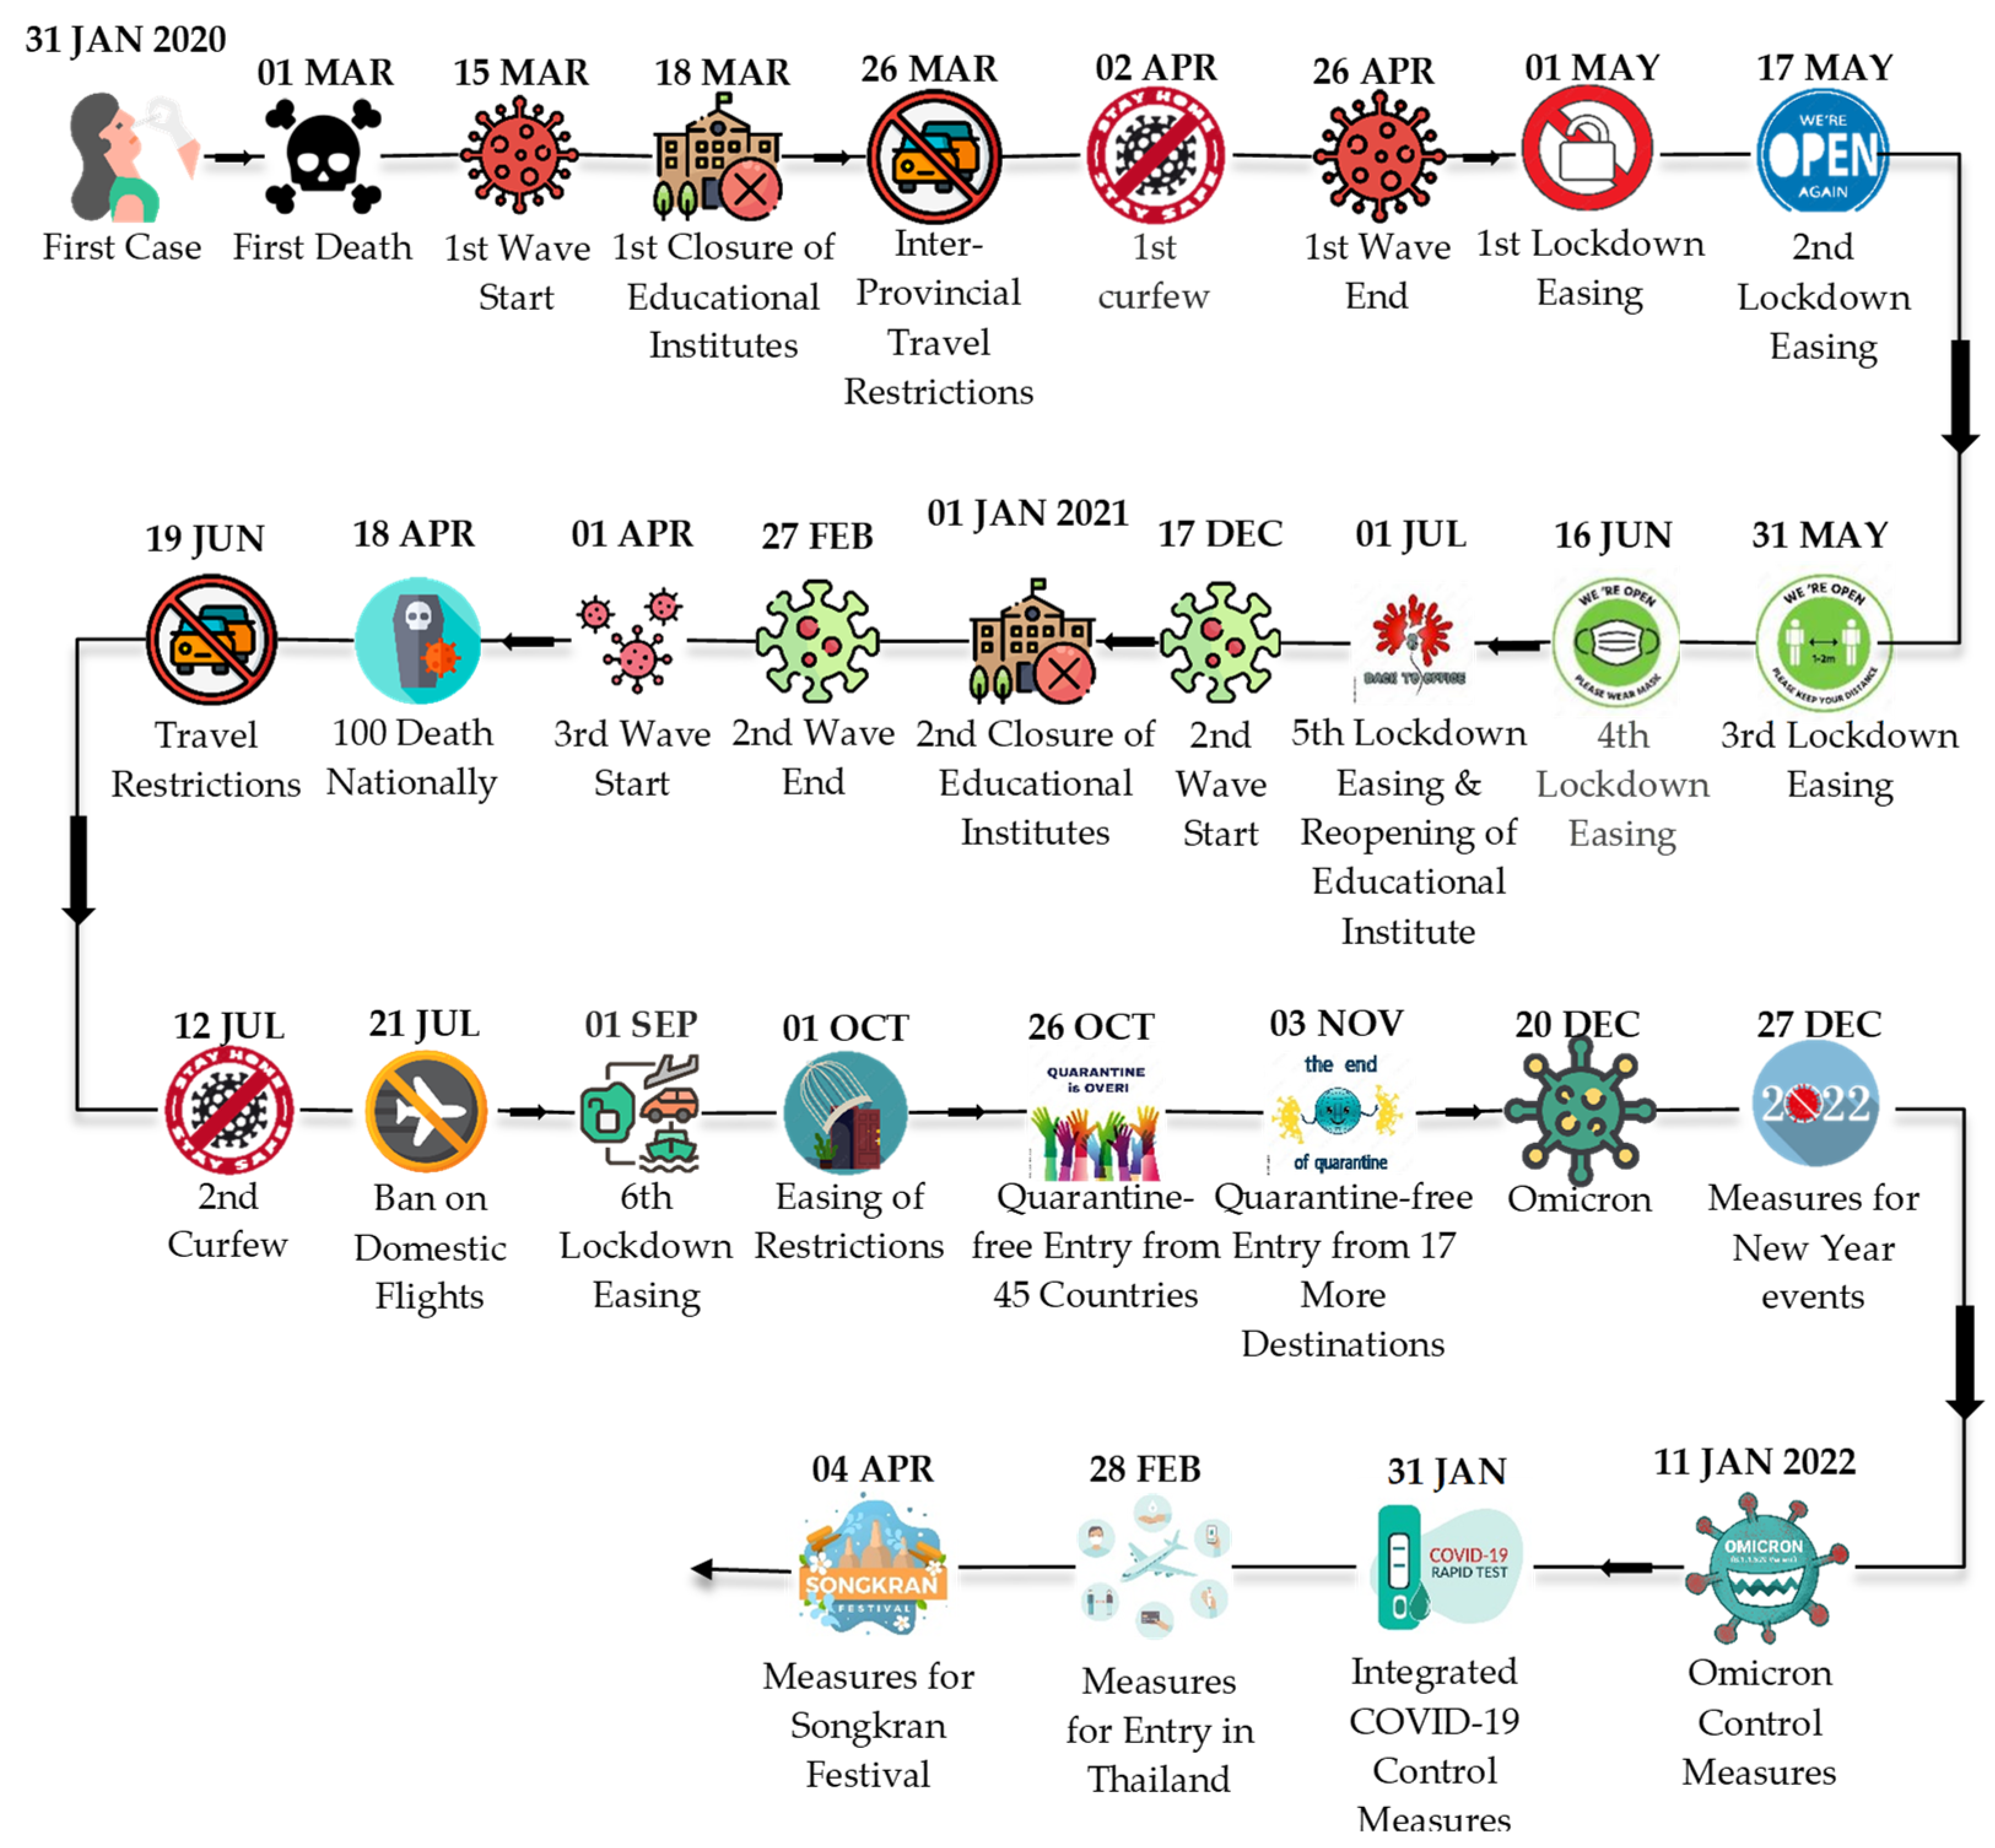
After China, Thailand reported the first case of COVID-19 on 13 January 2020. Thailand successfully controlled the spread of the virus in 2020, but the situation has been uncontrolled since April 2021 [
25]. From the beginning of the pandemic until now (8 June 2022), Thailand faced three COVID-19 waves, as shown in
Table 2. Therefore, the Thailand Government imposed different restrictions to control the pandemic (
Figure 1) [
26].
The main objectives of this study were to
Compare the travel behavior for the primary trips before and during the pandemic;
Analyze the mode choice before and during the pandemic for the primary trips; and
Determine the effect of COVID-19 on the frequency of working from home.
The change in travel behavior and mode choice might remain after this pandemic [
8]. Similarly, working from home could continue after COVID-19. Hence, it is essential to know people’s travel preferences and mode choices, which will help in future investments in transportation infrastructures and the development of transportation policies [
20].
The contributions of this work include the results of the examinations and comparisons of travel behavior and mode choice of Bangkok travelers before and during the pandemic. The future transportation demand can be predicted based on the results of this study. The analysis of mode shifts and factors affecting mode choice will help to evaluate the people’s thinking and preferences in Bangkok, Thailand during COVID-19. The transportation demand and usage of modes of transport in Bangkok, Thailand can be managed by knowing the people’s travel behavior, mode choice, and factors affecting mode choice based on respondents’ survey.
2. Methods
This section is divided into two sections: (1) Data Source and (2) Statistical Tests and Regression Model.
2.1. Data Source
This section consists of two sub-sections: (1) Study Area and (2) Questionnaire Design and Sample Size.
2.1.1. Study Area
The Bangkok Metropolitan area was considered a study area because it was a red zone and a highly affected area in Thailand during the pandemic (
Figure 2). The total area of Bangkok is 1569 km², and it is subdivided into 50 districts. The Metropolitan area of Bangkok consists of two CBDs:
CORE CBD which covers the area Ploenchit-Wireless and Silom-Sathon;
OUTER CBD, which includes only Sukhumvit.
2.1.2. Questionnaire Design and Sample Size
The questionnaire was divided into three parts (
Figure A1). First, socio-demographic characteristics included age, sex, education level, career or employment, household income, household size, car ownership, and whether the respondent was an essential worker. Essential workers were those who had to work under every circumstance or pandemic situation; for instance, medical staff, doctors, people working at the powerhouse, and public transport operators. The second and third parts were travel behavior and mode choice before and during COVID-19, including questions such as the trips’ primary purpose, the mode selected, distance travelled per week, travel time (one way) for the trip, number of trips, frequency of working from home, and factors affecting selection of mode choice. The mode choice factors included travel time saving, travel cost, safety and security, infection concern, social distance, comfort, cleanliness, and passenger face masking, which were designed using a 5-point Likert scale.
The sample size was determined using the Yamane Sampling Technique with a 95% confidence level and precision level of 0.05. The formula for calculation of sample size is
where
n is the sample size,
N is the population size, and
e is the level of precision. During the time of data collection, the population of the Bangkok Metropolitan Area was 16,255,900 [
28]. After insertion of values in Equation (1), we came to know that this project needed at least 400 respondents. Hence, questionnaire distribution was carried out by an online platform and the google form was accessible either by scanning a QR or opening a URL link. The data was collected from 12 October 2021 to 11 November 2021, and the total number of responses was 906.
2.2. Statistical Tests and Regression Model
In this research study, statistical tests and multinomial logistic regression models were used to achieve the objectives and analyzed using “IBM SPSS” software, version 25, IBM Corporation, New York, NY, USA. Specifically, six employed statistical tests (McNemar test, McNemar-Bowker test, McNemar test as a post-hoc test, Wilcoxon signed-rank test, Mann–Whitney U test, and Spearman correlation) and two employed statistical analyses (exploratory factor analysis and multinomial logistic regression analysis) are briefly described as follows.
2.2.1. McNemar Test
A non-parametric test applied to paired nominal data having 2 × 2 contingency tables of two dichotomous traits to determine whether marginal homogeneity (marginal frequency of row and column are equal) exists between variables [
29]. It can be considered as a type of chi-square test, which uses dependent data (two samples correlated) instead of independent data [
30]. This test requires one independent variable having two dependent groups and one nominal variable having two categories. There must be at least ten discordant pairs to perform this test [
31].
2.2.2. McNemar–Bowker Test
The paired data in the case of more than two possible categories have a K × K contingency table of proportions, and an extension of the McNemar test is called the McNemar-Bowker test [
32]. In this study, this test was used to analyze data before and during the COVID-19 situation for
For mode choice comparison, the transport choices were grouped into four main transport modes: (i) public transport, including BTS (the sky train), MRT (the underground railway), and bus; (ii) para-transit including taxi and motorbike taxi; (iii) private transport including car and motorbike; and (iv) active modes including cycling and walking.
2.2.3. McNemar Test as Post-Hoc Test
A post-hoc test requires examining which nominal-variable categories differed significantly. Therefore, the McNemar test was used as a post-hoc test for analyzing the significant change in primary trip categories such as working, studying, shopping, and other trips and mode choice categories such as public transport, private transport, paratransit and active modes before and during the pandemic. An adjustment for significance level was needed because a series of multiple tests was performed. The Bonferroni method was used to eliminate false positives and reduce type I errors. The formula used for correction was
α/n, where
α was the level of significance and
n was the number of tests performed [
33]. The n and α values were set to 6 and 0.05, respectively, yielding Bonferroni Coefficient = 0.0083. As such, the level of significance of the test was compared with 0.0083 instead of 0.05.
2.2.4. Wilcoxon Signed-Rank Test
A non-parametric test is used to compare two dependent samples [
34]. This test is another form of the paired student t-test and is also called a t-test for dependent samples or a t-test for matched pairs. The test was used when the same dependent variable was taken for different situations, i.e., before and during COVID-19, and the sample was not normally distributed [
35]. In this research, this test was used to compare before and during the COVID-19 situation for
The distance travelled in kilometers per week;
a number of trips per week for the primary purpose of the trip; and
frequency of working from home.
2.2.5. Mann–Whitney U Test
A non-parametric test is used to compare the two separate groups for un-paired independent observations. This test is almost identical to the Wilcoxon signed-rank test. However, the main difference between them is that the Wilcoxon test is used on dependent samples and this test is used on independent samples or groups [
36]. This test is an alternative to a student t-test. In this test, the independent variable has only two levels or categories, such as sex has two levels, male and female. In this study, this test examined the effect of socio-demographic factors such as sex, car ownership, essential worker status, and current working status on distance travelled for primary trips, number of primary trips, and mode choice before and during COVID-19.
2.2.6. Spearman Correlation
The Spearman correlation tests the strength and direction (whether it is negative or positive) of correlation among two variables. The strength of the relationship between the two variables is between −1 to +1 [
37]. The positive value of the correlation coefficient indicates a positive association while a negative value of the correlation coefficient shows a negative association between two variables. A zero correlation coefficient means no relationship between two variables [
38]. The Spearman correlation allows us to analyze the relationship between variables with ordinal levels. In this study, the Spearman correlation was used to show the correlation before and during COVID-19 between socio-demographic factors (age, income, household size, education) and
the primary purpose of the trip;
distance travelled for the trip; and
the frequency of working from home.
2.2.7. Exploratory Factor Analysis (EFA)
A test is used to reveal the underlying structure of a large set of variables based on the common factor model [
39]. EFA was conducted both before and during COVID-19. Factors 1 and 2 were named as extracted factors obtained in the form of factors scores. In this research, the factor scores were found using a refined procedure named the Bartlett method because refined procedures are more accurate and exact than unrefined procedures. Moreover, the principal axis factoring along with varimax rotation was conducted on factors affecting the mode choice. The criteria for factors were Eigenvalues criteria, i.e., Eigenvalue > 1. A cut-off value of 0.40 was set for the items loading. The factors obtained from EFA were used in the utility function of mode choice before and during the COVID-19 pandemic.
2.2.8. Multinomial Logistic Regression Model
The regression model is used for a dependent variable having more than two discrete outcomes modelled in the form of a linear combination of the predictor variables. In this research, the multinomial logistic regression models were developed for modelling the mode choice for primary trips before and during the pandemic. The outcome (dependent) variable was mode choice with categories: public transport, paratransit, private transport, and active modes. The predictors (independent) variables were demographic characteristics (sex, employment, and car ownership), the primary purpose of the trip, the number of trips, distance travelled for trips, and factors affecting mode choice.
For multinomial models, the responses “prefer not to say” or not travelling before and during COVID-19 were removed. A total of 879 responses were used for developing models before and during COVID-19. Three categories including working, studying, and shopping, and others were considered for the primary purpose of trips. The remaining variables such as income, age, household size, and essential workers were excluded because they either had a lesser number of responses or a non-significant effect on mode choice. Moreover, the stepwise selection method was used for performing analysis and variables having a considerable effect on mode choice either before or during the COVID-19 model were selected.
3. Results
This section consists of the following subsections: (1) Socio-Demographic Characteristics of the Respondents; (2) Effect of COVID-19 on Travel Behavior; (3) Effect of COVID-19 on Mode Choice; and (4) Effect of COVID-19 on Frequency of Working from Home.
3.1. Socio-Demographic Characteristics of the Respondents
The respondents’ background used to assess their influence on the findings of this research study is shown in
Table 3.
3.2. Effect of COVID-19 on Travel Behavior
There was a change in the proportion of the primary purpose of trips before and during the COVID-19 pandemic (
Figure 3a). As expected, the work and study trips were reduced during COVID-19, which was due to the establishment of new online working platforms such as Zoom and Google meetings etc. The shopping trips increased, and this finding was in accordance with the previous worldwide survey study [
7]. A McNemar–Bowker test explained that there was a significant difference between the primary purpose of the trips before and during the COVID-19, as the chi-square and
p-value were 149.80 and 0.00, and this finding was consistent with the previous finding [
7].
Based on the results of McNemar as a post-hoc test, there was a significant shift in shopping trips to working trips, other (recreational or leisure) trips to work trips, and shopping trips to study trips or vice versa before and during COVID-19, and these findings were in accordance with the previous worldwide survey study [
7]. However, there was not a notable/significant shift in study trips to work trips, study trips to other trips, or shopping trips to other trips or vice versa before and during the COVID-19 (
Figure 4). The COVID-19 restrictions such as the closure of educational institutes and workplaces affected the normal working and study environment in Bangkok. As, a result, the majority of the working and study trips shifted to shopping trips during COVID-19. People were travelling during COVID-19, but their purpose for travelling was shopping instead of working or studying.
3.2.1. Distance Travelled per Week (in Kilometers)
From
Figure 3d, the distance travelled for trips from 0 to 30 km per week before COVID-19 was less than that during COVID-19, and the trip distance greater than 31 km before COVID-19 was more than that during COVID-19. This implies that people avoid travelling to places far from them during the pandemic. Our findings are in accordance with Molloy [
36] in Switzerland for the proportion reduction on the trip distance shorter than 10 km and Abdullah [
7] for the proportion increase on the trip distance more than 50 km.
The Wilcoxon Signed-Rank test showed a significant difference in distance travelled per week before and during the COVID-19 (Z = −12.40,
p (0.00) < 0.05). Moreover, people travelled more distance before than during COVID-19 and this finding was consistent with the worldwide survey result by Abdullah [
7]. The Mann–Whitney U test in
Table 4 revealed that male respondents’ distance travelled per week was longer than female respondents’ before COVID-19, and this finding was in accordance with Politis [
17] in Thessaloniki, Greece. Employers and car owners travelled longer distances per week than respective unemployed and non-car owners both before and during COVID-19. From
Table 5, for distance travelled per week, the Spearman correlation showed a positive relationship with age, household income, household size, and car ownership before and during COVID-19.
3.2.2. Number of Primary Trips per Week
From
Figure 3c, the number of primary trips per week was altered because of COVID-19. The proportion on the primary trip frequency of up to four trips per week was increased, while that on the frequency of at least five trips per week was decreased during COVID-19. Overall, the number of primary trips per week during the pandmeic was reduced when compared with that before the pandemic, and this finding is similar to previous studies carried out in Australia by Beck & Hensher [
20], the Netherlands by de Haas et al. [
10], Kelowna, Canada by Fatmi [
40], Kanto region Tokyo, Japan by Parady et al. [
22], and Thessaloniki, Greece by Politis et al. [
17]. The Wilcoxon Signed-Rank test revealed a significant difference in the number of trips per week before and during the COVID-19 pandemic (Z = −15.44,
p (0.00) < 0.05).
According to
Table 4, the Mann–Whitney U test explained that male respondents, essential workers, and employees had greater primary trip frequencies than respective female respondents, non-essential workers, and the unemployed both before and during COVID-19. Before COVID-19, car owners had more primary trips per week than non-owners, while both had the same number of trips during the COVID-19 pandemic. This finding is similar to the worldwide survey results by Abdullah [
7]. From
Table 5, the Spearman correlation showed that age and household income were positively correlated with the primary trip frequency before COVID-19, meaning that older or higher-income people had a higher number of primary trips. However, age and household income had no relationship with the number of primary trips during COVID-19.
3.2.3. Travel Time per Trip (One-Way Trip in Minutes)
From
Figure 3e, the proportion of the one-way trip travel time up to 30 min was increased, while that on the trip travel time of at least 31 min was decreased during the pandemic. As expected, people were shifting towards shorter trips during the pandemic. The Wilcoxon Signed-Rank test revealed a significant difference in travel time per trip before and during the COVID-19 pandemic (Z = −10.31,
p (0.00) < 0.05). From
Table 4, the Mann–Whitney U test explained that there was no significant difference in travel time per trip among male and female respondents, essential workers and non-essential workers, and employees and the unemployed before and during COVID-19. However, the travel time per trip of car owners was more than non-owners before and during COVID-19.
3.3. Effect of COVID-19 on Mode Choice
The modes chosen were different before and during COVID-19 (
Figure 3b). There was a reduction in public transport use and an increase in private, paratransit, and active transport in Bangkok during the COVID-19 pandemic, and these findings were similar to previous studies carried out in Sweden by Jenelius and Cebecauer [
41], Gdansk, Poland by Przybyłowski et al. [
21], Istanbul, Turkey by Shakibaei et al. [
19], and all over the world by Zhang et al. [
16]. Similarly, the use of paratransit and active mode of transport was also increased during COVID-19. Note that this finding is inconsistent with Politis [
17]. The McNemar–Bowker test revealed that there was a significant difference between the modes chosen for the primary trip before and during COVID-19, as the chi-square and
p-value were 190.29 and 0.00, respectively. This finding is similar to the finding by Abdullah [
7].
From
Figure 5, based on the results of McNemar as a post-hoc test, the mass transit (BTS, MRT, or Bangkok bus) users before COVID-19 were significantly shifted to private transport (car or motorbike) during the COVID-19 pandemic. This finding is similar to previous studies carried out in India by Bhaduri et al. [
42] and all over the world by Zhang et al. [
16]. The paratransit (taxi or motorbike taxi) users before the COVID-19 were significantly shifted to private transport (car or motorbike) during the pandemic. This finding is similar to the finding in India by Bhaduri [
42]. There was a significant shift from public transport before COVID-19 to active modes (cycling and walking) and paratransit (taxi and motorbike taxi) during the pandemic, while there was no significant shift from private transport and paratransit to active transport before and during the pandemic. The shifts from public transport to the other modes are significant, as expected, due to the pandemic. From
Figure 5, interestingly, the shift from private transport to active mode and the shift from paratransit to active mode are not significant, but the shift from public transport to active mode is significant. This implies that the facility for the active mode such as pedestrian walkways and bicycle lanes needs great improvement to attract private transport and paratransit users.
From
Table 4, the Mann–Whitney U test revealed a notable difference among sex and car ownership groups, while no significant difference was found among the essential workers group before and during COVID-19 for selection among modes. The mode choice among the employment status group before COVID-19 was significantly different, but that during COVID-19 was not significant.
3.3.1. Factors Affecting the Mode Choice
The modes people chose to travel under normal situations were influenced by several factors such as travel time, travel cost, convenience, comfort, mode availability, travelling purpose, and car ownership status. During the pandemic, other factors such as social distance, cleanliness, safety and security, passengers’ face masks, and infection concern play an essential role in selecting modes, and these can be named pandemic-related factors. From
Figure 6, before COVID-19, more than 50% of respondents prioritized travel time saving, safety and security, comfort, and cleanliness, and 43.40% of respondents gave high priority to travel costs. However, more than 70% of respondents prioritized pandemic-related factors during COVID-19. These results are in accordance with previous research results [
7,
24]. The Wilcoxon signed ranked test in
Figure 7 showed that the respondents prioritized pandemic-related factors during the pandemic, but they prioritized travel time saving and travel cost before the pandemic. Respondents gave the same priority to comfort before and during COVID-19.
3.3.2. Exploratory Factor Analysis (EFA)
Exploratory factor analysis (EFA) was conducted for the factors affecting mode choice before and during COVID-19. Three and two latent factors were generated before and during COVID-19, respectively, as shown in
Figure 8. The total variance explained was 60.49% before and 55.22% during COVID-19. The Kaiser–Meyer–Olkin Measure of Sampling Adequacy values were 0.828 and 0.813, respectively, greater than 0.75 (lower limit), and the
p-value for Bartlett’s Test of Sphericity was significant for both tests. The matrix determinants were 0.014 and 0.030, respectively. The Cronbach’s alpha was 0.822 for pandemic-related (passenger face mask, social distance, and infection concern), 0.707 for general (cleanliness, comfort, safety and security), and 0.879 for travel-related (travel cost and travel time saving) factors before COVID-19. Similarly, the Cronbach’s alpha was 0.938 for pandemic-related (social distance, infection concern, face mask, cleanliness, safety, and security), and 0.938 for general (travel time saving, travel cost, and comfort) factors during COVID-19. It can be seen that Cronbach’s alphas were greater than 0.70 (acceptable value) both before and during COVID-19. Thus, the results were satisfactory. Therefore, the generated latent factors are used as explanatory variables in regression models for the mode choice before and during COVID-19.
3.3.3. Mode Choice Modelling
Table 6 and
Table 7 show the estimation results of the multinomial logistic regression models for the mode choice before and during the pandemic, respectively. According to the fitting information of the model, the test for likelihood ratio was significant for models, meaning that the developed models are better than the intercept-only models. For the goodness of fit, Deviance’s chi-square test was insignificant, which reveals that the fitted models are correct and have extracted useful information from the data. The chi-square test for Pearson was significant for both models, which means that the models fit the data well. The models explain 34.5% and 33.8% (Nagelkerke) of variance in mode choice and McFadden Pseudo R-Square values are 0.2 before COVID-19 and 0.2 during the COVID-19 model, which indicates a good fit [
43]. For the before and during COVID-19 scenarios, 74.8% and 64.5% of cases, respectively, were correctly classified by multinomial logistic models.
Public transport relative to the reference mode (Active Mode): The chance of choosing public transport can increase with the increase in travel-related factors (travel cost and travel time saving) score. Male respondents showed a higher probability than female respondents, and employees showed less chance than the unemployed of choosing public transport.
Private mode of transport relative to the reference mode (Active Mode): Respondents showed a higher chance of selecting the private modes with an increase in travel-related factors (travel cost and travel time saving) score. Employees showed a lower probability than unemployed people, while car owners showed a higher likelihood of selecting a private transport mode than non-owners.
Paratransit relative to the reference mode (Active Mode): The likelihood of choosing paratransit increased with an increase in travel-related factors (travel cost and travel time saving) score. Car owners preferred to choose paratransit modes, as 88.1% of middle income (50,001 THB to 100,000 THB) and 94.2% of higher income (more than 100,000 THB) respondents were car owners. Therefore, car owners belong to higher and middle-income groups, can afford the travel cost of paratransit, and prefer to use it instead of using active modes for their primary trips.
- 2.
Mode Choice During COVID-19
Public transport relative to the reference mode (Active Mode): If the distance travelled per week was more, then the use of public transport would be decreased. However, when the number of primary trips per week was more, the use of public transport was increased. Male respondents had a higher likelihood of using public transport than female respondents. There was less chance of using public transport for work or study trips than for shopping or other trips.
Private modes of transport relative to the reference mode (Active Mode): Car owners showed a higher probability of using private transport than non-car owners. There was a higher chance of using private transport for shopping or other trips than work or study trips.
Paratransit relative to the reference mode (Active Mode): The likelihood of choosing paratransit can increase with the increase in pandemic-related factors (social distance, infection concern, face mask, cleanliness, safety, and security) score and general factor (travel time saving, travel cost, and comfort) score. Car owners preferred to choose paratransit modes than non-car owners. Employees showed a lesser chance of using paratransit than the unemployed. Respondents showed a higher likelihood of choosing paratransit for shopping or other trips than working or study trips.
3.4. Effect of COVID-19 on Frequency of Working from Home
COVID-19 resulted in working from home strategies and a change in the frequency of working from home. It was essential to examine the effect of COVID-19 on working from home. From
Figure 3f, there was an increase in the proportion of those who had worked from home more than twice per week in Bangkok during COVID-19 than before COVID-19, and this finding was similar to previous studies carried out in Australia by Beck and Hensher [
20], India by Bhaduri et al. [
42], the Netherlands by de Haas et al. [
10], Kelowna, Canada by Fatmi [
40], and Chicago, USA by Shamshiripour et al. [
23]. The Wilcoxon signed-ranks test revealed a significant difference in the frequency of working from home per week before and during the COVID-19 pandemic (Z = −18.09,
p (0.00) < 0.05), and this finding was similar to the finding by Abdullah [
7]. From
Table 4, the Mann–Whitney U test revealed that the frequency of working from home was the same for sex and employment groups before and during COVID-19. It was not affected by car ownership before the pandemic, but a significant difference was observed among car owners and non-owners during the pandemic. The results also show that the essential workers had less frequency of working from home than non-essential workers before and during COVID-19. From
Table 5, the spearman correlation revealed that the frequency of working from home was not significantly related to age, household income, or household size before COVID-19. However, age and household income were positively related, while the household size was inversely related to the frequency of working from home during COVID-19. This implies that those with greater household size may find it difficult to work from home during the pandemic, as their houses are too crowded and do not have work areas.
4. Discussion
The research findings offer extensive details regarding travel behavior and mode choice in Bangkok, Thailand based on respondents’ data. The results of this study show an increase in shopping trips and other (leisure or recreational) trips and a decrease in working and study trips during the pandemic. People were going out for shopping instead of working during COVID-19, which might be due to work-from-home strategies.
Distance travelled per week before COVID-19 was different than distance travelled during COVID-19. During COVID-19, people travelled a lesser distance per week. Similarly, the number of primary trips per week and one-way travel time per trip were changed before and during COVID-19. There was a notable reduction in primary trips per week during COVID-19. Most people have up to four trips per week and prefer trips having a travel time shorter than 30 min during COVID-19, while they had more than four trips per week before COVID-19. They are travelling when it is essential because they are either working from home or purchasing goods online using various online platforms. The public transport users did not want to stay on the bus or BTS for a longer duration when the pandemic began. Therefore, they have shorter trips during the pandemic.
Concerning sex groups, male respondents had longer distances travelled and a greater number of trips per week than female respondents before and during COVID-19. The distance travelled, number of primary trips, and travel time per trip was greater for car owners than non-car owners before COVID-19. It was facile for car owners with respect to the departure times as compared to non-car owners. However, the car owners and non-car owners had the same number of trips during COVID-19. Mostly higher-income (more than 100,000 THB) people were car owners and travelled longer distances than the lower-income people. They considered it safe to travel by private modes for their primary trips.
Interestingly, the travelers with a larger household size had a longer distance travelled per week before and during the pandemic than those with smaller household sizes. This means that since more people are living in a house, they will travel longer distances to fulfill their daily needs. Moreover, highly educated people or those holding master’s degrees had travelled longer distances per week than uneducated people before COVID-19. However, highly educated people had fewer primary trips per week during COVID-19 because they started to work from home to avoid the infection risk.
For the age categories, the older-age travelers made more trips per week before COVID-19. However, the case was reversed during the pandemic, as the old population of Bangkok had weaker immune systems and were more vulnerable to COVID-19 than young people.
The essential workers had longer distances travelled and more trips per week than non-essential workers both before COVID-19 and during COVID-19. Essential workers are workers in food services, health care, medical services, public transportation services, warehouse, delivery services, communication and IT departments, government and community-based services, emergency services, industrial services, and energy sectors. They had to go to their workplace in any condition and had more trips and a longer distance travelled before and during COVID-19.
People’s perception of mode choice changed during COVID-19. They were preferring to choose a private or active mode of transport over public transport to protect themselves from the pandemic. About 88.1% of middle-income and 94.2% of higher-income respondents had their cars. Most middle and higher-income people travelled by their private vehicle during the pandemic.
The research findings revealed an interesting fact; male respondents showed a higher probability of choosing the public mode relative to the active modes and gave higher importance to pandemic-related factors such as infection concern, social distance, cleanliness, and passenger face masks than female respondents. They had a higher number of trips and used public transport for their primary trips during COVID-19. However, everybody was giving higher priority to factors such as travel time and travel cost for the selection of mode before COVID-19. We can interpret that COVID-19 changed the thinking patterns of people, and their priorities regarding factors affecting mode choice were changed completely. The government needs to take actions such as mandatory face masks when travelling, contactless tickets, and sanitization disinfectant booths at every transit station to promote the use of public transport.
If we look in-depth at the mode choice categories, the results were as expected because the mass transit (BTS, MRT, or Bangkok bus) users were shifted to private transport (car or motorbike) during the COVID-19 pandemic and the paratransit (taxi or motorbike taxi) users were also shifted to private transport during the pandemic. Moreover, people were shifted from public transport to active transport and paratransit during the COVID-19 pandemic. The improvements to the walkways and footpaths are needed to attract people to use active modes in the future.
Another interesting finding is that non-car owners care more about pandemic-related factors than car owners during COVID-19 because they still had to go out during the pandemic for performing different activities on a particular day. They did not have their private vehicles and had to use public, paratransit, or active transport. The modes used by them are more likely to spread COVID-19. Therefore, they care a lot about pandemic-related factors to protect themselves from an infectious person. Based on this finding, the use of public transport can be enhanced by promoting a transportation system based on COVID-19 precatory measures.
The work-from-home strategies during COVID-19 resulted in a considerable shift of Bangkok residents from in-person working to online working. The older population of Bangkok has a higher frequency of working from home during COVID-19, as they were more vulnerable and easily affected by this fatal disease. Therefore, the majority of them were working from home and avoiding going out. Similarly, the higher-income people were also working from home during the pandemic. Moreover, there are still COVID-19 cases around the country, which means that a higher proportion of working from home can be expected, resulting in a short-term effect of demand reductions and long-term effects on the economy. There was no concept of working from home before COVID-19. Therefore, the frequency of working from home was the same for car owners and non-car owners before COVID-19. Interestingly, non-car owners and lower-income people had less frequency of working from home and still had to travel to their workplaces during COVID-19, as they did not have their private cars or motorbikes. They would use other modes such as public transport, paratransit, or active modes. Therefore, some improvements can be made to the existing public transport system such as contactless ticket purchasing facilities and sanitizing of buses at a particular time interval. These improvements will help to encourage people to use public transport and increase demand.
5. Conclusions
The current study was conducted for examining the travel behavior and mode choice of the Bangkok Metropolitan Area. To summarize the findings, the research study revealed that there was a considerable difference between the primary purpose of trips, mode choice, distance travelled per week, the number of primary trips per week, and frequency of working from home before and during the COVID-19 pandemic.
For travel behavior, work trips before COVID-19 were reduced and shopping trips were increased during COVID-19. Moreover, there was a significant shift in shopping to working trips, other trips to work trips, and shopping to study trips or vice versa before and during COVID-19. However, there was not a notable shift in study to working trips and study to other trips or vice versa before and during the COVID-19. The number of respondents having one to four trips per week was less, and the number of respondents having more than four trips per week was more before COVID-19 than that during COVID-19. The number of short-distance trips (0 to 30 km) per week was more, while the number of long-distance trips (more than 31 km) per week was less, and people avoided the use of BTS, MRT, or Bangkok buses for long-distance work or study trips during COVID-19. Before COVID-19, there were fewer trips having travel times from 0 to 30 min per trip (one way) than during COVID-19. However, there were more trips having travel times greater than 30 min per trip before than during COVID-19. People travelled only for essential trips by using private, paratransit, or active modes to prevent direct contact with contagious people during the COVID-19 pandemic.
For mode choice, there was a reduction in public transport use and an increase in private, paratransit, and active transport during COVID-19. The mass transit and the paratransit users before COVID-19 were shifted to private transport and active modes during COVID-19. During COVID-19, people’s priorities shifted from travel time saving, safety and security, comfort, and cleanliness to infection concerns, social distance, cleanliness, and passengers’ face masks for mode selection.
For frequency of working from home, before COVID-19, 63.10% of respondents never worked from home, which was reduced to 24.70% during the COVID-19 pandemic. However, there was an increase in the proportion of those who have worked more than twice per day in a week during COVID-19 than before COVID-19. The frequency of working from home would be more for higher-aged people or higher-income households, while it would be lower if more people lived in a household during COVID-19. In Bangkok, essential workers had more trips per week and less frequency of working from home during the pandemic compared to other workers.
People shifted from the BTS or Bangkok bus to cars or motorbikes, which resulted in traffic congestion. A proper transportation management system with new technologies (automated sanitization of escalators, touchless fever detection, mask detection, and contactless ticket service) is required to promote public transport use. People were shifted from public transport to active modes; therefore, provision of convenient, safe, and connected walking and cycling infrastructure is needed to promote more active travel.
The limitations and future studies and the possible future applications are discussed in the next two sub-sections.
5.1. Limitations and Future Studies
This study was only carried out for the Metropolitan area of Bangkok, and a future study can be carried out for the entirety of Thailand to evaluate the travel behavior and mode choice. This study only discussed travel behavior and mode choice preferences before and during COVID-19. However, the travel behavior and mode choice for the post-pandemic situation in Bangkok were not included in this study. A future study can be carried out using a revealed preference and stated preference survey. Moreover, the advantages and disadvantages of working from home as well as the efficiency of working from home as compared to working in offices were not analyzed in this research. A future study can be carried out by including these parameters. In the same way, the research for the identification of passenger needs, concerns, and requirements was not analyzed in this study. In the future, this study can be carried out, playing an important role in the satisfaction of the public transport needs during future pandemic situations.
5.2. Future Applications
Our study revealed that people are shifting from public and paratransit to private modes of transportation and giving high importance to social distances, cleanliness, infection concern, and passenger face masking during the current COVID-19 situation. Therefore, relevant transportation measurements and policies must be taken. People have shifted from the BTS or Bangkok bus to cars or motorbikes, which results in traffic congestion. Therefore, a proper transportation management system with new technologies (automated sanitization of escalators, touchless fever detection, mask detection, and contactless ticket service) is required to promote public transport use. People were shifted from public transport to active modes; therefore, provision of convenient, safe, and connected walking and cycling infrastructure is needed to promote more active travel.


