Article

Potential Sources of Heavy Metals in Sediments of an Urban‒Agricultural Watershed and Relationship with Land Use Using a Statistical Approach

1
Yeongsan River Environment Research Center, National Institute of Environmental Research, Gwangju 61011, Korea
2
Majors in Plant Resources Sciences & Environment, Jeju National University, Jeju 63243, Korea
*
Authors to whom correspondence should be addressed.
Sustainability 2022, 14(15), 9444; https://doi.org/10.3390/su14159444
Submission received: 23 June 2022 / Revised: 23 July 2022 / Accepted: 29 July 2022 / Published: 1 August 2022
(This article belongs to the Special Issue Integrated Watershed Management for Adaptation to Climate Change)

Abstract

:
This study verified pollution levels through evaluation of the Sediment Quality Guidelines (SQGs), pollution load index (PLI), and potential ecological risk index (PERI) by analyzing the concentrations of heavy metals in sediments of an urban‒agricultural watershed in the Yeongsan River basin, South Korea. Statistical analyses were performed to determine the relationships between pollution levels and land use, and potential sources of pollution were identified. For spatial distributions, Pb, Zn, Cu, Cd, and Hg concentrations were highest at mid-upstream, but As, Cr, and Ni concentrations were similar at most sites. The polluted sites, which showed the potential toxicity toward benthic organisms in comparison to SQGs, were most frequently observed at mid-upstream. Moreover, PLI and PERI evaluations also confirmed levels of high anthropogenic pollution and the potential ecological risk at mid-upstream. The mid-upstream sites with high heavy metal pollutions showed high correlations with urban land use, which showed the highest distribution, implying a close relationship with anthropogenic impacts such as high population density and industrial complexes. Statistical analyses also confirmed that high heavy metal concentrations in the mid-upstream were closely related to urban land use. These findings suggest that urban areas are highly likely to cause anthropogenic heavy metal pollution in sediments as point or non-point sources such as domestic sewage and industrial wastewater flow into rivers.

1. Introduction

Heavy metals are major pollutants of the aquatic environment [1,2]. They flow into rivers through various routes and accumulate in sediments. Sediments play an important role in the management of aquatic ecosystems as they reflect the pollution history of rivers and act as sinks in the aquatic environment [2]. Pollution caused by recent industrial development and population increases pose serious irreversible damage to all environments and are continuously affecting the global environment. Pollutants such as heavy metals have adverse effects on aquatic ecosystems, owing to their long persistence in the environment [3]. Generally, in the absence of anthropogenic contamination, heavy metal concentrations are determined by natural factors such as weathering and erosion of rocks and soil. However, heavy metals generated by anthropogenic activities flow into rivers through various routes, including fossil fuel combustion, industrial wastewater, traffic, mining industry, manufacturing, and use of fertilizers and pesticides [4,5]. In aquatic environments, heavy metals have potential toxic effects on benthic organisms, and accumulate in organisms higher in the food chain [6,7]. Heavy metals entering aquatic environments are adsorbed to particulate matter by complex physical and chemical actions or are used by plankton and are finally deposited on the bottom of rivers or lakes [8]. Aquatic sediments are very important for assessing anthropogenic pollution because they act as the carrier of pollutants and also as potential secondary pollution sources [9].
Lands with numerous anthropogenic pollution sources can contaminate sediments through direct inflow or indirect routes such as atmospheric deposition and soil erosion, and soils and sediments around agricultural fields, highways, and industrial areas are exposed to severe heavy metal contamination [10,11,12,13]. Therefore, several researchers have attempted to evaluate heavy metal pollution levels of river sediments and investigate the correlation between heavy metals and land use to assist in land use and river pollution management planning. These previous studies reported that the higher the diversity of industrial and urban land or land use, the more negatively it affects sediment pollution [14,15,16].
In the Yeongsan River basin, which is located in the southwest of South Korea, there is a large city with a population of approximately 1.4 million, dense industrial complexes in the mid-upstream, and plains in the mid-downstream. Thus, the problem of environmental pollution has been raised due to the discharge of pollution sources from the industrial and agricultural activities [17,18]. Therefore, many researchers have analyzed the relationship between land use and water quality to evaluate the water pollution level of the Yeongsan River basin [19,20]; however, the effect of land use on sediment pollution has not yet been studied. Sediment pollution in the Yeongsan River basin in South Korea, where various land uses are distributed, is expected to vary depending on land use, and it is very important to understand the relationship between sediment pollution and land use for the efficient management of heavy metal contamination of sediments.
Therefore, this study analyzed the concentrations of eight heavy metals (Pb, Zn, Cu, Cd, Hg, As, Cr, and Ni) in the sediments of an urban‒agricultural watershed in the Yeongsan River basin in South Korea. The pollution level was examined through comparison with the Sediment Quality Guidelines (SQGs) and evaluation of the pollution load index (PLI) and potential ecological risk index (PERI). In addition, the relationship between heavy metal concentration and land use and potential pollution sources of sediments were identified using statistical approaches (correlation analysis (CA) and principal component analysis (PCA)). Understanding the relationship between sediment pollution and land use might be helpful for the efficient management of heavy metal pollution sources as per sediment management policies.

2. Materials and Methods
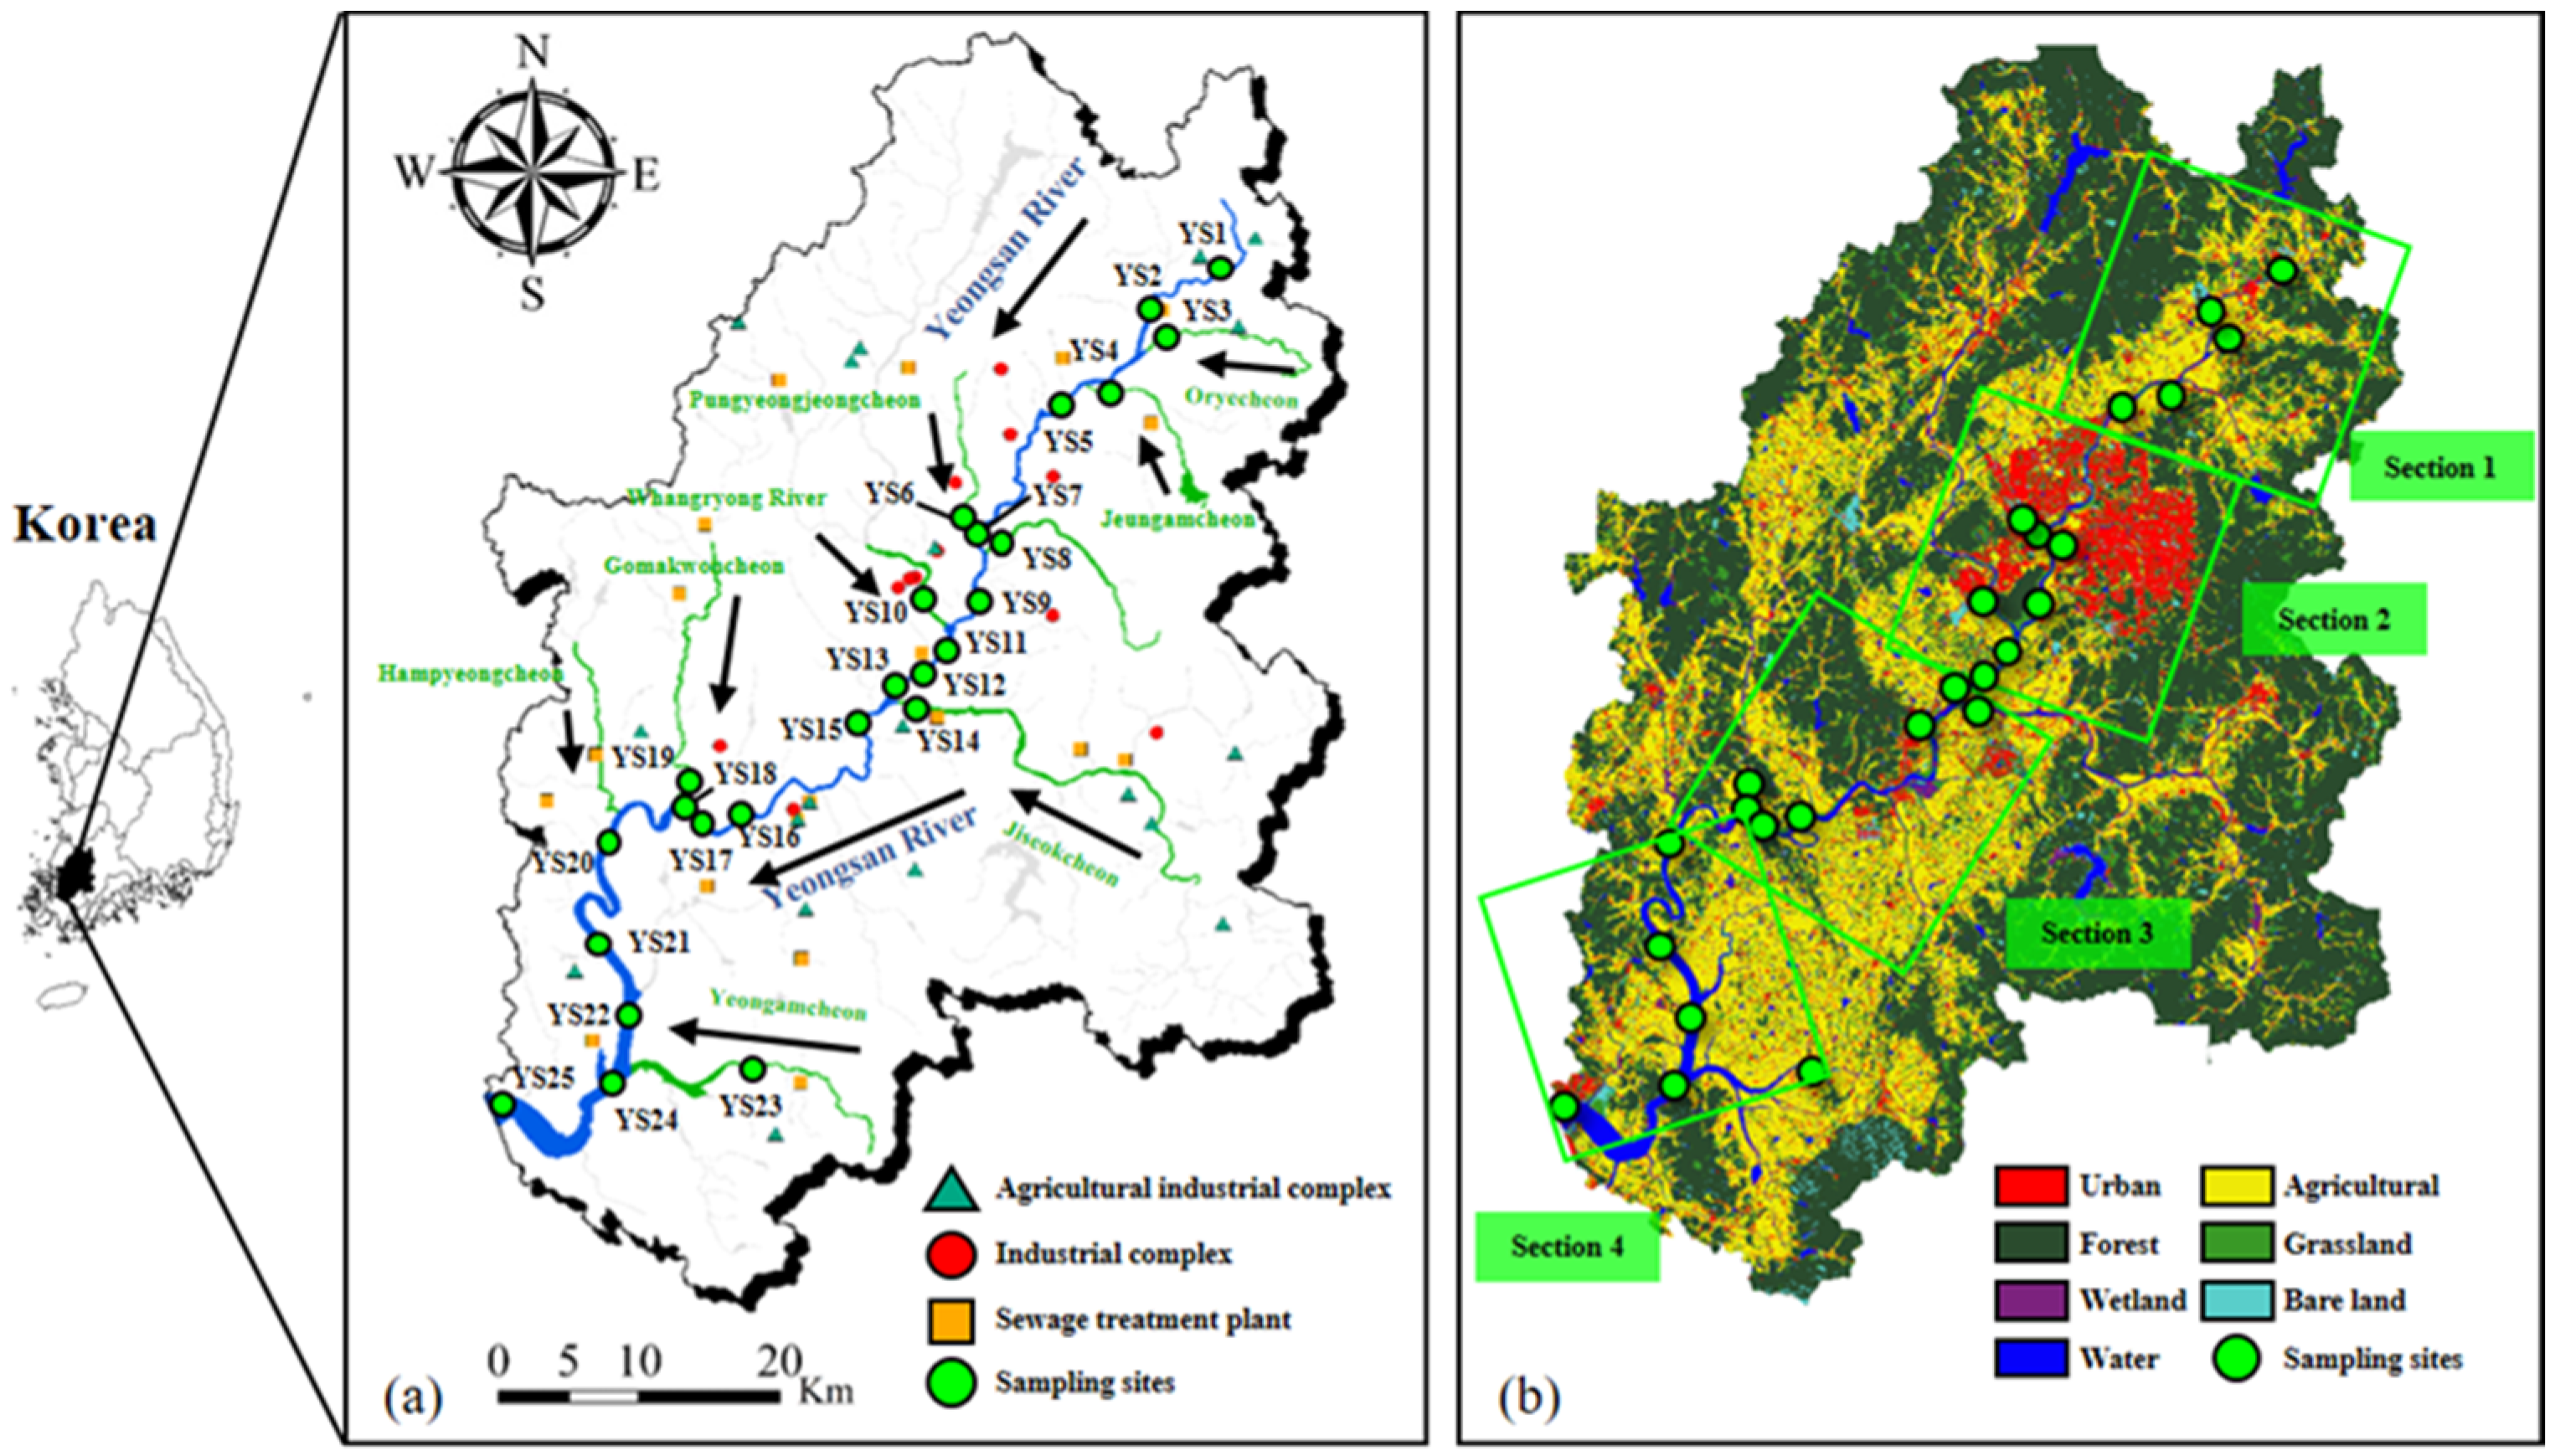
2.1. Study Area

The Yeongsan River, one of the four major rivers in South Korea, is located in the southwest of South Korea (34°40′–35°29′ N, 126°26′–127°06′ E) and supplies domestic water, agricultural, and industrial waters to Gwangju City and Jeollanam-do [21]. The Yeongsan River originates from Yongchubong (elevation, 584 m) in Jeollanam-do, then flows southwest where Gwangju Stream, Hwangryong River, and Jiseok Stream join, and then flows into the Southwest Sea through the Yeongsan River estuary after the confluence of the Gomakwon Stream and the Hampyeong Stream. The Yeongsan River basin covers an area of approximately 3551 km2, the total length of the mainstream is 150 km, and the average annual precipitation is 1270 mm. It is characterized by an Asian monsoon climate where precipitation is concentrated in summer (June‒August). Point sources such as agricultural industrial complex and sewage treatment plants are located throughout the Yeongsan River basin, and industrial complexes are concentrated in the mid-upstream (Figure 1a).
The land uses of the Yeongsan River basin were classified into seven types (bare land, agricultural, forest, water, wetland, urban, and grassland). Subsequently, the land uses for each site were calculated by considering the catchment area using the ArcGIS program (ver. 10.2.2). The areas of the different land uses in the Yeongsan River basin decreased from agriculture (33.1%) > forest (29.0%) > grassland (15.0%) > urban (12.9%) > water (5.2%) > bare land (2.8%) > wetland (2.0%). Urban lands were concentrated in the mid-upstream of the Yeongsan River basin, similar to the distribution of industrial complexes (Figure 1b).
For sediment sampling sites, 17 sites in the mainstream and 8 sites in the tributaries were selected from upstream to downstream of Yeongsan River basin, and the sampling period was from June‒November 2019. The sampling sites were divided into four sections at regular intervals to reflect the spatial land use characteristics in the Yeongsan River basin. They included five sites in the most upstream (YS1–YS5) in Section 1, seven sites in the mid-upstream (YS6–YS12) in Section 2, seven sites in the mid-downstream (YS13–YS19) in Section 3, and six sites in the most downstream (YS20–YS25) in Section 4 (Figure 1b).

2.2. Sediment Sampling and Pretreatment

Sediment samples were collected from five or more sites using a Ponar grab or a scoop sampler while traversing along the vertical direction of the stream at the selected sites. The collected samples were mixed and homogenized to ensure representativeness of the samples. The homogenized samples were passed through a 0.15 mm non-metallic nylon sieve in the field, sealed in a polyethylene bottle, transferred to the laboratory, and then air-dried in a clean facility. The dried samples were crushed in a pulverizer (Pulverisette 6, Fritsch Co., Idar-Oberstein, Germany), passed through a 0.063 mm nylon sieve, and used for heavy metal analyses [22].

2.3. Sediment Analyses Methods

For the analysis of Pb, Zn, Cu, Cd, As, Cr, and Ni, the dried samples were placed in a Teflon vessel and a mixed acid (HNO3:HClO4:HF = 2:1:2) was added; subsequently, the samples were heated at 130 °C using a graphite heating block (ECOPPE-III, ODLAB, Gwangmyeong, Korea) until they were completely decomposed. Then, the mixture was dissolved with a 2% HNO3 solution and was then used for analysis. Pb, Zn, Cu, Cr, and Ni were measured using an inductively coupled plasma‒atomic emission spectrometer (ICP‒AES; 700S, Agilent Technologies, Santa Clara, CA, USA), whereas As and Cd were measured with an inductively coupled plasma‒mass spectrometer (ICP‒MS; NexION 350D, Perkin Elmer, Waltham, MA, USA). Hg was directly analyzed with a mercury analyzer (Hydra Ⅱc, Teledyne, Thousand Oaks, CA, USA) without pretreatment [22].

2.4. Quality Control

Quality control was performed before analyzing the sediment samples with certified standard materials (MESS‒4, National Research Council, Ottawa, ON, Canada) according to the sediment standard method of the Korean standard method for water quality [22]. For certified reference materials, seven samples with concentrations similar to the suggested limit of quantitation were prepared [22]. The result confirmed that the analysis accuracy and precision for eight heavy metals (Pb, Zn, Cu, Cd, Hg, As, Cr, and Ni) were acceptable within the ranges of 94.0 to 104.9% and <7% RSD (relative standard deviation), respectively. The detection limits were 0.198 mg/kg for Pb, 0.031 mg/kg for Zn, 0.113 mg/kg for Cu, 0.0003 mg/kg for Cd, 0.016 mg/kg for As, 0.104 mg/kg for Cr, 0.289 mg/kg for Ni, and 0.002 mg/kg for Hg. All analyses were performed for every 20 samples of blanks, standard solutions, certified reference materials, and duplicate samples.

2.5. Pollution Assessment of Sediments

The sediment pollution level was evaluated from the widely used SQGs comparison and PLI and PERI methods to examine the anthropogenic pollution caused by heavy metals. The SQGs used in this study are presented in Table 1 as recommendations for freshwater sediments in South Korea [23]. The SQGs are recommended standards proposed by the National Institute of Environmental Research (NIER) of the Ministry of Environment (MOE) when national sediment monitoring began [23,24,25]. The SQGs divide heavy metals into four classes considering the toxic effects on benthic organisms (Table 1).
The sediment pollution status for each site was evaluated in four stages (‘Good’, ‘Fair’, ‘Poor’, and ‘Very Poor’) by comprehensively considering the heavy metal class evaluated by the SQGs. The ‘Good’ stage is a natural environmental level without anthropogenic pollution where all eight heavy metals fall under Class I. The ‘Fair’ stage refers to a case where there is at least one heavy metal corresponding to Class II or Class III, which means that there is a possibility of toxic effects on benthic organisms. ‘Poor’ and ‘Very Poor’ stages refer to contamination states with a high possibility of toxic effects of heavy metals; they correspond to the states whereby the mean probable effect level quotient (mPELKQ) of heavy metals is ≥0.34, and when one or more heavy metals are Class IV level, respectively [23,24,25]. The mPELKQ of heavy metals, which was proposed by Fairey et al. (2011) [26] using the concentration (ECi) of individual heavy metals and the PEL value (PELK) suggested by Smith et al. [27], was calculated using the following equation:
m P E L K Q = i = 1 n ( E C i / P E L K i ) / n ,
where ECi is the heavy metal (i) concentration, PELKi is the PEL value of heavy metal (i), and n is the number of heavy metals. The PEL values (mg/kg) were 154 (Pb), 1170 (Zn), 228 (Cu), 1.87 (Cd), 0.67 (Hg), 44.7 (As), 224 (Cr), and 87.5 (Ni). These PEL values were derived from SQGs for freshwater sediments in South Korea [23].
The evaluation of the level of anthropogenic pollution caused by heavy metals was verified by PLI and PERI considering the background concentrations of the study area [28,29]. The background concentrations used in this study were the mean concentrations of Pb (50.2 mg/kg), Zn (21.5.0 mg/kg), Cu (43.9 mg/kg), Cd (0.4 mg/kg), Hg (0.065 mg/kg), As (14.9 mg/kg), Cr (83.3 mg/kg), and Ni (39.3 mg/kg) in river sediments investigated in South Korea by NIER [30].
The PLI and PERI were obtained from the contamination factor (CF) that evaluates the heavy metal contamination level; CF was calculated by the following equation:
CF = C s a m p l e / C b a c k g r o u n d ,
where Csample is the heavy metal concentration and Cbackground is the background concentration of the study area.
The PLI is used as a standard for determining the overall heavy metal pollution level and was calculated by the following equation from the CF of each heavy metal [29,31]:
PLI = ( C F 1 × C F 2 × C F 3 × × C F n ) 1 n ,
where CF is the contamination factor of heavy metal (i) and n is the number of heavy metals, i.e., eight. If the PLI value is less than 1, it means that there is no possibility of contamination; if it exceeds 1, there is a possibility of contamination [29,31].
The PERI was first proposed by Håkanson [28] as a method of evaluating the ecological risk caused by heavy metals in soil or sediments and is currently widely used. The PERI of individual metals was calculated from the CF of heavy metals and toxic-response factors (f). PERI was calculated for all metals as follows [28,32]:
PERI = i = 1 n C F n × f n ,
where CF is the contamination factor of heavy metal (i), n is the number of heavy metals, and f is the toxic-response factor of heavy metal (i). Because toxic responses of organisms differ for each heavy metal, f values of 5, 1, 5, 30, 40, 10, and 2 were applied in this study for Pb, Zn, Cu, Cd, Hg, As, and Cr, respectively. The f values were initially proposed for a total of eight items, including seven heavy metals and polychlorinated biphenyls (PCBs); however, in a recent study, seven heavy metals except for the items of PCBs were also used for PERI evaluation [25,33]. The PERI, excluding PCBs, is classified into four stages: low (PERI < 95), moderate (95 ≤ PERI < 190), considerable (190 ≤ PERI < 380), and very high (PERI ≥ 380) [28,33].

2.6. Statistical Analysis

CA and PCA were performed using R (ver. 3.5.3 for Windows) to examine the relationships between heavy metals in the Yeongsan River basin sediments and land use. For CA, Pearson’s correlation coefficient (r) (i.e., the most commonly used method for measuring the correlation between two groups) was used and the data were visualized through clustered heat maps [34,35]. PCA, first proposed by Pearson [36], is one of the most widely used multivariate statistical methods to reduce the dimension of data and a statistical analysis method used in the interpretation of big data [36]. In the environmental field, it is mainly used to evaluate the origin of pollutants or to classify them according to variable characteristics [37,38]. PCA has also been used to research heavy metal pollution in river sediments related to land use [14,39,40]. In this study, the main components were extracted through factoextra packages for PCA and were visualized in a biplot proposed by Gabriel [41]. Biplot is a method that can express information about samples (sites) and variables in one graph in which samples are drawn as points and variables are drawn as arrow-shaped vectors. The more the arrow is parallel to the axis, the greater the effect on the corresponding principal component; the longer the length, the greater the variance becomes [41].

3. Results and Discussion

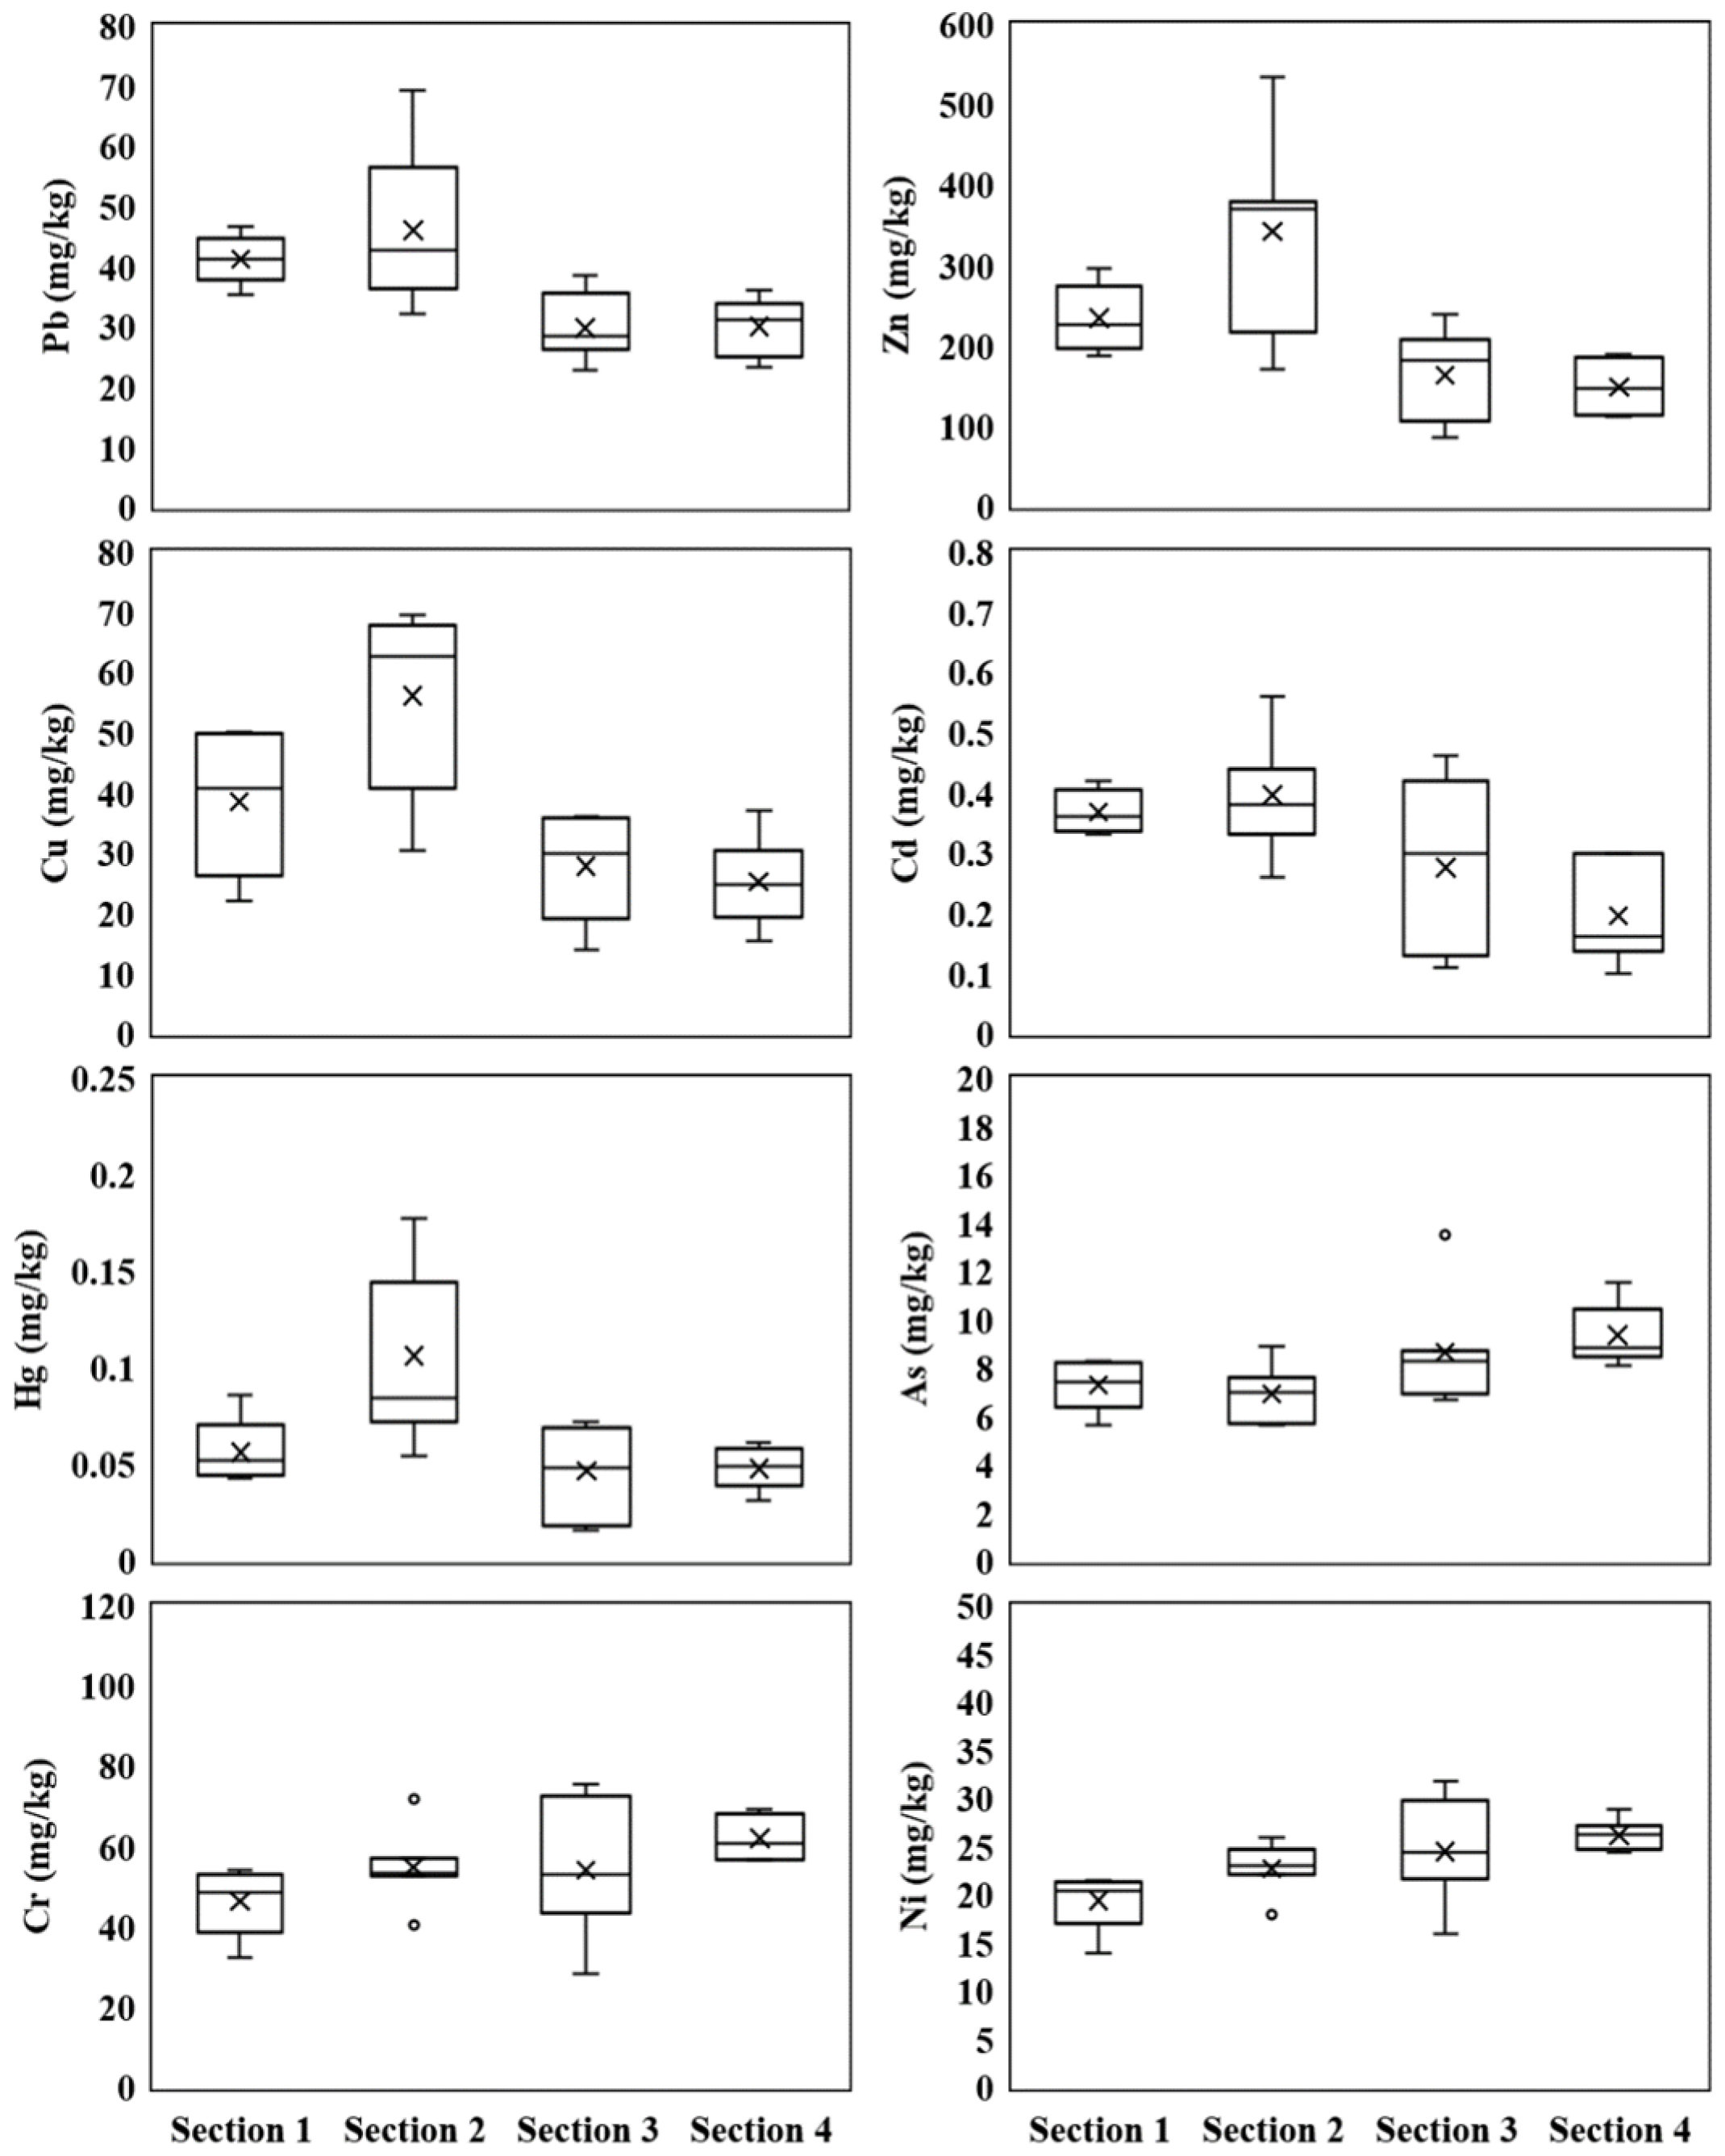
3.1. Distribution of Heavy Metal Concentrations

The distributions of eight heavy metal concentrations (Pb, Zn, Cu, Cd, Hg, As, Cr, and Ni) in sediments collected from the mainstream and tributaries in the Yeongsan River basin are shown in Figure 2. The mean Pb, Zn, Cu, Cd, Hg, As, Cr, and Ni concentrations for all sites were 36.7 ± 10.4 mg/kg, 223.8 ± 105.0 mg/kg, 37.2 ± 16.3 mg/kg, 0.31 ± 0.12 mg/kg, 0.065 ± 0.037 mg/kg, 8.1 ± 1.7 mg/kg, 54.6 ± 11.4 mg/kg, and 23.3 ± 4.0 mg/kg, respectively, and descended in the order of Zn > Cr > Cu ≈ Pb > Ni > As > Cd > Hg. The mean concentrations of these heavy metals were compared with those of previous studies, as shown in Table 2. The mean concentrations of all heavy metals except Hg and As were 1.5 to 10 times higher than those reported by Shin et al. [42], which were obtained from similar sites located in the same Yeongsan River basin as in this study. Since that study was conducted after Korea’s Four Major Rivers Restoration Project in 2012 [43], it is considered that low heavy metal concentrations were observed by removing past pollutants accumulated in the sediments. Similarly, the mean concentrations of heavy metals in this study were mostly higher than those observed in the Han River and the Geum River [39,43]. In contrast, in a recent investigation in the Nakdong River, mean concentrations of heavy metals were mostly similar to the results of this study [44]. According to the results of China’s three rivers (Lijiang, Yangtze, and Qinhuai) and the Huixian wetland [15,45,46,47], the mean concentrations of Pb, Cu, Cd, and Ni were mostly similar to the results of this study, but the mean concentrations of Cd were approximately 2 to 3 times higher than those in the Lijiang and Qinhuai River. The mean concentrations of Zn were lesser in all three rivers and the wetland, whereas the mean concentrations of Hg were higher. The mean concentrations of As and Cr were higher only in the Lijiang River and the Huixian wetland and in the Qinhuai River and the Huixian wetland, respectively.
Regarding heavy metal concentration by site, Pb and Zn concentrations were highest at YS6, Cu, and Cd concentrations at YS8, and the Hg concentration at YS9; whereas As, Cr, and Ni concentrations were similar among the sites. To clearly understand the spatial distributions of heavy metal concentrations, the 25 sites of the Yeongsan River basin were classified into four sections and were presented as box-and-whisker plots (Figure 3). Pb, Zn, Cu, Cd, and Hg concentrations were highest in Section 2 located at mid-upstream of the Yeongsan River basin; these concentrations were low in the upstream and downstream, high in the middle, and tended to decrease from the middle to the downstream. As, Cr, and Ni concentrations were similar at most sites; however, in contrast to the above-mentioned heavy metals, they tended to increase slightly from upstream to downstream. The sites in Section 2, where high Pb, Zn, Cu, Hg, and Cd concentrations were observed, were close to densely populated areas and industrial complexes. Thus, it was considered that they were greatly affected by point sources such as domestic sewage and industrial wastewater.

3.2. Spatial Distribution of Land Use and Pollution Assessment by SQGs, PLI, and PERI

The land uses and sediment pollution levels according to the SQGs, PLI, and PERI evaluation results of the mainstream and tributaries located in the Yeongsan River basin are spatially shown in Figure 4. Land uses were classified into seven types (bare land, agricultural, forest, water, wetland, urban, and grassland) considering the catchment area of each site. In addition, regarding the sediment pollution level, SQGs, PLI, and PERI were evaluated based on the concentrations of eight heavy metals (Pb, Zn, Cu, Cd, Hg, As, Cr, and Ni). SQGs were divided into four stages of ‘Good’, ‘Fair’, ‘Poor’, and ‘Very Poor’; PLI was divided into two stages of ‘No Pollution’ and ‘Polluted State’; and PERI was divided into four stages of ‘Low’, ‘Moderate’, ‘Considerable’, and ‘Very High’.
According to the SQGs comparison (Table S1), most pollution levels of heavy metals by item were evaluated as Class I, and it was found that a slight possibility exists where they can be toxic to benthic organisms. However, at some sites (YS1–2, YS4, YS6–9, YS11–12, and YS15–17), Pb, Zn, Cu, Cd, and Hg were rated as Class II, indicating the possibility of toxicity. Specifically, heavy metals evaluated as Class Ⅱ were frequently observed at mid-upstream sites (Section 2) of the Yeongsan River basin, while heavy metals corresponding to Class Ⅱ were found the most at YS6 site. Based on the evaluation of individual heavy metals, the pollution level for each site was one or more heavy metals corresponding to Class Ⅱ but did not exceed the mPELKQ standard value (0.34); hence, every site was confirmed as being in a ‘Fair’ stage. In the spatial distribution of Figure 4b, the ‘Fair’ stage was found at most sites of the Yeongsan River basin (except for the most downstream [Section 4]) but was most frequently observed at the mid-upstream (Section 2). The ‘Fair’ stage implies a possibility of toxicity to benthic organisms, and it is a sediment contamination state that needs to be confirmed through toxicity testing.
Consequently, the PLI and PERI were evaluated to verify the anthropogenic pollution levels of heavy metals, and the PLI and PERI were obtained from CF. According to the CF results (Table S2), the concentrations of Pb (YS6–7), Zn (YS2–4, YS6–9, YS11–12, and YS17), Cu (YS2, YS4, YS6–9, and YS11), Cd (YS1, YS6–8, and YS15–16), and Hg (YS2, YS6–9, YS11–12, and YS16–17) exceeded background concentrations at most sites, except those located at the most downstream (Section 4) of the Yeongsan River basin. These heavy metals and sites were consistent with those identified as Class II from the SQGs evaluation, and the sites exceeding the background concentration also tended to be the same as the spatial distribution of the ‘Fair’ stage sites in the Yeongsan River basin shown in Figure 4b. In the case of the PLI and PERI spatial distribution calculated on the basis of CF, among the sites located in the mid-upstream (Section 2) of the Yeongsan River basin, only two sites (YS6 and YS8) exceeded the contamination criterion 1 by the PLI evaluation; this implied that they were contaminated (Figure 4c). Similarly, in the PERI evaluation, it exceeded 95 only at YS6 (99.5), YS7 (102.1), YS8 (151.7), YS9 (155.6), and YS11 (127.8), located in the mid-upstream (Section 2). This confirmed that the potential ecological risk caused by heavy metals was at a contamination level of concern (Figure 4d).
According to the SQGs, PLI, and PERI evaluation results, the sediments of the Yeongsan River basin were evaluated as having the highest pollution level risk at the mid-upstream sites (Section 2). It was estimated that these sites in Section 2 would be closely related to the urban land that showed the highest distribution among the land uses, as shown in Figure 4a. This suggested that in the urban area, domestic sewage and industrial wastewater discharged from industrial complexes and the high population density are highly likely to flow into rivers and cause anthropogenic heavy metal pollution of sediments. In particular, the high pollution levels of Pb, Zn, Cu, Cd, and Hg well reflected that they were closely related to domestic sewage and industrial wastewater. In contrast, as shown in Figure 4a, sites with a relatively high distribution of agricultural areas (Sections 1, 3, and 4) were less correlated with the sediment pollution level than those in urban areas.
The sediments in the Yeongsan River basin showed contradictory results to those of the Boseong River located in the Seomjin River basin in South Korea, which showed high As, Cr, and Ni pollution levels due to geological impact [48]. This suggested that sediments in the Yeongsan River basin depend on anthropogenic impact rather than geological impact. However, Sekabira et al. [49] reported that Pb, Cu, and Zn concentrations in the surrounding river sediments may be increased by vehicle and industrial wastewater in urban areas. Furthermore, according to Huang et al. [38] and Sakan et al. [50], river sediments adjacent to urban and industrial areas act as important sinks for Pb, Zn, Cu, and Cr introduced through domestic wastewater, urban runoff, and industrial activities. Therefore, the sediments of river sites in the mid-upstream (Section 2) of the Yeongsan River basin are considered to be greatly influenced by urban areas, similar to the results of previous studies [38,49,50]. Heavy metal pollution of sediment in these sites was not at a level of serious concern; however, it requires continuous management.

3.3. Relationship between Land Use and Heavy Metals

CA and PCA were performed to verify the correlation between heavy metals and land use among the sediments of the mainstream and tributaries in the Yeongsan River basin. Figure 5 shows the CA and PCA results as a clustered heatmap and biplot, respectively. These were used to identify potential pollution sources for the sediments in the Yeongsan River basin.
The CA results expressed as clustered heatmaps in Figure 5a were divided into two groups: Group 1 (agricultural, As, wetland, water, Ni, Cr, and forest) and Group 2 (grassland, bare land, urban, Hg, Cd, Pb, Zn, and Cu). In Group 1, among As, Ni, and Cr, a strong positive correlation was only observed between Cr and Ni (r = 0.91, p < 0.01). Between land use (agricultural, wetland, water, and forest) and heavy metals (As, Cr, and Ni), a statistically significant correlation was observed only between agricultural land use and As (r = 0.44, p < 0.05). In the case of Group 2, except for Hg and Pb (r = 0.43, p < 0.05), which had a weak positive correlation, Pb, Zn, Cu, Cd, and Hg concentrations mostly showed a strong positive correlation (r = 0.58–0.89, p < 0.01). To observe the relationship with land use, most of these heavy metals showed a positive correlation (r = 0.17–0.57) with urban, bare land, and grassland, although they were not statistically significant at the significance levels of p < 0.01 and p < 0.05. In particular, urban areas showed a statistically significant correlation with all heavy metals except Hg, and bare land showed strong positive correlations with Pb and Zn. Within the above two groups, heavy metals and land use with high correlation indicate that they have common sources and mutual dependence within each group. This implies that potential pollution sources can be analyzed because they involve identical characteristic behavior [25,51,52].
The PCA biplot in Figure 5b expresses the relationship between heavy metals, land use, and sites among the sediments of the Yeongsan River basin. The two extracted factors (PC1 and PC2) had a cumulative variance of 54.1%, and thus a high explanation was possible (Table S3). The first factor (PC1) was confirmed as a variable contributing to Zn, Cu, Cd, Pb, Hg, urban, and bare land, and the second factor (PC2) was confirmed as a variable contributing to Cr and Ni. In PC1, Pb, Zn, Cu, Cd, and Hg were shown to have a close relationship with urban and bare land uses, implying that they highly contributed to each other. This high contribution of heavy metals and land use implied high correlations with the sites in Section 2 (YS6–9 and YS11) located in the mid-upstream. As previously described, regarding the spatial distribution of heavy metals and land uses, the high correlation between high concentration of heavy metals (Pb, Zn, Cu, Cd, and Hg) and high urban areas observed at sites in Section 2 could be clearly explained by the PCA biplot. These results were consistent with the CA evaluation described previously. According to previous studies, Pb is mainly discharged from sewage, manure, vehicle exhaust gas, and industrial facilities, and flows into aquatic environments [53,54]. It is also known that aerosols caused by coal combustion and industrial activities are transferred to lake sediments through the atmosphere [54]. Moreover, it has been reported that the Pb concentration was higher in urban areas than in rural areas due to vehicle traffic and land use [55]. In addition, vehicles (tire wear, brake pads, and lubricants), household waste, and construction activities have been found to be major sources of Pb, Zn, Cu, and Cd [52,56]. Since Hg is used to physically separate Au from the ore, it is the main pollution source in sediments around abandoned metal mines [41,57]. Dust from industry and transportation has also been reported as a major source of Hg [37]. This suggests that the high Pb, Zn, Cu, Cd, and Hg concentrations at the sites in Section 2 (YS6–9 and YS11) located in the mid-upstream of the Yeongsan River basin were closely related to industrial activities and population density. In contrast, with respect to the matrix in PC2, Cr, and Ni, which are known to be dominantly affected by geological influences [53,58,59], contributed as the second factors and showed a high correlation. However, these heavy metals had little association with land uses and sites in the Yeongsan River basin; hence, it was considered that the geological impact was negligible. Arsenic, known to be introduced into aquatic environments by the use of pesticides (insecticides and herbicides) in agriculture [60,61], was found to be related to the mid-downstream (YS14 and YS18–19) and the most downstream (YS20 and YS22–25) of the Yeongsan River basin with high agricultural land use.

4. Conclusions

We analyzed the mean concentrations of the eight heavy metals in the sediments collected from the Yeongsan River basin in South Korea. The concentrations decreased in the order of Zn > Cr > Cu ≈ Pb > Ni > As > Cd > Hg. Spatial distribution analysis revealed that Pb, Zn, Cu, Cd, and Hg concentrations were the highest in the mid-upstream of the Yeongsan River basin; As, Cr, and Ni concentrations were similar at most sites.
Compared with the SQGs, sediment pollution was not found to be a level of serious concern at most sites; however, the ‘Fair’ stages, which were found to be toxic to benthic organisms, were primarily observed at the mid-upstream of the Yeongsan River basin. PLI and PERI evaluation confirmed that anthropogenic pollution level and the potential ecological risk were at a contamination level of concern only at some sites in the mid-upstream of the Yeongsan River basin. Regarding the relationship between the SQGs, PLI, and PERI evaluation results and land use, sites mid-upstream with high sediment pollution levels were closely related to urban areas, showing the highest distribution among all land uses. The results well reflected that the high Pb, Zn, Cu, Cd, and Hg pollution levels were closely related to domestic sewage and industrial wastewater.
Based on the CA and PCA biplot, the sediments of the Yeongsan River basin by CA were divided into two groups: Group 1 (agricultural, As, wetland, water, Ni, Cr, and forest) and Group 2 (grassland, bare land, urban, Hg, Cd, Pb, Zn, and Cu). High correlations were observed among the variables in the two groups. In the PCA biplot results, two factors were identified for the sediments of Yeongsan River basin: PC1 (Zn, Cu, Cd, Pb, Hg, urban, and bare land) and PC2 (Cr and Ni). The variables in these factors were found to intricately affect each other. Overall, statistical analyses showed that Zn, Cu, Cd, Pb, and Hg were closely related to urban areas, whereas Cr and Ni were related to geological influences, and As was associated with agriculture activities. The PCA biplot results were consistent with the CA evaluation and clearly explained the relationship between land use and heavy metals in the sediments of the Yeongsan River basin.
In conclusion, high Pb, Zn, Cu, Cd, and Hg concentrations in sediments at sites in the mid-upstream of the Yeongsan River basin were closely related to urban land use. The urban areas could serve as potential sources of anthropogenic heavy metal pollution of sediments because of domestic sewage and industrial wastewater discharged from densely populated areas and industrial complexes, respectively. The findings of this study will contribute to management policies for sediment pollution via continuous management of heavy metal pollution sources from urban areas.

Supplementary Materials

The following supporting information can be downloaded at: https://www.mdpi.com/article/10.3390/su14159444/s1, Table S1: Pollution assessment by sediment quality guidelines (SQGs) from heavy metal concentrations in sediments collected from mainstream and tributaries in the Yeongsan River basin, South Korea; Table S2: Pollution assessment by contamination factor (CF), pollution load index (PLI), and potential ecological risk index (PERI) from heavy metal concentrations in sediments collected from the mainstream and tributaries in the Yeongsan River basin, South Korea; Table S3: Principal component analysis (PCA) analysis results of heavy metals in sediments collected from the mainstream and tributaries in the Yeongsan River basin, South Korea (PC1–principal component 1, PC2–principal component 2).

Author Contributions

Conceptualization, H.J.Y., T.-W.K., B.C. and W.-P.P.; data curation, H.J.Y. and T.-W.K.; formal analysis, H.J.Y.; investigation, H.J.Y. and T.-W.K.; methodology, H.J.Y. and T.-W.K.; visualization, H.J.Y.; validation, H.J.Y.; writing—original draft, H.J.Y. and T.-W.K.; writing—review and editing, T.-W.K., B.C., D.S. and W.-P.P.; project administration, S.H.H.; resources, S.H.H.; supervision, D.S. All authors have read and agreed to the published version of the manuscript.

Funding

This study was supported by a grant from the National Institute of Environmental Research (NIER), funded by the Ministry of Environment (MOE) of the Republic of Korea (NIER-2019-03-01-013).

Institutional Review Board Statement

Not applicable.

Informed Consent Statement

Not applicable.

Data Availability Statement

The datasets are available from the corresponding author on reasonable request.

Acknowledgments

The authors thank the sediment survey team of the Yeongsan River Environment Research Center at the National Institute of Environmental Research for their assistance with sampling and analysis.

Conflicts of Interest

The authors declare that they have no competing financial interests.

References

  1. Ouyang, W.; Wang, Y.; Lin, C.; He, M.; Hao, F.; Liu, H.; Zhu, W. Heavy metal loss from agricultural watershed to aquatic system: A scientometrics review. Sci. Total Environ. 2018, 637, 208–220. [Google Scholar] [CrossRef] [PubMed]
  2. Jain, C. Metal fractionation study on bed sediments of River Yamuna, India. Water Res. 2004, 38, 569–578. [Google Scholar] [CrossRef] [PubMed]
  3. Wang, G.; Yingla, A.; Jiang, H.; Fu, Q.; Zheng, B. Modeling the source contribution of heavy metals in surficial sediment and analysis of their historical changes in the vertical sediments of a drinking water reservoir. J. Hydrol. 2015, 520, 37–51. [Google Scholar] [CrossRef]
  4. Dawson, E.; Macklin, M. Speciation of Heavy Metals in Floodplain and Flood Sediments: A Reconnaissance Survey of the Aire Valley, West Yorkshire, Great Britain. Environ. Geochem. Health 1998, 20, 67–76. [Google Scholar] [CrossRef]
  5. Karaouzas, I.; Kapetanaki, N.; Mentzafou, A.; Kanellopoulos, T.D.; Skoulikidis, N. Heavy metal contamination status in Greek surface waters: A review with application and evaluation of pollution indices. Chemosphere 2020, 263, 128192. [Google Scholar] [CrossRef]
  6. Demirak, A.; Yilmaz, F.; Tuna, A.L.; Ozdemir, N. Heavy metals in water, sediment and tissues of Leuciscus cephalus from a stream in southwestern Turkey. Chemosphere 2006, 63, 1451–1458. [Google Scholar] [CrossRef]
  7. Kumar, V.; Parihar, R.D.; Sharma, A.; Bakshi, P.; Sidhu, G.P.S.; Bali, A.S.; Karaouzas, I.; Bhardwaj, R.; Thukral, A.K.; Gyasi-Agyei, Y.; et al. Global evaluation of heavy metal content in surface water bodies: A meta-analysis using heavy metal pollution indices and multivariate statistical analyses. Chemosphere 2019, 236, 124364. [Google Scholar] [CrossRef]
  8. Farkas, A.; Erratico, C.; Viganò, L. Assessment of the environmental significance of heavy metal pollution in surficial sediments of the River Po. Chemosphere 2007, 68, 761–768. [Google Scholar] [CrossRef]
  9. Varol, M. Assessment of heavy metal contamination in sediments of the Tigris River (Turkey) using pollution indices and multivariate statistical techniques. J. Hazard. Mater. 2011, 195, 355–364. [Google Scholar] [CrossRef]
  10. Bellucci, L.G.; Frignani, M.; Paolucci, D.; Ravanelli, M. Distribution of heavy metals in sediments of the Venice Lagoon: The role of the industrial area. Sci. Total Environ. 2002, 295, 35–49. [Google Scholar] [CrossRef]
  11. Pereira, E.; Baptista-Neto, J.A.; Smith, B.J.; Mcallister, J.J. The Contribution of Heavy Metal Pollution Derived from Highway Runoff to Guanabara Bay Sediments: Rio de Janeiro/Brazil. An. Acad. Bras. Cienc. 2007, 79, 739–750. [Google Scholar] [CrossRef] [Green Version]
  12. Quinton, J.N.; Catt, J.A. Enrichment of Heavy Metals in Sediment Resulting from Soil Erosion on Agricultural Fields. Environ. Sci. Technol. 2007, 41, 3495–3500. [Google Scholar] [CrossRef]
  13. Song, Y.; Ji, J.; Mao, C.; Yang, Z.; Yuan, X.; Ayoko, G.A.; Frost, R.L. Heavy metal contamination in suspended solids of Changjiang River-environmental implications. Geoderma 2010, 159, 286–295. [Google Scholar] [CrossRef]
  14. Mohammadi, M.; Khaledi Darvishan, A.; Dinelli, E.; Bahramifar, N.; Alavi, S.J. How Does Land Use Configuration In-fluence on Sediment Heavy Metal Pollution? Comparison between Riparian Zone and Sub-Watersheds. Stoch. Environ. Res. Risk Assess. 2021, 159, 1–16. [Google Scholar] [CrossRef]
  15. Wu, P.; Yin, A.; Yang, X.; Zhang, H.; Fan, M.; Gao, C. Distribution and source identification of heavy metals in the sediments of a river flowing an urbanization gradient, Eastern China. Environ. Earth Sci. 2017, 76, 745. [Google Scholar] [CrossRef]
  16. Xia, F.; Qu, L.; Wang, T.; Luo, L.; Chen, H.; Dahlgren, R.A.; Zhang, M.; Mei, K.; Huang, H. Distribution and source analysis of heavy metal pollutants in sediments of a rapid developing urban river system. Chemosphere 2018, 207, 218–228. [Google Scholar] [CrossRef] [Green Version]
  17. Lee, K.-H.; Kang, T.-W.; Ryu, H.-S.; Hwang, S.-H.; Kim, K. Analysis of spatiotemporal variation in river water quality using clustering techniques: A case study in the Yeongsan River, Republic of Korea. Environ. Sci. Pollut. Res. 2020, 27, 29327–29340. (In Korean) [Google Scholar] [CrossRef]
  18. Oh, H.S.; Huh, I.A.; Choi, J.H. Laboratory Study of Phosphorus Fractionation in the Sediments of Yeongsan River. J. Korean Soc. Environ. Eng. 2017, 39, 519–526. (In Korean) [Google Scholar] [CrossRef]
  19. Kim, K.-S.; Jung, J.-W.; Lim, B.-J.; Cho, S.-H.; Choi, J.-H.; Song, K.-D.; Ha, D.-W.; Kim, H.-S.; Park, S.-H.; Hwang, T.-H.; et al. The Influence of Land Use on Water Quality in the Tributary of the Yeongsan River Basin. Korean J. Lomnology 2012, 45, 412–419. (In Korean) [Google Scholar] [CrossRef]
  20. Park, J.; Moon, M.; Kim, K. Analysis of Relationship between Water Quality Parameters with Land Use in Yeongsan River Basin. J. Environ. Impact Assess. 2014, 23, 19–27. (In Korean) [Google Scholar] [CrossRef] [Green Version]
  21. Song, J.J.; Kim, B.B.; Hong, S.G. Study on water quality change of Yeongsan River’s upsteam. J. Korean Soc. Environ. Technol. 2015, 16, 154–159. (In Korean) [Google Scholar]
  22. Ministry of Environment (MOE). Official Test Methods of Water Quality; MOE: Sejong, Korea, 2012. (In Korean)
  23. National Institute of Environmental Research (NIER). River and Lake Sediment Contamination Evaluation Guide Line Ministry of Environment; NIER: Incheon, Korea, 2015. (In Korean)
  24. Huh, I.A.; Kim, Y.S.; Yu, S.J.; Wong, S.; Shin, W.S.; Park, H.O.; Kim, H.J.; Kim, H.W. Development of freshwater sediment management standards for organic matters, nutrients, and metals in Korea. Environ. Sci. Pollut. Res. 2013, 21, 86–94. [Google Scholar] [CrossRef] [PubMed]
  25. Yang, H.J.; Jeong, H.J.; Bong, K.M.; Jin, D.R.; Kang, T.-W.; Ryu, H.-S.; Han, J.H.; Yang, W.J.; Jung, H.; Hwang, S.H.; et al. Organic matter and heavy metal in river sediments of southwestern coastal Korea: Spatial distributions, pollution, and ecological risk assessment. Mar. Pollut. Bull. 2020, 159, 111466. [Google Scholar] [CrossRef] [PubMed]
  26. Fairey, R.; Long, E.R.; Roberts, C.A.; Anderson, B.S.; Phillips, B.M.; Hunt, J.W.; Puckett, H.R.; Wilson, C.J. An evaluation of methods for calculating mean sediment quality guideline quotients as indicators of contamination and acute toxicity to amphipods by chemical mixtures. Environ. Toxicol. Chem. 2001, 20, 2276–2286. [Google Scholar] [CrossRef]
  27. Smith, S.L.; MacDonald, D.D.; Keenleyside, K.A.; Ingersoll, C.G.; Field, L.J. A Preliminary Evaluation of Sediment Quality Assessment Values for Freshwater Ecosystems. J. Great Lakes Res. 1996, 22, 624–638. [Google Scholar] [CrossRef]
  28. Håkanson, L. An ecological risk index for aquatic pollution control. A Sedimentol. Approach. Water Res. 1980, 14, 975–1001. [Google Scholar] [CrossRef]
  29. Tomlinson, D.L.; Wilson, J.G.; Harris, C.R.; Jeffrey, D.W. Problems in the assessment of heavy-metal levels in estuaries and the formation of a pollution index. Helgoländer Meeresunters. 1980, 33, 566–575. [Google Scholar] [CrossRef] [Green Version]
  30. National Institute of Environmental Research (NIER). Baseline Concentrations of Heavy Metals in River Sediments in Korea; NIER: Incheon, Korea, 2011. (In Korean)
  31. Varol, M.; Şen, B. Assessment of nutrient and heavy metal contamination in surface water and sediments of the upper Tigris River, Turkey. CATENA 2012, 92, 1–10. [Google Scholar] [CrossRef]
  32. Zhu, H.-N.; Yuan, X.-Z.; Zeng, G.-M.; Jiang, M.; Liang, J.; Zhang, C.; Yin, J.; Huang, H.-J.; Liu, Z.-F.; Jiang, H.-W. Ecological risk assessment of heavy metals in sediments of Xiawan Port based on modified potential ecological risk index. Trans. Nonferrous Met. Soc. China 2012, 22, 1470–1477. [Google Scholar] [CrossRef]
  33. Yi, Y.; Yang, Z.; Zhang, S. Ecological risk assessment of heavy metals in sediment and human health risk assessment of heavy metals in fishes in the middle and lower reaches of the Yangtze River basin. Environ. Pollut. 2011, 159, 2575–2585. [Google Scholar] [CrossRef]
  34. Pearson, K. Note on regression and inheritance in the case of two parents. Proc. R. Soc. Lond. 1895, 58, 240–242. [Google Scholar] [CrossRef]
  35. Rodgers, J.L.; Nicewander, W.A. Thirteen Ways to Look at the Correlation Coefficient. Am. Stat. 1988, 42, 59–66. [Google Scholar] [CrossRef]
  36. Pearson, K. On lines and planes of closest fit to systems of points in space. Lond. Edinb. Dublin Philos. Mag. J. Sci. 1901, 2, 559–572. [Google Scholar] [CrossRef] [Green Version]
  37. Cai, L.; Xu, Z.; Ren, M.; Guo, Q.; Hu, X.; Hu, G.; Wan, H.; Peng, P. Source identification of eight hazardous heavy metals in agricultural soils of Huizhou, Guangdong Province, China. Ecotoxicol. Environ. Saf. 2012, 78, 2–8. [Google Scholar] [CrossRef]
  38. Huang, B.; Zhao, Y.; Shi, X.; Yu, D.; Zhao, Y.; Sun, W.; Wang, H.; Öborn, I. Source identification and spatial variability of nitrogen, phosphorus, and selected heavy metals in surface water and sediment in the riverine systems of a peri-urban interface. J. Environ. Sci. Health Part A 2007, 42, 371–380. [Google Scholar] [CrossRef]
  39. Lai, T.M.; Lee, W.; Hur, J.; Kim, Y.; Huh, I.-A.; Shin, H.-S.; Kim, C.-K.; Lee, J.-H. Influence of Sediment Grain Size and Land Use on the Distributions of Heavy Metals in Sediments of the Han River Basin in Korea and the Assessment of Anthropogenic Pollution. Water Air Soil Pollut. 2013, 224, 1–12. [Google Scholar] [CrossRef]
  40. Liu, A.; Duodu, G.; Goonetilleke, A.; Ayoko, G. Influence of land use configurations on river sediment pollution. Environ. Pollut. 2017, 229, 639–646. [Google Scholar] [CrossRef]
  41. Gabriel, K.R. The biplot graphic display of matrices with application to principal component analysis. Biometrika 1971, 58, 453–467. [Google Scholar] [CrossRef]
  42. Shin, S.E.; Youn, S.T.; Koh, Y.K.; Oh, K.H. The Geochemical Characteristics and Environmental Changes of Surface Sediments in Yeongsan River Area. J. Korean Geomor. Assoc. 2015, 22, 31–42. (In Korean) [Google Scholar]
  43. Lee, J.-B.; Hong, S.-H.; Kim, N.-H.; Huh, I.-A.; Huh, Y.-J.; Khan, J.-B.; Oh, D.-Y.; Kim, K.-Y.; Lee, Y.-J.; Lee, S.-H.; et al. Measurement of metals in sediment of the Geum-River and their correlation. Anal. Sci. Technol. 2014, 27, 11–21. [Google Scholar] [CrossRef] [Green Version]
  44. Kim, S.; Yang, D.S.; Kim, Y.S. Distribution of metal contamination and grain size in the sediments of Nakdong River, Korea. Environ. Monit. Assess. 2020, 192, 1–15. [Google Scholar] [CrossRef]
  45. Mao, L.; Liu, L.; Yan, N.; Li, F.; Tao, H.; Ye, H.; Wen, H. Factors controlling the accumulation and ecological risk of trace metal(loid)s in river sediments in agricultural field. Chemosphere 2019, 243, 125359. [Google Scholar] [CrossRef]
  46. Xiao, H.; Shahab, A.; Li, J.; Xi, B.; Sun, X.; He, H.; Yu, G. Distribution, ecological risk assessment and source identification of heavy metals in surface sediments of Huixian karst wetland, China. Ecotoxicol. Environ. Saf. 2019, 185, 109700. [Google Scholar] [CrossRef] [PubMed]
  47. Xiao, H.; Shahab, A.; Xi, B.; Chang, Q.; You, S.; Li, J.; Sun, X.; Huang, H.; Li, X. Heavy metal pollution, ecological risk, spatial distribution, and source identification in sediments of the Lijiang River, China. Environ. Pollut. 2020, 269, 116189. [Google Scholar] [CrossRef] [PubMed]
  48. Yang, H.J.; Bong, K.M.; Kang, T.-W.; Hwang, S.H.; Na, E.H. Assessing heavy metals in surface sediments of the Seomjin River Basin, South Korea, by statistical and geochemical analysis. Chemosphere 2021, 284, 131400. [Google Scholar] [CrossRef] [PubMed]
  49. Sekabira, K.; Origa, H.O.; Basamba, T.A.; Mutumba, G.; Kakudidi, E. Assessment of heavy metal pollution in the urban stream sediments and its tributaries. Int. J. Environ. Sci. Technol. 2010, 7, 435–446. [Google Scholar] [CrossRef] [Green Version]
  50. Sakan, S.M.; Đorđević, D.S.; Manojlović, D.D.; Predrag, P.S. Assessment of heavy metal pollutants accumulation in the Tisza river sediments. J. Environ. Manag. 2009, 90, 3382–3390. [Google Scholar] [CrossRef] [PubMed]
  51. Wu, S.-S.; Yang, H.; Guo, F.; Han, R.-M. Spatial patterns and origins of heavy metals in Sheyang River catchment in Jiangsu, China based on geographically weighted regression. Sci. Total Environ. 2017, 580, 1518–1529. [Google Scholar] [CrossRef]
  52. Xia, X.; Chen, X.; Liu, R.; Liu, H. Heavy metals in urban soils with various types of land use in Beijing, China. J. Hazard. Mater. 2011, 186, 2043–2050. [Google Scholar] [CrossRef]
  53. Facchinelli, A.; Sacchi, E.; Mallen, L. Multivariate statistical and GIS-based approach to identify heavy metal sources in soils. Environ. Pollut. 2001, 114, 313–324. [Google Scholar] [CrossRef]
  54. Kober, B.; Wessels, M.; Bollhoefer, A.; Mangini, A. Pb isotopes in sediments of Lake Constance, Central Europe constrain the heavy metal pathways and the pollution history of the catchment, the lake and the regional atmosphere. Geochim. Cosmochim. Acta 1999, 63, 1293–1303. [Google Scholar] [CrossRef]
  55. Davis, H.T.; Aelion, C.M.; McDermott, S.; Lawson, A.B. Identifying natural and anthropogenic sources of metals in urban and rural soils using GIS-based data, PCA, and spatial interpolation. Environ. Pollut. 2009, 157, 2378–2385. [Google Scholar] [CrossRef] [Green Version]
  56. Li, X.; Poon, C.-S.; Liu, P.S. Heavy metal contamination of urban soils and street dusts in Hong Kong. Appl. Geochem. 2001, 16, 1361–1368. [Google Scholar] [CrossRef]
  57. Pinedo-Hernández, J.; Marrugo-Negrete, J.; Díez, S. Speciation and bioavailability of mercury in sediments impacted by gold mining in Colombia. Chemosphere 2015, 119, 1289–1295. [Google Scholar] [CrossRef]
  58. Ke, X.; Gui, S.; Huang, H.; Zhang, H.; Wang, C.; Guo, W. Ecological risk assessment and source identification for heavy metals in surface sediment from the Liaohe River protected area, China. Chemosphere 2017, 175, 473–481. [Google Scholar] [CrossRef]
  59. Kulikova, T.; Hiller, E.; Jurkovič, Ľ.; Filová, L.; Šottník, P.; Lacina, P. Total mercury, chromium, nickel and other trace chemical element contents in soils at an old cinnabar mine site (Merník, Slovakia): Anthropogenic versus natural sources of soil contamination. Environ. Monit. Assess. 2019, 191, 263. [Google Scholar] [CrossRef]
  60. Jiang, Q.Q.; Singh, B.R. Effect of different forms and sources of arsenic on crop yield and arsenic concentration. Water Air Soil Pollut. 1994, 74, 321–343. [Google Scholar] [CrossRef]
  61. Liu, X.; Zhang, W.; Hu, Y.; Hu, E.; Xie, X.; Wang, L.; Cheng, H. Arsenic pollution of agricultural soils by concentrated animal feeding operations (CAFOs). Chemosphere 2015, 119, 273–281. [Google Scholar] [CrossRef]
Figure 1. (a) Locations of the sampling sites of sediments and point sources (agricultural industrial complex, industrial complex, and sewage treatment plant) in the Yeongsan River basin, South Korea, including its mainstream (blue lines) and tributaries (green lines). The black arrows indicate the direction of the river flow. (b) Land use of the study area and site categories (Section 1: YS1–YS5, Section 2: YS6–YS12, Section 3: YS13–YS19, and Section 4: YS20–YS25) considering land use characteristics.
Sustainability 14 09444 g001
Figure 2. Distribution of heavy metal concentrations in sediments collected from mainstream and tributaries in the Yeongsan River basin, South Korea.
Sustainability 14 09444 g002
Figure 3. Box and whisker plots showing the distribution of heavy metal concentrations in sediments by section in the Yeongsan River basin, South Korea. Box and whisker plots indicate the median (horizontal line inside the box), mean (‘X’ in the box), the IQR (interquartile range, rectangular box), 1.5 IQR (a straight line outside the box), and outlier (points outside 1.5 IQR).
Sustainability 14 09444 g003
Figure 4. Spatial distribution of (a) land use and pollution assessment by (b) sediment quality guidelines (SQGs), (c) pollution load index (PLI), and (d) potential ecological risk index (PERI) based on heavy metal concentrations in sediments collected from the mainstream and tributaries in the Yeongsan River basin, South Korea.
Sustainability 14 09444 g004
Figure 5. Relationships between land use and heavy metals in sediments collected from the mainstream and tributaries in the Yeongsan River basin, South Korea, through (a) correlation analysis (CA) and (b) principal component analysis (PCA) biplot. PC1−principal component 1, PC2−principal component 2.
Sustainability 14 09444 g005
Table 1. Sediment quality guidelines in South Korea for pollution assessment of heavy metals in river sediments.
Heavy Metal
(mg/kg)
Class
I aII bIII cIV d
Pb≤59≤154≤459˃459
Zn≤363≤1170≤13,000˃13,000
Cu≤48≤228≤1890˃1890
Cd≤0.4≤1.87≤6.09˃6.09
Hg≤0.07≤0.67≤2.14˃2.14
As≤15≤44.7≤92.1˃92.1
Cr≤112≤224≤991˃991
Ni≤40≤87.5≤330˃330
a Status of sediments with almost no possibility of toxicity. b Status of sediments with possible toxicity. c Status of sediments with possibility of relatively high toxicity. d Status of sediments with very high possibility of toxicity.
Table 2. Heavy metal concentrations (mg/kg) in sediments collected from the Yeongsan River basin, South Korea and in other previous studies.
Country/RegionHeavy MetalReference
PbZnCuCdHgAsCrNi
South Korea
Yeongsan River36.7 ± 10.4
(22.7–69.2)
223.8 ± 105.0
(86.1–534.5)
37.2 ± 16.3
(14.0–69.5)
0.31 ± 0.12
(0.10–0.56)
0.065 ± 0.037
(0.016–0.177)
8.1 ± 1.7
(5.6–13.5)
54.6 ± 11.4
(28.2–75.4)
23.3 ± 4.0
(13.9–31.8)
This study
Yeongsan River25.3 ± 7.7
(14–40)
76.8 ± 48.7
(22–167)
11.9 ± 7.8
(2–26)
0.03 ± 0.04
(0.00–0.09)
NA aNA28.1 ± 27.4
(2–72)
14.6 ± 11.5
(3–35)
Shin et al.
(2015) [42]
Han River31.6 ± 19.4
(17.1–106.2)
150.4 ± 174.7
(52.1–690.7)
25.9 ± 33.6
(5.1–158.5)
0.21 ± 0.28
(0.05–1.32)
0.06 ± 0.09
(0.01–0.43)
5.9 ± 3.5
(1.4–15.1)
60.5 ± 27.6
(27.3–146.8)
26.1 ± 12.2
(8.8–57.5)
Lai et al.
(2013) [39]
Nakdong River24.6
(14.8–35.5)
120.2
(49.0–217.0)
16.9
(8.5–43.3)
0.38
(0.12–0.72)
NANA48.5
(11.6–83.6)
16.1
(4.8–32.4)
Kim et al.
(2020) [44]
Geum River- b
(8.3–22.4)
-
(29.7–139.2)
-
(5.3–33.4)
-
(0.05–0.43)
-
(0.006–0.587)
-
(0.9–18.4)
-
(19.6–78.6)
-
(6.4–20.9)
Lee et al.
(2014) [43]
China
Lijiang River42.8 ± 4.12
(17.8–171.7)
129.3 ± 6.22
(53.6–258.0)
31.7 ± 2.61
(9.38–102.7)
0.97 ± 0.08
(0.16–4.41)
0.39 ± 0.05
(0.08–2.13)
18.3 ± 0.61
(9.97–36.4)
43.6 ± 1.85
(24.3–95.3)
22.9 ± 0.73
(11.6–37.1)
Xiao et al.
(2021) [47]
Yangtze River35.8 ± 16.5
(15.3–81.8)
116.5 ± 63.4
(63.1–535.1)
30.7 ± 16.9
(15.6–145.6)
0.42 ± 0.14
(0.12–0.77)
NA11.0 ± 4.85
(2.75–28.1)
43.5 ± 6.8
(31.5–59.9)
33.4 ± 5.40
(18.8–42.7)
Mao et al.
(2020) [45]
Huixian wetland51.3 ± 10.9
(31.1–97.0)
77.1 ± 15.7
(46.7–119.3)
31.1 ± 5.23
(19.5–53.6)
0.445 ± 0.203
(0.052–1.292)
0.508 ± 0.178
(0.295–1.808)
21.4 ± 7.39
(5.96–54.2)
114.2 ± 30.1
(32.2–285.7)
35.9 ± 9.13
(16.0–58.9)
Xiao et al.
(2019) [46]
Qinhuai River33.4
(17.9–48.6)
149.0
(48.6–403.4)
44.7
(21.9–94.9)
0.61
(0.08–2.84)
0.25
(0.04–1.11)
10.8
(3.82–27.7)
79.9
(56.1–111.7)
34.6
(23.2–44.4)
Wu et al.
(2017a) [15]
a Not analyzed. b Unconfirmed.
Publisher’s Note: MDPI stays neutral with regard to jurisdictional claims in published maps and institutional affiliations.

