Article

Structural Evolution and Sustainability of Agricultural Trade between China and Countries along the “Belt and Road”

College of Economics and Management, Northeast Forestry University, Harbin 150040, China
*
Author to whom correspondence should be addressed.
Sustainability 2022, 14(15), 9512; https://doi.org/10.3390/su14159512
Submission received: 27 June 2022 / Revised: 29 July 2022 / Accepted: 30 July 2022 / Published: 3 August 2022
(This article belongs to the Special Issue Sustainable Agricultural Development Economics and Policy)

Abstract

:
Enhancing trade in agricultural products between China and countries along the “Belt and Road” (B&R) will help strengthen China’s food security and promote global, sustainable economic development. Based on the agricultural trade data between China and B&R countries from 2001 to 2019, we used the TII index, the HHI index, and the social network analysis method to calculate the trade structure of agricultural products between China and B&R countries, in terms of plane structure and spatial network structure, and analyzed the influencing factors of their spatial network structure. The results show that China’s agricultural trade with B&R countries is highly concentrated in terms of regions and types, the import trade is decentralized, while the export trade is concentrated, and the regions with high trade intensity are mainly concentrated in the countries in close proximity. China’s agricultural trade network with B&R countries has become increasingly close, and China has a significant presence in trade networks. The trade network shows four major segments, and the internal and external trade of each segment has become increasingly close. Water resources, geographical location, transportation, trade agreements, and trade structure are the main influencing factors in the trade network between China and B&R countries. Our findings provide useful insights for informed decision-making in the development of international agricultural sustainable cooperation strategies.

1. Introduction

Food security is the foundation of national development. Under the rigid constraints of natural resources, the establishment of the carbon peaking and carbon neutrality goals has brought new challenges to China’s domestic agricultural production. The global spread of COVID-19 [1], the Russia–Ukraine conflict, and climate change have exacerbated agricultural supply risks. How to ensure the sustainable trade of Chinese and global agricultural products in the surging world economic tide has become a major issue that both domestic and foreign practitioners and academics must reconsider.
Currently, the impact of world agricultural trade on global food security has risen from 9% to 17%, and the food exports of many developed agricultural countries have made up for the food shortages of most countries [2]. Integrated planning and the full utilization of both domestic and international markets and resources to enable the sustainable production and consumption of global agricultural products is the only choice for ensuring food security in China and globally [3]. In recent years, the No. 1 document of the Central Government has repeatedly mentioned the strengthening of international cooperation in agriculture in B&R countries, expanding diversified import channels, and expanding the exports of superior agricultural products. In 2022, the No. 1 central document emphasized the optimization of the agricultural product trade layout, and the diversification strategy of agricultural product import. At present, the focus of China’s agricultural imports has shifted to B&R countries [4], but to achieve coordinated and sustainable development, fundamentally speaking, this still depends on whether the structure of agricultural trade between China and the B&R countries is reasonable. In particular, the structuring of the agricultural trade relationship to be based on comparative advantage, and the empirical investigation of related issues, are of great significance for ensuring the effective supply of agricultural products in China and the world.
The current research on agricultural trade between China and B&R countries has yielded many results, but it still needs to be further expanded and improved. We examined the literature and found that in terms of cooperation objects, this mostly involves the analysis of China and some of the countries or regions along the B&R; this lacks a holistic analysis of the region, which mainly includes China and ASEAN [5], China and Central Asia [6,7], China and South Asia [8], China and the “21st Century Maritime Silk Road” [9,10], China and Russia [11,12], China and Central and Eastern Europe [13,14], China and Southeast Asia [15], China and the countries along the Silk Road Economic Belt [16,17,18], China and Africa [19], and China and Ukraine [20].
In terms of trade categories, they are mostly focused on a certain type of agricultural trade, and they lack an overall exploration of agricultural trade. This mainly includes dairy products [21], corn [22], aquatic products [23,24], apples [25], grains [26,27,28,29], and fruits [30]. In terms of analyzing data, many studies only explore the trade network structure under cross-sectional data at certain time points, which cannot reflect the dynamic evolution of trade in a specific time context. Wei (2019) analyzed the structure, association characteristics, and strategy choices of agricultural trade networks between China and B&R countries, using cross-sectional data in 2017 [31]. Zhan (2019) analyzed the competitiveness and complementarity of agricultural trade networks of B&R countries in 2007 and 2015 [32]. Su (2019) analyzed the structure and cooperation trends of agricultural trade networks between China and B&R countries in 2012 and 2016 [33].
Although some scholars have explored the structure of agricultural trade between China and B&R countries from a holistic perspective over the past two years, most of them have adopted an index approach to explore the structure of flat trade and to analyze its influencing factors. For example, Yang et al. (2021) analyzed the evolution of agricultural trade characteristics between China and B&R countries [34]. Although all of the agricultural products of the B&R countries were studied, the countries and agricultural products within the B&R countries were not discussed separately, and all the countries and agricultural products along B&R countries were treated as a single whole, without discussing the internal structure reflecting the trade. Liu et al. (2021) explored the countries of China’s agricultural trade with B&R countries in 2018, using descriptive analysis, but they took a static trade situation of one year as the sample of the study, they did not analyze the evolution of trade dynamically from the time series; they only used a descriptive analysis of plane structure, and they did not use index and spatial analysis methods [35]. Sun (2021) used the index method to investigate the intra-industry trade of agricultural products and its influencing factors between China and B&R countries, which included all B&R countries and all types of agricultural products, but they only explored the flat structure. While the definition of agricultural products in Sun’s paper was based on the World Trade Organization (WTO) Agricultural Agreement + Fishery Products, this paper uses the United Nations International Trade Standards Classification, with its different focuses [36].
This paper explores the structural evolution of agricultural trade between China and B&R countries, from both a planar and a spatial perspective. The study differs from the existing literature in four ways. First, instead of limiting the scope to certain countries or certain agricultural products, all countries and agricultural products along the B&R countries are used as samples to classify and compare the agricultural trade relations between China and B&R countries, which is conducive to grasping the current situation of trade cooperation in terms of levels and varieties within the overall sample, and exploring the directions for sustainable cooperation. Second, the study is not limited to a single point in time; the data chain covers four time points, namely, China’s accession to the WTO, the global financial crisis, the introduction of the “Belt and Road” initiative, and the latest data; it explores the dynamic evolution of trade relations between China and B&R countries. It is useful for China and B&R countries to forecast the future direction of sustainable cooperation based on past bilateral trade dynamics in the current situation of increased world uncertainty. Third, the literature has used descriptive analysis, index analysis, and social network analysis separately, but the comprehensive planar analysis can highlight the accuracy of trade data and the continuity of the time series, while the spatial analysis can better reflect the relationship between countries, between countries and small groups, and between countries and the whole. Combining the advantages of the two analysis methods, we choose to adopt the dual perspective of planar and spatial research. Fourth, drawing on the research techniques of Li (2017) [37], the competition index, CS , was improved and the competitive advantage index, CN , was constructed, which provides a methodological improvement for measuring the spatial analysis of multinational cooperation network development and is conducive to providing analytical tools for scholars studying trade cooperation.

2. Materials and Methods

2.1. Research Methods

To quantify the planar and spatial network structure of agricultural trade between China and B&R countries, we used a combination of descriptive statistics and the index method to quantify the planar structure [38,39,40]. The trade index was selected as the trade intensity index and the export concentration index. We used the social network analysis method [29,31,36,37,41,42] to quantify the spatial network structure.

2.1.1. Planar Structure Quantification Method

1. Trade Intensity Index (TII). TII index was proposed by Brown (1949) [43] and was later improved and refined by Kojima (1964) [44]. TII index measures the ratio of a country’s exports to a trading partner country, to that country’s total exports to that trading partner country’s total imports, as a share of total world imports; this is often used in inter-country trade interdependence analysis, with the following formula.
TII ab = X ab / X a M b / M w
In the formula, a , b , w represent country a , b , and the world market, respectively, TII ab represents the trade combination degree of country a and b , X ab represents the export volume of country a to country b , X a represents the total export volume of country a , M b represents the total import volume of country b , and M w represents the total import volume of country. When TII ab > 1 , this indicates that a and b have a close trade relationship. When TII ab < 1 , it indicates that the trade relationship between a and b is loose.
2. Export Concentration Index ( HHI ). HHI index, also known as the Hirschman index, is used to measure the degree of concentration of a country or region in terms of the types of products exported [45]. The formula is as follows.
HHI = k = 1 n ( X k / X ) 2
In the formula, X k is the export volume of k products of the country, and X is its total export volume. The value range of HHI is [ 1 n , 1 ] . The smaller the value is, the more fragmented the country’s export product structure is; likewise, the larger the value, the more concentrated the export product structure.

2.1.2. Quantification Method of Spatial Structure

1. Origin of social network approach. The application of social network analysis in economics is mainly inspired by the sociologist Granovetter (1985) [46], who argues that the key to many high-transaction-cost behaviors in the real economy that are still traded through the market is that both buyers and sellers are embedded in a long-term network of business relationships, i.e., both buyers and sellers are unwilling to lose the trust relationship they have built up in mutual transactions, and the whole system. The whole system is constantly adaptive through mutual coordination and information exchange. This means that the real economic system has the essential characteristics of a social network. After that, social network analysis has gradually received the attention of economists and has been widely used in many fields such as industrial economics, finance, and international trade. With the development of economic globalization, the close economic ties between countries make global trade relations an organic whole, and the growing international trade is becoming the key to shape the global economic and political landscape. The adoption of social network analysis method to study the characteristic laws of international trade system has become an emerging research direction.
2. Standard construction of social network methods. The social network analysis method regards trading countries as points, and the resulting trade relations as connecting lines, and analyzes the structural characteristics of trade networks according to the connections between nodes in the network. The two–two relationship conditions are different and can be constructed into different trade networks; according to the import–export and competitive advantage of a two–two relationship, two different trade relationship networks can be constructed, so as to reflect the trade prospects between trading countries more comprehensively, where the two–two import-export relationship is reflected by the bilateral trade volume. For the competitive advantage relationship, based on the method of Li Jing and Chen Ni et al. (2017) [29], the trade competition index is improved into the trade competition difference index based on the comparative advantage theory, which is the competitive advantage index. The original trade competition index CS formula is as follows.
CS = 1 1 2   | a i n a j n |
where i and j represent countries, n represents industries, a i n represents the comparative advantage of industry n in country i , and a j n represents the comparative advantage of industry n in country j . The closer the comparative advantage of two countries, the smaller 1 2   | a i n a j n | becomes, and the larger the CS . The improvement in this paper is to consider industry n as a single industry, and the comparative advantage is specified as the NRCA index, as in Equation (4).
CN = 1 1 2 | NRCA i n NRCA j n |
RCA ij = X i j / X tj X i w / X tw
NRCA ij = RCA ij 1 RCA ij + 1
where: X i j represents the export value of i products of Country j , X tj represents the export volume of products of Country j , X i w represents the export value of i products in the world, and X tw stands for the world export of goods.
According to Formulas (5) and (6), when RCA ij = ±∞, NRCA ij = 1 ; when RCA ij = 0 , NRCA ij = 1 , and NRCA ij [ 1 , 1 ] , it can be deduced that 2 NRCA i n NRCA j n 2 . We obtain 0 1 1 2 | NRCA i n NRCA j n | 1 , and CN [ 0 , 1 ] . Therefore, if NRCA is taken as an independent variable, the domain of CN index is [−1,1] and the range is [0,1]. According to the theory of comparative advantage put forward by Ricardo, international trade is based on the relative difference in production technology and the resulting relative cost of production. Every country should concentrate on producing and exporting products with “comparative advantage” and importing products with “comparative disadvantage”. The NRCA index represents the trade competitiveness index of a country. One country exports products with relative advantages, while the other exports products with relative disadvantages. The absolute value of the NRCA index is the convergence point of the interests of the trade between the two countries, namely, the competitive advantage. According to Formula (4), if the set | NRCA i n NRCA j n | A , there are comparative advantages for trade between the two countries, so that 1 1 2 | NRCA i n NRCA j n | 1 1 2 A , launch CN 1 1 2 A , | NRCA i n NRCA j n | A set up, which sets up CN 1 1 2 A , and the two countries have the competitive advantage.
3. Analysis of the density of trade networks ( Dn ). Dn Trade network density reflects the sparseness of trade relationships between countries.
Dn = L / [ N × ( N 1 ) ]
In the formula, N is the number of countries in the trade network, where the number of countries in that trade network that meet the criteria is L . The value range of Dn is [ 0 , 1 ] .
The larger the Dn , the greater the number of important trade relationships in the network and the higher the trade density.
4. Analysis of the centrality of trade networks. De is the relative degree centrality, which measures a country’s position and role in the overall network. NC is the relative degree centrality index, which measures the centrality of the entire network.
De = n / ( N 1 )
NC = i = 1 M ( Max ( De ) De i )   /   ( M 2 )
In the formula, n denotes the number of countries in network trade with which a country has significant trade relations, N denotes the maximum possible number of directly connected countries, and M denotes the number of countries in the trade network. The value range of De is [ 0 , 1 ] . The larger the De , the more central a country is in the network, the more “influence” it has in the network, and the more it can influence other countries. The value range of NC is [ 0 , 1 ] . The larger the NC , the greater the degree to which the network is built around a point or points in the network, and the more concentrated the trade.
5. Block model analysis. Block model analysis is a network location analysis model proposed by White et al. (1976) [47]. According to the block model theory, using the CONCOR method in Ucinet 6, a trade network can be divided into several plates to reveal the trade relations between the inside and the outside of the plates, revealing the roles and functions of each economic segment and its member countries in international trade. In this paper, referring to the classification method of Li Jing et al. (2017) [37], the economic plates are classified into four major categories. One is the internal type, if the plate has many internal relationships and few or no external relationships; two is the outward type, if the plate has few or no internal relationships and many external relationships; three is the eclectic type, if there are many internal relationships and also many external relationships; and four is the isolated type, if there are few or no both external and internal relationships.

2.1.3. Analysis Methods of Spatial Network Influence Factors

After analyzing the characteristics of the spatial network of agricultural trade, it is necessary to analyze what factors affect the spatial network of agricultural trade between China and B&R countries. In order to avoid the problems of multicollinearity and spurious regression in social network analysis, the study combines QAP correlation analysis and QAP regression analysis. These analyses were based on the research methods of Liu (2007) [48], Li (2014) [49], and Ma (2016) [42]. The framework for analyzing the occurrence of agricultural trade in a country in this paper consists of three parts: agricultural production—transportation of agricultural products—intercountry trade. In the agricultural production stage, the main factors affecting agricultural production are arable land, water, and seeds. The main influencing factors in the transportation stage are distance and means of transportation, and the main influencing factors in the trade stage are economic distance between two countries, cultural differences, trade structure, and trade agreements. Combining the above analysis and referring to the existing research results, 10 indicators are selected to characterize the corresponding influencing factors [31,50,51,52,53,54,55].
1. Agricultural resource endowment: We use the absolute value matrix of the difference in per capita water resources (PCWR), the absolute value matrix of the difference in per capita arable land area (PCLA), and the absolute value matrix of the difference in the share of investment in scientific research in each country (SCI), to represent the effects of water, arable land, and seeds, respectively.
2. Agricultural product transportation: We consider whether the two countries are bordering each other to indicate the trade distance. If the two countries are bordering, it will be recorded as 1, otherwise it will be 0, for constructing the distance matrix (DIS). Agricultural products belong to the large volume of low-value goods; the two countries trade in order to save costs, and generally use railroad or waterway transportation. We adopt the absolute value of the difference between the railroad length of each country matrix (TRA), indicating the convenience of transportation in each country.
3. Trading between two countries: The economic distance between countries will affect agricultural trade. We combine two ways of representing economic distance in the existing literature, namely, the absolute value of the difference between the total economic output value of each country (DGDP), and the economic distance matrix (DE) of two countries. The formula for calculating the economic distance between two countries in the DE matrix is: DE ij = ( PGDP i PGDP j ) 2 GDP i GDP j , where DE ij denotes the economic distance between country i and country j , and PGDP and GDP are the GDP per capita and GDP, respectively. The trade agreement facilitates international trade between the two countries and is recorded as 1 if both countries are members of the trade agreement; otherwise, it is 0. The trade agreement matrix (TA) is constructed. As the cultural factor, language is the tool of communication between two countries. If an official language is used in both countries, it is recorded as 1; otherwise, it is 0. The cultural matrix (CUL) is constructed. For trade structure, this paper uses the share of an agricultural export in a country’s total trade to represent the trade structure and to construct the trade structure matrix (IS). F is used to represent the trade network of US $100 million between China and B&R countries in 2019, and then the model is constructed as follows:
F = f ( PCWR ,   PCLA ,   SCI ,   DIS ,   TRA ,   DGDP ,   DE ,   TA ,   CUL ,   IS )
In the formula, the GDP, population, scientific research expenditure ratio, water resources, arable land resources, and railroad length of each country are obtained from the World Bank database, trade agreements and official languages are obtained from the official websites of each country, and geographical distances are obtained from Google Maps.

2.2. Description of Study Subjects and Data

2.2.1. Definition of the Research Area

Since the “Belt and Road” is an open international economic cooperation region, the academic community has not precisely defined the distribution range. This paper refers to the definition methods of scholars [22,26], and in view of the availability of trade data, the B&R countries are divided into six regions and 60 countries. The specific regions are: ① Mongolia and Russia; ② Central Asia, including Kazakhstan, Kyrgyzstan, Tajikistan, Uzbekistan, and Turkmenistan; ③ Southeast Asia, including Vietnam, Laos, Cambodia, Thailand, Malaysia, Singapore, Indonesia, Brunei, the Philippines, Myanmar, and Timor-Leste; ④ South Asia, including India, Pakistan, Bangladesh, Afghanistan, and Nepal; ⑤ Western Asia and the Middle East, including Turkey, Iran, Syria, Iraq, Saudi Arabia, Qatar, Bahrain, Kuwait, Lebanon, Oman, Yemen, Jordan, Israel, Palestine, Armenia, Georgia, Azerbaijan, and Egypt; ⑥ Central and Eastern Europe, including Poland, the Czech Republic, Slovakia, Hungary, Slovenia, Croatia, Romania, Bulgaria, Serbia, Montenegro, Bosnia and Herzegovina, Albania, Estonia, Lithuania, Latvia, and Ukraine.

2.2.2. Agricultural Product Scoping and Data Sources

According to the United Nations Standard International Trade Classification (SITC Rev.3), the definition of agricultural products includes four categories and 22 chapters of agricultural products. The four categories of agricultural products are 0, 1, 2, and 4. Category 0 is food and live things, including 10 chapters; category 1 is beverages and tobacco, including two chapters of agricultural products; category 2 is non-edible raw materials (except fuel), including seven chapters of agricultural products, except 27 and 28; and category 4 is animal and vegetable oils, and fats and waxes, including three chapters of agricultural products. In order to study the change of trade structure after China’s accession to the WTO, this paper selects the data related to China’s agricultural trade with B&R countries from 2001 to 2019 for analysis, and the data are obtained from the UN COMTRADE database.

3. Results

3.1. Planar Structure Analysis

3.1.1. Trade Type Structure

According to Table 1, the import and export of agricultural products categories between China and B&R countries are highly concentrated. Agricultural products are classified using SITC into 22 chapters, of which the first 10 chapters account for more than 80% of the total proportion of trade, so that more than 80% of the total trade is concentrated in 45% of the agricultural product categories. Among them, from the time series, the share of China’s agricultural products’ import categories showed a decentralized trend, decreasing from 94.94% in 2009 to 90.37% in 2019, while China’s agricultural products export categories showed a relatively concentrated trend, increasing from 82.54% in 2001 to 90.02% in 2019. In terms of specific types of agricultural products, China’s agricultural imports to B&R countries are more evenly concentrated into five categories: 02 (dairy products and poultry eggs), 23 (crude rubber), 05 (vegetables and fruits), 42 (fixed vegetable fats and oils), and 03 (fish, crustaceans, mollusks and aquatic invertebrates, and their products), while China’s exports to B&R countries are highly concentrated into two categories of agricultural products: 05 (vegetables and fruits) and 03 (fish, crustaceans, mollusks, and aquatic invertebrates and their products), with five products accounting for approximately 45% of the total in recent years.

3.1.2. Trade Region Structure

According to Table 2, China’s agricultural trade with B&R countries is highly concentrated, with imports tending to be decentralized, and exports tending to be concentrated. In terms of the top 10 import and export trade shares overall, China’s agricultural imports from B&R countries fell from 93.78% in 2001 to 89.68% in 2019, indicating that the effect of China’s diversified import strategy has emerged, while China’s agricultural exports to B&R countries rose from 66.51% in 2001 to 78.76% in 2019, and have been concentrated overall. Specifically, from the top 10 countries in import and export trade, 8 of them rank in the top 10 countries for both import and export, namely, Thailand, Indonesia, Russia, Vietnam, Malaysia, India, the Philippines, and Myanmar, indicating that China has close trade ties in agricultural products with B&R countries, for both importing and exporting. From the perspective of individual import and export trade countries, the ranking of China’s agricultural trade with B&R countries has almost always tended to stabilize, with Thailand, Indonesia, and Russia holding the top three in the import ranking, and the top three in the export ranking being Vietnam, Thailand, and Malaysia.

3.1.3. Trade Intensity Structure

In order to analyze the structure of agricultural trade intensity between China and B&R countries as a whole, this paper divides B&R countries into six regions. As shown in Table 3, trade intensity is greater in regions where China is close to B&R countries, such as Mongolia and Russia, Southeast Asia, and Central Asia, which border China and are ranked in the top three in terms of trade intensity. From the general trend, China’s trade intensity with B&R countries tends to disperse, among which China’s trade intensity with Mongolia and Russia tends to weaken, and its trade intensity with Central Asia, Southeast Asia, and South Asia increases, while the trade intensity of B&R countries with China tends to strengthen slightly, but remains stable overall. From the comparison of trade intensity between China to B&R countries and B&R countries to China, the overall trade intensity of China to B&R countries is higher than the trade intensity of B&R countries to China, indicating that China is more dependent on B&R countries, especially neighboring countries, while B&R countries are less dependent on China’s trade.

3.1.4. Trade Concentration Structure

According to Figure 1, the concentration of China’s import trade to B&R countries has a tendency to decrease, while the concentration of the export trade has a tendency to increase. In terms of agricultural trade types, the concentration of agricultural import types from China to B&R countries tends to decline, from 0.39 in 2001 to 0.33 in 2019, while the concentration of export types from China to B&R countries tends to rise, from 0.35 in 2001 to 0.49 in 2019. In terms of agricultural trade regions, the regional concentration of China’s imports to B&R countries tends to decline in recent years, from 0.73 in 2017 to 0.67 in 2019, while the regional concentration of China’s exports to B&R countries tends to increase, from 0.55 in 2008 to 0.70 in 2019. From the value of concentration, the regional concentration curve is always above the category concentration, and the trade concentration between China and the countries (regions) along the B&R is higher than the category trade concentration.

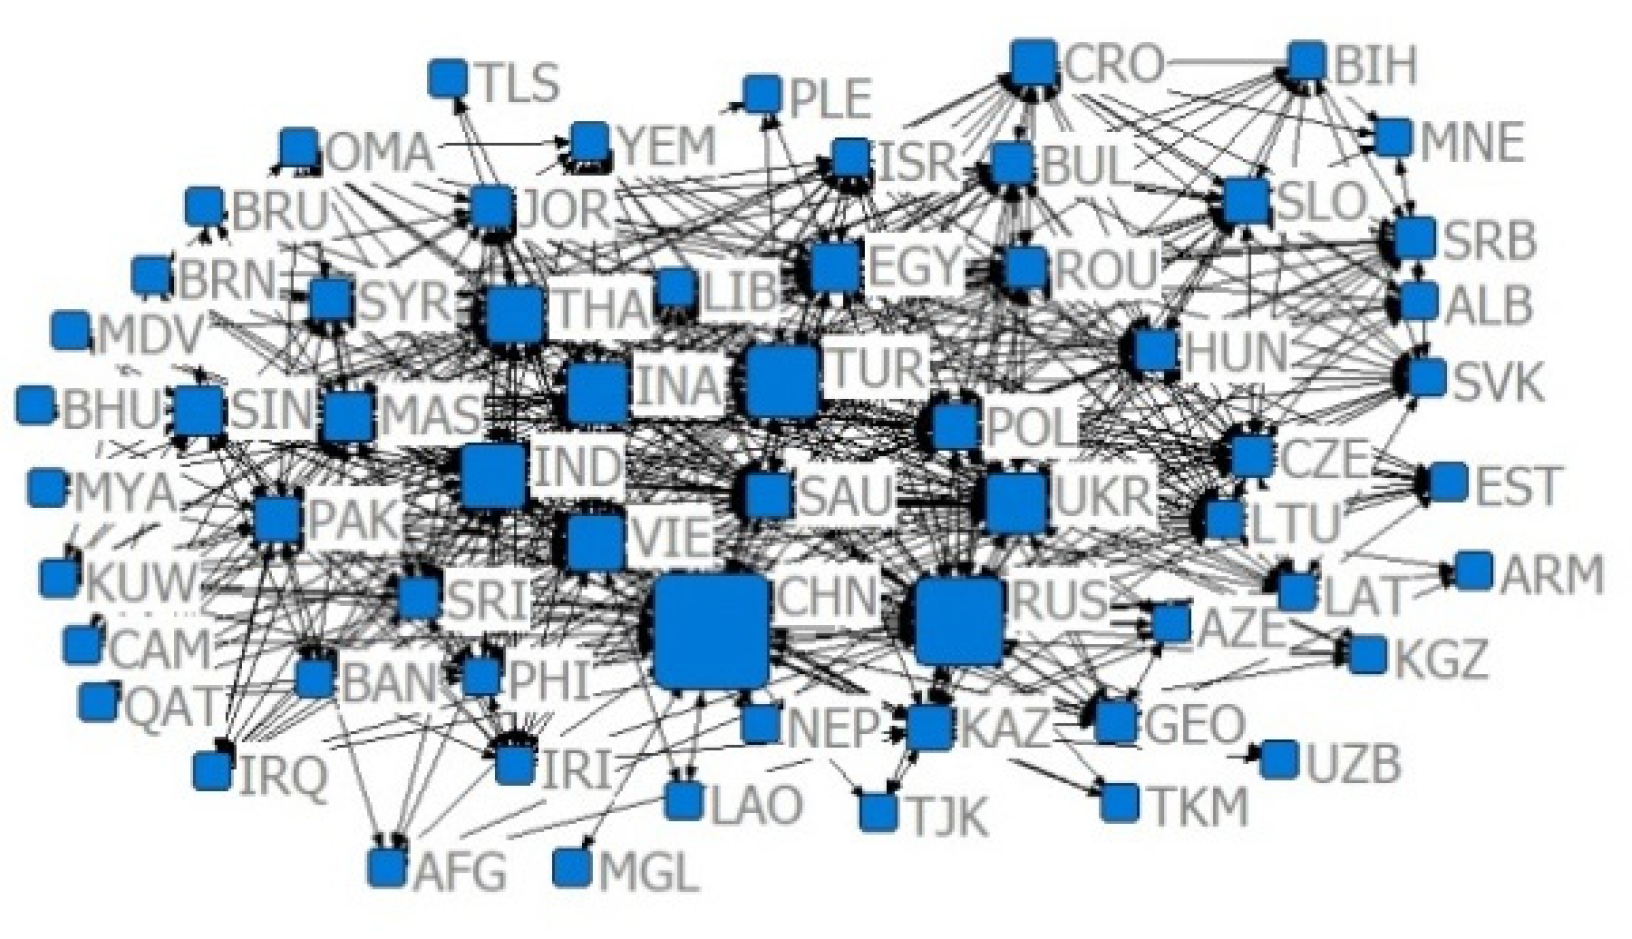
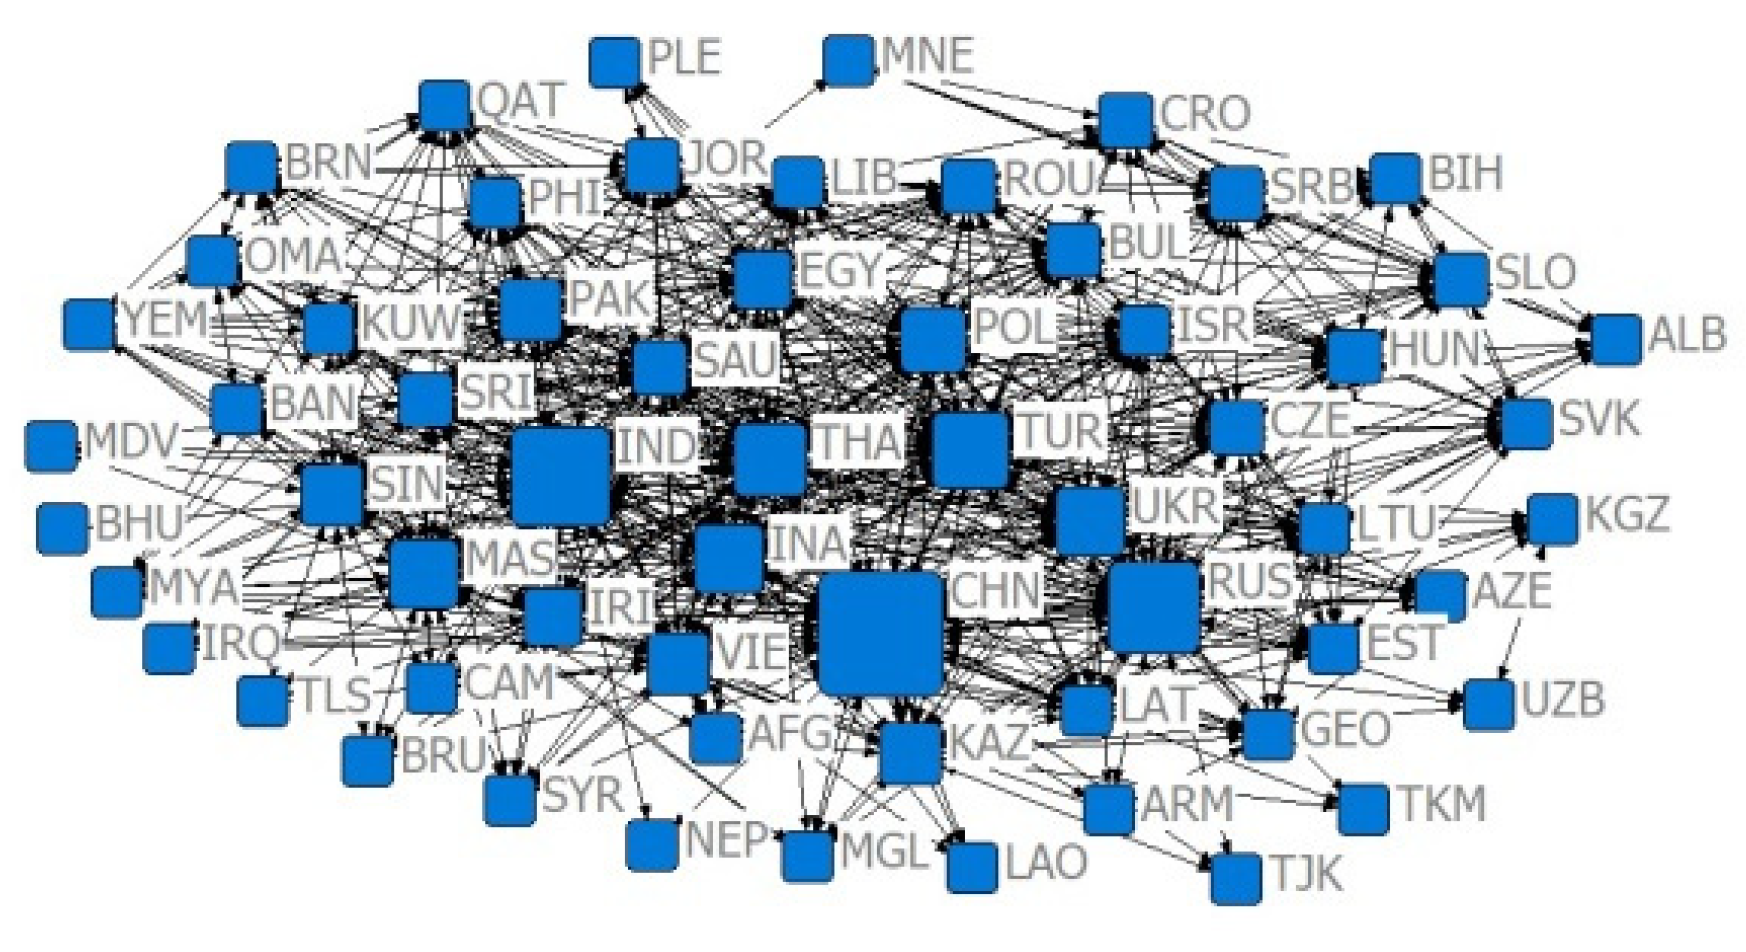
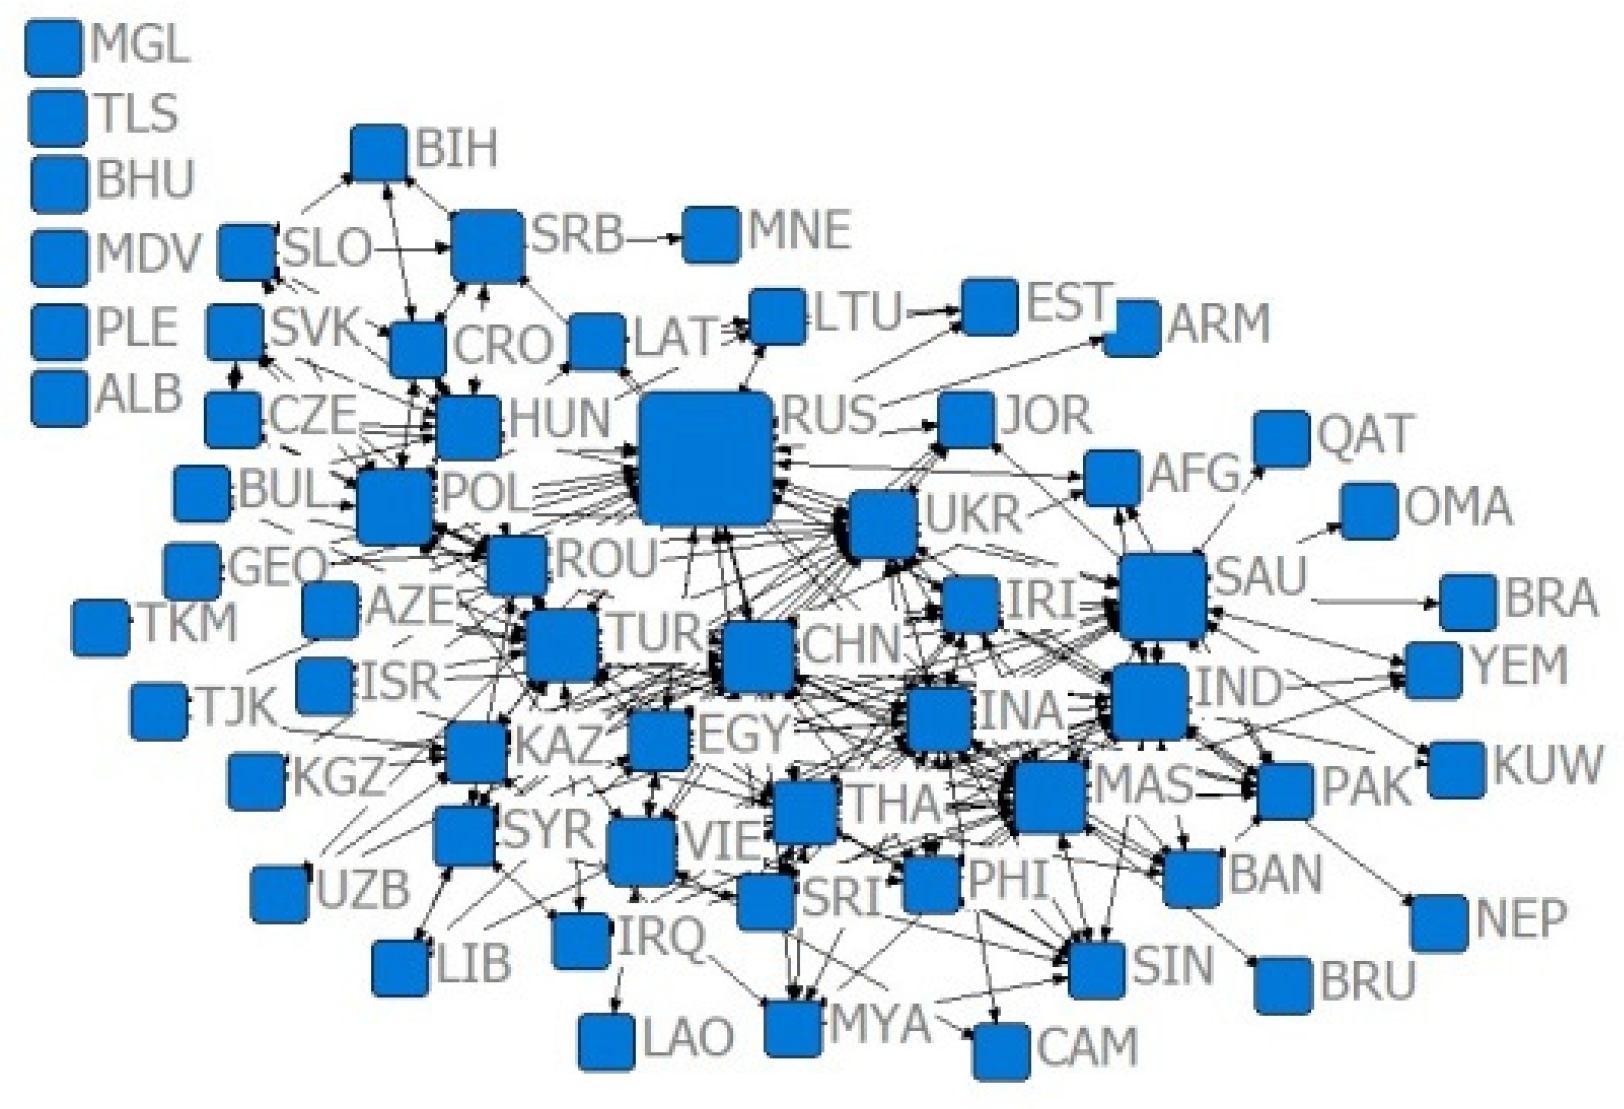
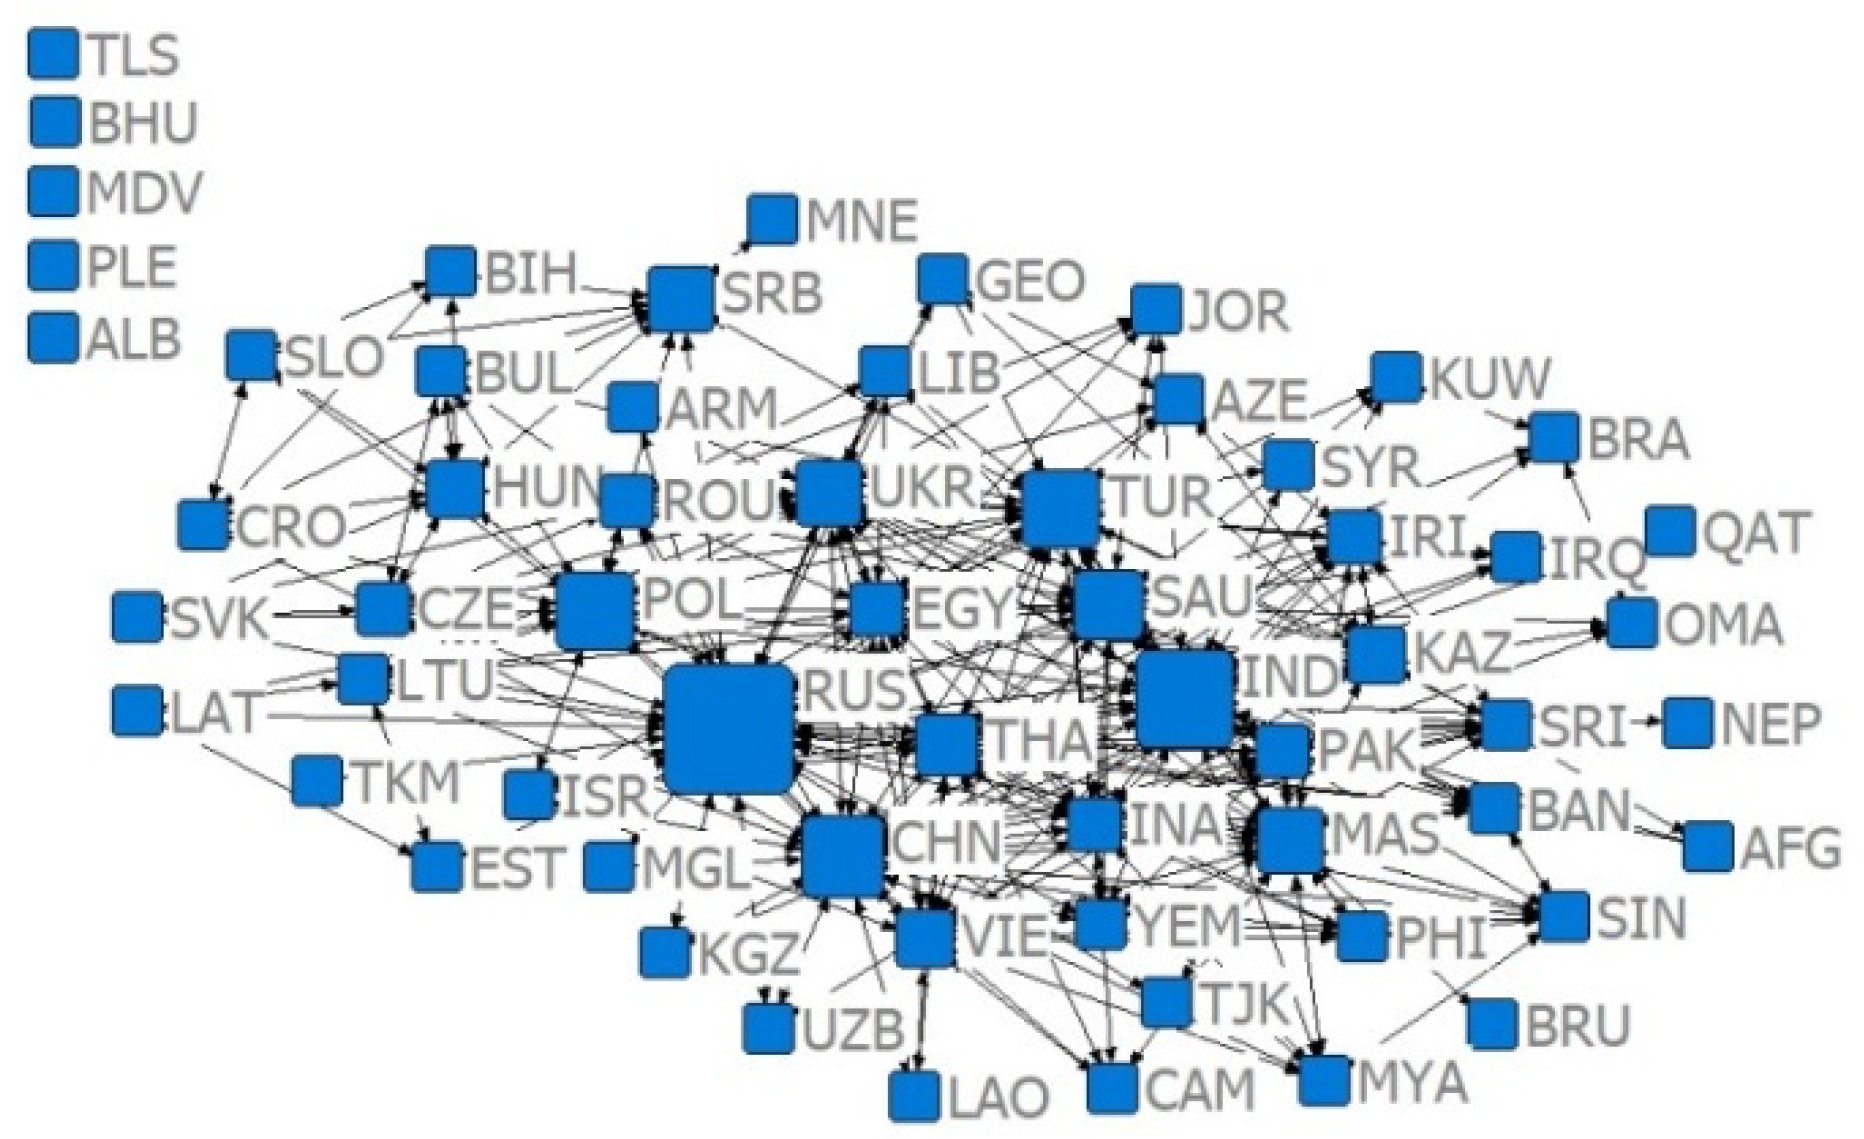
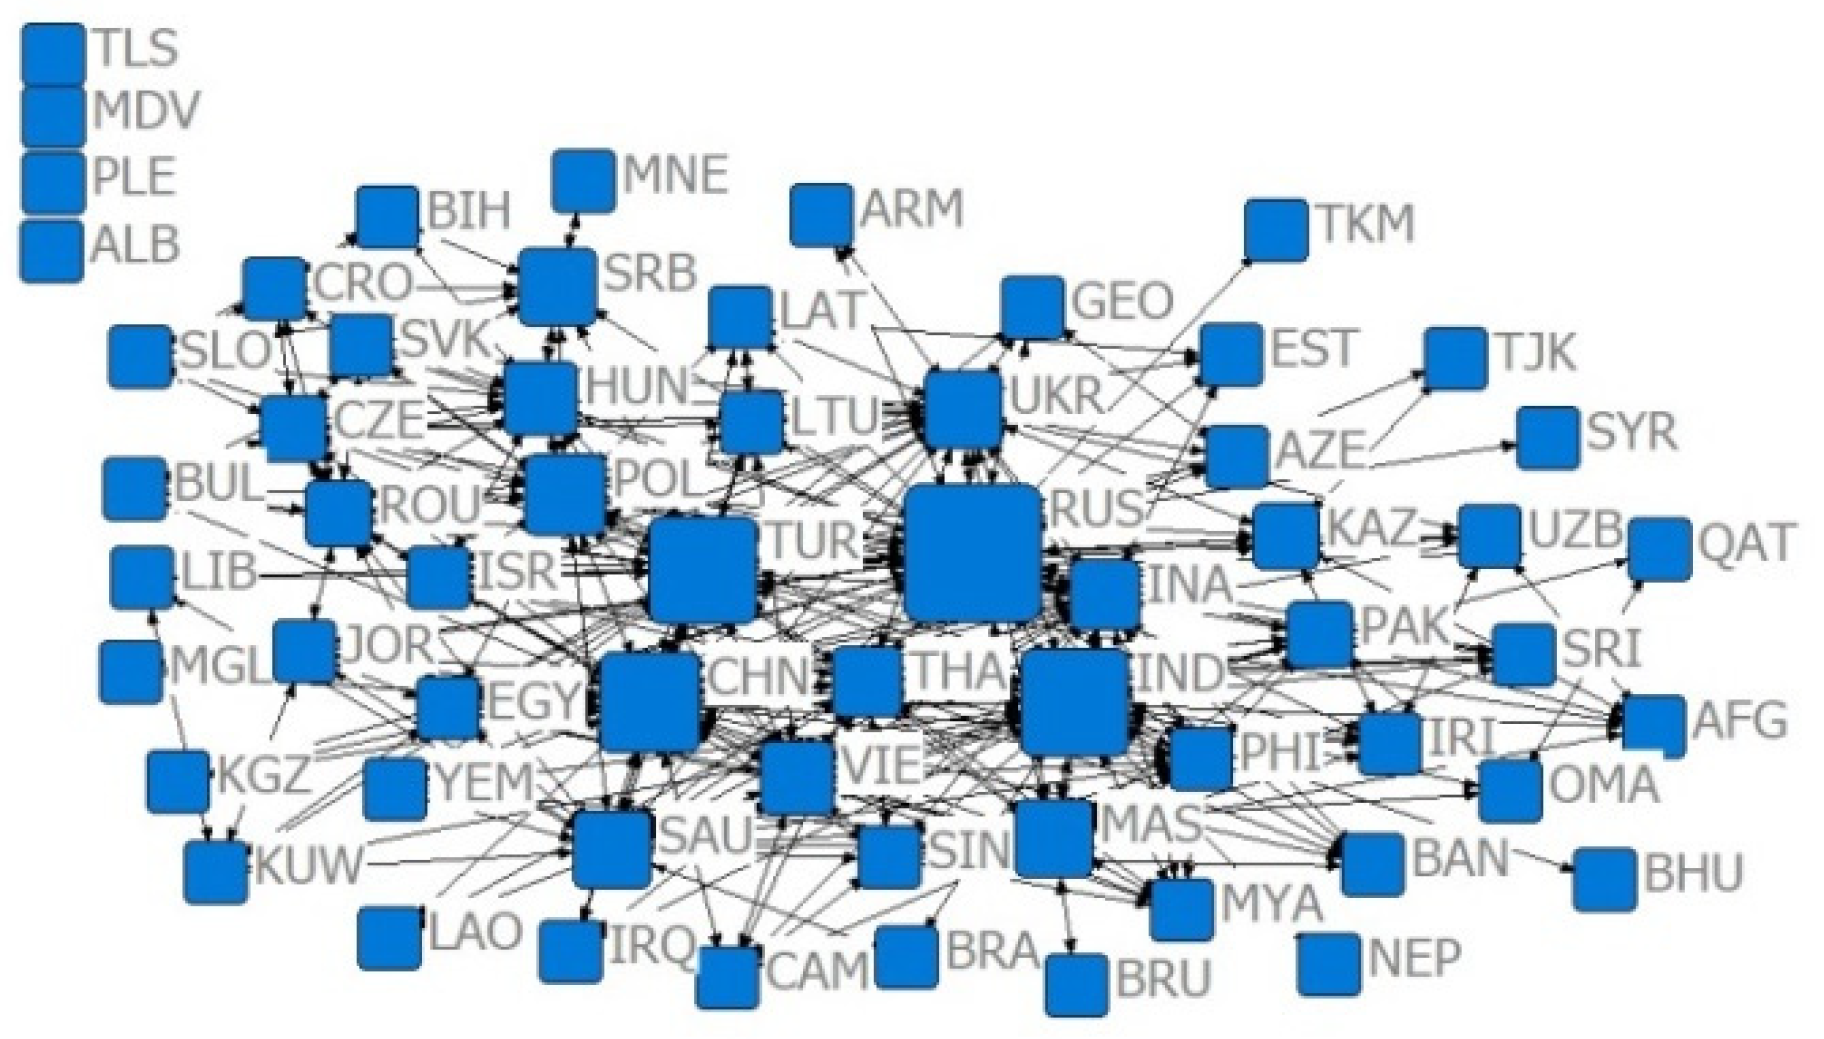
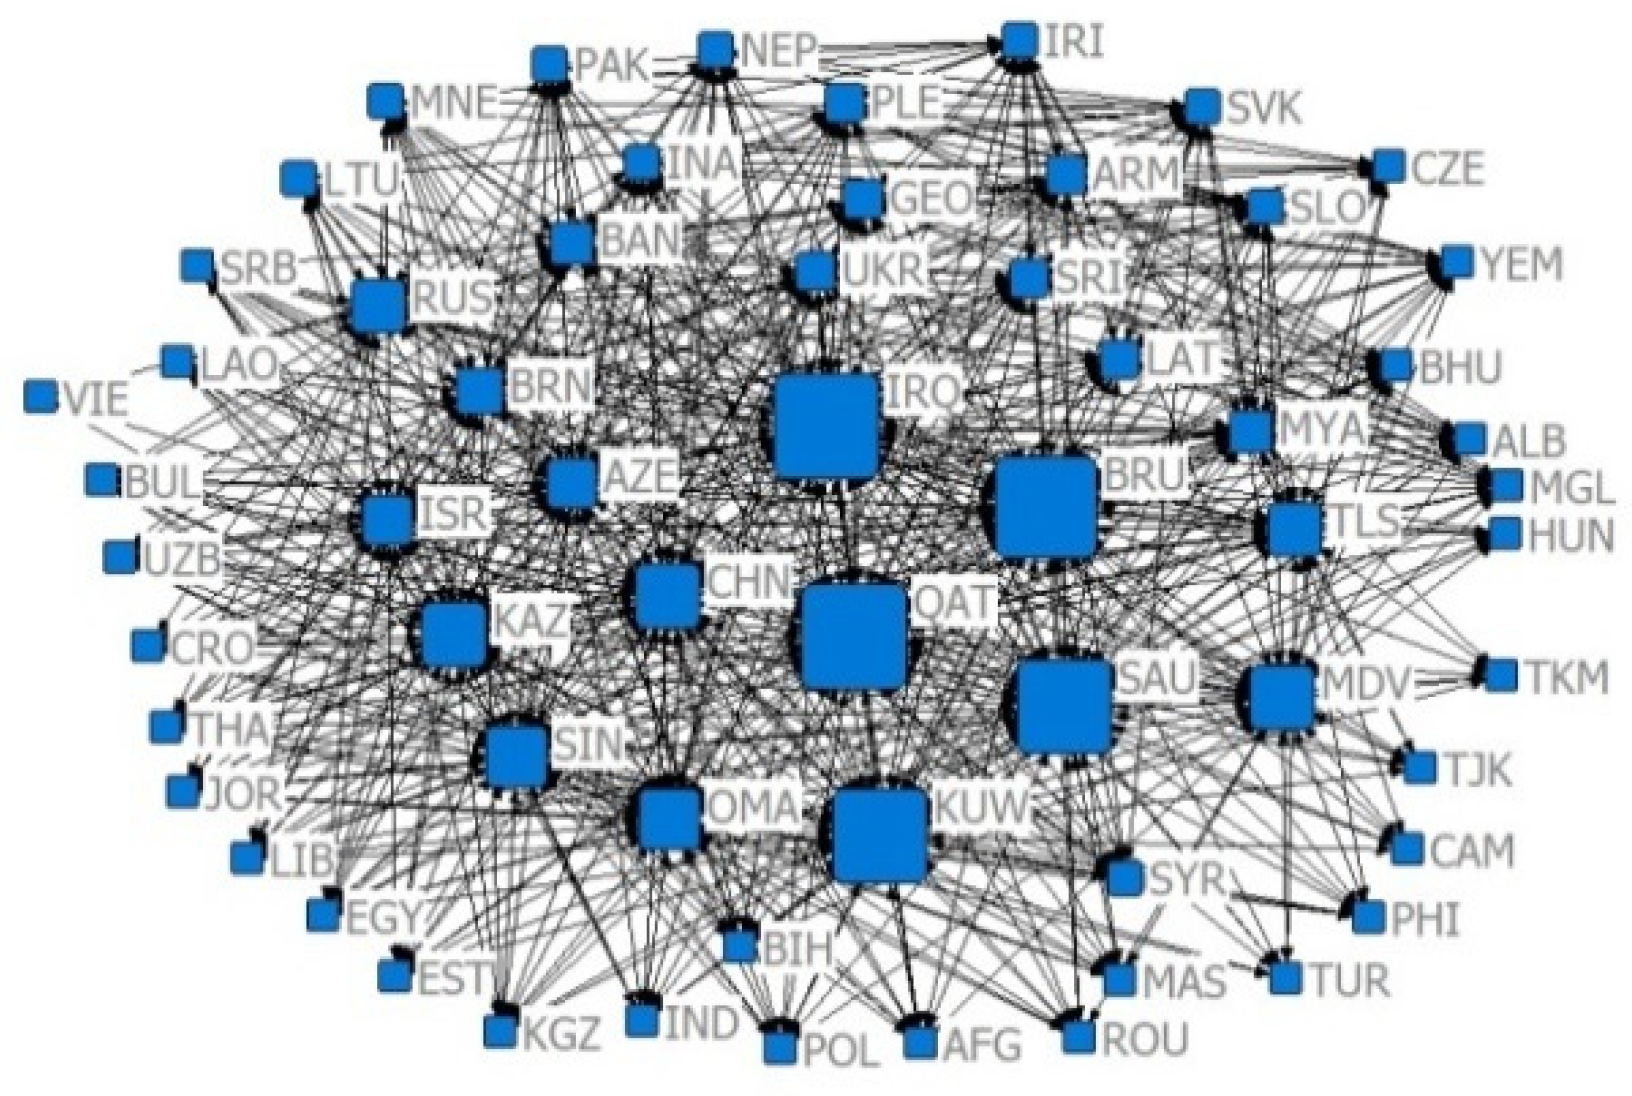
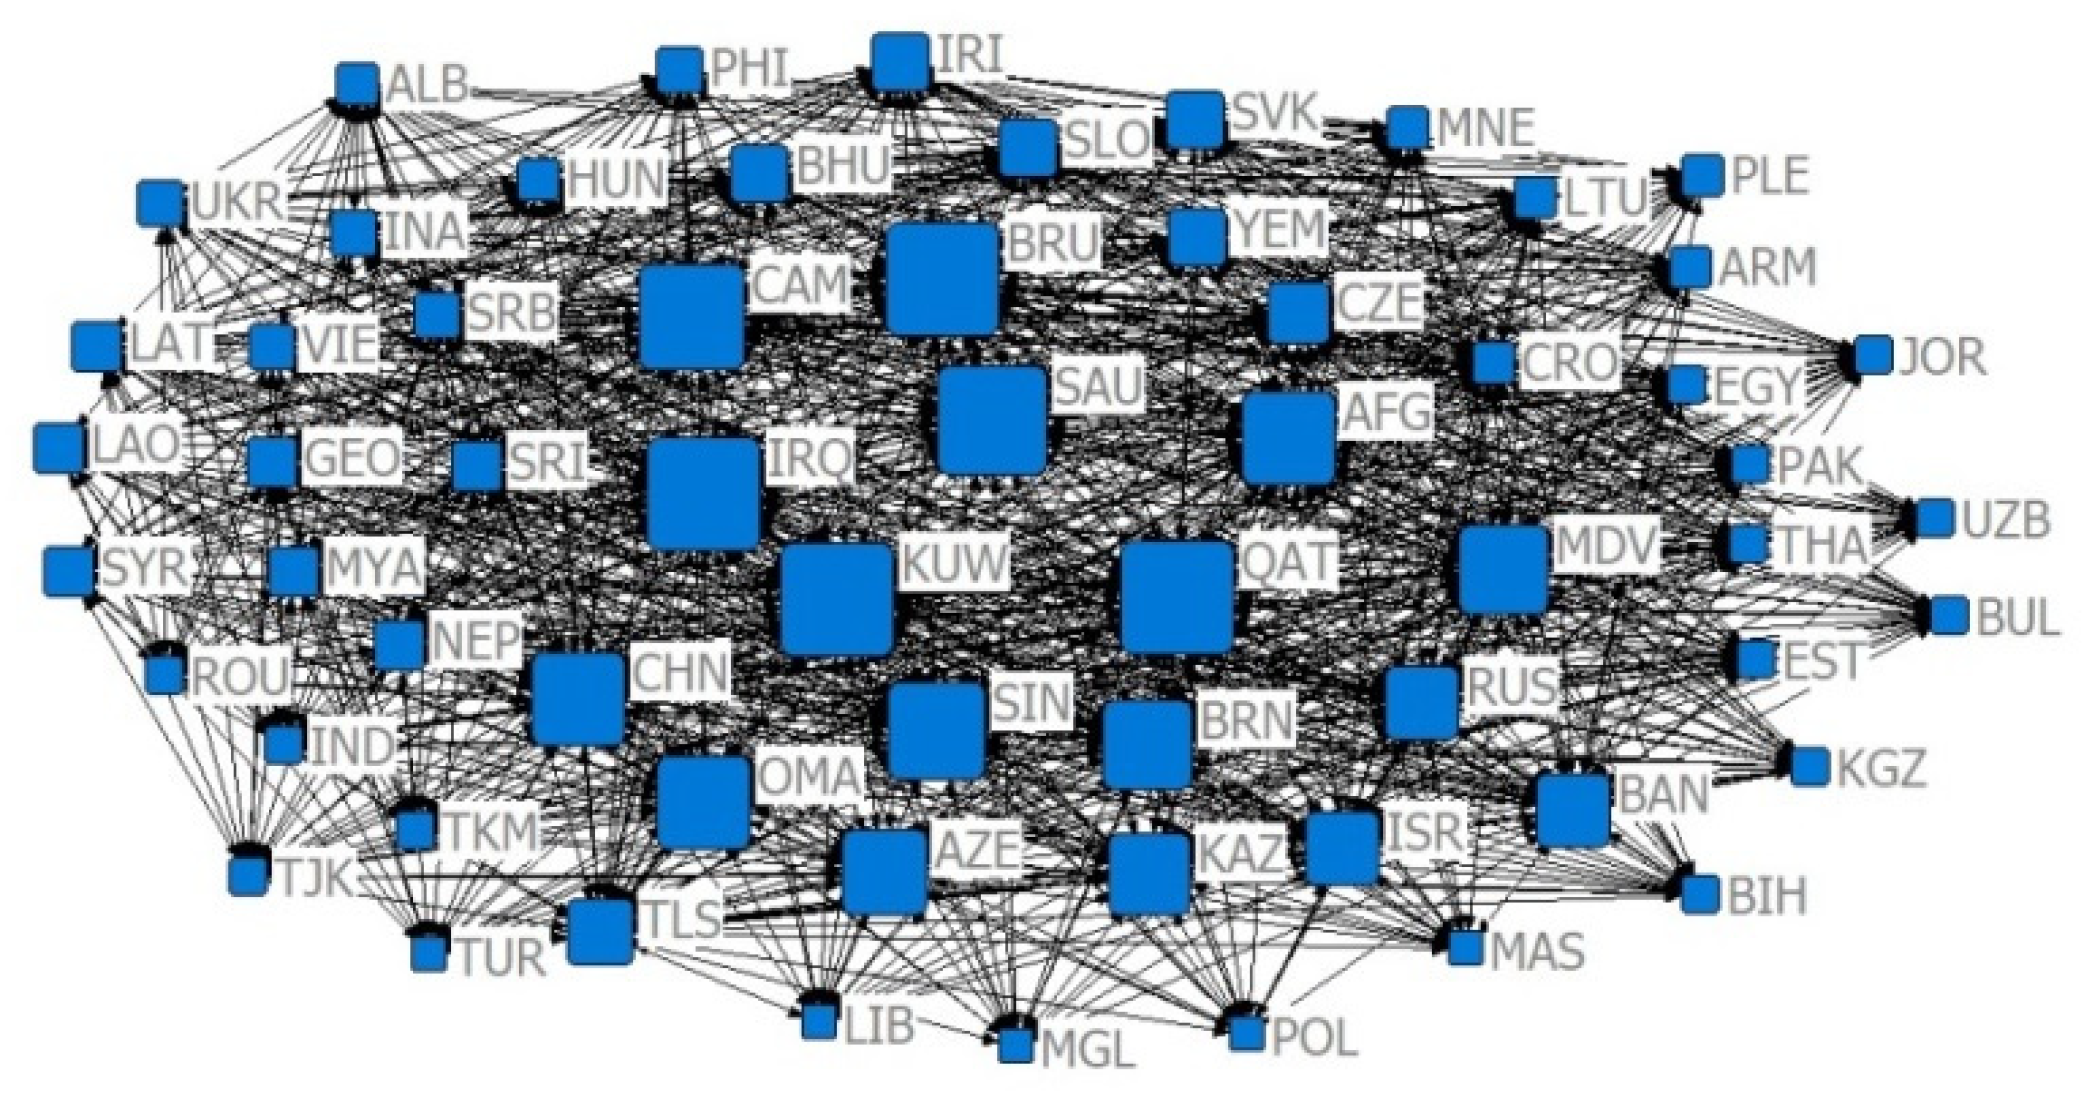
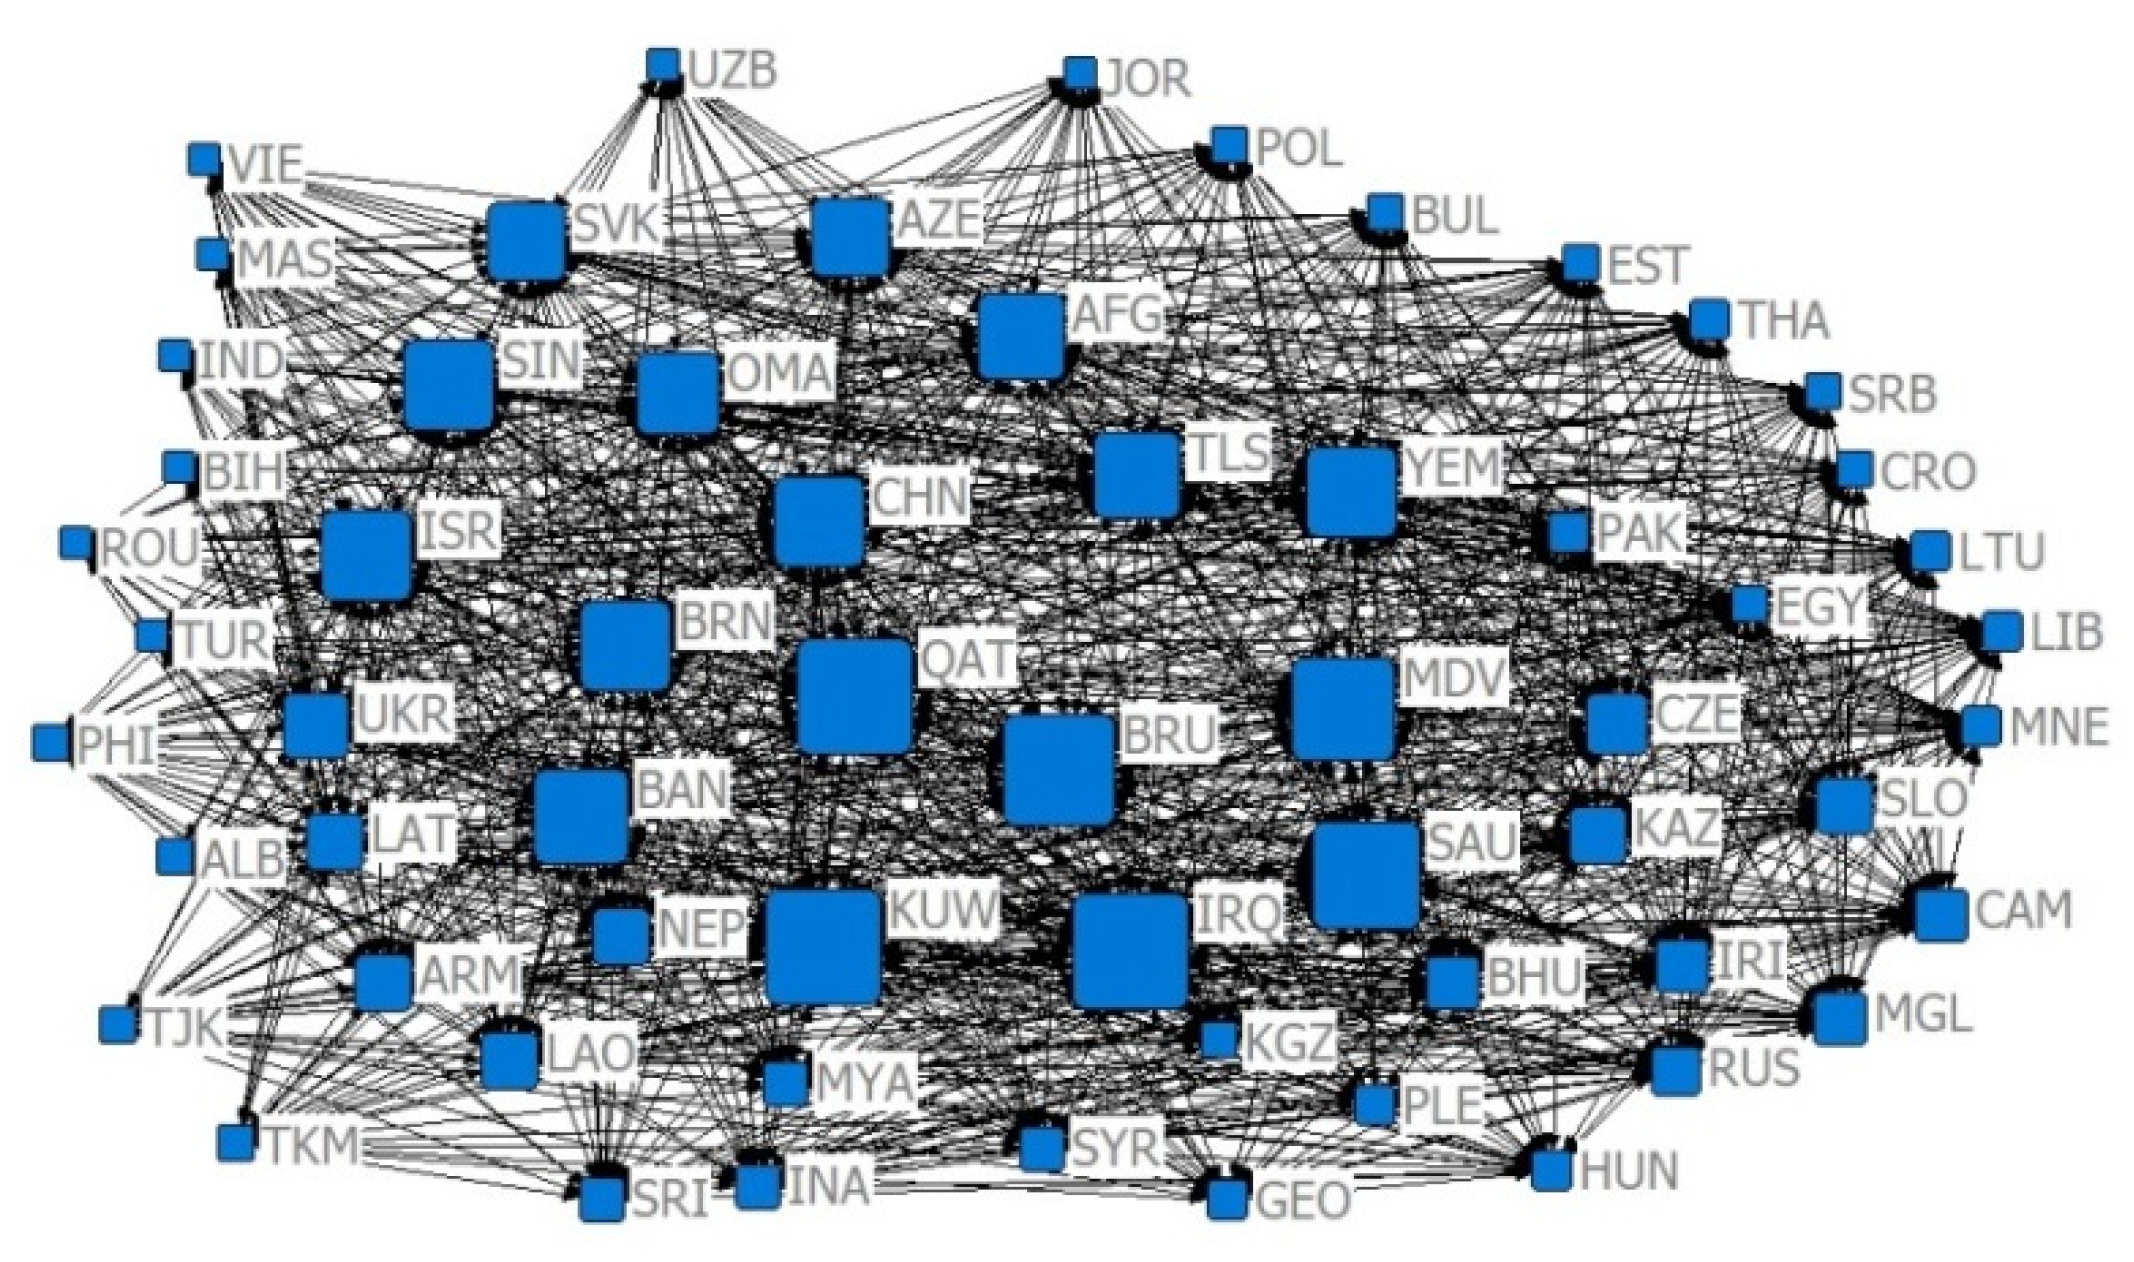
3.2. Spatial Network Structure Analysis

In order to reflect the closeness of the trade relations, in this paper, referring to the method of Li Jing et al. (2017) [37], the import–export relationship is divided into US $10 million and US $100 million categories, and the existence of significant trade relations is judged if the trade volume between the two countries meets the classification criteria. If the CN index is less than 0.7 and 0.8, a significant competitive advantage relationship is indicated. In order to reflect the evolution of the agricultural trade network between China and B&R countries from 2001 to 2019 based on the cross-sectional analysis of the trade network analysis as a single year, considering the financial crisis in 2008 and the “Belt and Road” initiative proposed by China for the first time in 2013, and other important nodes due to the delayed impact of the financial crisis, which generally only appeared in 2009, we selected four different years, 2001, 2009, 2013, and 2019, as representatives, and constructed 16 trade networks according to the time dimension and the degree of trade relations (Figure 2, Figure 3, Figure 4, Figure 5, Figure 6, Figure 7, Figure 8, Figure 9, Figure 10, Figure 11, Figure 12, Figure 13, Figure 14, Figure 15, Figure 16 and Figure 17).

3.2.1. Analysis of the Density of Trade Networks

Combining Figure 2, Figure 3, Figure 4, Figure 5, Figure 6, Figure 7, Figure 8, Figure 9, Figure 10, Figure 11, Figure 12, Figure 13, Figure 14, Figure 15, Figure 16, Figure 17 and Table 4 in terms of the network density, Dn for the US $10 million criterion ranged from 0.1785 to 0.3251 over the four years of the study sample, tending to increase overall and decreasing slightly in recent years. Dn in the US $100 million criterion increases from 0.0404 to 0.1505 year by year, and Dn in 2019 is 3.52 times that of 2001, indicating a rapid increase in trade relations reaching the US $100 million criterion. In general, China’s agricultural trade relations with B&R countries achieve faster growth, but the US $10 million criterion relationship declines slightly, the US $100 million criterion relationship gradually increases, and trade tends to be concentrated.
With the CN = 0.7 criterion, the four-year Dn ranged from 0.3221 to 0.3509, with growth rates of 11.21%, −6.78%, and 5.09% for the four time points, indicating that the development space of agricultural trade between China and B&R countries has experienced the process of “rise–fall–rise”. In 2013, the “Belt and Road” initiative injected new impetus to the agricultural trade of B&R countries. With the CN = 0.8 criterion, Dn ranged from 0.4975 to 0.5426, with growth rates of 7.32%, −5.175%, and 7.17% for the four time points, indicating that, when lowering the competitive advantage criterion, the development space of the agricultural trade of the B&R countries is also in the trend of “rise–fall–rise”. Comparing the CN = 0.7 and CN = 0.8 criteria, it is found that the “Belt and Road” initiative provides development opportunities for countries with different levels of competitive advantage. Compared with the CN = 0.7 criterion, Dn in 2019 is the largest under the CN = 0.8 criterion, indicating that the countries with weaker comparative advantages in agricultural trade have achieved the best development in history after the introduction of the “Belt and Road” initiative.

3.2.2. Analysis of the Centrality of Trade Networks

Combining Figure 2, Figure 3, Figure 4, Figure 5, Figure 6, Figure 7, Figure 8, Figure 9, Figure 10, Figure 11, Figure 12, Figure 13, Figure 14, Figure 15, Figure 16, Figure 17, and Table 5, in terms of the De values, China, Russia, India, Turkey, Thailand, and Malaysia occupy the main centrality positions in the standard condition of trade volume, and they are the most influential countries in the agricultural trade network between China and B&R countries. Over the four years of the study sample, under the criterion of US $10 million, China’s centrality rankings are 2, 1, 1, and 1, respectively, indicating that under the criterion of small and medium trade, China has the highest centrality and the greatest influence among B&R countries. Under the US $100 million criterion, China’s De rankings over the four years are 2, 2, 2, and 2, respectively, indicating that among B&R countries, under the large trade volume criterion, China’s influence is firmly in second place, after Russia. Under the criterion of CN = 0.7, China’s De rankings over the four years are 31, 11, 10, and 15, respectively, indicating that, under the condition of greater competitive advantage, China’s agricultural trade development space is generally improving. Under the criterion of CN = 0.8, China’s De ranking over the four years are 29, 10, 11, and 11, respectively, which indicates that China’s trade development space is steadily increasing and staying stable under the smaller trade competitive advantage. The criterion of CN = 0.7 and CN = 0.8 indicates that China’s trade development space with B&R countries is huge.
According to Table 5, from the relative degree centrality index, under the US $10 million criterion, the NC index between China and B&R countries grew from 40% to 59.66% in the four years of the simulation, with an overall growth rate of 49.15% and annual growth rates of 37.78%, 7.24%, and 0.95%, indicating that the centrality of agricultural trade between China and B&R countries tends to be concentrated, and that the countries have closer trade relations, but the centrality tends to slow down. Under the US $100 million criterion, the NC index between China and B&R countries grew from 18.16% to 48.16% in the four years of the simulation and annual growth rates of 120.87%, 13.31%, and 5.96%.
Compared with the US $10 million criterion, the US $100 million criterion centered on a smaller base but a faster growth rate, proving that China has relatively fewer countries, with a trade volume exceeding US $100 million along the B&R countries, but this closeness is growing faster. Under the criterion of CN = 0.7, the NC index between China and B&R countries ranged from 47.20% to 58.28% in the four years of the simulation and annual growth rates of −13.47%, 5.40%, and 17.15%, indicating that after the financial crisis, the central tendency of China and B&R countries with large competitive advantages has increased, and the trade exchanges tended to be closer. Under the criterion of CN = 0.8, the NC index between China and B&R countries ranged from 37.63% to 41.78% in the four years of the simulation and annual growth rates of 19.21%, 11.93%, and 0.81%, indicating that the trade center potential of China and B&R countries with smaller competitive advantages in the “Belt and Road” initiative tended to disperse, and the countries with room for trade development were more widely distributed.

3.2.3. Analysis of the Trade Block Model

According to the analysis in Table 6, the first plate is an internal type plate. The second plate is an internal type plate. Third plate is an isolated plate and the fourth plate is an internal plate. According to the above analysis, it can be concluded that in the early stage of China’s accession to WTO, the agricultural trade between China and B&R countries is in an internal block or isolated state; a “small circle” trade. Similarly, the first, second, third, and fourth plates in 2009 are, respectively, the internal plate, isolated plate, isolated plate, and isolated plate. In 2013, the first, second, third, and fourth plates are the simultaneous plate, the internal plate, the simultaneous plate, and the internal plate, respectively. In 2019, the first, second, third, and fourth plates are the simultaneous plate, internal plate, internal plate, and internal plate, respectively.
Due to space limitations, only the country distributions for 2001 and 2019 are listed. According to the CONCOR method analysis results, in 2001, the countries in the first plate are China, nine countries in Southeast Asia, five countries in South Asia, and four countries in Western Asia and the Middle East. The countries in the second plate are Russia, two countries in Central Asia, three countries in Western Asia and the Middle East, and seven countries in central and Eastern Europe. The countries in the third plate are Mongolia, three countries in Central Asia, two countries in Southeast Asia, three countries in South Asia, seven countries in Western Asia and the Middle East, and six countries in central and Eastern Europe. The countries in the fourth plate are four countries in Western Asia and the Middle East, and three countries in Central and Eastern Europe. In 2019, the countries in the first plate are China, Russia, 10 countries in Southeast Asia, 3 countries in South Asia, and 2 countries in Western Asia and the Middle East. The countries in the second plate are four countries in South Asia, seven countries in Western Asia and the Middle East, and one country in Central and Eastern Europe. The countries in the third plate are Mongolia, four countries in Central Asia, five countries in Western Asia and the Middle East, and six countries in Central and Eastern Europe. The countries in the fourth plate are one in Southeast Asia, one in South Asia, four in Western Asia and the Middle East, and nine in Central and Eastern Europe. China always belonged to the first plate, and most of the countries in the first plate belonged to China’s neighboring countries. The trade density of the first plate continued to increase from 2001 to 2019, rising from 0.216 to 0.591, indicating that the trade of countries in the first plate became increasingly close.
According to the analysis in Table 7, the first, second, third, and fourth plates in 2001 were, respectively, the export-oriented plate, dual-oriented plate, dual-oriented plate, and the dual-oriented plate. In 2009, they were the export-oriented plate, take into account plate, take into account plate, and the take into account plate. In 2013, they were the export-oriented plate, multi-faceted plate, multi-faceted plate, and the internal plate. In 2019, they were the simultaneous plate, simultaneous plate, simultaneous plate, and the simultaneous plate. Due to space limitations, only the country distributions in 2001 and 2019 are listed. Countries belonging to the first plate in 2001, included China, Russia, one in Southeast Asia, four in West Asia and the Middle East, and three in Central and Eastern Europe. The countries belonging to the second plate numbered three in Southeast Asia and eight in West Asia and the Middle East. The countries belonging to the third plate were Mongolia, and two in Central Asia, five in Southeast Asia, five in South Asia, three West Asia and the Middle East, and four in Central and Eastern Europe. Finally, the countries in the fourth plate numbered three in Central Asia, two in Southeast Asia, three in South Asia, three in West Asia and the Middle East, and nine in Central and Eastern Europe. The countries belonging to the first segment in 2019 were China, one in Southeast Asia, one in South Asia, eight in West Asia and the Middle East, and two in Central and Eastern Europe. The countries in the second segment were Mongolia and Russia, three in Central Asia, four in Southeast Asia, two in South Asia, one in West Asia and the Middle East, and five in Central and Eastern Europe. The countries in the third segment cinluded two in Central Asia, one in Southeast Asia, one in South Asia, two in West Asia and Middle East, and seven in Central and Eastern Europe. The countries in the fourth segment included four in Southeast Asia, four in South Asia, seven in West Asia and the Middle East, and four in Central and Eastern Europe. From 2001 to 2019, China was in the first plate, which changed from an export-oriented plate in 2001 to a balanced plate in 2019, indicating that the internal and external trade space of the plate gradually increased, and that the agricultural trade between China and B&R countries has broad prospects. From the perspective of the overall trade sector, the second, third, and fourth trade sectors had a large space for trade development. Although the fourth sector was transformed into an internal sector in 2013, and the foreign trade was not close enough, after the “Belt and Road” Initiative was proposed, the four sectors were all balanced sectors in 2019. This shows that the trade potential of agricultural products between China and B&R countries is huge.

3.3. Analysis of Spatial Network Influencing Factors

3.3.1. QAP Correlation Analysis

Using the QAP correlation analysis method and Ucinet 6 software, 5000 random permutations are selected to obtain the results of correlation analysis between China’s agricultural trade network F and each influencing factor with B&R countries in 2019, where P represents the probability that the random correlation coefficient is greater or less than the actual value. This is shown in Table 8. The agricultural trade network F is not significantly correlated with the per capita arable land resource matrix (PCLA), scientific research expenditure share (SCI), and economic distance (DE), and is significantly correlated with the per capita water resource matrix (PCWR), geographic location matrix (DIS), transportation (TRA), total economic output (DGDP), trade agreement matrix (TA), culture matrix (CUL), and trade structure matrix (IS). We tentatively determine that the geographical distance, transportation, GDP difference, trade agreements, cultural differences, and trade structure differences between the two countries are the main factors affecting the agricultural trade network between China and B&R countries.

3.3.2. QAP Regression Analysis

Based on the correlation analysis results in Table 9, we included the matrices of PCWR, DIS, TRA, DGDP, TA, CUL, and IS, which were significantly correlated with F, in the QAP regression analysis, and set the number of random permutations to 5000. The results are shown in Table 9. As seen from the table, (1) PCWR is significantly correlated with the trade network between China and B&R countries, with a regression coefficient of -0.000002, and a negative regression coefficient, indicating that the smaller the difference in water resources, the closer the trade in agricultural products. (2) The correlation of DIS to China’s trade network with B&R countries is significant, with a regression coefficient of 0.360666, indicating that countries with closer geographical locations are more likely to trade agricultural products, which also verifies the fact that China has close agricultural trade with neighboring countries such as Russia, Thailand, and Vietnam. (3) The correlation of TRA with the trade network between China and B&R countries is significant, with a regression coefficient of 0.053962, indicating that the more convenient the domestic and international transportation, the greater the possibility of agricultural trade. (4) DGDP is not significantly correlated with China’s trade network with B&R countries, indicating that although GDP is correlated with agricultural trade between countries, countries with a large difference in GDP between the two countries do not necessarily have close agricultural trade. (5) TA is significantly correlated with the trade network between China and B&R countries, indicating that a trade agreement between two or more countries can facilitate bilateral or multilateral trade exchanges. (6) The correlation of CUL with the trade network between China and B&R countries is significant, indicating that the two countries have the same or similar culture, which is conducive to the economic and trade exchanges between the two countries and the expansion of bilateral agricultural trade. (7) IS is significantly correlated with the trade network between China and B&R countries, with a negative coefficient of −0.000983, indicating that the smaller the gap in the agricultural trade structure, the closer the bilateral trade between the countries.

4. Discussion

4.1. Comparison to Prior Studies

The main objective of our paper is to explore the factors influencing the evolution and trade space of agricultural trade between China and B&R countries, from a planar and spatial perspective. Our results confirm that China’s agricultural trade with B&R countries has become increasingly close and highly concentrated, with high intensity areas being mainly concentrated in closer or neighboring countries, and that the trade development space shows a “rise-fall-rise “ trend, with China remaining at the “power” core of the trade network, and with the centralization of trade in the B&R countries tending to be concentrated. The agricultural trade network between China and B&R countries can be divided into four major segments, with increasingly close internal and external trade in each segment. The trade network linkages are mainly influenced by water resources, geographic location, railroad convenience, trade agreements, and trade structure. The findings of this paper are consistent with previous studies on agricultural trade between China and B&R countries. For example, Yu (2016) found that China’s total bilateral trade with eight South Asian countries has quadrupled, and that China’s total agricultural imports from South Asia are greater than its total agricultural exports, with a widening deficit [8]. Zhan (2018) pointed out that the network density of agricultural export relations, competitive relations, and complementary relations among B&R countries is increasing day by day [32]. Su (2019) argued that the density of spatially linked networks of agricultural trade in China and B&R countries is high, and that China is at the center of this spatially linked network [33]. As expected, the empirical results of this paper show that China’s agricultural trade with B&R countries is getting closer and closer, and that China is gradually becoming the center of agricultural trade. Our findings are almost consistent with those of the aforementioned scholars.
However, our study is somewhat different from previous studies, from the following perspectives. In analyzing the comprehensiveness of agricultural products and time chains, we have used all the total agricultural products and the time of WTO accession as samples, which can provide China with an overall perspective and ability to grasp the dynamics of agricultural cooperation in B&R countries; this is conducive to making comprehensive and sustainable decisions. For example, Li (2018) takes aquatic products as a sample and concludes that China is located in the middle and high end of the regional value chain of B&R countries, and has the ability to dominate the regional value chain [23], which is similar to the conclusion reached in this paper. However, the conclusion of this paper has a greater generalization of agricultural products and is more conducive to national agricultural sector decision-making.
Second, we use a combination of planar- and spatial-shaped analysis, taking into account the quantity, specific agricultural product dynamics, and spatial national agricultural trade dynamics, each focusing on the other and complementing each other. For example, both Chen (2019) and Su (2019) analyzed the relationship model of food and agricultural trade networks between China and B&R countries from a spatial perspective [26,33], which can reflect that the density of food trade networks among B&R countries is increasing. However, they did not compare with the flat volume structure reference, and could not produce accurate figures.
Third, we improved the competitive index CS and constructed the competitive advantage index CN in the research technique of Li et al. (2017) [37], which provides a method for scholars to measure the spatial relationship. For example, Wei (2018) refers to Li Jing’s (2017) method of screening nodes, and uses the total agricultural import and export trade of more than US $100 million, and unilateral agricultural imports of more than US $10 million as the criteria for trade flows, without further constructing the network model with the criteria of comparative advantage to derive new trade structure information [31].
Finally, regarding measurements of the influencing factors of spatial association relationships, for example, previous studies found that Wei’s (2018) “proximity effect”, FTAs, differences in consumer population base, and differences in total economic size all enhance the association relationships of agricultural trade between countries [31]. However, we found that trade linkages are influenced by water resources, geographic location, railroad accessibility, trade agreements, and trade structure. There were also both overlapping elements and new elements that can provide a reference for China to select sustainable cooperation partners.

4.2. Sustainability Implications

First, the types of agricultural products traded and the import and export areas between China and B&R countries are highly concentrated. China has close trade with countries that are geographically close, so China has to maintain friendly relations with neighboring countries, such as Russia, India, Vietnam, Thailand and other large agricultural countries, and actively sign trade agreements. It can not only save China’s trade costs and improve its own agricultural products supply security capacity, but also promote the differentiated division of labor in agriculture between China and B&R countries, improve labor productivity, increase the export of agricultural products with comparative advantages, and achieve sustainable mutual benefits.
Second, large agricultural countries such as China, Russia, and India occupy a dominant position, and the trade network can be divided into four major segments, with increasingly close trade within and outside each segment. Therefore, China should stabilize production and trade with large agricultural countries such as Russia and India to reduce the overall trade risk and enhance sustainable agricultural production and trade. China should also actively use its dominant position as a large agricultural trading country to guide other strong agricultural trade countries to play a greater role in emphasizing their own advantages, supporting countries with weaker trade by providing agricultural production factors, and promoting sustainable cooperation among countries.
Last, the relationship between China and the agricultural trade network of B&R countries is mainly influenced by water resources, geographical location, railroad convenience, trade agreements and trade structure. Therefore, China can, based on the conditions of natural resources, public facilities, and trade agreements of the B&R countries, reduce unnecessary waste of agricultural resources and the environment in the context of the global goal of achieving carbon peaking and carbon neutrality. China should also strengthen infrastructure development and natural resource advantages of neighboring countries to complement each other, reduce trade costs and increase agricultural productivity, and improve environmentally friendly and sustainable production between countries. Additionally, China should develop an agricultural production policy within China that suits its own resource environment and trade structure, so that both domestic and international agricultural exports and imports can take advantage of their comparative advantages and form a sustainable domestic production and international trade relationship.

4.3. Limitations and Future Research Directions

There are also some shortcomings to our research. First, when discussing the classification of specific agricultural products, this paper only explores in the plane structure, and it hardly shows the spatial structure. Therefore, although the current situation of the cooperation of specific classified agricultural products with B&R countries can be understood from the perspective of a single Chinese country, the analysis of the agricultural products classified in the spatial scope of B&R countries is lacking. The results of our study need to be supplemented and improved again by subsequent studies. Second, when discussing the factors influencing the spatial structure of trade, we only list 10 indicators, due to the length and the availability of the data, and there are other important influencing factors to be explored to further improve the indicator system for promoting bilateral trade. Third, we assumed only two significant indicators, namely the US $10 million and US $100 million markers, since other data were not available for the countries and years we analyzed. Fourth, we constructed indicators of comparative competitive advantage in trade without constructing indicators of trade complementarity. The conclusions drawn can only reflect a situation of competitive advantage in trade.
There are three future research directions. First, our research here mainly explores the agricultural trade structure and its influencing factors between China and B&R countries from a plane and spatial perspective. However, with the establishment of AFTA, CEFTA, and RCEP, the policies between countries are very different, and the global dual carbon initiative goals are included in the influence of the factors. These factors enrich the system of indicators affecting sustainable trade structure and help to quantify the effect of regional cooperation and the reference direction of future sustainable cooperation in the face of COVID-19, the Russia–Ukraine conflict, and climate change. Second, the spatial structure of this paper only explores the overall agricultural trade structure from different markers, so we can take global bulk agricultural products, such as soybean, wheat, corn, and rice, as the research objects, and explore the agricultural trade structure between China and B&R countries, which is conducive to exploring the targets of trade-led sustainable cooperation from the perspective of specific agricultural products. Third, future research can construct trade complementarity indexes. International trade not only has the theory of comparative advantage, but complementarity is also one of the important theories for promoting the development of international trade, and so it is beneficial to expand the criteria of trade cooperation and explore the trade network space from multiple perspectives to provide a rich reference for international agricultural sustainable cooperation.

5. Conclusions

From the perspective of plane and space, this paper analyzes the plane structure and the spatial network structure, and the influencing factors of agricultural trade between China and the B&R countries from 2001 to 2019. This paper takes all agricultural products and all countries along the B&R as research samples, classifies countries and products, and uses plane and spatial perspectives to conclude that China’s agricultural product trade with B&R countries tends to be decentralized in terms of import types and regions, and concentrated in terms of export types and regions, the regions with high trade intensity are mainly concentrated in close proximity or in neighboring countries, and that trade relations are getting closer. China has always had a greater influence in the trade network, and the trade centrality of the B&R countries tends to be concentrated. China’s agricultural trade network with the B&R countries can be divided into four major segments, with increasingly close internal and external trade in each segment. The results of this paper are beneficial for China and B&R countries to provide a basis for making decisions on trade cooperation from the perspective of agriculture as a whole, to promote global agricultural cooperation, and to facilitate global agricultural cooperation, the flow of global agricultural factors, world food production, and the establishment of a reference method to study global trade structure.

Author Contributions

Conceptualization: L.Z. and G.T.; methodology: L.Z. and G.T.; software: L.Z.; validation: L.Z. and G.T.; formal analysis: L.Z.; investigation: L.Z.; data curation: L.Z. and G.T.; writing—original draft preparation: L.Z.; writing—review and editing: L.Z. and G.T.; visualization: L.Z. and G.T.; funding acquisition: L.Z. and G.T. All authors have read and agreed to the published version of the manuscript.

Funding

The research was funded by Heilongjiang Provincial Philosophy and Social Science Office, grant number 18JLD310.

Institutional Review Board Statement

Not applicable.

Informed Consent Statement

Not applicable.

Data Availability Statement

The data presented in this study are available on request from the corresponding author.

Acknowledgments

The authors would like to thank the anonymous reviewers for their constructive comments and valuable suggestions on this article.

Conflicts of Interest

The authors declare no conflict of interest.

References

  1. Glogovețan, A.I.; Dabija, D.C.; Fiore, M.; Pocol, C.B. Consumer Perception and Understanding of European Union Quality Schemes: A Systematic Literature Review. Sustainability 2022, 14, 1667. [Google Scholar] [CrossRef]
  2. Guo, J.; Mao, K.; Yuan, Z.; Qin, Z.; Xu, T.; Bateni, S.M.; Zhao, Y.; Ye, C. Global Food Security Assessment during 1961–2019. Sustainability 2021, 13, 14005. [Google Scholar] [CrossRef]
  3. Majerova, J.; Sroka, W.; Krizanova, A.; Gajanova, L.; Lazaroiu, G.; Nadanyiova, M. Sustainable Brand Management of Ali-mentary Goods. Sustainability 2020, 12, 556. [Google Scholar] [CrossRef] [Green Version]
  4. Du, Z.X.; Gao, M.; Han, L. Study on the impact of supply side import end change on China’s food security. Chin. Rural Econ. 2021, 1, 15–30. [Google Scholar]
  5. Zhao, Y.L.; Lin, G. Analysis of bilateral agricultural trade flow and trade potential between China and 10 ASEAN countries—A study based on Trade Gravity Model. J. Int. Trade 2008, 12, 69–77. [Google Scholar]
  6. Li, T.; Li, Y.X. Analysis on complementarity of agricultural trade between China and five Central Asian countries. J. Int. Trade 2011, 1, 53–62. [Google Scholar]
  7. Zhu, X.X.; Li, Y.X. Analysis on the competitiveness and complementarity of agricultural trade between China and five Central Asian countries. Int. Econ. Trade Res. 2011, 27, 17–22. [Google Scholar]
  8. Yu, M.Z.; Liang, Y.F.; Gao, Y. One belt, one road strategy and the competition and complementarity of agricultural products trade between China and South Asia. Issues Agric. Econ. 2016, 37, 83–94. [Google Scholar]
  9. Geng, Z.Z.; Xiao, H.F. Analysis on the trade characteristics of agricultural products between China and countries along the “21st century Maritime Silk Road”. Issues Agric. Econ. 2016, 37, 81–88. [Google Scholar]
  10. Yang, F.M.; Tian, Y.Y. Research on agricultural trade between China and countries along the “21st century Maritime Silk Road”—From the perspective of competitiveness, complementarity and trade potential. Mod. Econ. Res. 2018, 8, 54–65. [Google Scholar]
  11. Tong, G.J.; Shi, L. Empirical analysis of Sino Russian agricultural trade based on intra industry. Issues Agric. Econ. 2017, 38, 89–100. [Google Scholar]
  12. Bai, X.B.; Xu, Z.; Zhou, Y.H. Analysis of the characteristics of China-Russia agricultural trade and prospects of cooperation. Russ. Stud. 2021, 4, 176–196. [Google Scholar]
  13. Liu, C.P.; Xiao, H.F. A study on the causes of agricultural trade growth between China and 16 countries in central and Eastern Europe—An Empirical Analysis Based on CMS model. J. Agrotech. Econ. 2018, 9, 135–144. [Google Scholar]
  14. Yao, C.M.; Xu, X.K.; Wang, Y. Dynamic decomposition of the causes of agricultural trade growth between China and Eastern European countries. Stat. Deci. 2021, 37, 155–159. [Google Scholar]
  15. An, X.N.; Xin, L. Analysis of the current situation and potential of agricultural trade between China and Southeast Asia based on the “One Belt, One Road” initiative. Chin. J. Agri. Res. Reg. 2019, 40, 118–127. [Google Scholar]
  16. Wang, R.; Wen, H.D. Research on China’s export potential of agricultural products to countries along the “Silk Road Economic Belt”—An Empirical Analysis Based on Stochastic Frontier gravity model. J. Agrotech. Econ. 2016, 10, 116–126. [Google Scholar]
  17. Wang, L.; Liu, S.G.; Duan, P.L.; Yin, P. Structural characteristics of agricultural products trade network in countries along the Silk Road Economic Belt. Econ. Geogra. 2019, 39, 198–206. [Google Scholar]
  18. Yang, J.Q. Spring Festival Study on the export trade potential of China’s agricultural products from countries along the “Silk Road Economic Belt”—An analytical framework based on TPI and extended stochastic frontier gravity model. J. Int. Trade 2020, 6, 127–142. [Google Scholar]
  19. Ya, Z.; Pei, K. Factors Influencing Agricultural Products Trade between China and Africa. Sustainability 2022, 14, 5589. [Google Scholar] [CrossRef]
  20. Zhao, X.; Sun, Z.L. Analysis of the prospects of agricultural trade between China and Ukraine in the context of “Belt and Road”. World Agric. 2021, 3, 90–99. [Google Scholar]
  21. Manitra, R.A.G. Competitiveness and trade potential of India’s dairy industry. Food Policy 2006, 31, 216–227. [Google Scholar]
  22. Zhao, M.Z. Study on the dependence of corn on the international market—Based on the comparative analysis of four food crops. J. Int. Trade 2015, 9, 109–121. [Google Scholar]
  23. Li, C.; Wang, L.Y. China’s leading Belt and Road, and other countries’ regional value chain construction: Take aquatic products export trade as an example. Macroeconomics 2018, 9, 72–84. [Google Scholar]
  24. Zhang, Y.; Zhao, L.; Chen, Y.S. Belt and Road strategy of aquatic products export trade in China: A case study of Shandong province. J. Xiamen Univ. 2018, 4, 135–144. [Google Scholar]
  25. Zhang, F.H.; Zhang, J.G.; Song, X.L.; Pang, G.J. Comparative analysis of Belt and Road, and the other countries’ export market in China and the United States. J. Agrotech. Econ. 2019, 1, 135–144. [Google Scholar]
  26. Chen, Y.W.; Li, E.L. “Belt and Road” national grain trade network spatial pattern and its evolution mechanism. Progress Geogra. 2019, 38, 1643–1654. [Google Scholar] [CrossRef]
  27. Sun, Z.L.; Jia, X.L.; Li, X.D. Belt and Road, China’s grain trade trend and the estimation of its virtual cultivated land flow. J. Huazhong Agric. Univ. 2019, 1, 24–32. [Google Scholar]
  28. Han, D.; Li, G.S.; Zhong, Y. A comparison of grain competitiveness and factors influencing grain trade between China and countries along the “Belt and Road”. J. Jiangxi Univ. Finance Econ. 2020, 4, 76–92. [Google Scholar]
  29. Han, D.; Li, G.S. Evolution of Food Trade Patterns and Influence Mechanisms between China and Countries Along the “Belt and Road”—Based on Social Networking Perspective. Issues Agric. Econ. 2020, 8, 24–40. [Google Scholar]
  30. Peng, S.G.; Zhou, Y.H. China’s export growth Belt and Road country -- from the perspective of three yuan margin. Issues Agric. Econ. 2021, 4, 132–144. [Google Scholar]
  31. Wei, S.H. China’s Agricultural Trade with “Belt and Road” Countries: Network Structure, Linkage Characteristics and Strategic Options. Issues Agric. Econ. 2018, 11, 101–113. [Google Scholar]
  32. Zhan, M.H. Belt and Road, the competition and complementarity of agricultural products trade in the countries along the belt—Based on social network analysis method. Issues Agric. Econ. 2018, 2, 103–114. [Google Scholar]
  33. Su, X.; Zhang, H. China’s Belt and Road, and other countries’ agricultural trade network structure and cooperation situation. Reform. 2019, 7, 96–110. [Google Scholar]
  34. Yang, Y.W.; Dong, W.L.; Yang, J. The evolution of agricultural trade characteristics between China and countries along the Belt and Road. Soc. Sci. 2021, 1, 67–73. [Google Scholar]
  35. Liu, Y.J.; Liu, Y.T. Evolution and optimization strategies of agricultural trade pattern between China and countries along the “Belt and Road”. Zhejiang Acad. J. 2021, 4, 113–122. [Google Scholar]
  36. Sun, Z.L.; Li, X.D.; Li, S.J. Research on intra-industry trade of agricultural products between China and countries along the Belt and Road and its influencing factors. J. Huazhong Agri. Univ. 2021, 1, 57–68+176. [Google Scholar]
  37. Li, J.; Chen, N.; Wan, G.H.; Chen, S. Belt and Road, the state of trade, the complementary relationship and dynamic change of goods trade -- Based on network analysis method. J. Manag. World 2017, 4, 10–19. [Google Scholar]
  38. Lin, D.Y.; Zhu, J. Study on the comparative advantage and import market structure of main grain varieties in China. World Econ. Stud. 2015, 2, 115–126. [Google Scholar]
  39. Zheng, L.; Song, Z.Y.; Liu, W.D.; Liu, Y. Analysis of trade pattern and trade structure in Western China. Geographical Res. 2015, 34, 1933–1942. [Google Scholar]
  40. Sun, D.S.; Su, J.X.; Li, N.H.; Zhang, L. Study on the impact of Sino US trade friction on Sino US agricultural trade structure. Issues Agric. Econ. 2021, 1, 95–106. [Google Scholar]
  41. Li, J.; Chen, S.; Wan, G.H.; Fu, C.M. Spatial correlation of China’s regional economic growth and its explanation—Based on network analysis method. Econ. Res. J. 2014, 49, 4–16. [Google Scholar]
  42. Ma, S.Z.; Ren, W.W.; Wu, G.J. Characteristics of a country’s agricultural trade network and its impact on the division of labor in the global value chain—From the perspective of social network analysis. J. Manag. World 2016, 3, 60–72. [Google Scholar]
  43. Baster, A.S.J.; Brown, A.J. Applied Economics: Aspects of the World Economy in War and Peace. Economica 1949, 16, 78. [Google Scholar] [CrossRef]
  44. Kojima, K. The Pattern of International Trade Among Advanced Countries. Hitotsubashi J. Econ. 1964, 5, 16–36. [Google Scholar]
  45. Chen, Y.S.; Chang, K.C. The relationship between a firm’s patent quality and its market value—The case of US pharmaceutical industry. Technol. Forecast. Soc. Chang. 2010, 77, 20–33. [Google Scholar] [CrossRef]
  46. Granovetter, M. Economic Action and Social Structure: The Problem of Embeddedness. Am. J. Sociol. 1985, 91, 481–510. [Google Scholar] [CrossRef]
  47. Harrison, C.W.; Scott, A.B.; Ronald, L.B. Social Structure from Multiple Networks. I. Block-models of Roles and Positions. Am. J. Sociol. 1976, 81, 730–780. [Google Scholar]
  48. Liu, J. QAP: A method to measure the relationship between “relationships”. Chin. J. Sociol. 2007, 4, 164–174. [Google Scholar]
  49. David, K.; Wilbur, I.; Smith, K.O.; John, A.C. A Gravity Model Analysis of the Benefits of Economic Integration in the Pacific Rim. J. Econ. Integra. 1999, 14, 347–367. [Google Scholar]
  50. Cemal, A.; Jun, F. Regional Blocs and Agricultural Trade Flow: The Case of ASEAN. Japan Int. Res. Cent. Agric. Sci. 2008, 42, 115–121. [Google Scholar]
  51. Liu, H.M.; Li, G.J.; Wang, K.Q. Study on Influencing Factors of international trade of Agricultural Virtual Water in China—Analysis Based on gravity model. J. Manag. World 2010, 9, 76–87. [Google Scholar]
  52. Zhong, Z.H.; Qin, C.L. Trade Network Structure of “Belt and Road” and Its Influencing Factors—A Study Based on Network Analysis Method—Based on network analysis method. Int. Econ. Trade Res. 2017, 33, 16–28. [Google Scholar]
  53. Yao, X.; Pu, Y.; Wu, G.; Wang, B.; Wang, L. China’s industrial integration and status along the “Belt and Road”: Industry comparison, regional differences and correlation factors. Econ. Res. J. 2019, 54, 172–186. [Google Scholar]
  54. Feng, L.Y.; Xu, H.L.; Wu, G.; Zhao, Y.; Xu, J.L. Exploring the structure and influence factors of trade competitive advantage network along the Belt and Road. Phys. Stat. Mech. Appl. 2020, 559. [Google Scholar] [CrossRef]
  55. Vătămănescu, E.M.; Alexandru, V.A.; Mitan, A.; Dabija, D.C. From the Deliberate Managerial Strategy towards International Business Performance: A Psychic Distance vs. Global Mindset Approach. Syst. Res. Behav. Sci. 2020, 3, 374–387. [Google Scholar] [CrossRef]
Figure 1. Product categories and regional concentration of agricultural trade.
Sustainability 14 09512 g001
Figure 2. Relative degree centrality network of the trade volume of US $10 million in 2001.
Sustainability 14 09512 g002
Figure 3. Relative degree centrality network of the trade volume of US $10 million in 2009.
Sustainability 14 09512 g003
Figure 4. Relative degree centrality network of the trade volume of US $10 million in 2013.
Sustainability 14 09512 g004
Figure 5. Relative degree centrality network of the trade volume of US $10 million in 2019.
Sustainability 14 09512 g005
Figure 6. Relative degree centrality network of the trade volume of US $100 million in 2001.
Sustainability 14 09512 g006
Figure 7. Relative degree centrality network of the trade volume of US $100 million in 2009.
Sustainability 14 09512 g007
Figure 8. Relative degree centrality network of the trade volume of US $100 million in 2013.
Sustainability 14 09512 g008
Figure 9. Relative degree centrality network of the trade volume of US $100 million in 2019.
Sustainability 14 09512 g009
Figure 10. The 2001 competition index CN = 0.7 relative degree centrality network.
Sustainability 14 09512 g010
Figure 11. The 2009 competition index CN = 0.7 relative degree centrality network.
Sustainability 14 09512 g011
Figure 12. The 2013 competition index CN = 0.7 relative degree centrality network.
Sustainability 14 09512 g012
Figure 13. The 2019 competition index CN = 0.7 relative degree centrality network.
Sustainability 14 09512 g013
Figure 14. The 2001 competition index CN = 0.8 relative degree centrality network.
Sustainability 14 09512 g014
Figure 15. The 2009 competition index CN = 0.8 relative degree centrality network.
Sustainability 14 09512 g015
Figure 16. The 2013 competition index CN = 0.8 relative degree centrality network.
Sustainability 14 09512 g016
Figure 17. The 2019 competition index CN = 0.8 relative degree centrality network.
Sustainability 14 09512 g017
Table 1. Trade structure of specific types of agricultural products.
China’s Import of Agricultural Products to B&R Countries (%)China’s Export of Agricultural Products to B&R Countries (%)
SITC200120092013201720182019SITC200120092013201720182019
0228.2817.9318.6118.3817.7615.370525.4046.0342.6847.6644.3545.82
2312.6117.1118.5223.5518.1715.07035.7912.2117.8813.8413.1413.57
057.2710.7412.0710.7812.4914.28269.196.597.136.737.286.09
429.5524.7216.4012.8211.7412.77074.514.283.544.504.835.18
0312.038.395.715.889.1212.47295.005.734.995.165.635.12
2514.746.045.327.168.227.180414.262.512.871.892.573.40
042.051.373.536.556.335.75063.423.703.383.393.563.35
263.115.549.913.032.782.61224.241.892.002.573.122.75
091.242.322.162.212.462.59082.653.472.642.813.202.66
070.710.781.211.421.752.28128.083.282.842.432.072.08
Total91.5994.9493.4491.7890.8290.37Total82.5489.6989.9590.9889.7590.02
Table 2. Regional distribution structure of agricultural trade products.
Distribution of China’s Agricultural Products Imports from B&R Countries (%)Distribution of China’s Agricultural Products Exports to B&R Countries (%)
Country200120092013201720182019Country200120092013201720182019
Thailand18.4118.0422.3824.2922.8921.01Vietnam4.6110.0412.8119.9221.5820.67
Indonesia23.2618.8917.3420.0418.6017.72Thailand4.868.9813.8513.1013.2913.60
Russia28.4622.9513.7216.9318.9716.79Malaysia16.1912.5913.9510.139.6910.87
Vietnam3.074.938.7111.2911.4910.64Indonesia12.0510.839.4710.299.709.46
Malaysia14.2019.7413.509.758.117.56Philippine6.017.127.408.438.087.51
India2.214.908.592.703.435.65Russia10.5211.4410.728.117.966.90
Ukraine0.050.071.862.603.064.93Turkey1.042.471.892.062.362.58
Philippine1.911.431.731.922.252.11Myanmar2.240.781.222.052.242.50
Laos0.130.391.461.171.431.68Bengal0.821.911.431.491.762.41
Myanmar2.081.972.371.011.071.59India8.155.163.643.172.402.25
Total93.7893.3091.6891.7091.3089.68Total66.5171.3376.3878.7679.0678.76
Table 3. Structure of agricultural product trade intensity.
China’s Agricultural Trade Intensity with B&R CountriesB&R Countries Agricultural Trade Intensity with China
Region 200120092013201720182019Region200120092013201720182019
Mongolia73.95141.87104.38125.0797.0195.84Mongolia9.105.032.563.863.553.40
Central Asia1.182.021.662.652.332.85Central Asia1.801.481.721.511.431.48
Southeast Asia1.703.273.594.844.384.85Southeast Asia2.552.382.052.682.432.49
South Asia0.931.301.001.091.061.25South Asia0.440.890.840.520.590.97
Western Asia
and Middle East
0.330.650.480.700.650.70Western Asia and Middle East0.180.100.100.200.200.33
Central and
Eastern Europe
0.030.040.030.030.030.03Central and Eastern Europe0.170.050.160.300.300.44
Table 4. Network density of 16 trade relations of China with B&R countries.
YearTrade VolumeCN IndexNetwork Density (Dn)Significant
(US $ Million)
200110 0.1785653
100 0.0404148
0.70.32211179
0.80.49751821
200910 0.28091028
100 0.1121410
0.70.35821311
0.80.53391954
201310 0.32511190
100 0.1421520
0.70.33391222
0.80.50631853
201910 0.31781163
100 0.1505551
0.70.35091284
0.80.54261986
Table 5. Network centricity of trade relations of China with B&R countries.
YearTrade Volume (US $ Million)CN
Index
Top Five Countries in Terms of Relative Degree of Centrality (De %)China
Ranking
NC (%)
Index
200110 Russia (34), China (31), India (27), Turkey (27), Saudi Arabia (24)240
100 India (13), China (10), Malaysia (10), Russia (9), Thailand (8)218.16
0.7Brunei (51), Qatar (51), Kuwait (50), Saudi Arabia (47), Bahrain (46)31 (15)54.55
0.8Afghanistan (57), Qatar (55), Kuwait (53), Saudi Arabia (52), Brunei (51)29 (29)46.58
200910 China (49), Russia (46), Turkey (44), India (38), Ukraine (37)155.11
100 Russia (30), China (22), India (21), Turkey (20), Malaysia (19)240.11
0.7Brunei (49), Iraq (48), Qatar (48), Kuwait (48), Saudi Arabia (40)11 (31)47.20
0.8Iraq (54), Brunei (54), Qatar (54), Kuwait (54), Afghanistan (50)10 (44)37.63
201310 China (54), India (46), Russia (46), Turkey (44), Thailand (41)159.1
100 Russia (35), China (29), India (29), Turkey (26), Ukraine (24)245.45
0.7Iraq (49), Qatar (49), Brunei (48), Kuwait (44), Saudi Arabia (45),10 (33)49.75
0.8Iraq (55), Kuwait (55), Qatar (55), Brunei (54), Saudi Arabia (50)11 (43)42.12
201910 China (54), Russia (49), India (47), Turkey (45), Thailand (42)159.66
100 Russia (37), China (33), Turkey (30), India (29), Ukraine (24)248.16
0.7Iraq (51), Qatar (52), Kuwait (52), Brunei (47), Saudi Arabia (42)15 (29)53.28
0.8Iraq (57), Kuwait (57), Qatar (57), Brunei (55), Maldives (51)11 (44)41.78
Table 6. Trade volume (US$ 100 million) in 2001, 2009, 2013, and 2019 between China and B&R country plates (%).
YearPlatePlate 1Plate 2Plate 3Plate 4YearPlatePlate 1Plate 2Plate 3Plate 4
2001121.602.1001.002009130.408.7003.70
22.1018.7008.60 28.707.1000.70
30000 30000
41.008.60030.00 43.700.7002.10
2013154.1012.7014.401.902019159.1020.6012.607.00
213.604.401.200 220.604.507.901.40
314.701.2014.004.90 312.907.907.807.40
42.3004.9019.70 47.001.407.4027.30
Table 7. Trade volume (CN = 0.7) in 2001, 2009, 2013, and 2019 between China and B&R country plates (%).
YearPlatePlate 1Plate 2Plate 3Plate 4YearPlatePlate 1Plate 2Plate 3Plate 4
20011038.9075.400.50200910.8031.5066.7099.70
238.904.4099.5079.10 231.500065.80
375.4099.501.8011.00 367.900010.20
40.5079.1011.200 499.0065.8010.202.20
20131040.5094.6072.002019114.1029.5086.3099.00
240.50055.200 230.0001.2056.30
396.0055.9005.90 386.301.20013.40
472.0005.900 499.0056.3012.903.30
Table 8. QAP correlation analysis results of F and influencing factors of China with B&R countries.
VariableActual Correlation CoefficientSignificance LevelMean of Correlation CoefficientStandard DeviationMinimum MaximumP ≥ 0P ≤ 0
PCWR−0.0450.0460.0010.072−0.1230.2680.9550.046
PCLA0.0430.231<0.0010.068−0.1470.2990.2310.770
SCI0.0550.184−0.0010.065−0.1380.2680.1840.816
DIS0.313<0.001<0.0010.026−0.0830.101<0.0011.000
TRA0.362<0.001<0.0010.071−0.1530.286<0.0011.000
DGDP0.2530.0020.0010.074−0.1030.2750.0020.998
DE−0.0150.4000.0010.039−0.0770.2100.6010.400
TA0.225<0.001<0.0010.051−0.1220.204<0.0011.000
CUL0.1030.012−0.0010.040−0.0900.1630.0120.989
IS−0.1070.020<0.0010.072−0.1390.2940.9800.020
Table 9. QAP regression analysis results of China with B&R countries.
VariableNormalized Regression CoefficientProbability of SignificanceP ≥ 0P ≤ 0
PCWR−0.0000020.015 **0.9860.015
DIS0.360666<0.001 ***<0.0011.000
TRA0.0539620.001 ***0.0011.000
DGDP0.00000010.4400.4400.560
TA0.1795290.001 ***0.0011.000
CUL0.0989740.036 **0.0360.965
IS−0.0009830.007 ***0.9940.007
Sample size3660R2 = 0.240Adjusted R2 = 0.238
Note: ***, ** indicate that the coefficients passed the significance tests of 1%, 5%.
Publisher’s Note: MDPI stays neutral with regard to jurisdictional claims in published maps and institutional affiliations.

